ON THE SCALING OF SMALL, HEAT SIMULATED JET NOISE MEASUREMENTS TO MODERATE SIZE EXHAUST JETS Dennis K. McLaughlin,' Penn State University, University Park, PA 16802 James Bridges,' NASA Glenn Research Center, Cleveland, OH44135 Ching-Wen Kuo3 Penn State University, University Park, PA 16802 Modern military aircraft jet engines are designed with variable geometry nozzles to provide optimum thrust in different operating conditions, depending on the flight envelope. However, the acoustic measurements for such nozzles are scarce, due to the cost involved in making full scale measurements and the lack of details about the exact geometry of these nozzles. Thus the present effort at The Pennsylvania State University and the NASA Glenn Research Center- in partnership with GE Aviation is aiming to study and characterize the acoustic field produced by supersonic jets issuing from converging-diverging military style nozzles. An equally important objective is to validate methodology for using data obtained from small and moderate scale experiments to reliably predict the most important components of full scale engine noise. The experimental results presented show reasonable agreement between small scale and moderate scale jet acoustic data, as well as between heated jets and heat-simulated ones. Unresolved issues however are identified that are currently receiving our attention, in particular the effect of the small bypass ratio airflow. Future activities will identify and test promising noise reduction techniques in an effort to predict how well such concepts will work with full scale engines in flight conditions. Nomenclature a = ambient speed of sound AR = exit-to-throat area ratio D = diameter of nozzle at exit plane D j = diameter of the jet plume f = frequency f, = characteristic frequency U /DJ M„ = acoustic Mach number U, /a, M d = design Mach number of the nozzle M = average Mach number of the frilly expanded jet NPR = nozzle pressure ratio OASPL = overall sound pressure level R = physical distance of the microphones from the jet exit Ali = gas constant R e = Reynolds number ' Professor; Department of Aerospace Engineering, AIAA Fellow- 2 Senior Research Scientist, NASA Glenn Research Center, Senior Member AIAA. s Graduate Research Assistant, Department of Aerospace Engineering, AIAA Student Member. American Institute of Aeronautics and Astronautics https://ntrs.nasa.gov/search.jsp?R=20100040709 2018-08-02T12:49:57+00:00Z
Transcript
ON THE SCALING OF SMALL, HEAT SIMULATED JETNOISE MEASUREMENTS TO MODERATE SIZE
EXHAUST JETS
Dennis K. McLaughlin,'Penn State University, University Park, PA 16802
James Bridges,'NASA Glenn Research Center, Cleveland, OH44135
Ching-Wen Kuo3Penn State University, University Park, PA 16802
Modern military aircraft jet engines are designed with variable geometry nozzles to provideoptimum thrust in different operating conditions, depending on the flight envelope.However, the acoustic measurements for such nozzles are scarce, due to the cost involved inmaking full scale measurements and the lack of details about the exact geometry of thesenozzles. Thus the present effort at The Pennsylvania State University and the NASA GlennResearch Center- in partnership with GE Aviation is aiming to study and characterize theacoustic field produced by supersonic jets issuing from converging-diverging military stylenozzles. An equally important objective is to validate methodology for using data obtainedfrom small and moderate scale experiments to reliably predict the most importantcomponents of full scale engine noise. The experimental results presented show reasonableagreement between small scale and moderate scale jet acoustic data, as well as betweenheated jets and heat-simulated ones. Unresolved issues however are identified that arecurrently receiving our attention, in particular the effect of the small bypass ratio airflow.Future activities will identify and test promising noise reduction techniques in an effort topredict how well such concepts will work with full scale engines in flight conditions.
Nomenclature
a = ambient speed of soundAR = exit-to-throat area ratioD = diameter of nozzle at exit planeDj = diameter of the jet plumef = frequencyf, = characteristic frequency U /DJM„ = acoustic Mach number U, /a,Md = design Mach number of the nozzleM = average Mach number of the frilly expanded jetNPR = nozzle pressure ratioOASPL = overall sound pressure levelR = physical distance of the microphones from the jet exitAli = gas constant
Re = Reynolds number
' Professor; Department of Aerospace Engineering, AIAA Fellow-2 Senior Research Scientist, NASA Glenn Research Center, Senior Member AIAA.s Graduate Research Assistant, Department of Aerospace Engineering, AIAA Student Member.
American Institute of Aeronautics and Astronautics
`H^ = ambient gas constantPSD = power spectral densityL = ambient temperatureL = jet stagnation temperatureTTR = total temperature ratio, To /T_St = Strouhal numberU = mean exhaust velocityX = physical downstream distance from the nozzle exit planey = physical parallel distance from the jet centerlineif = frequency resolution bandwidthP = densityB = polar angle, measured from the jet downstream direction
Subscripts:heated quantity relative to the heated jet
quantity relative to the jetraw : as measured
I. Introduction
As the engine power of airplanes rises and the frequency of aircraft operations increases, environmental laws arebecoming more stringent. While jet noise is not the dominant contributor to the total civilian aircraft noise it oncewas, it is still a major contributor. Jet noise is the major noise source for military aircraft that have engines of verylow bypass ratio and high exit flow temperatures and velocities. The resulting noise poses a health threat to groundcrews as well as causes an annoyance to communities in the vicinity of military airbases. Noise control andmonitoring for both civil and military airplanes are also growing. Because practical aircraft engine measurementsare very time consuming and subject to large uncertainties, there is stron g interest in developing more accurate smallor moderate model scale experiments which can be conducted in more controlled environments. Clearly it is muchcheaper to develop jet noise reduction technologies on small-scale rigs than full-scale engines. However,experimental consistency between model scale and actual engine radiated noise measurements has yet to be fullydemonstrated.
This study is part of an effort led by The Pennsylvania State University and the NASA Glenn ResearchCenter (GRC) with partner GE Aviation. The aim of this study was to validate the methodology for using dataobtained from testing at small and moderate scale, supported by computations, to reliably predict the full scaleengine noise. The approach was to conduct and compare small scale and moderate scale experiments with nozzlesrepresentative of military jet engine exhaust nozzles. Comparisons across scales with data obtained in differentfacilities will provide confidence in the quality of the measurements perforned, and in the ability of themethodology to extrapolate the subscale data to the full size aircraft. This paper focuses on making extensivecomparisons between small scale measurements performed at Penn State and moderate scale data gathered at NASAGRC, in order to determine whether the small scale and heat simulated jets can accurately simulate the acousticsissuing from moderate scale hot jets. A similar study was conducted by Viswanathan [1] that presented the resultsof numerous comparisons of moderate size (predominantly) subsonic jets' acoustic measurements. Additionally thiswork showed comparisons of model supersonic jet acoustic experiments with those of a turbojet engine with anacoustically treated duct between the turbomachinery and the exhaust nozzle. These comparisons showed favorableagreement for both subsonic and supersonic jet flows.
The experiments were performed in two laboratories: the Jet Noise Laboratory at Penn State University andthe AeroAcoustic Propulsion Laboratory at NASA GRC. The High Flow Jet Exit Rig (HFJER) at NASA GRC isone of the largest such facilities in the country. Supersonic air jets with exit diameters of approximately 10 cm areconunonly used with jet Mach numbers up to M = 1.7 and stagnation temperatures exceeding three times standardambient temperature. The NASA GRC large anechoic geodesic hemispherical dome has a radius of approximately20 meters. The small scale experiments were performed in the Jet Noise Laboratory at Perin State, with its universitysize anechoic chamber (with dimensions of 5 x 6 x 2.8 meters). Typical supersonic jet nozzles of exit diametersfrom 2 to 2.5 cm that operate at pressure ratios up to 4.5 producing exit Mach numbers up to M = 1.7. This facilitydoes not include jet heating capability. Instead helium-air mixture jets are used to simulate hot jets. Appropriatemixtures of helium-air can be made to have the desired acoustic velocity of heated jets. When operated at the same
American Institute of Aeronautics and Astronautics
pressure ratio of heated air jets, the elevated acoustic velocities also have proportionally increased jet velocities. Itis this property that the radiated noise best correlates with. Doty and McLaughlin [2] and Papamoschou [3] haveshown that mixtures of h IMI and air can be used to simulate the flow and acoustic properties of hot jets with avery high degree of accuracy.
II. Experimental Facilities, Set-Up, and Procedure
A. Penn State facility and instrumentation
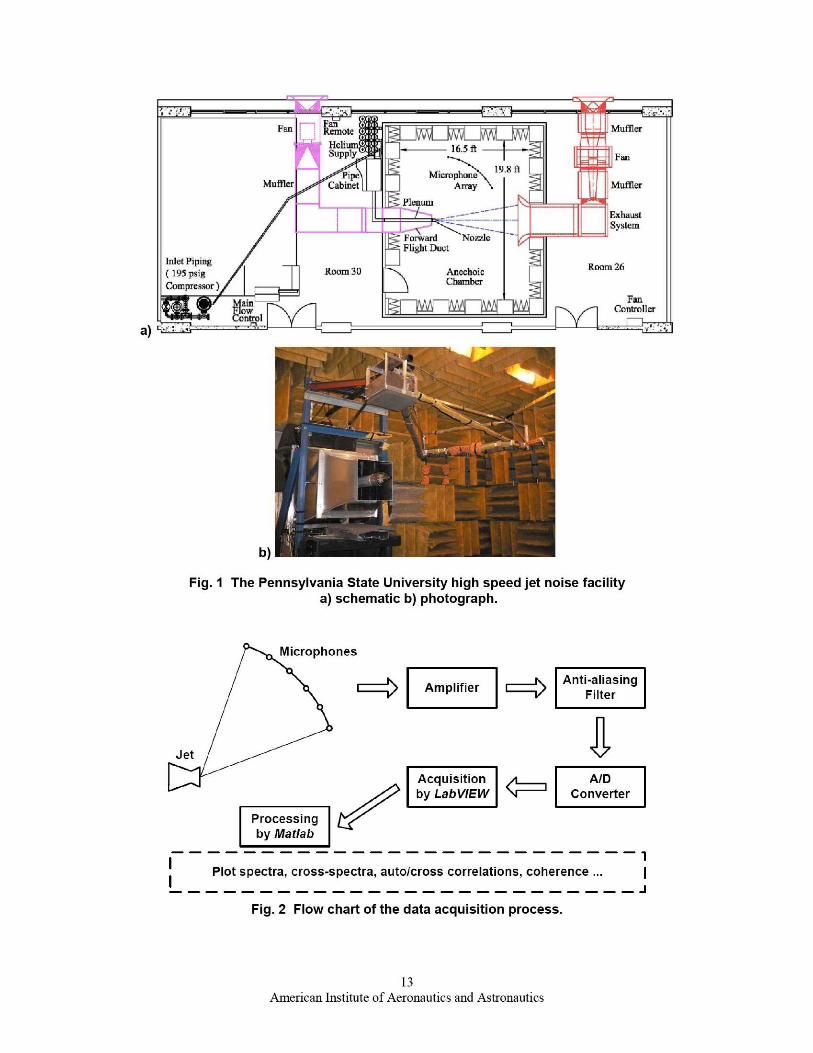
The Pennsylvania State University high speed small scale jet noise facility was used for the small scale experimentspresented in the current study. The facility schematic is shown in Fig. la. High pressure air, pressurized by a CS-121 compressor combined with a K4D-370 air dryer both manufactured by Kaeser Compressors, is provided fromthe tank, and then the air flow is regulated via pressure regulators and control valves located in a piping cabinetbefore being fed to a plenum and delivered to the jet nozzle issuing into the anechoic chamber. A pitot probe isembedded in the muddle section of the plenum to provide, via a pressure transducer, the total pressure upstream ofthe nozzle. The helium supply piping is connected to the piping cabinet to provide the helium-air mixture jets inorder to simulate the heated jets. The individually partial pressures of the helium and air are both regulated in thepiping cabinet. This operating procedure was demonstrated and developed by Doty and McLau ghlin [2] over 10years ago. The anechoic chamber walls are covered with fiberglass wedges and it has an approximate cut-offfrequency of 250 Hz. An exhaust collector and fan on the opposite wall of the plenum in the anechoic chamberprevents flow circulation and possible helium accumulation.
Acoustic measurements are currently performed using six microphones, hanging from a boom that extendsfrom the plenum stand; as can be seen in the image of Fig. lb. The microphone array is set and aimed to freelyrotate around a point located at the center of the nozzle exit plane. The microphones are positioned at a grazingincidence to the jet centerline and equally spaced by 10 degrees. The averaged physical radial distance ofnucrophones to the nozzle exit is around 1.78 in in). This distance is appropriate enough for the microphones tobe considered in the far field when testing nozzles less than 2.5 cm (1 in) in diameter operated in this facility. Themicrophones are 1/8" pressure-field microphones selected to match the testing nozzles operated at the small scalefacility, type 4138 from B)-iiel and Kjaer (B&K), and type 40DP from GRAS. Following calibration corrections theacoustic data have a frequency response reliably accurate to 120 kHz. This is adequate to define the acousticfrequencies most important to noise studies including those approximately a factor of 10 higher than the peakfrequencies in the maximum noise emission direction. The range is not adequate to fully define the noise spectra tothe hi ghest non-dimensional frequencies that are typically much less important in supersonic aircraft noise. Theacoustic measurements were performed from polar angle 0 = 30° to 0 = 120° measured from the jet downstreamdirection ori ginated from the nozzle exit plane, with increments of 10 degrees. The schematic of the Penn State dataacquisition process is shown in Fig. 2. The microphone calibration is performed with a B&K acoustic calibrator.model 4231, and the microphone calibration constants are recorded to provide the conversion from the measuredvoltages to the equivalent pressure. The analog time-domain signals from the microphones are routed through aNexus, B&K si gnal conditioner or a GRAS model 12AN power module and then amplified and filtered for anti-aliasing thus enabling their accurate digital conversion in the following acquisition. A high-pass filter is also set to500 Hz, removin g any undesirable low frequency noise that could contaminate the data. A PCI-6123 NationalInstruments DAQ board is installed in the operating computer acquiring the time domain data stored in binary files.The data acquisition and storing is accomplished with LabVIEW software. The sampling rate is set at 300 kHz forthe data acquisition and 102,400 to 409,600 data point are collected, the reduced data set being used for helium-airmixture jets in order to reduce the amount of helium used during an experiment. The raw data are then fed intoMatlab for the data processing. The raw data are sequentially split into 1024 or 4096 points segments and aHarming window function is applied with 50 percent overlap between each window. The Fast Fourier Transform(FFT) is calculated in each window and the value is averaged from the 199 segments. This yields the power spectraldensity (PSD) which is then converted to decibels (dB) using a reference pressure of 20 pPa.
B. NASA GRC facility and instrumentation
Comparisons are presented in this study with acoustic measurements from similar nozzles at a larger scale acquiredat the NASA GRC AeroAcoustic Propulsion Laboratory with the high flow jet exit rig (HFJER) as shown in Fig. 3.This facility has a hot jet acoustic rig located in the anechoic geodesic hemispherical dome noted earlier. Jetdiameters up to 12.7 cm (5 in) are typically used in this facility for supersonic applications, with the capability to use
American Institute of Aeronautics and Astronautics
a co-flow to simulate jets with a small bypass ratio according to the design evolution of modern military engine.The facility can be operated in a single-flow mode as well as a dual-flow mode. When in the dual-flow mode thepressure in both the annular and the core section of the plenum are set to the same value; however, the annular flowwas unheated when performing hot jet measurements. A schematic diagram of this dual flow set-up is shown in Fig.4. For the experiments reported in this paper, the cold bypass air comprised 30% of the core flow, a value that isroughly what is used in turbojet engines on today's military fighter aircraft. The total temperature ratio of the jets isexpressed in terms of the core flow total temperature TTR, o,.e, or the total temperature of the flow after it is(hypothetically) hilly mixed, TTR,,,;,. Extensive description and qualification measurements of this facility can befound in Bridges and Brown [4]. Because the pressure upstream of the nozzle throat in the bypass stream is thesame as in the core flow, a reasonable assumption is that the exit Mach numbers of both streams is the same, whilethe TTR of the annular stream is --- 1. An arc of microphones with radius approximately 15 in ft) is mountedinside the top of the dome with 24 microphones separated by 5 degree increments.
In addition to the dual flow jet facility, a small hot jet acoustic rig (SHJAR) [5] also located in theAeroAcoustic Propulsion Laboratory, provided additional single stream hot jet measurements for the current studies.This rig utilizes a microphone arc with 24 microphones separated by 5 degree increments at a radius of 2.5 inin). The nozzle exit diameter used for this rig is 5.08 cm (2 in), thus RID = 50 for these experiments.
In both NASA rigs the microphones were &tiel and Kjaer 1/S" microphones (model 4939 with a B&KModel 2670 preamp), used without grid caps for maximally flat response and pointed at the nozzle exit. Brnel &Kjaer NextrSTM amplifiers provided the signal conditioning. A DataMAXG` Instrumentation Recorder, from RCElectronics, simultaneously recorded data from all microphones, using a 90 kHz low-pass filter to limit thebandwidth (at 200 kHz sample rate). Eight seconds of data were recorded at each point. Jet flow conditions wererecorded during the acoustic data acquisition using a facility computer. Variables such as rig temperatures,pressures, and mass flows, as well as ambient temperature, pressure, and humidity were averaged over the same timethat the acoustic record was recorded. The facility data were imported, along with the raw acoustic time series files,into a Litnix processing workstation for processing. The processing steps mirror those of PSU facility. Recordedtime series were multiplied by amplification factors from the variable gain Nexits signal conditioners and by thecalibration factor determined by in situ recording of the Bmel and Kjaer model 4220 pistonphone. Fouriertransforms were computed using FFT algorithms and 10 th order Kaiser-Bessel windowing on 16384-point recordswith 50% overlapping. Power spectral density estimates were created by averaging all 19.5 transforms and addingback windowing losses, and the resulting PSD were converted to decibels relative to 20µPa. Background noise,measured immediately before the data set was acquired, was subtracted and any frequency band within 3 dB of thebackground was flagged and was not considered in future processin g and final plotting.
C. Data processing and comparison procedure
In both PSU and NASA processing systems, three corrections are applied to the raw PSD to compute the normalized,lossless PSD. Data were corrected for microphone spectral response characteristics based on the manufacturer'sdocumentation of each individual microphone obtained during factory calibration ( ACact(Hz) ) includingappropriate free-field response ( ACff(Hz) ). The spectra were corrected for daily variations in atmosphericattenuation by calculating the attenuation (ISO 9613-2:1996) for each microphone using measured ambientpressures, humidities, and temperatures ( ACatn,(Hz) ) and adding back the sound lost due to atmospheric attenuationfrom the jet to the microphone. Finally, the spectra are non-dimensionalized to PSD per Strouhal number(10 x logio fc ). The Strouhal number is defined as St =f If, ,with f, the characteristic frequency of the jet definedby f, = Uj I Dj, where Uj is the jet velocity, and Dj is the fully expanded diameter of the jet. Eq. (1) summarizes thedifferent steps that lead to the PSD per unit Strouhal number as explained in Kuo, Veltin and McLaughlin [6].
From the PSD, given at intervals of Af, the OASPL is calculated via the following equation:(PSD(Hz))^PSD(St)^
OASPL =101oglo AHzy10 10 = 1010glo ASt^ 10 10
(2)
American Institute of Aeronautics and Astronautics
The experimental data were processed into lossless spectra per unit Strouhal number to make comparisoneasier across scales. Most measurements were made at distances close to R,.a,,, = 100 D or 144 D depending on thenozzle diameter. Following processin g, the resultin g data were (back) propagated to R = 100 D assuming sphericalspreading of the acoustic field to allow direct comparison of data at a common observer distance. This "back"propagated PSD is detennined from
PSD(St) = PSD(St)+20logio(l,, /R)
(3)
D. Heated jet simulation
The density characteristics of heated jets are replicated using gas mixtures in order to produce acousticmeasurements in cold small scale facilities that can be directly compared to hot moderate scale experiments or actualaircraft engine measurements. Doty and McLaughlin [2] and Papamoschou [3] have shown that mixtures of heliumand air can appropriately simulate the noise of heated jets to a reasonable accuracy by matching density of theheated gas. The features of heated jets are lowered density and increased velocity relative to the speed of sound, andboth of these features can be achieved by helium-air mixture jets. However, both parameters, the acoustic velocity aand the density pj cannot be precisely matched simultaneously. Thus, two independent methods were developed tomatch either the density pj or the acoustic velocity a from the heated jets. Although there are two matching methodsin heated jet simulation, both methods generate very close results. Two matching methods were introduced by Dotyand McLaughlin [2] and are briefly described below.
The first methodology consists in matching the acoustic velocity between a helium-air mixture and acorresponding hot air jet.
pheated — / Tj H pnlix — ymirmixTj nlir (4)
and dependent on the helium concentration. The proper molar mass of helium can easily be
calculated in order to equate aheated and a,,, ix . From there, the partial pressure of helium and air can be computed andthe pressure regulators adjusted for the experiment.
The second method consists in matching the density between a heated jet and a helium-air mixture jet, asshown below.
PJ = Tv
<—>
PJ mix T- d
Px' heated TJ heated P^ T1 mix mix
_ 91" [1+ )"" i. —I m 2 J 5
nvix 2 (' )The molar mass of helium required to equate pj n,;Y with pj can be calculated, and from it the partial pressure ofhelium is once again derived. The two matching methods typically lead to slightly different values for the partialpressures of the mixture. However, as mentioned, experimental results [2, 3] showed that the two methods result inacoustic spectra in agreement within 1 dB across the spectra, and all data presented here uses the acoustic velocitymatching method.
E. Model geometry of military style supersonic nozzle
Besides the experimental results from contoured converging-diverging (CD) nozzle, this study presents theexperimental results conducted with the military style nozzles representative of the exhaust of aircraft engines of theF404 family. The exact inner contours of these military style nozzles are the property of General Electric and wereprovided under an ongoing contract for the Strategic Environmental Research and Development Program (SERDP).While such military engines possess nozzles with variable geometry, adapting to different flight regimes, for thisspecific research, three nozzles with different exit-to-throat area ratios were used, as specified by GE Aviation.These nozzles were designed with a multi-faceted inside conical contour. At Penn State, the nozzles were fabricatedvia a rapid prototyping technique (stereo lithography); meanwhile, the nozzles of identical inner geometry but seventimes larger, built by GE Aviation, were tested at NASA GRC for the moderate scale experiments. These militarystyle supersonic nozzles (GE nozzles) were built with the identical inner geometry at small and moderate scale todemonstrate the scaling of small heat simulated jets to moderate and full size jets (although no full-scale data arepresented in this paper). More details about these military style supersonic nozzles can be found in Kuo et al. [7].In general, the expansion portion of the flow contour consists of 12 flat segments that are interleaved to facilitate
y1i17
American Institute of Aeronautics and Astronautics
area adjustment of the operational nozzles. Unlike well designed contoured CD nozzles, imperfections at the nozzleexit plane contain weak shock cells, even at perfectly balanced pressure conditions.
III. Experimental ResultsThe operating conditions of the data acquired both at Penn State and at NASA GRC are summarized in Table 1. Inthis table, the.] et Mach number Mj relates to the average Mach number of the frilly expanded jets and the nozzle totaltemperature ratio (TTR) is the ratio of the jet stagnation temperature To and the ambient temperature T.. For the datafrom NASA GRC, when operating the dual flow rig, the values in the column of TTR are accordingly the values ofTTR,,,, where the subscript core relates to the quantities relative to the core flow and TTR,,, ix where the subscript mixrelates to the quantities relative to the nurture of the annular and core flow. The values of Reynolds number in thistable were computed based on the calculation methodology described by Doty and McLaughlin [2]. As a first step,comparisons were made between cold; pure air jet measurements obtained at Penn State with similar measurementsfrom NASA GRC. Then; the heat simulated small scale results are compared to the moderate scale hot jetmeasurements provided by NASA GRC, with discussions of the results included.
A. Unheated jets measurements
First, comparisons are made between acoustic spectra from cold jets, between small scale measurements acquired atPerri State and moderate scale measurements from NASA GRC. This allows for a direct cross-scale comparison,from jets issuing from nozzles of different sizes but exactly the same geometry, without adding the complication ofthe heat simulation. Sample spectra are shown in Figs. 5 and 6 from two testing nozzles: both jets are operated witha pressure ratio NPR = 4, one of them issuing from the Afd = 1.65 (AR = 1.295) GE nozzle, and the other from the Md
= 1.5 (AR = 1.18) GE nozzle. The convention adopted here is that Md is calculated from the known area ratioassuming the Mach number that would be achieved with ideal quasi parallel flow that has been expanded throughthe given area ratio. In the figure, the Penn State data were acquired with nozzles 1.8 cm (0.7 in) in diameter, and theNASA GRC spectra were acquired at with nozzles 7 times larger. The spectra are spaced apart in pairs by 20 dB forclear elucidation as the polar angle varies and all acoustic levels have been scaled to RID = 100 assuming far fieldspherical spreading. From both figures the cross-scale spectra comparison exhibits very encouraging results, withspectra from the two rigs agreeing within +/- 2 dB over frequencies 0.05 < St < 4 and angles 30° < B < 120° asmeasured from the exhaust axis. The OASPL comparisons consistently present good agreement within 2 dBvariance across the polar angles. It is noted that this agreement is obtained for jet noise spectra containing not onlyjet mixing noise, but also significant broadband shock noise from jets operating in the over- and under-expandedconditions. This degree of agreement between the data acquired from the two facilities provides a check on thescaling methodolo gy, and validates the quality of cold jet measurements acquired from both facilities. This is anencouraging comparison which validates the potential to develop noise reduction concepts in small scale jets thataccurately simulate the acoustics issuing from the actual engine exhausts.
Closer inspection of the details of the small scale nozzles used in conducting the experiments at Perri Stateshows that the internal nozzle surface is slightly rougher at this scale level in comparison with the moderate scalenozzle. The lip thickness is also not exactly reproduced, due to the limitations of the rapid prototyping techniqueand the brittleness of the material used. Therefore, the thickness of the boundary layer at the exit plane of the nozzlemay not scale perfectly with the moderate scale measurements. In spite of these differences, the comparisons arevery good. This observation is in agreement with a previous study from Viswanathan [8] who validated the effect ofthe state of the flow at the nozzle exit plane. The conclusion from that study was that the radiated noise isinsensitive to the state of the flow and the thickness of the boundary layer at the nozzle exit plane, provided theReynolds number of the jet flow exceeds approximately 400;000.
The current comparisons of unheated jet measurements were conducted in the geometric far field, withsound measurements being made well over 100 jet diameters from the nozzle. The term `geometric far-field' is usedwhen the noise is approximated by a point source causing the noise to radiate spherically so the sound intensity isreduced by 6 dB for per doubling of distance from the noise source. By maintainin g the far field measurements intreating the noise as a compact point source emitting from the nozzle exit plane, the experimental results can beextrapolated to various non-dimensional distances for comparisons as is commonly done (see Ref 9, 10, 11). Thisissue is of particular importance when working with supersonic jets, as will be covered later.
The data in Figs. 5 and 6 are representative of similar spectra recorded with numerous pressure ratioconditions. Such results show that the small scale jets approximately replicate the acoustics issuing from themoderate scale jets under over-expanded and under-expanded conditions. Moreover, the demonstration of the cross-
American Institute of Aeronautics and Astronautics
scale comparison from the unheated jet experiments, measured in the far field, that the small scale unheatedjets have been able to simulate the acoustic field generated by moderate scale unheated jets. This is an encouragingfirst step in making cross-scale comparisons with the heated jet measurements.
B. Heat simulated jets and heated jets measurements
The heat simulated jet experiments were conducted with helium-air mixture jets at Penn State, following themethodology established during previous studies [2, 3]. Figure 7 shows acoustic spectra measured with the GEnozzles with AR = 1.295 conducted with single stream jets at both Penn State and NASA GRC. The data recordedusing the Ma = 1.65 (AR = 1.295) GE nozzle operating at a pressure ratio of NPR = 3.0 produces an average exitMach number M = 1.36, and the simulated temperature ratio TTR = 2.6 for Penn State and TTR = 2.5 for NASA.All acoustic levels have been adjusted to RID = 100 as in Figs. 5 and 6.
As in the case of the cold jets, the acoustic data for the small scale experiments compare favorably with theNASA moderate scale data across the frequency range. The individual PSD components are always within 3 dB forboth sets of data and most spectral components agree within 2 dB.
The above demonstrations distinctly show that the small heat-simulated jet is capable of reproducing theacoustics issuing from a moderate size heated jet when the precise simulated properties are matched for the over-expanded CD nozzles, which are prevalent in practical supersonic aircraft. These data (and many other comparisonsnot shown here), show that the scaling of small heat simulated jets measurements are in reasonable agreementprovided that comparisons are made in the far field past RID = 100, with identical nozzles ; and with matching Machnumber and total temperature ratio. In this context "reasonable agreement" can be quantified to state that agreementof individual portions of the spectra agrees within 2 to 3 dB and the overall sound pressure levels agree within 2 dB.
C. Small unheated bleed flow effect on the noise emission
The most common configuration for the NASA HFJER is with co-annular dual flow with a very low bypass ratio(BPR = 0.3) of unheated air. Such a configuration consists of a core flow surrounded by a thin annulus of cold air,whose initial thickness is less than 10% of the core radius (shown schematically in Fig. 4). This configuuration ofnozzle is reasonably close to actual supersonic aircraft engines in which the annular fan flow plays a major role incooling liner components of the engine. It does however introduce some uncertainty in how best to match these lowBPR exhaust jet acoustic experiments to single stream model jets for which a considerable amount of acoustic dataare available. The experiments producing acoustic spectra are plotted in Fig. 8 as a head-to-head single flow versusdual flow acoustic data comparison.
First, the HFJER was operated both as single stream' et and in its standard configuration as a dual flow rigwith a GE design nozzle with Md = 1.5. Figure 8 compares data from the same facility when the single stream TTRmatched the core flow total temperature TTR,,,,, (= 3.2) and also when it matched to a hypothetical nixed flowtemperature ratio TTR,,,;, (= 2.7) that assumes the core and cold annular flow to be fully mixed. As noted earlier, thebypass ratio was 0.3 in the dual flow experiment. In Fig. 8 the difference between the two single-stream jet noisecurves is roughly 3 dB for frequencies below the peak, in line with expectations from increasing jet velocity withincreased temperature. The temperature change also affects the shift in peak frequency in the data in the aftquadrant and there is some difference in the high frequency roll off such that the colder jet produces more highfrequency noise at shallow aft angles, but less high frequency noise on the sideline. It is believed that theexplanation for this is the rotation of the peak noise emission direction toward steeper angles from the jet (andfurther from the jet axis) for the hotter single stream jet. The dual stream noise spectra generally lies between thetwo single jet curves at low frequencies and follows the higher temperature (core conditions) single jet at highfrequencies. For this realistic CD nozzle geometry operating in an over-expanded condition matching the coreconditions seems to produce the best match to the more realistic dual stream data.
Having quantified the error in simulating a low-bypass ratio practical CD nozzle with a sin gle-stream jet,the next step is to add the effect of scale. The small-scale rig at Penn State was nun in a similar fashion, with twototal temperature values that match first the correspondin g HFJER TTR,,,, and second, the TTR,,& value. The resultsare plotted in Fig. 9. Note that this case uses a slightly different nozzle than Fig. 8, with a Md = 1.65; however, bothcases are the faceted CD nozzles operating at the over-expanded condition. Here, the jet noise from the two single-stream jets at small scale differ by as much as 5 dB at low frequencies, more than did the same cases in the larger rig.Here the single stream (PSU jet), nun at simulated temperatures matching the dual flow ftilly mixed temperaturecondition produced better agreement with the dual stream data at low frequencies. At hi gher frequencies and aftangles, the single-stream jet matching the core conditions of the dual stream jet best agreed with the dual stream jet,
American Institute of Aeronautics and Astronautics
in the same way as the medium scale experiment did. It is noted that both the Penn State and the GRC data haveshock screech components at virtually identical frequencies that are quite close in spectral level, assurin g that theshock structure and details of the shock noise are well represented across the model scales (and with differentmethods of obtaining a "heated jet"). However, it can be concluded that there are imperfections in the matching ofacoustic data between single stream and dual stream (BPR = 0.3) jets at frequencies below the peak frequency nomatter what matching condition is used.
D. Confirming experiments
As an additional test of the validity of the Penn State data, comparisons have been conducted with a different dataset, namely heated supersonic jet acoustic data measured by Seiner and Norum at the NASA Langley ResearchCenter (LaRC) [12]. To do this requires that a more common nozzle geometry be used, a convergent-divergentnozzle with a contoured divergent section designed using the method of characteristics to be shock-free at its exit atM = 1.5. Making this change also removes shock-associated noise from the comparison. In this case the LaRCexperiments were conducted with a 4.27 cm (1.68 in) exit diameter ideally contoured axisymmetric CD nozzleoperating ideally expanded at a NPR = 3.6 and TTR = 2.25. The Penn State experiments used a 12.5 mm (0.5 in)exit diameter contoured axisymmetric CD nozzle operating at a NPR = 3.6 and TTR = 2.2. The spectral comparisonsare shown in Fig. 10, with the data agreeing across the spectra for 90° and 100° to within +/- 1.5 dB. The biggestdiscrepancy in the data, of 4 dB at the peak frequency and 60° polar angle, can be partially accounted for by thedifferences in the RID location of the two data sets. As noted earlier, when the distance to the microphones isdifferent between two experiments, differences in spectral level are often most apparent at polar angles around 50 to60° where the gradient in OASPL with polar angle is the greatest. At the most aft angle shown (40°), the PSU dataare less than 3 dB below the LaRC data.
Continuin g with the approach of comparing acoustic data acquired at different facilities, Fig. 11 presents acomparison of the LaRC single jet data shown in Fig. 10 with those of GRC HFJER run in both single-flow (TTR =2.25) and dual-flow (TTR,,,;, = 2.25) modes using a contoured axisymmetric CD nozzle with Md = 1.5. The firstobservation is that for this ideally expanded flow, operation of the GRC HFJER facility in the dual flow modeproduces spectra that more closely match the smaller LaRC facility jet spectra than do the spectra in the sin gle jetmode. All three jet data sets a gree well at the broadside angles of 100° and 90°. By 60° there appears a systematicdiscrepancy in levels at frequencies below the peak, where the smaller rig produces more noise than the larger rig.At angles aft of 60° the GRC HFJER data are lower than the LaRC data by increasing amounts, being 5 dB differentat 40° to the jet axis. At this point it is noted that the feature of higher noise levels at low frequencies for the smallerrigs is consistently present in the data of Figs. 7, 9 and 11. This feature will be addressed further later in this sectionof the text.
One other major feature has been present in these datasets that merits attention: the higher frequencies atwhich the HFJER data show a very strong rise (an upward "hook"). This sharp rise is not visible in raw data, butresults from performing the atmospheric attenuation correction to obtain "lossless" data. Such a rise is slightlyapparent in both the Penn State and the LaRC data, both of which are not resolved to the same high non-dimensionalfrequency as is the GRC data. This feature is most significant at the angles of strongest noise emission, e.g., aftangles, and typically appears at supersonic. hot jet conditions, as discussed in Ref. [13]. The physical explanationseems to be the presence of strong nonlinear distortion that is present in very high amplitude noise that is undergoingwave steepening (as discussed in several references, for example Ref. [13]). It appears from the data presented here,and much more which was not presented, that the increase in sound amplitude in absolute terms going from the --50nun (2") nozzles to --100 min (4") nozzles is sufficient to cause the onset of nonlinear propagation within the samerelative measurement distance.
It is noted that the rising spectral "hook" mentioned in the preceding paragraph is not seen in the Penn Statedata of Figs. 7 and 9. In both those data sets the small scale data agree with the moderate scale NASA data quitewell but do not extend in frequency resolution to the point where the lossless spectral content begins to rise. Themicrophones response limited the resolution. An experiment was conducted at Penn State however, in which themicrophones were placed 280 jet diameters from the nozzle exit over the range of polar angles. The data, presentedin Fig. 12, show an almost identical shape as the moderate scale data, just shifted to a lower frequency. Such a shiftin the location to the onset of the nonlinear distortion is consistent with the discussion presented by Petitjean et al.[13] on the onset of such effects. Additionally Saxena et al. [14] and Lee et al. [15] have developed a nonlinearpropagation computational model that predicts the general high frequency lift-up feature that is seen in the data ofFig. 12. In summary, nonlinear propagation effects require the initially very high sound pressure levels, long
American Institute of Aeronautics and Astronautics
propagation ranges within the facility, resolution of the frequency spectra to hi gh frequencies and finally, properlyapplied correction of the spectra to remove the effect of atmospheric attenuation (to produce lossless data).
To surmnarize the results of the comparisons made with the data presented in Figs. 7 to 10 it is apparentthat there is consistency between the single stream Penn State and LaRC data operating at similar jet mean flow(including TTR) conditions with an ideally expanded, shock-free jet flow. For realistic nozzle models running over-expanded conditions, the Penn State and GRC data match well when both are operated in single-stream mode withthe following exceptions. For ideally expanded nozzles, the larger GRC nozzle exhibited a significantly lower noisein the low frequency range (below the peak frequency) at aft angles, than the smaller single-flow rigs. In usingsingle-flow rigs to simulate low bypass ratio jet flows there is a choice to be made whether to match the coreconditions or the fully mixed conditions. For the over-expanded realistic nozzle flows, there is a significant impactof the bypass flow. For the ideally expanded shock-free nozzle at M = 1.5 there was little impact of the cold bypassstream at this bypass ratio of 03. However, the larger rig produced data that were slightly but measurably lowerthan the smaller rigs for this nozzle. At present these contradictions are unresolved.
At this point it is appropriate to mention the possibility that the annular co-flow that surrounds the core jetcould serve to eliminate or reduce the Mach wave radiation as explained by Papamoschou [16]. If the parameters ofthe annular flow were assumed to be retained following convection through the nozzle, the convection velocity ofthe turbulence on the outer shear layer would be reduced to below the ambient acoustic velocity thus eliminatingMach wave radiation. It seems rather unlikely that such could be the case in precisely the manner suggested byPapamoschou. It is anticipated that the annular co-flow, which starts upstream of the nozzle throat, would becomemostly mixed with the core flow, at least in the outer portion of the jet at the exit of the jet. Thus the criteria used byPapamoschou to predict the parameters for Mach wave elimination are likely not to be satisfied. The outer shearlayer however, will certainly be affected, resulting in reduced levels of mean shear which would be expected toslightly reduce the radiated noise, a result that is consistent with observed data.
One focus of future experiments will be to examine the effect of the thin layer of cold air surrounding thehot jet in the dual flow experiments. Recognizing that there remains an unresolved contradiction in the best way tomatch TTR operating conditions when comparing the acoustic data of the dual flow facility with those from thesingle flow facility, one notices a previously unmentioned issue. The hot jets that compared well using the TTR,,,,were all conducted at a Reynolds number of 2 million or greater. The jets that compared well with the HFJERTTR,,11z were all at & < 900,000. Although it is premature to draw a definitive conclusion, the lower Reynoldsnumber jet data have a very similar additional noise component that was identified by Viswanathan [17] withheated subsonic jets at M= 0.7. This issue is being addressed with additional experiments and data processing.
E. Near field / Far field measurement issues
During the process of comparing acoustic data acquired in experiments with different scale nozzles it is quite easy toget sidetracked examining data in which not every physical parameter was maintained constant that needed to be.One such example is the microphone radial location during experiments with nozzles of two scales. There isconsiderable experience with cold jets to conclude that if the microphone(s) are positioned 50 to 70 radii away froma jet (exit plane) then good accuracy can be obtained using the 6 dB per doubling of distance to scale acousticamplitude levels to a connnon radius. Such is not the case with hot supersonic jets. Two examples of this effect inthe acoustic spectra are shown in Figs. 13 and 14.
Figure 13 shows spectra of acoustic measurements performed (at Penn State) in the acoustic field of twosupersonic jets exiting from CD nozzles operating at M = 1.5 (NPR = 3.6) and simulated total temperature ratios ofTTR = 3.2. The ncrophones for both jets were positioned at a radius of 1.78 in (70 in) on a polar arc originating atthe nozzle exit. Since the two nozzles used in these measurements were 12.7 and 25.4 rmn in diameter, the RIDvalue for the experiments were R/D = 140 and 70 respectively. In the data of Fig. 13, both sets of data were thenscaled (by spherical spreading) to RID = 100. Note that the spectral data are in reasonable agreement but differencesof about 3 dB in magnitude are apparent between data of two size nozzles (and measurement R/D positions). Thediscrepancies are most apparent at frequencies below the peak amplitude level and in the polar angle range from 40°to 60° from the jet axis corresponding to the afore mentioned region of largest gradient in the OASPL with polarangle.
Figure 14 shows very similar data as in Fig. 13 this time recorded with a heated jet exhausting from theNASA GRC HFJER facility fitted with a CD nozzle and 30% bypass unheated air. In this case the acoustic datawere recorded simultaneously with microphones positioned on an arc at R ID = 147 and on a linear array displacedparallel from the jet axis by 33D. The latter data; noted on the figure as at an average radius of RID -- 50, are clearlynot in the geometric far field. The plotted data are scaled to a non-dimensional radial position of RID = 100 and
American Institute of Aeronautics and Astronautics
discrepancies in the spectral level are observed as with the Penn State small scale jet measurements of the previousfigure.
Such discrepancies between the measurements made at the threshold of the near to far field and those thatare clearly in the geometric far field are significant and render the comparisons of the effect of other parameters; insome cases, less effective. In essence the problem is much more acute with hot and heat-simulated jets, than it iswith cold supersonic jets. As demonstrated by Lee and Brid ges [18] and McLaughlin et al. [19] the dominant regionof noise sources in hot supersonic jets center around a non-dimensional axial distance x/D = 13, whereas the locationfor comparable cold jets is around x/D = 8. This shift of the dominant region of noise sources as well as theextended length of the source region is enough to distort the spherical spreading scaling of acoustic data to differentradial positions when the measured microphones on a polar arc originate at the nozzle exit. This reason makes itmore important to perform comparison measurements at the same non-dimensional radial positions. Such is notalways possible when making comparisons to data recorded in experiments performed in past years.
IV. ConclusionsCareful measurements and nornialization were employed to produce direct comparisons between small scale jetacoustic measurements made at Penn State and moderate scale measurements from NASA GRC. In most cases thesupersonic nozzles were of identical geometries (to engineering accuracy) and closely replicated the exhaust nozzlesof GE 404 class turbojet engines. Other experiments were performed with contoured convergin g-diverging (CD)nozzles producing minimal shock cells in the flow field when operated at perfectly expanded pressure ratios. VInitialexperiments were performed with unheated, pure air jet flows. For these cold jets; non-dimensional acoustic datameasured at identical scaled radial distances were shown to agree within +/- 1.5 dB across the spectra at numerouspolar angles. The Reynolds numbers for all cold jet data presented exceeded 900,000 and imperfections in nozzlesurface roughness and lip thickness did not appear to have any significant effect.
For hot jet comparisons, the small scale (Penn State) experiments simulated the hot-jet velocity conditionsof experiments conducted at NASA GRC and NASA LaRC by using helium-air gas mixtures. Comparisons of theacoustic fields (measured in small and moderate sized facilities) of hot jets from practical CD nozzles in typicalover-expanded conditions produced very good agreement on OASPL and spectra, typically within +/- 1.5 dB.Comparisons for ideally expanded nozzles operating at their design Mach numbers showed good agreement betweenrigs of similar scale (nozzle diameters less than 50 nun (2 in)), but not as good agreement between the small andmedium scale rigs, particularly at frequencies below the peak amplitude values.
Realistic exhaust systems often have umnixed bypass flows exiting the nozzle, a feature incorporated intothe medium scale rig. For over-expanded jet conditions in realistic CD nozzles, there was an impact of the bypassflow on the noise; the impact on ideally expanded flows from shock-free nozzles was much smaller. Comparisonsof the small Penn State rig data with hot jet supersonic jet data from the NASA HFJER operating with low bypassratio (BPR = 03) showed reasonable agreement (+/- 1.5 dB) provided the single stream total temperature ratio TTRwas matched to the theoretical nuxed flow TTR of the HFJER jet. Comparison of measurements made in theHFJER facility operating in single-flow and dual-flow (BPR = 03) modes demonstrated that more accurate datawere obtained when the single stream TTR was matched to the TTR,,,, of the dual stream jet. This discrepancy inthe acoustic data of the two kinds of jets is being investigated further with additional experiments and examinationthe effect of the annular bypass stream and of a possible Reynolds number effect.
The unresolved issue of nonlinear propagation, which is just now being recognized in supersonic jet data, wasdemonstrated in rigs of both small and medium scale, particularly at polar angles of maximum acoustic output. Theunresolved part is howto properly scale and correct for this effect ; as demonstrated in the data presented here,without a major computational effort as reported by Saxena et al. [14]. This becomes more of a problem asmeasurement locations are moved further away from the jet to be truly in the geometric far field.
Finally, data are presented that examine the accuracy of scalin g measurements that are made in the outer regionsof the near field to far field distances. These data demonstrate that measurements in supersonic jets must be mademuch further away from the jet to be in the geometric far-field. Presumably this is caused by the position of thedominant noise sources moving significantly downstream of the nozzle exit along with an increase in the lengthwiseextent of the dominant source region.
V. AcknowledgmentsThis work was perforned Linder funding from the Strategic Environmental Research and Development Program;Project Number WP-1583. The Penn State authors take pleasure in acknowledging the direct assistance of Dr.Jeremy Veltin with the experiments and the data interpretation, and helpful discussions with Prof. Philip Morris of
10American Institute of Aeronautics and Astronautics
Penn State and Dr. Steven Martens of GE. Dr. Brenda Henderson of NASA also made significant contributions tothe manuscript during final preparation. The NASA experiments were conducted under the FundamentalAeronautics Program, Supersonics Project. Model hardware was loaned to NASA by the General Electric Company.
References
[1] Viswanathan, K., "Does a model scale nozzle emit the same jet noise as a jet engine," AIAA Jorn-nal, Vol. 46, No.
2, 2008, pp. 336-355.
[2] Doty, M. J. and McLaughlin, D. K., "Acoustic and mean flow measurements of high-speed, helium-air mixture
jets," International Journal ofAeroacoustics, Vol. 2, No. 2, 2003, pp. 293-334.
[3] Papamoschou, D., "Acoustic simulation of coaxial hot air jets using cold helium—air mixture jets," Journal of
Propulsion and Power, Vol. 23, No. 2, 2007, pp. 375-181.
[4] Bridges, J. and Brown, C. A., "Validation of the small hot jet acoustic rig for aeroacoustic research," AIAA
Paper No. 2005-2846, 2005-
[5] Bridges, J. and Brown, C. A., "Parametric testing of chevrons on single flow hot jets," AIAA Paper No. 2004-
2824, 2004.
[6] Kuo, C.-W., Veltin, J., and McLaughlin, D. K., "Methods to improve the accuracy of acoustic measurements in
small scale high speed jets," AIAA Paper No. 2009-3251, 2009.
[7] Kuo, C.-W., Veltin, J., and McLaughlin, D. K., "Acoustic measurements of models of nulitary style supersonic
nozzle jets," AIAA Paper No. 2009-18, 2009.
[8] Viswanathan, K. and Clark, L. T., "Effect of nozzle internal contour on jet aeroacoustics," International Journal
ofAeroacoustics, Vol. 3, No. 2, 2004, pp. 103-135.
[9] Ahuja, K. K., "Designing clean jet-noise facilities and making accurate jet-noise measurements," International
Join-nal ofAeroacoustics, Vol. 2, No. 3&4, 2003, pp. 371-412.
[ 10] Viswanathan, K., "Instrumentation considerations for accurate jet noise measurements," AIAA Journal, Vol. 44,
No. 6, 2006, pp. 1137-1149.
[11] Koch, L. D. ; Bridges, J., Brown, C., and Khavaran, A., "Experimental and analytical determination of the
geometric far field for round jets," Noise Control Engineering Journal, Vol. 53, No. 1, 2005, pp.20-28.
[ 12] Seiner, J. M. and Norun, T. D. ; Jet noise data provided by private corn unication, 2001.
[13] Petitjean, B. P., Morris, P. J., and McLaughlin, D. K., "On the nonlinear propagation of shock-associated jet
noise," AIAA Paper No. 2005-2930, 2005.
[14] Saxena, S., Morris, P. J., and Viswanathan. K., "Algorithm for the nonlinear propagation of broadband jet
noise," AIAA Journal, Vol-47, No. 1, 2009, pp. 186-194.
[15] Lee, S., Morris, P. J., and Brentner, K.S., "Nonlinear Acoustic Propagation Predictions with Applications to
Aircraft and Helicopter Noise," AIAA Paper No. 2010-1384,2010.
[16] Papamoschou, D., "Mach wave elimination in supersonic jets," AIAA Journal, Vol. 35, No. 10. 1997; pp. 1604-
1611.
[ 17] Viswanathan, K., "Aeroacoustics of hot jets," J. Fluid Mech., Vol. 516, 2004, pp. 39-82.
11American Institute of Aeronautics and Astronautics
[18] Lee, S. S. and Bridges, J., "Phased-array measurements of single flow hot jets," AIAA Paper No. 2005-2842,
2005-
[19] McLaughlin, D. K., Kuo, C.-W., and Papamoschou, D., "Experiments on the effect of ground reflections on
supersonic jet noise," AIAA Paper No. 2008-22, 2008-
Table 1 Operating conditions of measurements in each figure.
Fig. 7 Spectra and OASPL comparison ofsingle stream jet with heat simulation(TTR = 2.6) from PSU and heated jet(TTR = 2.5) from HFJER both issuingfrom GE nozzle with Md = 1.65,Mj = 1.36, and scaled to RID = 100.
20 dB
125 ------ ----- ---------
1 30°
125 -....... ..----------40°
Siu01e-flow. TTR = 3.2
— Chiel-flow. TTRm ^ x = 2.7single-flow. TTR = 2.5
60,
----------------------- 900 -
Fig. 8 Spectra comparison among single-flowheated jets (TTR = 3.2 and 2.5) anddual-flow heated jet (TTR,,,, = 3.2,TTR,,, i, = 2.7 with Std,,,,, = f Dj / Uj mix)with BPR = 0.3 all from HFJER issuingfrom GE nozzle with Md = 1.5, Mj = 1.36,and scaled to RID = 100.
125
m
a
115
115
MIL _120° -
0.01 0.1 1 10
Strouhal Number
16
American Institute of Aeronautics and Astronautics
Fig. 9 Spectra comparison among heatsimulated jets (TTR = 3.0 and 2.6)from PSU and heated jet( TTR,,,, = 3. 0, TTR,,, f, = 2.6) from HFJERall issuing from GE nozzle with Md = 1.65,Mj = 1.36, and scaled to RID = 100.
Fig. 10 Spectra comparison between heatsimulated jet (TTR = 2.2) from PSUand heated jet (TTR = 2.25) fromNASA Langley Research Center(LaRC) both issuing from CD nozzlewith Md = 1.5, Mj = 1.5, and RID= 100.