1 A PROFILE OF THE SOUTH AFRICAN ONION MARKET VALUE CHAIN 2015 Directorate Marketing Tel: 012 319 8455 Private Bag X 15 Fax: 012 319 8131 Arcadia E-mail:[email protected]0007 www.daff.gov.za
Transcript
1
A PROFILE OF THE SOUTH AFRICAN ONION MARKET VALUE CHAIN
2015
Directorate Marketing Tel: 012 319 8455 Private Bag X 15 Fax: 012 319 8131 Arcadia E-mail:[email protected] 0007 www.daff.gov.za
3.2.1. (d) Non-legal market requirements: social and environmental accountability 34
3.2. 1(e) Consumer health and safety requirements 34
3.2.2 The United States 34
3.2.3 Asian Market Access 35
4. GENERAL DISTRIBUTION CHANNELS 35
5. LOGISTICAL ISSUES 35
5.1 Mode of transport 35
5.2 Cold chain management 36
5.3 Packaging 36
6. COMPETITIVENESS OF SOUTH AFRICAN ONION EXPORTS. 36
7. OPPORTUNITIES AND CHALLENGES 39
7.1 Opportunities 39
7.2 Challenges 39
8. INDUSTRY NEW DEVELOPMENTS 39
9. ACKNOWLEDGEMENTS 40
3
1. DESCRIPTION OF THE INDUSTRY
Onions are the third most popular vegetable in South Africa, after potatoes being first and tomatoes being second. Onion is widely used in cooking, they add flavor to dishes such as stew, soup and salads. Dry onion can be divided into two categories, which are fresh onion and storage onion. Fresh onions are available in late May or early June and can be purchased until end November. These onions have a higher water and sugar and lower pyruvate content. Consumers can recognize this onion by their lighter colour and thinner skin. The storage onion is available in the market in November just as the fresh onions are coming to an end. These onions have a darker and much thicker skin than that of fresh onion. Storage onions are firm, compact and are much less susceptible to bruising and shipping damage. Both of these types are commercially available in three colours; red, yellow and white. Onions contain phenolics and flavonoids that have potential anti-flammatory, anti cholesterol, anticancer and anticancer and antioxidant properties. Onion is pungent when chopped and contain certain chemical substances which irritate the eyes.
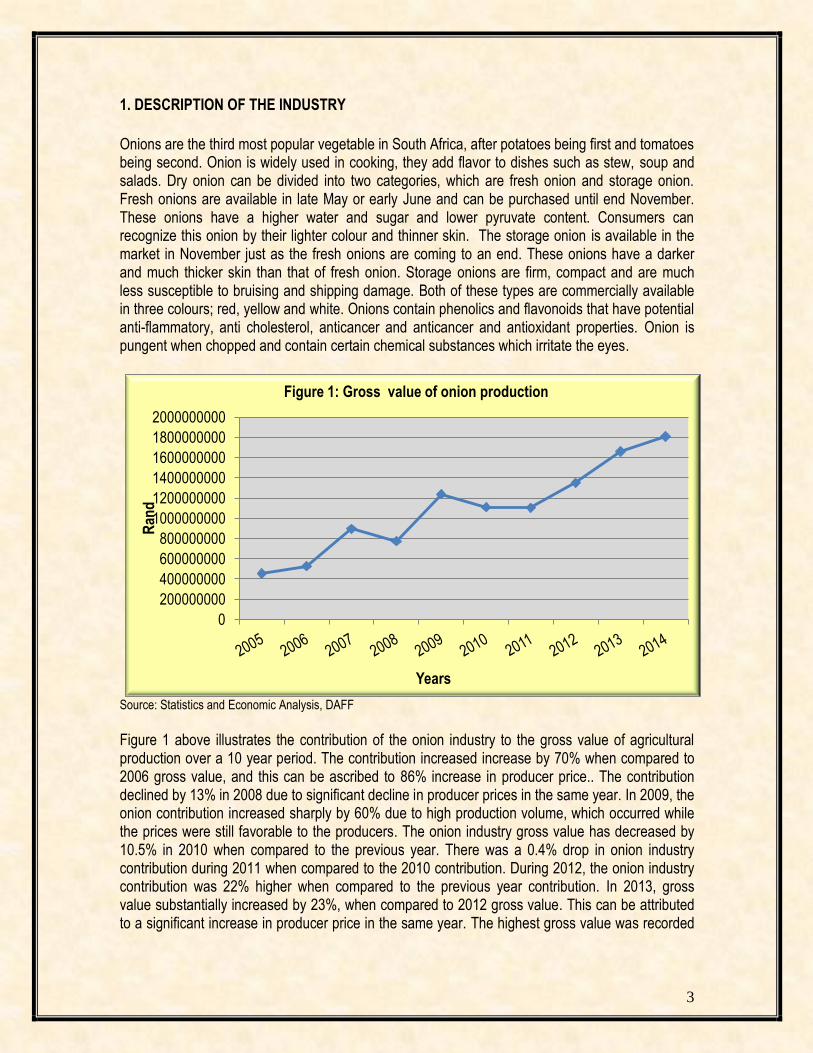
Source: Statistics and Economic Analysis, DAFF
Figure 1 above illustrates the contribution of the onion industry to the gross value of agricultural production over a 10 year period. The contribution increased increase by 70% when compared to 2006 gross value, and this can be ascribed to 86% increase in producer price.. The contribution declined by 13% in 2008 due to significant decline in producer prices in the same year. In 2009, the onion contribution increased sharply by 60% due to high production volume, which occurred while the prices were still favorable to the producers. The onion industry gross value has decreased by 10.5% in 2010 when compared to the previous year. There was a 0.4% drop in onion industry contribution during 2011 when compared to the 2010 contribution. During 2012, the onion industry contribution was 22% higher when compared to the previous year contribution. In 2013, gross value substantially increased by 23%, when compared to 2012 gross value. This can be attributed to a significant increase in producer price in the same year. The highest gross value was recorded
0
200000000
400000000
600000000
800000000
1000000000
1200000000
1400000000
1600000000
1800000000
2000000000
Ran
d
Years
Figure 1: Gross value of onion production
4
in 2014, and the increase was 8.9% in comparison to 2013 gross value. This can be ascribed to the combination of increased output and favourble producer price.
1.1 Production areas
Onions are produced in almost all the provinces of the RSA, mainly in the Western Cape (Ceres), Northern Cape, North West and Limpopo province. According to the United Nations Food and Agriculture Organization (FAO), the leading onion producing countries are China, Japan, South Korea, Iraq, New Zealand, Nigeria, Tunisia and Turkey respectively. Nigeria and Tunisia are the only African country which are amongst world top 10 world onion producers.
1.2 Production trend
Figure 2 below illustrates the production of onion for the past 10 years.
Source: Statistics and Economic Analysis, DAFF
The production of onion was fairly unstable over the period under review. In 2005, production volume was above 380 000 tons. During 2006, the production slightly increased by 4% in comparison to 2005 output. In 2007, production output fell by 8.5% when compared to the previous year output. The decline in production can be attributed to increasing input costs and unfavorable weather conditions. From 2008, the production volumes increased steadily, reaching a peak in the 2012 production season. The production volumes increased by 13.5% during 2011, when compared to the 2010 production season. During 2012 production output increased by 6.8%, in comparison to the 2011 production output. In 2013, production output dropped by 6.8% when compared to the previous year output. Production output was just over 612 000 tons during 2014 and this represents a slight increase of 4.6% in comparison to 2013 production output.
0
100000
200000
300000
400000
500000
600000
700000
Ton
s
Years
Figure 2: Total production of onions
5
1.2 Consumption Figure 3 below depicts local consumption of onion compared to the production over 10 years. The average onion consumption is approximately 449 340 tons per annum. This indicates that South Africa is self sufficient in terms of onion production and the surplus is also exported. In 2008 the consumption increased by 13.6% and this can be attributed to increase in production in the same year. In 2010, the consumption increased by 8% compared to the previous year. During 2011, the consumption volumes increased by 12.7%, which can be contributed to 13.5% increase in production output. In 2012, consumption volume increased by 2.2% when compared to the previous year’s consumption and during 2013 consumption volumes dropped by 8.5%. Globally, Libya has the highest consumption of onions. 2014 average consumption value represents a growth of 6.3%.
Source: Statistics and Economic Analysis, DAFF
2. MARKET STRUCTURE
The onion industry operates in the deregulated environment where the prices are determined by the forces of demand and supply and there are no restrictions in the marketing on onions. The industry uses fresh produce markets, informal market, processors and direct selling to wholesalers and retailers as marketing channels. Onions are also exported to other countries through export agents and marketing companies. South Africa also imports onions from other countries.
0
100000
200000
300000
400000
500000
600000
700000
Ton
s
Years
Figure 3: Production vs Total fresh consumption
Production (Tons) Consumption (Tons)
6
2.1 Domestic markets and prices
The various modes through which onions are marketed are presented in Table 1. Table 1: Onion sold through different marketing channels
Years National Fresh Produce
Market (Tons) Exports (Tons) Total Processing (Tons)
Table 1 above illustrates that National Fresh Produce Markets remain an important channel for the sale of onions in South Africa. In 2014, 58% of onions were distributed through fresh produce markets and the remaining 42% represent direct sales to wholesalers, retailers, exports, processors and informal traders. The sales volume sold through national fresh produce market have gone up by 8.6%, when compared to 2013 and the percentage distributed through the markets has also gone down from 56% to 58%. In 2014, the onion export has gone up by 11.6% compared to the previous year, while the processed onion has increased by 74%. The growth in sales, exports and processed onions can be attributed to 4.6% increase in production output.
Source: Statistics and Economic Analysis, DAFF
0
500
1000
1500
2000
2500
3000
3500
4000
0
50000
100000
150000
200000
250000
300000
350000
400000 R
and
/to
n
Ton
s
Years
Figure 4: Onions sold at the fresh produce markets
Volume (Tons) Price (Rand/Ton)
7
Figure 4 above illustrates the sales of onions in the national fresh produce market for the past ten years. The market prices at the national fresh produce markets were relatively unstable. In 2006, a market price was just above R1300/ton which represents an 11.6% increase in comparison to the 2005 price. Onion price traded higher in 2007 and the prices surged by 97% compared to 2006. The increase in prices can be attributed to 10% decrease in volumes of onion supplied in the same year. In 2008 the market prices dropped by 26% compared to the previous year. This can be attributed to increase in volumes supplied across the markets. The high price was recorded in 2009 as onion volumes decline across the market. In 2010, market prices dropped by 19% due to 9.3% increase in volumes in the same year. The price continued to drop during 2011 as volumes supplied increased by 11.4%. During 2012, market price increased by 16.6%, when compare to market price in the previous year. The market price has gone up despite 2.5% increase in volumes supplied across the market which can be attributed to strong onion uptake in the same season. In 2013, market price surged by 32.75%, when compared to 2012 price and this can be attributed to 7.7% drop in volumes supplied across the market. There was an 8.6% increase in onion volume supplied in 2014 and this had a slight negative impact on the market prices.
2.2 South Africa Onion Exports
In 2014, South Africa’s onion exports represented 1.03% of world exports and its ranking in the world exports was 18. South Africa has increased its competitiveness in terms of onion exports to the world as during 2013, it was ranked number 19. The South Africa onion exports were mainly destined for Angola, Mozambique, Zambia, Namibia, and Botswana during 2014. More than 91% of South African onions were exported to neighboring African countries. Figure 5 below illustrates the major onion export destinations. Globally, Netherlands, China, India, Mexico, United States of America and Egypt are the top countries exporting onions. Egypt is the only African country which is among top ten onion exporters in the world and this can be attributed to the fact that it is also among top onion producers in the world. Figure 5 presents the various destinations for South Africa’s onion exports in 2014.
Source: Trade Map
0 10 20 30 40 50 60
Angola
Mozambique
Zambia
Namibia
Botswana
Swaziland
Lesotho
Zimbabwe
Congo
Philippines
Area Nes
Others
Co
un
trie
s
Figure 5: South Africa's onion exports destinations in 2014
Share in South Africa's exports (%)
8
Further details relating to the exports of onion 2014 are presented in Table 2.
Table 2: South Africa’s onion exports in 2014
Importers
Exported value 2014 (USD thousand)
Share in South Africa's exports (%)
Exported quantity 2014 (Tons)
Unit value (USD/unit)
Exported growth in value between 2010-2014 (%, p.a.)
Exported growth in quantity between 2010-2014 (%, p.a.)
Exported growth in value between 2013-2014 (%, p.a.)
World 30141 100 97769 308 5 -3 13
Angola 16193 53.7 39855 406 105 114 18
Mozambique 5248 17.4 31715 165 2 19 2
Zambia 2226 7.4 8527 261 32 23 49
Namibia 1849 6.1 3869 478 -40 -43 -10
Botswana 1841 6.1 4431 415 1 -50 21
Swaziland 916 3 3961 231 4 24 6
Lesotho 633 2.1 1271 498 58 101 -3
Zimbabwe 620 2.1 2895 214 -26 -13 -12
Congo 154 0.5 236 653 7 3 103
Philippines 120 0.4 288 417
Area Nes 94 0.3 234 402 74 Source: ITC Trade Map
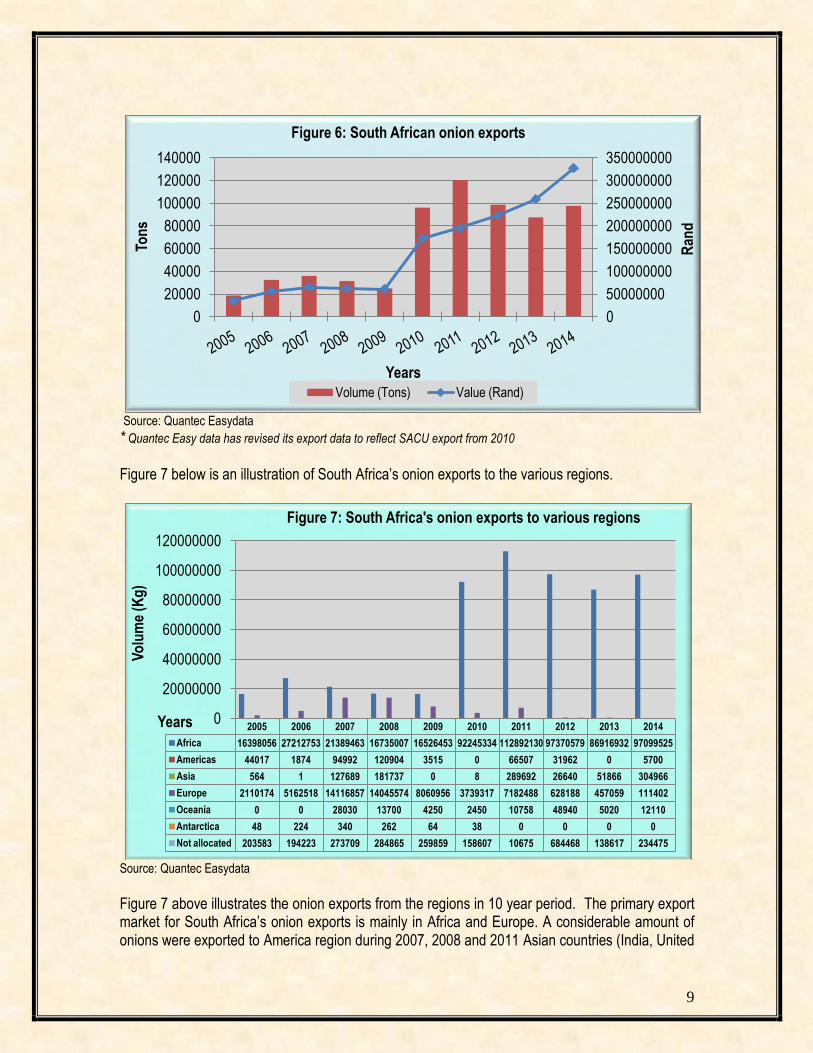
Table 2 indicates that during 2014, South Africa exported higher quantities of onions to Angola, and Mozambique. South Africa also exported considerable percentage to Zambia, Namibia, Botswana and Swaziland. South Africa’s onion exports to the Angola have increased by 105% in value and by 114% in quantity between 2010 and 2014. South Africa’s exports to Zambia have increased by 32% in value and 23% in quantity between 2010 and 2014 period. South Africa’s onion exports to the Namibia have decreased by 40% in value and 43% quantity between 2010 and 2014 period. South Africa has traded within SACU countries (Botswana, Swaziland and Lesotho) Figure 6 below illustrates onion exports from South Africa for the past 10 years. In 2005, onion export volume was above 18 700 tons. This represented a lowest export volume recorded, due to a lower production output in the same year. In 2006, onion exports surged by 74% it was also more profitable to export in the same year. There was a 6% decrease in export volume in 2009, despite the high production volumes. In 2010 onion exports were incomparably higher, when compared to 2009. Onion exports increased by 25% during 2011, the increase in exports can be attributed to 13.5% increase in the domestic production output. In 2012, onion exports volume dropped by 17.9% when compared to 2011 onion export, despite a 6.8% increase in the domestic onion production. During 2013, export volume fell by 11.5%, when compared to the previous year export and this can be attributed to 6.85% drop in domestic production output. From 2009 to 2014, it was more profitable to export onion since higher export values were recorded for smaller volumes exported. In 2014, it was the most profitable year to export onion during the 10 year period. South African onion exports was just above 97 700 tons during 2014 and this represent an 11.6% increment in onion exported in 2013.
9
Source: Quantec Easydata
* Quantec Easy data has revised its export data to reflect SACU export from 2010
Figure 7 below is an illustration of South Africa’s onion exports to the various regions.
Source: Quantec Easydata
Figure 7 above illustrates the onion exports from the regions in 10 year period. The primary export market for South Africa’s onion exports is mainly in Africa and Europe. A considerable amount of onions were exported to America region during 2007, 2008 and 2011 Asian countries (India, United
Figure 7: South Africa's onion exports to various regions
10
Arab Emirates and Qatar). A fraction of South Africa onion exports was not allocated to any region during the period under review. In 2011, South Africa exports market was still in African and European region. The exports to the Americas, Asia and Oceania were less significant when compared to Africa and European regions. During 2012, African region continued to be a primary market for South Africa’s onion exports and more than 98% of South Africa’s exports were destined for this region. In the same year there was a significant drop in volumes exported to European region and the exports to Oceania regions have significantly increased. South Africa’s onion exports to the Americas and Asia has significantly dropped in 2012. Africa region continued to be the preferred export market for onion exports originating from South Africa, however, there was a diversification in export destination during the 2013. South Africa exported onion to Botswana, Lesotho and Swaziland. In the same year, there were no onion exports to America and exports to Europe and Oceania have substantially dropped. Exports to Asia have doubled and unallocated onion has significantly dropped. Exports to African, Asia and Oceania regions have notably increased during 2014. At the same time, onion exports to Europe has notably dropped.
Source: Quantec Easydata
Figure 8 above illustrates the value of South Africa onion exports earned from the regions. It was more profitable to export onion to the European region since the high export value was recorded in low volumes exported. African region has also recorded high export values as high volumes were exported to the region. During 2011, it was more profitable to export to Americas region when compared to the other regions. In 2012, it was more profitable to export onion to Asia followed by Americas region. European region was still the most profitable export market, followed by Oceania region during 2013. At the same time unallocated onion exports had a higher value and the least profitable export market was Asia region. In 2014, European region was by far the most profitable
Figure 8: Value of South African onion exports to the regions
11
export market, followed by Asia then African region. In the same year, America was the least profitable export market for onion exports originating from South Africa. Figure 9 below illustrates that the highlight of onion exports were that of Western Cape and Gauteng. Northern Cape, Kwa-Zulu Natal and Limpopo province who contributed to onion exports to a lesser extent. The high exports by Western Cape and Gauteng province can be attributed to the export exit points, situated in these provinces. Eastern Cape province has contributed to South Africa onion exports only in 2004. In 2010, onion exports for Western Cape have decreased while the export value for Gauteng province has increased significantly.At the same year Kwazulu Natal and Mpunalanga export values have notably increased. The highest export value was recorded in 2011 for Gauteng province. In 2011 export values for Western Cape and Gauteng provinces have increased while the export values for Northern Cape, Kwazulu Natal, Mpumalanga and Limpopo have considerably dropped. During 2012, Western Cape and Gauteng continued to lead in onion exports from South Africa. During the same year Free State, North West and Mpumalanga, have significantly contributed to South Africa’s onion exports. In 2013, Western Cape and Gauteng have continued to contribute significantly to South Africa’s onion exports and the export values have considerably increased. In the same time export values for Northern Cape, Limpopo and Mpumalanga, has substantially increased, while Eastern Cape has recorded an export value after eight years of recording zero onion trade. During 2014, Western Cape has recorded the highest value during 2014, while Gauteng export value has gone down. At the same year, Eastern Cape export value has notably dropped while Northern Cape, North West and Limpopo export values have significantly increased. The following figures (Figure 10-18) show the value onion exports from the various districts in all the provinces in South Africa.
12
Source: Quantec Easydata
Figure 10 below, is an illustration of onion exports by Western Cape province.
Figure 10: Value of onion exports by Western Cape Province
13
Figure 10 above indicates that onion exports from Western Cape province were mainly from the City of Cape Town and Cape Winelands district municipalities. Eden, West Coast and Overberg district municipalities have contributed in between during the period under review. High export from Cape Town municipality can be attributed to the Cape Town harbour export exit point. The high export value was in 2009 for the City of Cape Town and in 2008 for the West Coast district municipality. In 2010, Export value for the City of Cape Town has decreased while Overberg and Eden municipalities have increased their export values. During 2011, West Coast contributed to Western Cape onion exports for the first time in a 10 year period. During 2012, West Coast, Eden and Cape Winelands have contributed significantly to Western Cape onion exports. In 2013, the City of Cape Town has continued to contribute significantly to onion exports from Western Cape and the export values for Eden, Cape Winelands and Overberg have substantially increased when compared to the 2011 export values. A record high export value was recorded in 2014 for Western Cape province and it was exported through the City of Cape Town. At the same time, Cape Winelands has also recorded high export value while Eden export value has notably dropped.
Source: Quantec Easydata
Figure 11 above shows that onion exports by Gauteng province were mainly from the City of Johannesburg, Ekurhuleni and City Of Tshwane. OR Tambo International Airport serves as exports exit point from Gauteng province. Sedibeng contributed to Gauteng onion exports only in 2006 and the export value was less significant. In 2010, export values for West Rand, Ekurhuleni and City of Tshwane have increased significantly. In 2011, City of Johannesburg continued to be a leading municipality in onion export and the municipality has recorded its highest value in a period of 10 years. In 2012, City of Johannesburg export value has notably dropped in comparison to 2011 onion exports. In the same year the City of Tshwane export value has significantly increased. During
City of Johannesburg 22791809 22575019 13020307 9425466 11965124 105400578 116430825 66459137 76776451 64618358
City of Tshwane 233100 1649723 1701813 698314 190503 41952791 43564209 61527077 41876789 32068545
0
20000000
40000000
60000000
80000000
100000000
120000000
140000000
Val
ue
(Ran
d)
Years
Figure 11 : Value of onion export by Gauteng Province
14
2013, City of Johannesburg, Ekurhuleni and West Rand onion export values have notably gone up when compared to 2012 export values. During 2014, City of Johannesburg and the City of Tshwane were still the main contributors in Gauteng onion exports, but the export values have dropped in comparison to 2013 export values. At the same, Ekurhuleni and West Rand have export value have notably increased when compared to the previous year export values. As can be seen on the below Figure 12, it is clear that onion exports from the Kwazulu Natal province were mainly from Ethekwini district, which can be attributed to Durban Harbour export exit point and the highest exports were recorded in 2007. In 2008 and 2009 there was a significant decline in export value recorded for Ethekwini district. Uthungulu district contributed to onion exports in 2005, 2013 and 204. Ugu district has recorded an export value for the first time in 2010 and during 2011, the export value recorded for this municipality has increased significantly. Export value for the Ethekwini municipality has dropped significantly during 2011 and in 2012, export value for this municipality has increased by 24%, when compared to the 2011 export value. During 2012, Ugu recorded the highest export value of onion from the Kwazulu Natal province. In 2013, Ugu was the main contributor to Kwazulu Natal onion export, but the value has significantly dropped. In the same Ethekwini and Uthungulu export values has considerably increased when compared to 2012 export values. In 2014, Ugu was still the main contributor in onion exports from Kwazulu Natal, but the export value has dropped further by 9%. At the same time, export values for Uthungulu and Ethekwini have also dropped.
Source: Quantec Easydata
Figure 13 below is an illustration of onion exports by Eastern Cape province.
Figure 12: Value of onion exports by Kwazulu Natal Province
15
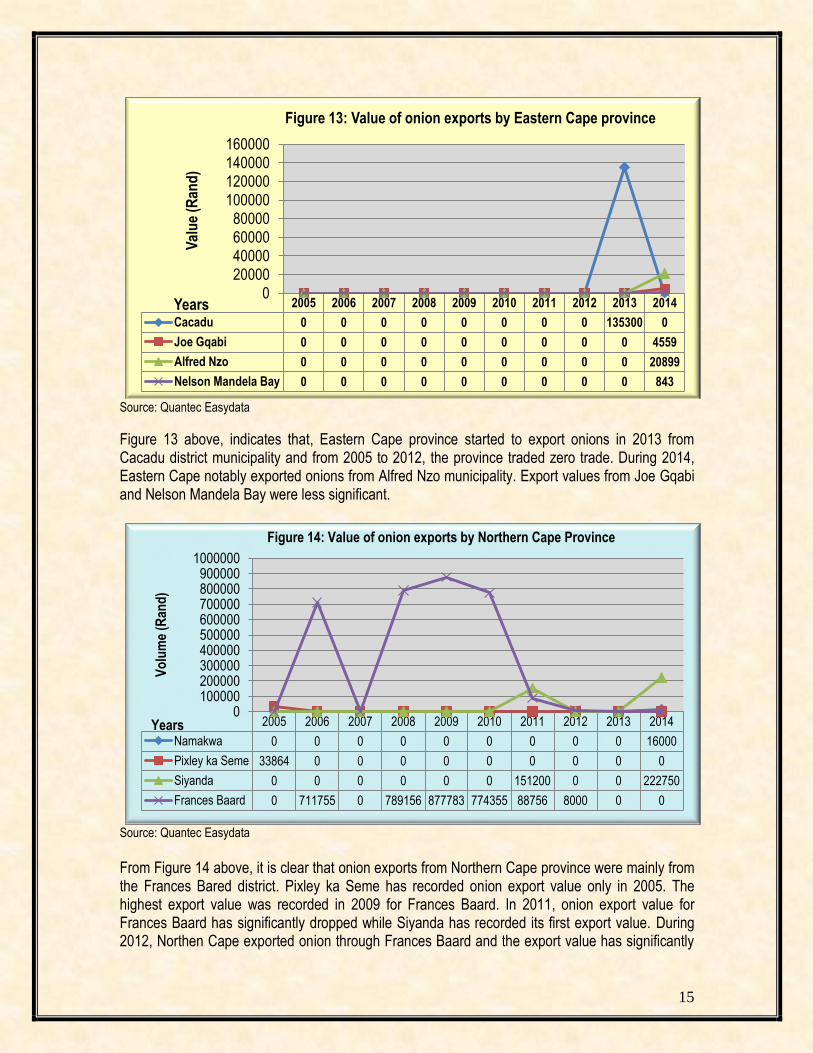
Source: Quantec Easydata
Figure 13 above, indicates that, Eastern Cape province started to export onions in 2013 from Cacadu district municipality and from 2005 to 2012, the province traded zero trade. During 2014, Eastern Cape notably exported onions from Alfred Nzo municipality. Export values from Joe Gqabi and Nelson Mandela Bay were less significant.
Source: Quantec Easydata
From Figure 14 above, it is clear that onion exports from Northern Cape province were mainly from the Frances Bared district. Pixley ka Seme has recorded onion export value only in 2005. The highest export value was recorded in 2009 for Frances Baard. In 2011, onion export value for Frances Baard has significantly dropped while Siyanda has recorded its first export value. During 2012, Northen Cape exported onion through Frances Baard and the export value has significantly
2005 2006 2007 2008 2009 2010 2011 2012 2013 2014
Cacadu 0 0 0 0 0 0 0 0 135300 0
Joe Gqabi 0 0 0 0 0 0 0 0 0 4559
Alfred Nzo 0 0 0 0 0 0 0 0 0 20899
Nelson Mandela Bay 0 0 0 0 0 0 0 0 0 843
0 20000 40000 60000 80000
100000 120000 140000 160000
Val
ue
(Ran
d)
Years
Figure 13: Value of onion exports by Eastern Cape province
Figure 14: Value of onion exports by Northern Cape Province
16
dropped when compared to the 2011 export value. During 2013, Northern Cape province has recorded a zero onion trade. In 2014 Northern Cape exported onion from Namakwa and Siyanda district municipalities.
Source: Quantec Easydata
Figure 15 above shows that onion exports by Free State province were mainly from Xhariep district. The province’s first exports wer in 2009 through Thabo Mofutsanyane district municipality. From 2005 to 2008, 2010 and 2011, Free State province had a zero trade for onions. In 2012, Xhariep contributed for the first time to Free State onion exports and the value was the highest in a ten year period. During 2013, Mangaung and Fizile Dabi districts contributed to Free State onion exports for the first time in a 10 year period. At the same time Xhariep export value has notably dropped when compared to the previous year export value. In 2014, Xhariep exports dropped further while the export values for Thabo Mofutsanyane, Fezile Dabi and Mangaung have notably increased.
Figure 15 : Value of onion exports by Free State Province
17
Source: Quantec Easydata
Figure 16 above illustrates that the North West province recorded its first onion exports in 2013, from the Ngaka Modiri Molema district. From 2004 to 2012 the province has recorded a zero trade for onions. During 2014, Free State exported onion through Bojanala, Ngaka Modiri Molema and Dr Kenneth Kaunda district municipalities, but export value for Dr Keneth Kaunda was insignificant. High export value in 2014, can be attributed to a 21% increase in onion export value to Botswana during 2013 and 2014. Figure 17 below shows that onion exports from the Mpumalanga province were mainly from Ehlanzeni district municipalities. In 2005, 2008 and 2009 the province has recorded a zero trade. In 2010, the Nkangala district municipality has recorded its first export value in 10 year period. In 2011, export value was recorded only in Ehlanzeni municipality and during 2012 the export value has increased significantly when compared to the 2011 export value. During 2013, Mpumalanga has exported onions through Ehlazeni district and the export value was the highest during the period under review. In 2014, Mpumalanga onion was exported through Ehlanzeni, Nkangala and Gert Sibande has recorded its first export value in a ten year period. Export value for Ehlanzeni has notably dropped and Nkangala export value was less significant.
2005 2006 2007 2008 2009 2010 2011 2012 2013 2014
Bojanala district 0 0 0 0 0 0 0 0 0 2593750
Ngaka Modiri Molema 0 0 0 0 0 0 0 0 792000 66000
Dr Kenneth Kaunda 0 0 0 0 0 0 0 0 0 2818
0
500000
1000000
1500000
2000000
2500000
3000000
Val
ue
(Ran
d)
Years
Figure 16 : Value of onion exports by North West Province
18
Source: Quantec Easydata
Figure 18 below, is an illustration of onion exports by Limpopo province.
Source: Quantec Easydata
Figure 18 above shows that the onion exports by Limpopo province originated mainly from Capricorn District. In 2005, 2008 and 2009 Limpopo exported onions only from Capricorn district and from 2006 to 2007, the province has recorded a zero onion trade. In 2010, Limpopo province onion exports originated from Capricorn and Vhembe districts. In 2011, export values for both Vhembe and Capricorn districts have significantly dropped. During 2012, Waterberg district contributed for the first time to Limpopo provincial onion exports, but the export value for Mopani
Figure 18 : Value of onion export by Limpopo Province
19
was less significant. In 2013, Limpopo province has exported onion through Vhembe, Capricorn, Mopani and Waterberg districts and the export values have substantially increased when compared to 2012 export values. During 2014, Waterberg, Capricorn and Mopani export values have notably increased, while Vhembe export value has significantly dropped.
2.3 Share analysis
Table 3 below illustrates the provincial share towards national onion exports. The Western Cape and Gauteng provinces recorded the greatest shares of onion exports from South Africa. High onion export shares by Western Cape and Gauteng provinces can be attributed to registered exporters and export exit point located in these provinces. In 2010, Gauteng onion export share has increased from 22.43% to 86.15%, while Western Cape share has decreased from 72.71% to 12.14% when comparing to 2009 export shares. In 2011, Gauteng export share has slightly decreased to 82.29%, while Western Cape export share has increased to 17.23% when compared to 2010 export share. During 2012, Western Cape has increased its export share to 33.27%, while export share for Gauteng has dropped to 57.64%. During the same time Free State increased its export share to 4.13%, while export share for Mpumalanga has increased to 3.31%. In 2013 and 2014, Western Cape continued to contribute significantly to South Africa’s onion export and it has commanded 43.98% and 58.34% share respectively. During 2014, Gauteng export share has dropped further to 34.39% when compared to 2013. In the same year, Eastern Cape, Northern Cape, North West, Mpumalanga and Limpopo export shares were less significant. Table 3: Share of provincial onion exports to the RSA onion exports
Western Cape 100 100 100 100 100 100 100 100 100 100 Source: Calculated from Quantec Easydata
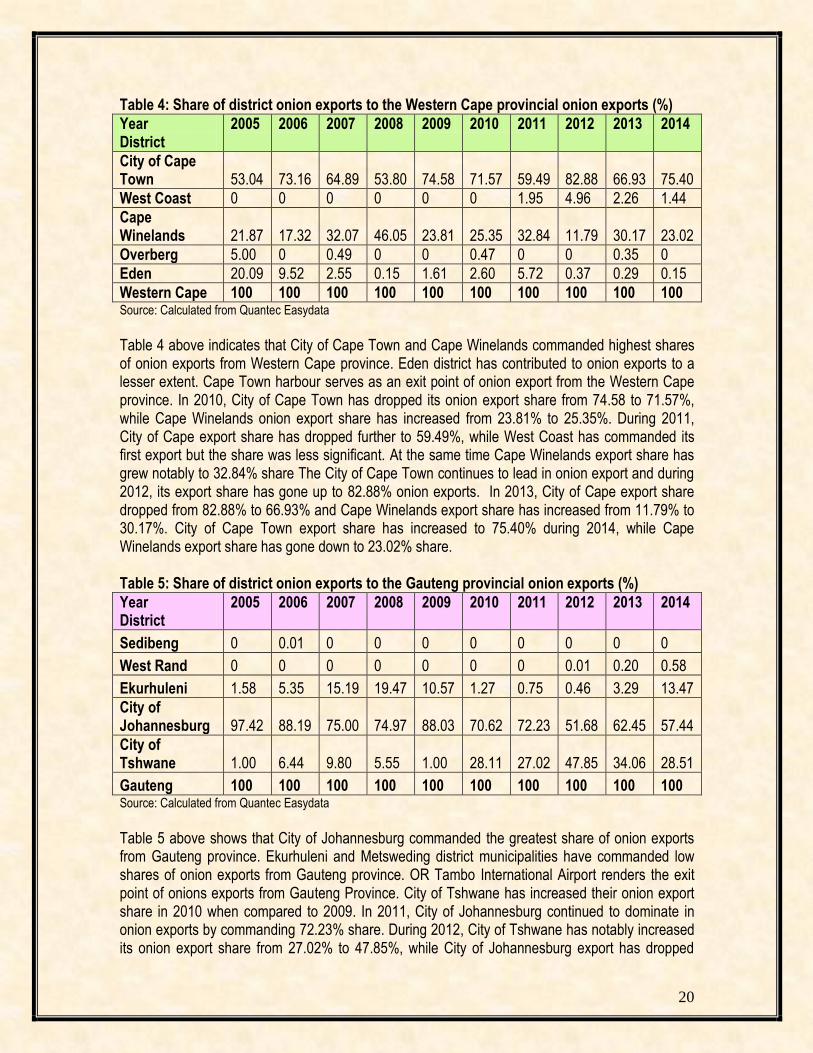
Table 4 above indicates that City of Cape Town and Cape Winelands commanded highest shares of onion exports from Western Cape province. Eden district has contributed to onion exports to a lesser extent. Cape Town harbour serves as an exit point of onion export from the Western Cape province. In 2010, City of Cape Town has dropped its onion export share from 74.58 to 71.57%, while Cape Winelands onion export share has increased from 23.81% to 25.35%. During 2011, City of Cape export share has dropped further to 59.49%, while West Coast has commanded its first export but the share was less significant. At the same time Cape Winelands export share has grew notably to 32.84% share The City of Cape Town continues to lead in onion export and during 2012, its export share has gone up to 82.88% onion exports. In 2013, City of Cape export share dropped from 82.88% to 66.93% and Cape Winelands export share has increased from 11.79% to 30.17%. City of Cape Town export share has increased to 75.40% during 2014, while Cape Winelands export share has gone down to 23.02% share. Table 5: Share of district onion exports to the Gauteng provincial onion exports (%)
Table 5 above shows that City of Johannesburg commanded the greatest share of onion exports from Gauteng province. Ekurhuleni and Metsweding district municipalities have commanded low shares of onion exports from Gauteng province. OR Tambo International Airport renders the exit point of onions exports from Gauteng Province. City of Tshwane has increased their onion export share in 2010 when compared to 2009. In 2011, City of Johannesburg continued to dominate in onion exports by commanding 72.23% share. During 2012, City of Tshwane has notably increased its onion export share from 27.02% to 47.85%, while City of Johannesburg export has dropped
21
from 72.23% to 51.68%. In 2013, Ekurhuleni has commanded 3.29% and City of Johannesburg export share has increased to 62.45%. In the same year, City of Tshwane export share has notably decreased when compared to 2012 export share. During 2014, Ekurhuleni has notably increased its export share from 3.29% to 13.47% whereas the City of Johannesburg and City of Tshwane export shares have dropped in comparision to 2013. Table 6: Share of district onion exports to the Kwazulu Natal provincial onion exports (%)
Table 6 above illustrates that Ethekwini districts commanded the greatest share of onions export from Kwazulu Natal province. The greatest share by Ethekwini can be attributed to Durban harbour which renders exports exit point.During 2005, Ethekwini commanded 85.55% share whereas Uthungulu has commanded 14.45% share. In 2010, Ugu district municipality has commanded 35.61% share for onion export. This was Ugu district first record of onion exports in 10 year period. In 2011, Ugu commanded a 86.95 % share of onion export which represent an increase of 51.34% when compared to a 2010 share. From 2006 to 2009 Ethekwini has commanded 100% share in onion export share but in 2010, the district export share has dropped from 100% to the 64.39%. Ethekwini export share continued to drop during 2011, and the municipality has commanded only 13.05% share. In 2012, Ugu continued to lead in onion exports from Kwazulu Natal by commanding 97.13% share, while the share for Ethekwini has dropped further to 2.87%. During 2013, Ugu maintained its lead in onion export by commanding an 81.51% and Ethekwini notably increased its export share from 2.87% to 14.58%. In the same year Uthungulu commanded a 3.91% share after seven years of recording 0% share. During 2014, Ugu increased its export share from 81.51% to 90.78% and Ethekwini export share has gone down to 5.42% share. Table 7: Share of district onion exports to the Eastern Cape Provincial onion exports (%) Year District
2005 2006 2007 2008 2009 2010 2011 2012 2013 2014
Cacadu 0 0 0 0 0 0 0 0 100 0
Joe Gqabi 0 0 0 0 0 0 0 0 0 17.33
Alfred Nzo 0 0 0 0 0 0 0 0 0 79.46
Nelson Mandela Bay 0 0 0 0 0 0 0 0 0 3.21
Eastern Cape 0 0 0 0 0 0 0 0 100 100
Source: Calculated from Quantec Easydata
From 2005 to 2012, Eastern Cape province has recorded a zero trade. In 2013, Cacadu municipality has commanded a 100% share of onion exports from Eastern Cape Province. In 2014, Alfred Nzo commanded the highest export share of 79.46%, Joe Gqabi commanded 17.33, whereas Nelson Mandela Bay has recorded 3.21% share from Eastern Cape province.
22
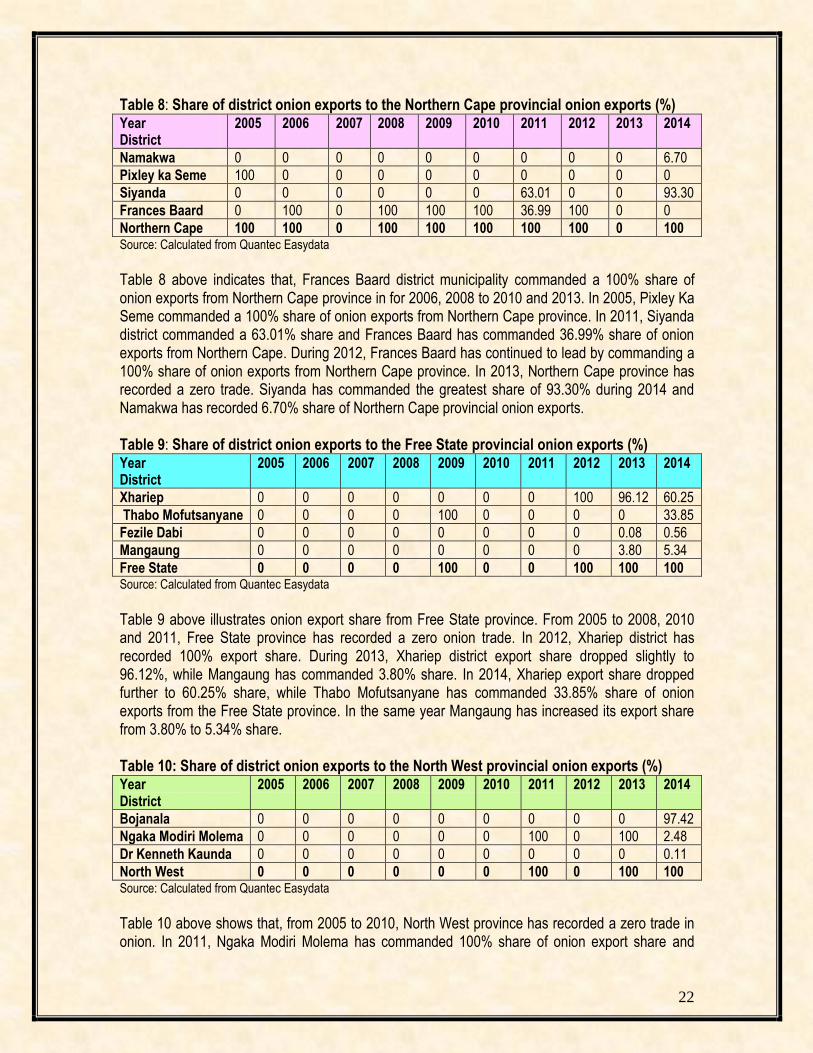
Table 8: Share of district onion exports to the Northern Cape provincial onion exports (%) Year District
Table 8 above indicates that, Frances Baard district municipality commanded a 100% share of onion exports from Northern Cape province in for 2006, 2008 to 2010 and 2013. In 2005, Pixley Ka Seme commanded a 100% share of onion exports from Northern Cape province. In 2011, Siyanda district commanded a 63.01% share and Frances Baard has commanded 36.99% share of onion exports from Northern Cape. During 2012, Frances Baard has continued to lead by commanding a 100% share of onion exports from Northern Cape province. In 2013, Northern Cape province has recorded a zero trade. Siyanda has commanded the greatest share of 93.30% during 2014 and Namakwa has recorded 6.70% share of Northern Cape provincial onion exports. Table 9: Share of district onion exports to the Free State provincial onion exports (%) Year District
2005 2006 2007 2008 2009 2010 2011 2012 2013 2014
Xhariep 0 0 0 0 0 0 0 100 96.12 60.25
Thabo Mofutsanyane 0 0 0 0 100 0 0 0 0 33.85
Fezile Dabi 0 0 0 0 0 0 0 0 0.08 0.56
Mangaung 0 0 0 0 0 0 0 0 3.80 5.34
Free State 0 0 0 0 100 0 0 100 100 100 Source: Calculated from Quantec Easydata
Table 9 above illustrates onion export share from Free State province. From 2005 to 2008, 2010 and 2011, Free State province has recorded a zero onion trade. In 2012, Xhariep district has recorded 100% export share. During 2013, Xhariep district export share dropped slightly to 96.12%, while Mangaung has commanded 3.80% share. In 2014, Xhariep export share dropped further to 60.25% share, while Thabo Mofutsanyane has commanded 33.85% share of onion exports from the Free State province. In the same year Mangaung has increased its export share from 3.80% to 5.34% share. Table 10: Share of district onion exports to the North West provincial onion exports (%) Year District
2005 2006 2007 2008 2009 2010 2011 2012 2013 2014
Bojanala 0 0 0 0 0 0 0 0 0 97.42
Ngaka Modiri Molema 0 0 0 0 0 0 100 0 100 2.48
Dr Kenneth Kaunda 0 0 0 0 0 0 0 0 0 0.11
North West 0 0 0 0 0 0 100 0 100 100 Source: Calculated from Quantec Easydata
Table 10 above shows that, from 2005 to 2010, North West province has recorded a zero trade in onion. In 2011, Ngaka Modiri Molema has commanded 100% share of onion export share and
23
during 2012, the province has recorded zero onion trade. During 2013, Ngaka Modiri Molema has recorded 100% share of onion export share. In 2013, export share for Ngaka Modiri Molema has dropped from 100% to 2.48% and Bojanala export share has commanded 97.42% of North West provincial onion export. Table 11: Share of district onion exports to the Mpumalanga provincial onion exports (%)
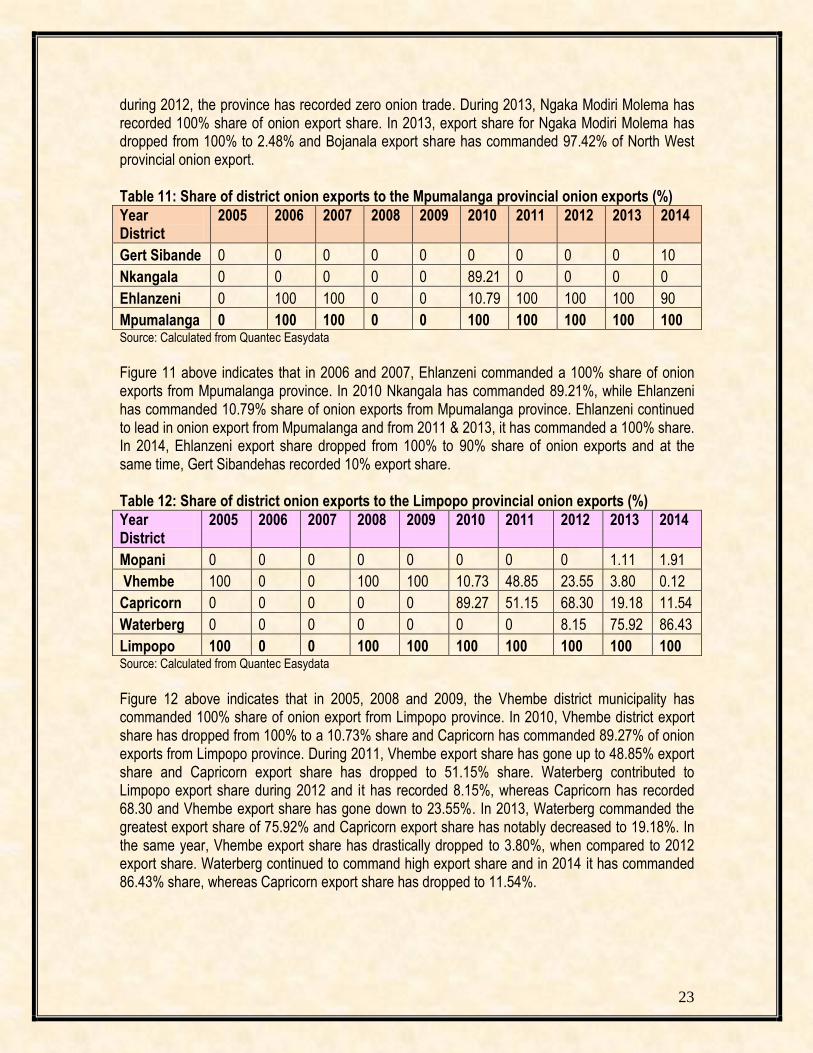
Figure 11 above indicates that in 2006 and 2007, Ehlanzeni commanded a 100% share of onion exports from Mpumalanga province. In 2010 Nkangala has commanded 89.21%, while Ehlanzeni has commanded 10.79% share of onion exports from Mpumalanga province. Ehlanzeni continued to lead in onion export from Mpumalanga and from 2011 & 2013, it has commanded a 100% share. In 2014, Ehlanzeni export share dropped from 100% to 90% share of onion exports and at the same time, Gert Sibandehas recorded 10% export share. Table 12: Share of district onion exports to the Limpopo provincial onion exports (%)
Figure 12 above indicates that in 2005, 2008 and 2009, the Vhembe district municipality has commanded 100% share of onion export from Limpopo province. In 2010, Vhembe district export share has dropped from 100% to a 10.73% share and Capricorn has commanded 89.27% of onion exports from Limpopo province. During 2011, Vhembe export share has gone up to 48.85% export share and Capricorn export share has dropped to 51.15% share. Waterberg contributed to Limpopo export share during 2012 and it has recorded 8.15%, whereas Capricorn has recorded 68.30 and Vhembe export share has gone down to 23.55%. In 2013, Waterberg commanded the greatest export share of 75.92% and Capricorn export share has notably decreased to 19.18%. In the same year, Vhembe export share has drastically dropped to 3.80%, when compared to 2012 export share. Waterberg continued to command high export share and in 2014 it has commanded 86.43% share, whereas Capricorn export share has dropped to 11.54%.
24
2.4 South Africa’s onion imports
In 2014, South Africa’s imports represented 0.06% of world imports for onion and its ranking in world imports were 102. During 2014, South Africa’s onion imports have slightly increased by 2.3% and it has gained its competitiveness, despite the slight increase in imports as it was ranked 101 in 2013. In 2014, South Africa imported onions mainly from Namibia, Netherlands, Kenya, Egypt, Belgium and France. Globally, United States of America, United Kingdom, Russian Federation, Germany, Japan and Viet Nam are top onion importers.
Source: Quantec Easydata
Figure 19 shows that onion imports fluctuated during the period under review. In 2005 onion imports were significantly lower, despite low domestic production in the same year. During 2006, onion imports increased by 8%, when compared to 2005 imports and this can be attributed to a 4% increment in domestic output in the same year. Lowest import volume was recorded in 2007 and this can be ascribed to the lowest domestic production in the same period In 2008, onion import increased by 81% despite high domestic production. This can be attributed to cheaper in imports in the same year. In 2009, onion imports decreased by 16.8% and this can be attributed to increased domestic production in the same year. In 2010, South Africa onion imports have surged incomparably higher, when compared to 2009. This can be attributed to a 12% increase in the domestic production of onions. Onion imports increased slightly 1.3% in 2011, despite a 13.5% increase in the domestic production. During 2012, South Africa’s onion imports fell by 4.8%, which can be ascribed to a 6.8% increase in domestic production output. During 2013, onion imports dropped by 24.7% despite a 6.8% decrease in the domestic output. South Africa onion import has gone up by 2.3% during 2014. It was cheaper to import onions in, 2005, 2009 and 2010, as onion volumes were imported at a lesser value.
0
5000000
10000000
15000000
20000000
25000000
0
1000
2000
3000
4000
5000
6000
2005 2006 2007 2008 2009 2010 2011 2012 2013 2014
Val
ue
(Ran
d)
Vo
lum
e (K
g)
Figure 19: South Africa's onion imports from the world
Volume (Kg) Value ( Rand)
25
Source: Quantec Easydata
Figure 20 above illustrates the regions that supplied onions to South Africa over a 10 year period. South Africa imports most of the onions from the African region and Europe. Asia supplied considerable volumes of onion from 2006 to 2008. Americas supplied South Africa with onion in 2007 and 2008, in other years there were no trade between South Africa and Americas region. In 2005, 2008 and 2012, a notable volume of South africa’s imports was not allocated to any region. In 2010, South Africa’s onion imports from Africa has drastically increased whereas imports from Europe region has dropped. In 2011, imports from Europe have significantly increased while import from Africa has gone down and imports from Asia were less significant. During 2012, Africa region continued to be the main supplier of South Africa’s onion imports. In the same year there was a notable increase in onion volumes sourced from the Europe region and the volumes from Asia were less significant. Oceania region supplied South Africa with onion for the first time in a ten year period during 2013. During 2013 and 2014, Africa and Europe region remained the main suppliers of onions imported by South Africa. Figure 21 below shows the value of South Africa’s onion imports during a ten year period. Africa and Europe regions recorded high export values as high volumes onion were imported from these regions. In 2010 it was more expensive to import onion from Europe and Asia region, whereas it was cheaper to import from African region. During 2012, it was more expensive to import onion from Oceania region, followed by Europe region. Asia onion imports were by far more expensive to import during 2014 while onion imports from Africa region were cheaper.
Figure 22: South Africa's onion imports from African region
27
The above Figure 22 illustrates South Africa’s onion import from the African region. During the ten a year period, South Africa sourced onions mainly from Eastern Africa, Northern Africa and SACU countries. From 2005, to 2010. South Africa imports high quantities of onion from East African countries (Kenya) and Northern Africa (Egypt). In 2005, 2007 and 2008 notable volumes of onion were imported from SADC countries (Zambia, Zimbabwe, Mozambique and Angola). From 2010 and 2014, onion imports were mainly from SACU (Botswana, Namibia, and Swaziland) and Northern Africa regions (Egypt). In 2014, Namibia supplied 53.8% of South Africa’s onion imports while Kenya has supplied 16.1% of onion imports. At the same time onion imports from Egypt amounted to 8.8% of South Africa imports
Source: Quantec Easydata
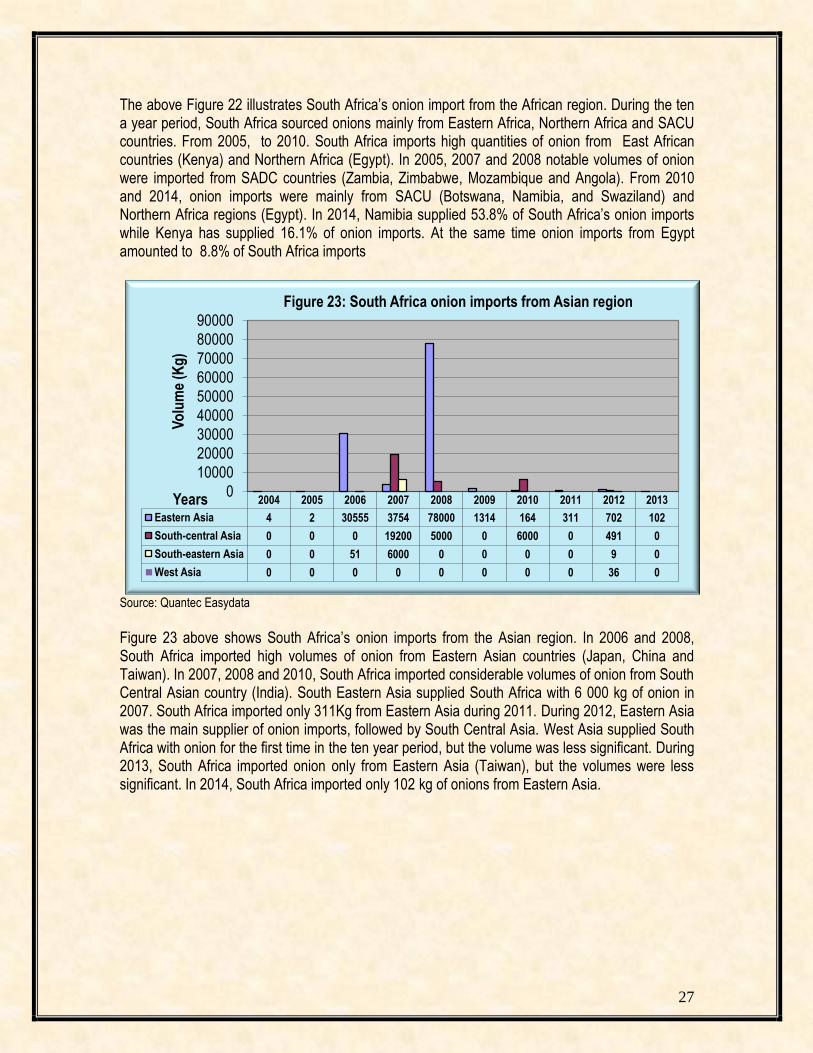
Figure 23 above shows South Africa’s onion imports from the Asian region. In 2006 and 2008, South Africa imported high volumes of onion from Eastern Asian countries (Japan, China and Taiwan). In 2007, 2008 and 2010, South Africa imported considerable volumes of onion from South Central Asian country (India). South Eastern Asia supplied South Africa with 6 000 kg of onion in 2007. South Africa imported only 311Kg from Eastern Asia during 2011. During 2012, Eastern Asia was the main supplier of onion imports, followed by South Central Asia. West Asia supplied South Africa with onion for the first time in the ten year period, but the volume was less significant. During 2013, South Africa imported onion only from Eastern Asia (Taiwan), but the volumes were less significant. In 2014, South Africa imported only 102 kg of onions from Eastern Asia.
Figure 23: South Africa onion imports from Asian region
28
Source: Quantec Easydata
Figure 24 above illustrates that from European countries, South Africa imported high quantities of onion from the Netherlands and Spain. The highest export volume was recorded in 2013 for the Netherlands and Spain it was recorded in 2011. In 2006 and 2007, a considerable volume of onion was imported from the United Kingdom. In 2011, Netherlands and Spain remained the main suppliers of onion, imported from European countries. In the same year, Italy also supplied onions to South Africa for the first time in a ten year period. During 2012, Netherlands commanded the greatest share of South Africa’s imports and its import share was 31.1%, while Spain has commanded 21.6% share. In 2013, Netherlands continued to be the main supplier imported by South Africa, followed by Spain and United Kingdom. During 2014, Belgium has supplied onions to South Africa for the first time in a ten year period. At the same time, imports from France and United Kingdom have increased while onion imports from Netherlands have notably dropped.
2.5 Processing
Processing of onions consists of canning, oil extraction, freezing and dehydration. Onions are the most often used to enhance flavour and a wide range of recipes such as casseroles, pizzas, soups, stews and may also be used as a main ingredient in their own right , for example onion soup or onion chutney. As a garnish onions are used on sandwiches and salads. In addition, onions are used as a cooking ingredient in countless recipes, and are frequently used as a condiment, on sandwich, side dish and appetizer. Onion is a staple in Indian cuisine, used as a thickening agent for curries and gravies. Onions pickled in vinegar are eaten as a snack. Onion tissue is frequently used in science education for demonstrating microscope usage and for learning about the structure of cells. Over the year there has been an increase in onion dehydration and freezing activities. The overall increase in onion processing activities can be attributed increase in demand of convenience ready to eat food. Figure 25 below shows the onion value chain tree explaining its uses while Figure 26 below illustrates the market value chain for onion.
Figure 24: South Africa's onion imports from European countries
29
Figure 25: Onion value chain tree explaining its uses.
Fresh Onion Canning Dehydration
Freezing
Oil extractions
Onion condiments
Spices Prickled onion
Fresh salads
Red onion Dye
30
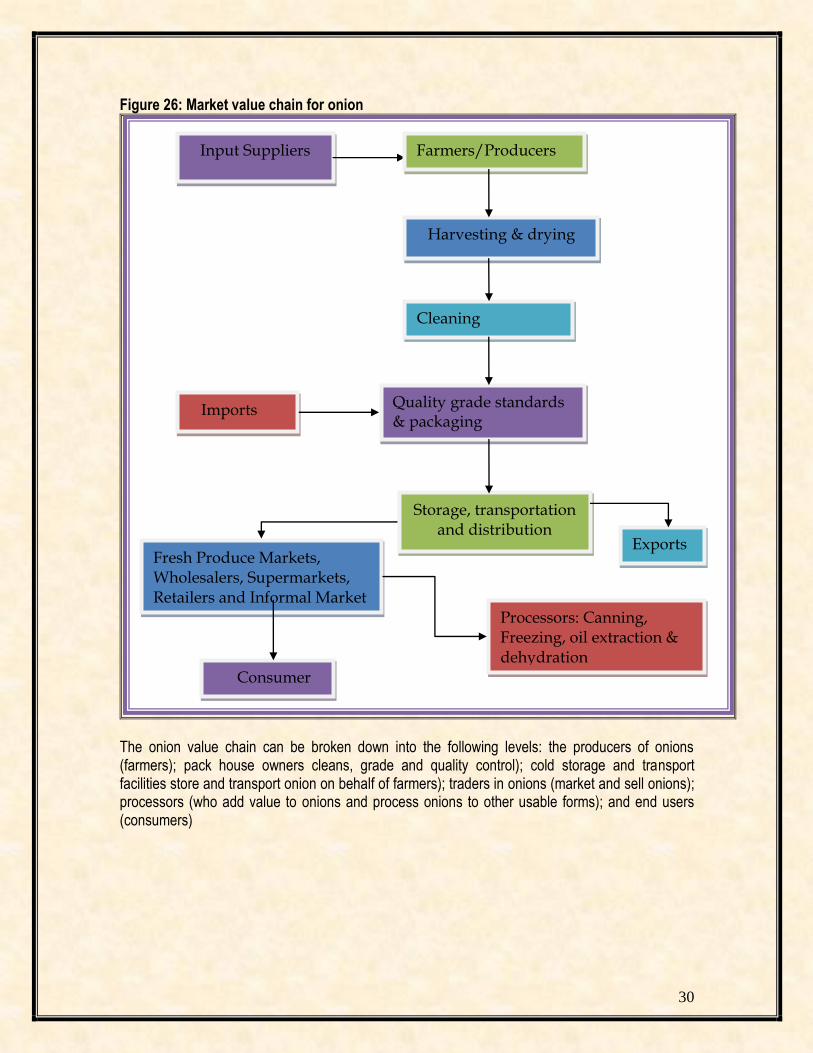
Figure 26: Market value chain for onion
The onion value chain can be broken down into the following levels: the producers of onions (farmers); pack house owners cleans, grade and quality control); cold storage and transport facilities store and transport onion on behalf of farmers); traders in onions (market and sell onions); processors (who add value to onions and process onions to other usable forms); and end users (consumers)
Input Suppliers Farmers/Producers
Harvesting & drying
Cleaning /Handling
Imports Quality grade standards & packaging
Storage, transportation and distribution
Exports Fresh Produce Markets, Wholesalers, Supermarkets, Retailers and Informal Market
Tariffs applied by the various countries to onion originating from South Africa during 2013 and 2014 are presented in Table 12. Table 12: The following tariffs were applied by various export markets to onions from South Africa
Country
Product description Trade regime description
Applied tariff
Estimated total ad valorem equivalent tariff Applied tariff
During 2014, South Africa’s onion export markets were mainly in African countries (Angola and Mozambique). Angola applies 50% tariff to onion exports originating from South Africa and Mozambique tariff is still 2.50%. These markets are protected, in spite of the existence of SADC-FTA. In 2014, South Africa exported notable percentage of onion exports to Zambia, Namibia, Botswana, Lesotho and Zimbabwe. Botswana, Namibia and Lesotho apply 0% Intra- SACU rate to onion export originating from South Africa. Zimbabwe has reduced the tariff from 40% to 0% preferential tariff and Congo has reduced the tariff from 30% to 20%. Zambia applies preferential tariff of 0% tariff to South Africa’s onion exports. South Africa’s exporters can look for onion export market in European countries (Belgium, France, Germany, Netherlands and United Kingdom) as they apply 0.00% preferential tariff to onion exports originating from South Africa, this is due to EU-Free Trade Agreement (FTA). China and Japan are the top countries producing onions and their domestic markets are protected by 13% and 8.50% tariff. India is the top onion exporter, and it applies 5% tariff.
33
3.2 Non tariff barriers
3.2.1 The European Union
Non-tariff barriers can be divided into those that are mandatory and laid out in the EU Commission’s legislature, and those that are as a result of consumers, retailers, importers and other distributions’ preferences. Product legislation: quality and marketing There are a number of pieces of EU legislation that govern the quality of produce that may be imported, marketed and sold within the EU. General Food Law covers matters in procedures of food safety and hygiene (micro-biological and chemical), including provisions on the traceability of food (for example, Hazard Analysis and Critical Control Points, of HACCP). EU Marketing Standards, which govern the quality and labeling of vegetables, are laid out in the CAP framework under regulation EC 2200/96. These regulations include diameter, weight and class specifications, and any produce that does not comply with these standards are not allowed to be sold on the EU markets (detailed lists of products and their standards can be found in the annexes to the directive). The legislation (under EU 1148/2001) also dictates that a Certificate of Conformity must be obtained by anyone wishing to export and sell vegetables in the EU, if that particular vegetable falls under the jurisdiction on the EU marketing standards, vegetables to be used in further processing needs a Certificate of Industrial Use, whilst another legislative directive covers the Maximum Residue Limits (MRL) of various pesticides allowed.
The international standard for phytosanitary measures was set up by the International Plant Protection Committee (IPPC) to protect against the spreading of diseases or insects through the importation of certain agricultural goods. The EU has its own particular rules formalized under EC 2002/89, which attempts to prevent contact of EU crops with harmful organisms from elsewhere in the world. The crux of the directive is that it authorizes the Plant Protection Services to inspect a large number of vegetable products upon arrival in the EU. This inspection consists of a physical examination of a consignment deemed to have a level of phytosanitary risk, identification of any harmful organisms and certification of the validity of any phytosanitary certificate covering the consignment. If the consignment does not comply with the requirements, it may not enter the EU, although certain organisms can be fumigated at the expense of the exporter.
3.2.1(c) Product legislation: packaging
The EU commission lays downs rules for materials that come into contact with food and which may endanger people’s health or bring about an unacceptable change in the composition of the
34
foodstuffs. The framework legislation for this EC 1935/2004. Recycling packaging materials are also emphasized under 94/62/EC, whereby member states are required to recycle between 50% and 65% of packaging waste. If exporters do not ship produce in packaging which is reusable, they may be liable for the costs incurred by the importing companies. Wood packaging is subject to phytosanitary controls (see Directive EC 2002/89) and may need to undergo heat treatment, fumigation, etc.
3.2.1. (d) Non-legal market requirements: social and environmental accountability
To access a market, importers must not only comply with the legal requirements set out above, but also with market requirements and demands. For the most part, these revolve around quality and the perceptions of European consumers about the environmental, social, health and safety aspects of both the products and the production techniques. Whilst supplying vegetables that complies with these issues may not be mandatory in the legal sense, they are becoming increasingly important in Europe and cannot be ignored by existing or potential exporters. (i) Social responsibility is becoming important in the industry, not only amongst consumers, but also for retail outlets and wholesalers. The Social Accountability 8000 (SA8000) certification is a management system based on International Labour Organization (ILO) conventions, and deals with issues such as a child labour, health and safety, and freedom of association, and requires an on-site audit to be performed annually. The certificate is seen as necessary for accessing any European market successful. The major retailers in the EU also play an important role in tackling environmental issues, which means that exporters have to take these into account when negotiating exporting arrangements.
(ii) Environmental issues are becoming increasingly important with European consumers. Consumer movements are lobbying against purchasing non-environmental friendly or non-sustainable produce. To this end, both governments and private partners have created standards (such as ISO 14001 and EUREPGAP) and labels to ensure produce adhere to particular specifications. Labels are an absolute must for exporters attempting to enter the rapidly expanding organic produce market. The EU Commission has recently adopted and EU label for identifying food produced according to EU organic standards in the directive EEC 209/91.
3.2. 1(e) Consumer health and safety requirements
Increasing consumer conscience about health and safety issues has prompted a number of safety initiatives in Europe, such as EUREPGAP on good agricultural practices (GAP) by the main European retailers, the international management system of HACCP, which is independently certified and required by legislation for European producers as well as food imported into Europe (EC 852/2004), and the ISO 9000 management standards system (for procedures and working methods), which is certified by the International Standards Organization (ISO).
3.2.2 The United States
The USDA has quality standards for vegetables that provide a basis for domestic and international trade and promote efficiency in marketing and procurement. At the same time the USDA issues
35
quality certificates based on these standards and a comprehensive grading system. Graders are located around the country at terminal markets. These certification services, which facilitate the ordering and purchasing of products by large-volume buyers, assure these buyers that the product they purchase will meet the terms of the contract in terms of quality, processing, size, packaging and delivery.
3.2.3 Asian Market Access
Japan’s agricultural sector is heavily protected, with calculations from the Organization for Economic Co-operation and Development (OECD) estimating that almost 60% of the value of Japan’s farm production comes from trade barriers or domestic subsidies. Japan uses tariff rate quotas (TRQ) to protect its most sensitive products, and reserves the right for trading many of these products (within the quota) for one or two state trading enterprises. However, these extremely protective measures apply only to some products; others are able to compete more effectively with outside competition, often on the grounds of higher quality. Perhaps the biggest barrier to trade with Japan in vegetable markets is its strict phytosanitary requirements, which have often been challenged in the WTO as having little or no scientific justification. Other measures that are being challenged include Japan’s use of fumigation on agricultural products when cosmopolitan pests (already found in Japan) are detected. Japan is also increasing its labeling requirements.
4. GENERAL DISTRIBUTION CHANNELS
There are roughly three distinct sales channels for exporting vegetables. One can sell directly to an importer with or without the assistance of an agent (usually larger, more established commercial farms). One can supply a vegetable combine, which will then contract out importers/marketers and try to take advantage of economies of scale and increased bargaining power. At the same time vegetable combines might also supply large retail chains. One can also be a member of a private or co-operate export organization (including marketing boards) which will find agents or importers and market the produce collectively. Similar to a vegetable combine, an export organization can either supply wholesale markets or retail chains depending on particular circumstances. Export organizations and marketing boards will wash, sort and package the produce.
5. LOGISTICAL ISSUES
5.1 Mode of transport
The transportation of vegetables falls within two categories – ocean cargo and air cargo – with ocean cargo taking much longer to reach the desired location but costing considerably less. Of course, the choice of transportation method depends, for the most part, on the fragility of the produce and how long it can remain relatively fresh. With the advent of technology and container improvements, the feasibility, cost and attractiveness of sea transportation have improved considerably. As more developing countries begin to export and supply major developed countries
36
markets, so the number and regularity of maritime routes, and the container vessels travelling these routes, increase. Presently South American countries like Peru benefit from the asparagus trade, which has lead to some level of economies of scale with other vegetable products, and this has enabled cheaper transport prices for their other vegetable varieties. Such economic of scale could benefit SADC countries if more producers became exporters and took advantage of the various ports which have special capabilities in handling vegetable produce (for example, the proposed terminal in Maputo).. 5.2 Cold chain management is crucial when handling perishable products, from the initial packing houses to the refrigerated container trucks that transport the produce to the shipping terminals, through to the storage facilities at these terminals (and their pre-cooling capability), onto the actual shipping vessels and their containers, and finally on to the importers and distributors that must clear the produce and transport it to the markets/retail outlets, etc. For every 10oC increase above the recommended temperature, the rate of respiration and ripening of produce can increase twice or even thrice. Related to this are the increasingly important traceability standards, which require an efficiently controlled supply chain and internationally accepted business standards. 5.3 Packaging also plays a vital role in ensuring safe and efficient transport of a product and conforming to handling requirements, uniformity, recyclable materials specifications, phytosanitary requirements, proper storage needs and even attractiveness (for marketing purposes).
6. COMPETITIVENESS OF SOUTH AFRICAN ONION EXPORTS.
Figure 27 below, it is evident that South Africa onion exports are growing faster than the world imports into Angola, Congo and Malawi. South Africa has gained market share in these dynamic markets. South Africa’s onion exports to Zambia, Lesotho, Swaziland, Botswana and Mozambique are growing slower than the world imports into these countries and these markets are regarded as a loss in the dynamic market. South Africa’s onion exports to Netherlands and France are declining while world imports are growing into these countries. South Africa’s onion exports to Namibia and Saint Helena are declining faster than the world imports in these countries. South Africa exports to Democratic Republic Congo, Zimbabwe and Seychelles are growing while as the world imports are declining. South Africa’s performance is regarded as a gain in a declining market. Figure 28 below, shows that Angola and Mozambique were the largest market for onion exports originating from South Africa. Prospective markets for exports of onion are mainly in France, Gabon and Philippines. Other smaller markets exist in the Malawi and Swaziland. However, if South Africa has to diversify its onion exports, the most lucrative market exists in Zambia and Lesotho which has increased their onion imports from the world by 141% and 58% respectively between 2010-2014 period. Saint Helena, Zimbabwe, Nigeria, Namibia and Democratic Republic of Congo have experienced a negative growth during the 2010-2014 period.
37
Figure 27: Growth in demand for onions exported by South Africa in 2014
Source: ITC Trade Map
38
Figure 28: Prospects for market diversification for onions exported by South Africa in 2014
Source: ITC Trade Map
39
7. OPPORTUNITIES AND CHALLENGES
7.1 Opportunities
Onion has natural qualities that make them attractive to consumers, particularly in today’s health-conscious market. For centuries, onions have been thought to have certain medicinal and disease prevention powers; modern science has begun to show that there may be capable on inhibiting growth of certain cancer. Onions also contain compounds that reportedly reduce blood cholesterol levels and also contain Vitamin C. The above development can increase onion demand Changing consumer trends are considered to be creating further opportunities for the onion industry. South African biggest onion producer Wildeklawer, in Northern Cape will be producing sweet onion variety which does not cause tears and they contain variety of elements which are beneficial to health. The sweet onion has successfully tempted millions in America, Europe and Australia. Sweet onion is said to contain the nutrients of serving vegetables, fat free, high in fibre, natural sugar, Calcium, Potassium, Phosphorus and Vitamin C. The producer has travelled around the world to find suitable sweet onion cultivar for South African market and is sure the sweet onion will have a major impact in South Africa.
7.2 Challenges
A major challenge for onion industry is to keep competitive against the pressure of rising production cost. The industry is also subjected to intense international competition in the market place. For most of the year, the storage onion crops set the pricing tone on the market. Since storage onions represent a majority of the crop, prices tend to be lowest around the peak of harvest.
8. INDUSTRY NEW DEVELOPMENTS
Dutoit Vegetables, based in Ceres in Western Cape, has added a new exclusive shallot to their portfolio of onions varieties which will offer South African consumers a whole food experience. Dutoit Vegetable is South Africa’s leading producer of onion. The new shallot is called Shanion, and has been developed by Dutoit Vegetables as a uniquely South African product and is expected to bring about new exquisite tastes when used in the preparation of food. Shallots are a distinct sub-species of the onion family group (Allium cepa) and although the product is very popular in other parts of the world, it has been relative scare in South Africa.
40
9. ACKNOWLEDGEMENTS
The following industries are acknowledged: National Department of Agriculture, Forestry and Fisheries Directorate: Statistics and Economic Analysis Private Bag X246 Pretoria, 0001 Tel (012) 930 1134 Fax (012) 319 8031 Trade and Industrial Policy Strategies (TIPS) P.O. Box 11214 Hatfield 0028 Tel (012) 431 7900 Fax (012) 431 7910 Quantec Research www.easydata.co.za Market Access Map www.macmap.org International Trade Centre (ITC) www.trademap.org Economic Research Service/USDA Wildeklawer Farm www.wildeklawer.com Mayford Seeds Dutoit www.dutoit .com Disclaimer: This document and its contents have been compiled by the Department of Agriculture, Forestry and Fisheries for the purpose of detailing onion industry. Anyone who uses this information does so at his/her own risk. The views expressed in this document are those of the Department of Agriculture, Forestry and Fisheries with regard to agricultural industry, unless otherwise stated. The Department of Agriculture, Forestry and Fisheries therefore, accepts no liability that can be incurred resulting from the use of this information.