54
BACHELOR THESIS
BAC
HELO
R THESIS

Preface
This paper was written in the spring of 2013. In the initial stages we had many different ideas for
the direction of the thesis. Finally, we chose sporting goods companies’ online brand
communities and how these communities could be used in an attempt to build brand loyalty.
We would like to take this opportunity to express our gratitude to all who have helped and
guided us through this process. We would first of all like to thank all the people who participated
in the survey, as well as friends and family. Without their time and interest this would not have
been possible. Caroline would especially want to thank her friends in New Zealand for giving
her perspective and comfort when in time of doubt during the writing process, far away from
home and her support system. Martin would like to thank his fellow students who have come
with bright insights and reflections during the time this paper was written. We would also like to
thank our supervisor Ulf Aagerup for his clear and constructive criticism which has helped the
writing process forward. We hope that this paper will give further insight into online brand communities and their role in
a brand loyalty building process, also that you will find the paper rewarding and interesting.
Halmstad, May 2013
Caroline Benson Martin Hedrén

Abstract
Title: Online brand communities - A Route to Brand Loyalty?
Authors: Caroline Benson and Martin Hedrén
Adviser: Ulf Aagerup
Level: Dissertation in Marketing, 15 ECTS, Spring 2013.
Keywords: Brand, Brand Loyalty, Marketing Communication, Online Brand
Communities
Purpose: The purpose of this thesis is to investigate if the use of online brand
communities helps sporting goods brands in building brand loyalty.
Frame of Reference: The frame of reference begins with a presentation of brands leading up
to brand equity and subsequently brand loyalty. The second part of this
section begins with a presentation regarding marketing communication,
the promotional mix and online communities. Finally, brand loyalty and
online community is merged together into a presentation of brand
loyalty in online brand communities.
Method: The purpose is examined through comparing secondary data with
quantitative collected data about community members’ purchasing
behaviour prior and after joining a sporting goods brand community.
Empirical Framework: In this part the results of the online questionnaire is presented.
Conclusion: The survey concludes that sporting goods brands’ online brand
communities have a positive impact and suggestions on further research
are presented.
Contents 1. Introduction ............................................................................................................................... 5
1.1 Research Background ............................................................................................................ 1 1.2 Problem Discussion ............................................................................................................... 2 1.3 Research Question ................................................................................................................. 3 1.4 Purpose .................................................................................................................................. 3 1.5 Delimitations ......................................................................................................................... 4 1.6 Definitions ............................................................................................................................. 4
1.6.1 Sporting Goods Brands ................................................................................................... 4 1.6.2 Online Brand Communities ............................................................................................ 4 1.6.3 Brand Equity ................................................................................................................... 4 1.6.4 Brand Loyalty ................................................................................................................. 4
1.7 Disposition ............................................................................................................................. 4
2. Frame of References .................................................................................................................. 62.1 Brands .................................................................................................................................... 6
2.1.1 What is a Brand? ............................................................................................................. 6 2.1.2 Brand Equity ................................................................................................................... 7 2.2.1 Promotion Mix .............................................................................................................. 11 2.2.2 Direct Marketing - Online Marketing ........................................................................... 12 2.2.3 Online Brand Communities .......................................................................................... 12
2.3 Brand Loyalty in Online Brand Communities ..................................................................... 14 3. Method ...................................................................................................................................... 15
3.1 General Choice of Method .................................................................................................. 15 3.2 Method Approach ................................................................................................................ 16
3.2.1 Quantitative Approach .................................................................................................. 16 3.3 Method of Collecting Empirical Data ................................................................................. 17
3.3.1 Primary Data ................................................................................................................. 17
3.3.2 Secondary Data ............................................................................................................. 19 3.4. Selection ............................................................................................................................. 19
3.4.1. Selection of Sporting Goods Brands ........................................................................... 19 3.4.2 Selection of Marketing Communications Channels ..................................................... 20 3.4.3 Selection of Population and Respondents .................................................................... 21
3.5 Operationalization ............................................................................................................... 23
3.6 Credibility ............................................................................................................................ 23 3.6.1 Validity and Reliability ................................................................................................ 23
3.7 Criticism .............................................................................................................................. 24 3.7.1 Criticism of Sources ..................................................................................................... 24 3.7.2 Criticism of Methodology ............................................................................................ 24
4. Empirical Framework ............................................................................................................. 26
4.1 Respondents Overview ........................................................................................................ 26 4.2 Attitudinal Loyalty .............................................................................................................. 26
4.3 Behavioural Loyalty ............................................................................................................ 27 4.4 Mean Value and Confidence interval .................................................................................. 30
5. Analysis .................................................................................................................................... 31
5.1 Analysis of Questionnaire ................................................................................................... 31
5.1.1 Attitudinal Loyalty ....................................................................................................... 31 5.1.2 Behavioural Loyalty ..................................................................................................... 32
6. Conclusion ................................................................................................................................ 36

6.1 Further Research Suggestion ............................................................................................... 37
7. References ................................................................................................................................ 38
8. Appendix .................................................................................................................................. 43
8.1 Questionnaire ....................................................................................................................... 43
List of Figures and Tables
Figure 1: Disposition
Model 1: Brand Equity Model
Model 2: How Strong Brands Generate Greater Profitability
Model 3: Brand Equity and Brand Loyalty Pyramid model
Model 4: Elements in the Communications Process
Model 5: From Offline Community to Online Community
Model 6: Induction and Deduction in Social Science Theory
Model 7: Operationalization of Brand Loyalty
Empirical Charts and Tables
Chart 1: Memberships
Chart 2: Response to Branded Goods Being Temporarily Unavailable
Chart 3: Proportion of Community Branded Goods
Table 1: Respondents’ Trust in and Belonging to Communities
Table 2: Community Members’ Word-of-Mouth
Table 3: Recurrence of Degrading Talk and Intention to Continue Buying the Brand Long-Term
Table 4: Respondents’ Buying Behaviour
Table 5: Mean Value and Confidence Interval

1
1. IntroductionIn this chapter the background to our study is presented followed by the discussion leading up to our
research question. The purpose and limitations are presented next and the chapter is concluded with a
simple approximation of the research paper.
1.1 Research Background The first modern brands appeared in the 18th century and is said to have originated from the
industrial revolution. It became increasingly important for manufacturers to create identifiable
names and symbols in able to differentiate their products from competitors’ products (Melin,
1999, Ch. 1). Brands are just as relevant today, if not more, when according to Mörling and
Strannegård (2004) brands have gone from being merely a mark of origin or producer to also
become the sign that is consumed by the customer, often as aesthetic expressions. Hence brands
are not just markers of identification anymore, but also products in themselves.
Melin (1999, Ch. 1) state that products are today becoming increasingly similar and few things
help consumers to separate products from each other. The abundance of products has also forced
companies to try to differentiate similar product and create a sense of uniqueness (Mörling and
Strannegård, 2004). Janonis, Dovaliené and Virvilaité (2007), explain how shifts in consumer
patterns, changes in competition intensity, economical- and political systems, globalization and
the rise of new technologies, has come to test companies and challenge them in unexpected
ways. In order to stand out, companies strive to become and remain unique and unlike their
competitors. By using brands to do this, companies make it hard for competitors to mimic them
as brands are hard to copy (Janonis, et al., 2007). The value of an established brand has a lot to
do with the fact that it is very resource demanding to build brands, and even more now than only
a few decades ago, according to Aaker (1991, Ch. 1). This is linked with higher costs for
advertising and distribution, as well as the increasing number of brands (Ibid). According to
Mörling and Strannegård (2004), there has also been a shift in focus, from tangibles to
intangibles, where many corporations are outsourcing their manufacturing to enable them to
focus on their new core activity, in other words; going from the “production of things to the
production of images” (pp.224). According to Interbrand (2012) the intangible assets of a
company will help create brand equity and companies like Coca Cola, Google and Apple have
intangible assets that are worth substantially more than their other measurable tangible assets.
In order to build value of a brand, brand equity, a company can strive to create brand loyalty
among their consumers. Nam, Ekinci and Whyatt (2011) explain that brand loyalty traditionally
is referred to as customers’ intentions towards a repeat purchase of a product or service. Möller-
Jensen and Hansen (2006) claim that firms that have large groups of loyal customers have shown
to have large market shares that in turn have shown to generate higher rates of return on
investment. High brand loyalty is also associated with acceptance of product extensions,
shielding from competitors’ price changes, and creating barriers to entry for competitive firms
(Lazarevic, 2012).
To use social media as part of companies’ marketing communication has become increasingly
popular and is even starting to replace traditional media, says Bruhn, Scoenmueller and Schäfer

2
(2012). The most commonly used new media are social networking websites. Online brand
communities, often established by admirers of a specific brand or the company itself (Park and
Cho, 2012) also serve as important platforms where millions of consumers worldwide are
connected and exchange ideas, opinions, and information. Online communities are gaining
significantly in popularity and importance around the world and memberships are growing every
year, making it an important source of information for companies to tap into as well as having
under a watchful eye as the information in the communities create strong word-of-web effects
that influence both sales and brand images (Muniz and O’Guinn 2001). The reasons for people
participating in brand communities are according to Hur, Ahn and Kim (2011) either that they
wish to exchange information with community members or that it is the actual interaction with
members that attract them.
There has also developed a trend where consumers become “fans of brands on social media
platforms and using social media as […] source of information about brands leads to the
assumption that social media […] exerts an important impact on a brand’s success” (Bruhn et al.,
2012) pp. 770. This has made more companies interested and the 1.54 billion US dollars that
companies invested in 2008 in the development and support of social media communication is
expected to increase to more than 3 billion US dollars per year by 2013, according to Kozinets,
Valck, Wojnicki and Wilner (2010). This trend combined with the fact that the number of
Internet users in the world is growing steadily, with close to 35 percent of the worldwide
population, and more than 70 percent in developed countries, with Internet access at home
according to the International Telecommunication Union (2012); marketing through social
medias and online communities as well as companies’ presence at these type of platforms are
increasing in importance.
1.2 Problem Discussion The sporting goods industry is an interesting area to study based on a number of various reasons.
Firstly, the sheer size of the industry makes it interesting, predicted by Global Information, in
partnership with Global Industry Analysts, to top $180 billion USD a year by the year 2018. The
market is driven by a trend toward healthier, more active lifestyles, with older demographics and
women becoming more active (Reportlinker, 2012). Moreover, it is said to be a booming
industry where studies show how consumers are continuing to spend large amounts of
discretionary income on sports and fitness (Global Information, 2013). According to Forbes
(2012), the industry’s two major players, NIKE and adidas, are both placed among the top 600
biggest companies in the world when looking at metrics such as sales, profit, assets and market
value. The reason for the substantial size of the industry might be explained by Ratten and Ratten
(2011) who states that the sports industry concern and involve many people around the world,
both people that might participate themselves but also people who watch or participate in the
activity in other ways. According to Tong and Hawley (2009) the sportswear industry is also
highly competitive and is known for having sport manufacturers that are fighting heavily with
establishing long term relations with the consumers of sport goods, and where branding remains
the largest source of competitive advantage due to the nature of the products. The sports industry
manufacturers have come to a stage where they provide the consumers with a basic need and an
added value in terms of materially added value, which have become increasingly similar among
the various products that are offered from the manufacturers. We can see that this development is
analogue to what Melin (1999) described when claiming that products today are becoming
increasingly similar. Moreover, it is generally recognized that the abundance of products are

3
always available for purchase. Consequently, possessing a strong brand is crucial within the
sports industry and Tong and Hawley (2009) argue that the key to success is to create a unique,
favourable, and strong brand image to provide customers with a reason to buy the brand and then
work to maintain their loyalty and gain repeat purchase. Knowing that brand loyalty is crucial for
creating a strong brand, this provides us with yet an argument for highlighting this concept
within the context of the sporting goods industry. At the same time, a new phenomenon has appeared in the sports world in the last couple of
years. The biggest sport goods manufacturers have developed online brand communities within
the brand website. This has been made possible thanks to advances in information and
communication technologies, particular Internet and mobile related ones, and these advances
present both threats and opportunities in customer relationship management, in which brand
communities are receiving a lot of attention (Ganesh Arnold and Reynolds, 2000), which from a
marketer’s point of view make them interesting to study. Because these communities have great
relevance for marketers and understanding these communities may allow the obtaining of
valuable information in order to develop successful long-term-oriented relationships with
customers, online brand communities will have a central role in this thesis.
In the online brand communities within the sporting goods industry, members are given the
opportunity to interact with each other, follow their physical progress in the specific sports they
practise and also receive support for the hardware products that they might have bought from the
community brand. By becoming members of an online brand community, it is supposable that
bonds between the consumer and the specific brand could strengthen. In other words it is likely
that consumers, as a result of their connection with the brand through the online brand
community, could become more loyal to the brand in which they are members and that they in
their future purchase situations would choose sport articles from this specific community brand
instead of competitive brands. A study by Gummerus, Liljander, Weman and Pihlström (2012)
has shown that brand communities, not specified to online communities nor the sporting
industry, affects consumer loyalty positively and strengthens relationships. However, the study
was not specific to the sporting goods industry.
As a result of this on-going battle of loyal consumers between the biggest sports manufacturers,
and the emerging development of these online brand communities, we want to examine online
brand communities’ possible positive effect on customers brand loyalty and in what direction
this loyalty would be directed.
1.3 Research Question How do online brand communities affect consumers’ brand loyalty to sporting goods brands?
1.4 Purpose The purpose of this thesis is to investigate if the use of online brand communities helps sporting
goods brands in building brand loyalty.
4
1.5 Delimitations We limit this research paper to study only sporting goods brands. We chose this industry because
it is an industry we find interesting, where products often are generic and brands hence become
important to distinguish companies from each other. Since we want to examine if sporting goods
brands´ online brand communities help in building brand loyalty we are limiting ourselves to
only study brands which offer an online brand community for its consumers.
1.6 Definitions
1.6.1 Sporting Goods Brands
Companies that offer branded sporting gear in terms of; apparel, footwear, equipment,
accessories and services.
1.6.2 Online Brand Communities
An online brand community is a place on the specific brand’s website where people can meet
and interact while a brand has a central role.
1.6.3 Brand Equity
A brand's added value derived from the goodwill and name recognition that it has earned over
time.
1.6.4 Brand Loyalty
“Positive feelings towards the brand and intense dedication to purchase the same product/service
repeatedly now and in the future from the same brand, regardless of competitors’ actions [...].”
- Lazarevic (2012) pp. 48.
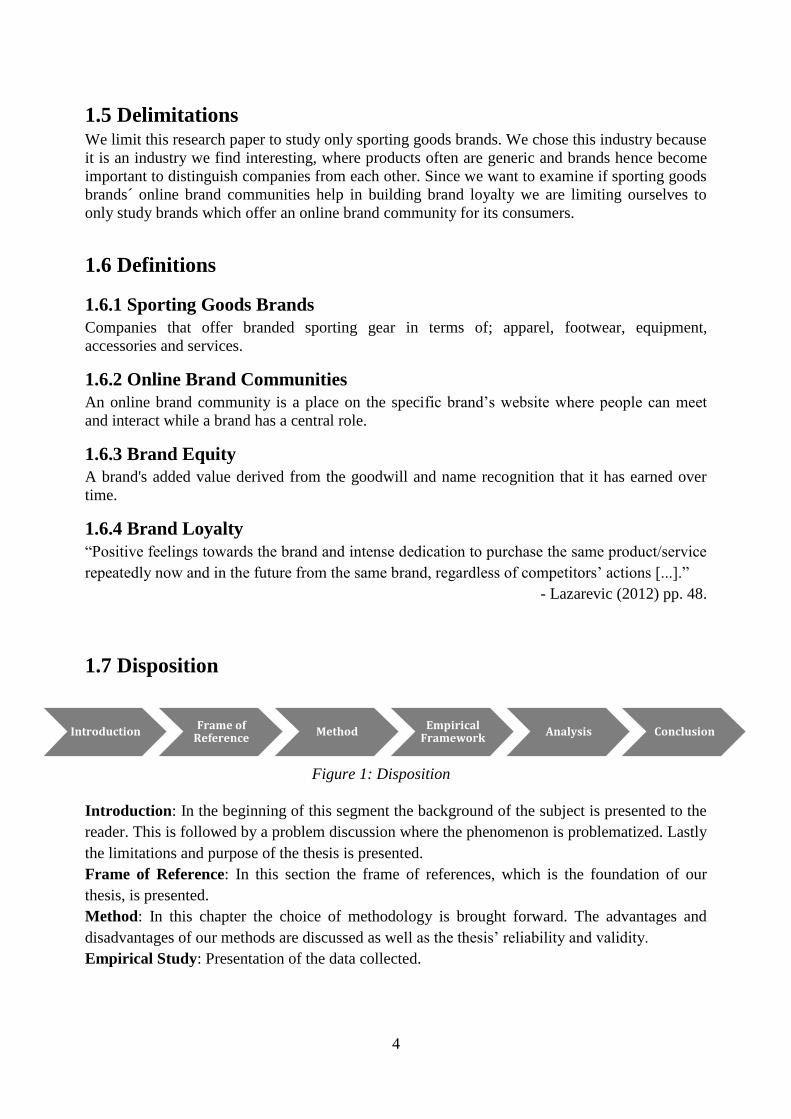
1.7 Disposition
Figure 1: Disposition
Introduction: In the beginning of this segment the background of the subject is presented to the
reader. This is followed by a problem discussion where the phenomenon is problematized. Lastly
the limitations and purpose of the thesis is presented.
Frame of Reference: In this section the frame of references, which is the foundation of our
thesis, is presented.
Method: In this chapter the choice of methodology is brought forward. The advantages and
disadvantages of our methods are discussed as well as the thesis’ reliability and validity.
Empirical Study: Presentation of the data collected.
Introduction Frame of
Reference Method
Empirical Framework
Analysis Conclusion

5
Analysis of Empirical Data: In this segment the frame of reference and our empirical data will
be analysed.
Conclusion: In this chapter we will present our findings as well as answer our research question.
We will also give suggestions for further research in the subject.

6
2. Frame of References In this chapter our applied theories are presented. A general look upon branding and marketing communication will
be presented, before diving deeper into specific related areas. This passage is ultimately concluded with a presentation
surrounding brand loyalty in brand communities.
2.1 Brands
2.1.1 What is a Brand?
“As we watch television, open the mail, or go for a stroll, we now live in a world of brands”
- Kevin Roberts, Lovemarks pp. 31
The American Marketing Association, AMA, define a brand as; “A name, term, design, symbol
or any other feature that identifies one seller's good or service as distinct from those of other
sellers...” (AMA, 2013). Philip Kotler, one of the world’s foremost experts on branding define
brands as; “A name, term, sign, symbol or design, or a combination of these that identifies the
goods or service of one seller or group of sellers and differentiates them from those of
competitors.” (Kotler, Armstrong, Wong, Saunders, 2008, p. 511). In addition, a brand is a sign
of quality and for consumers, brands help to identify a certain product, reduce search costs and
perceived risk, according to Carroll (2009) and hence it becomes a shortcut in decision making
process. Mörling and Strannegård (2004) and Rosenbaum-Elliott, Percy and Pervan (2011, Ch.
2) also state that brands can help consumers to reinforce their individuality as brands provide
meaning.
When it comes to brands there are two major views in looking at its added value for a company;
brand value and brand equity. The concepts are very different, yet intricately linked together.
Brand value is what the brand is worth to management and shareholders, whereas brand equity is
what the brand is worth to a customer (Tiwari, 2010).
Kotler et al. (2008, ch. 11) argue that brand building can generate strong brands and that a strong
brand in turn can contribute with many advantages. The authors mention that brands can help
make the customers decision-making process more efficient as well as saying something about
the quality of the product. The brand also simplifies for the company when widen their product
range, entering new markets and add to the customers’ identity building. Rosenbaum-Elliott et
al., (2011, Ch. 5) state that strong brands also can contribute with financial value as they can
sustain future sales and allow for higher price points, as well as creating low price elasticity,
meaning that price changes affect sales very little. A strong brand also allow for higher margins
versus competitors and acts as a barrier for new competitors, according to Rosenbaum-Elliot, et
al. (2011, pp. 92). To become a competitive advantage however, a brand has to be managed
correctly and must show the companies uniqueness and added value (Janonis, et al., 2007).

7
2.1.2 Brand Equity
During the past decades, brand equity has had a central role in the discussions of both
practitioners and academics (Tiwari, 2010), however Salinas (2009) explain that there is
practically no consensus on the meaning of the concept brand equity, nor how corporations best
measure the value of brands.
Brand equity creates value, not only for the brand owner, but also for the consumers (Mörling
and Strannegård, 2004). Rosenbaum-Elliot et al. (2011, Ch. 5) argue that to understand brand
equity you must look at it from consumers’ point of view because it is them who have the
greatest impact on a brand’s success. It is the consumers’ view of added value which will
generate a preference towards a specific brand, and the financial consequences of brand equity
will follow from this perception of an added value. Keller (2008, Ch. 2) argue that customer-
based brand equity is created when customers have high levels of awareness and familiarity with
a brand and when they have strong favourable, and preferably unique, associations with regards
to the brand. The outcome of brand equity is less vulnerability to competitive marketing actions
and marketing crises, and higher margins. Brand equity does not occur overnight though,
according to Phillips (2003), who claims that it is a complicated process, where the final goal is
to make brands look as they are number one which will transcend into the consumers state of
mind and generate a more advantageous market position. This relative advantage in consumer’s
mind, should according to Aaker (1996b), mean that a brand’s market share should increase, or
at least not decrease.
A definition of brand equity which has been widely accepted though is David Aaker’s. Aaker
(1996a) defines brand equity as “a set of brand assets and liabilities linked to a brand, its name
and symbol, that add to or subtract from the value provided by a product or service to a firm
and/or to the firm's customers” (pp.7). These assets and liabilities fall under one of the following
categories (Model 1); brand awareness, perceived quality, brand associations and brand loyalty
(Aaker and Joachimsthaler, 2000, Ch. 1).
Model 1: Brand Equity Model by Aaker and Joachimsthaler (2000) pp. 17.
Brand Awareness
It may seem obvious that customers must be aware of a brand to be able to prefer it, but brand
awareness’ importance to brand equity is more than that, says Rosenbaum-Elliott et al. (2011,
Ch. 5). According to the authors name recognition has been considered by business managers to
be among the most important things that contribute with a competitive advantage. The
Brand Equity
Brand Awareness
Percieved Quality
Brand Associations
Brand Loyalty

8
importance is due to the fact that when shopping, customers are more likely to remember
familiar brands than remember campaigns or details of new brands according to Rosenbaum-
Elliott et al. (2011, Ch. 5). Melin (1999) continuous in saying that awareness is a necessary step
towards brand association and hence, towards consumers building preferences to a certain brand.
A lot of customers also have the impression that a well-known product is a good product and
therefore becomes a product of continuity. Brand awareness is important says Aaker (1991, Ch.
3), because a recognized brand will more often than not, be chosen over an unknown brand.
Pelsmacker, Geuens, Bergh (2010) say that deep awareness indicates that the brand has a strong
link to its product category and benefits from a high top of mind awareness. To make consumers
conscious of one’s branded goods is harder than it seems though, says Melin (1999), because of
the vast supply of goods in the marketplace. The author divides brand awareness into two sub-
categories; brand recognizing and brand recall. Brand recognition is explained as consumers’
ability to confirm prior exposure to the brand when given the brand as a cue, whereas brand
recall is consumers’ ability to retrieve the brand from memory spontaneously after been given a
product category for example (Keller 2008, Ch. 2) and Melin (1999).
Brand Associations
Brand associations help build brand equity as the underlying value of a brand often is based on
specific associations connected to the brand, and the association is anything which is linked in
memory to a brand (Aaker, 1996a, Ch. 6). The associations create value by for example helping
consumers to process information and the company to differentiate the brand and creating
positive feelings towards the brand (Aaker, 1991, Ch. 5). People, personalities and lifestyles are
used to create associations with the brand and can among other things, help build brand
confidence, for instance if a respected celebrity is linked to a brand (Aaker, 1996a, Ch. 1).
Favourable associations according to Keller (2008) “are those that are desirable to consumers -
convenient, reliable, effective, efficient, colourful - successfully delivered by product, and
conveyed by the supporting marketing program” pp. 58. The author also argues that two factors
which strengthen associations are its personal relevance and the consistency over time. Factors
that in general affect strength and recall ability of a brand association are brand attributes and
brand benefits. Benefits being the personal value and meaning that consumers attach to the
product, and attributes the actual features that characterizes a product (Keller, 2008, Ch. 2).
Aaker (1996a, Ch. 1) argue that brand associations are driven by the brand identity, that is what
the organization wants the brand to stand for in the customer’s mind and Rosenbaum et al.
(2011, Ch. 2) continues in saying that sets of associations, usually organized in some meaningful
way, forms a brand image, which is what consumers feel the brand stands for.
Perceived Quality
It is customers’ perception of quality or superiority and not the actual product quality, in
relations to competitive products that is referred to as perceived quality in the brand equity
creating process, explains Zeithaml (1988). Aaker explains that even though perceived quality is
a brand association, it has been elevated to the status of brand asset because it is the only one of
the brand associations which has been shown to have an impact on the financial performance of
a brand (Aaker, 1996a, Ch. 1).
Perceived quality is important says Aaker (1991), because perceived quality will “directly
influence purchase decisions [...] especially when a buyer is not motivated or able to conduct a
detailed analysis” (pp. 19). However, it provides value to brands in many different ways,

9
according to the author. The perception of high quality, gives consumers a good reason to buy
the brand and help with differentiation, as well as giving the company room to charge a premium
price. Visual attributes such as name, packaging and promotions also affect the perceived quality
with the consumer, say Melin (1999).
Brand Loyalty
One of the most important factors believed to explain consumer brand choices, the concept of
brand loyalty is widely discussed within the field of marketing and consumer behaviour (Moller-
Jensen and Hansen, 2006). Wood (2000) even says that a brand’s value is solely determined by
the degree of brand loyalty, since this indicates future cash flow. Rosenbaum-Elliot et al. (2011)
and Aaker (1996a, Ch. 1) argue that high brand loyalty will generate greater profitability for a
brand. The authors mean that high loyalty will create strong brands which in turn will allow for
higher margins and price points as well as give the brand trade acceptance and low price
elasticity which will help companies to maximize their revenues (Model 2).
Model 2: How Strong Brands Generate Greater Profitability. Rosenbaum-Elliott et al. (2011) pp. 91.
According to Rowley (2005) another benefit of customer loyalty is reduced cost for attracting
new customers since it is far more expensive to gain new customers than keeping existing ones
and a brand which has gained loyalty reduces their brands vulnerability towards competitors.
According to Lazarevic (2012) loyal long-term customers also spend more money with the firm,
adding to the attractiveness surrounding brand loyalty. Keller (2008, Ch. 15) on his hand claim
that brand loyalty reduces marketing cost, give companies trade leverage and extra time to
respond to competitive threats, and help attracting new customers.
However, even though behavioural loyalty often gets the most attention, loyalty does not
necessarily have to be behavioural where customers buy products, but instead attitudinal. This
distinction implies that loyalty includes a psychological component, based on consumer feelings
that motivate an attachment to the products, and a behavioural aspect, based on frequency of
visits to a store or the percentage of expense for example, says Casaló et al. (2007). Lazarevic
(2012) explain that the definition of attitudinal loyalty implies that loyalty is a state of mind, and
customers are loyal to a brand or a company merely by having a positive or preferential attitude
toward it. Lazarevic (2012) combine the two variations of loyalty into the following quote:
“positive feelings towards the brand and intense dedication to purchase the same product/service
repeatedly now and in the future from the same brand, regardless of competitors’ actions or
changes in the environment.” pp.48. Rosenbaum et al. (2011) put it simply when saying that
brand loyal consumers have a reluctance to switch brands. However, because measuring the
psychological aspects of loyalty is usually difficult most scholars consider loyalty from a
behavioural point of view, which is the most habitual research practice (Casaló, Flavián, and
Guinalíu, 2007). It must be said however, that consumers might buy a certain brand continuously
out of habit, meaning without being brand loyal. It could be limited range of products which
High loyalty
STRONG BRANDS
* Trade acceptance
* Higher price points
* Higher margins
* Low price elasticity
GREATER PROFITABILITY

10
1. Committed buyer
2. Like brand
3. Satisfied buyer with switching cost
4. Satisfied buyer
5. No brand loyalty
Brand Equity
Brand Awareness
Percieved Quality
Brand Associations
Brand Loyalty
force consumers to buy a certain brand or the cost of switching to another brand may be too high
(Rosenbaum-Elliott et al., 2011).
Ganesh et al. (2000) classify loyalty behaviours into two categories, active loyalty behaviour
which includes positive word-of-mouth and additional sales, whereas passive loyalty includes
service maintenance. Melin (1999) however, talks of five levels (Model 3) and claim that brand
loyalty should not be consider as an absolute, where you are either loyal or not, but rather
something that has a span going from not loyal at all to very passionately loyal. The author
subcategories brand loyalty into a loyalty pyramid where every level reflect customers different
bond to the brand.
Model 3: Brand Equity Aaker and Joachimsthaler (2000) pp. 17 and Brand Loyalty Pyramid.
Adapted from Aaker (1991) pp. 40.
On the lowest level in the pyramid consumers are non-loyal and do not have any bond to the
brand. Brands have an inferior role in their decision-making process and they do not care at all
about which brand they buy, instead they either buy what is available or on sale. On the second
level customers are satisfied or at least not dissatisfied with the product. This means less risk of
them switching to another brand. On the second level customers are more likely to buy a certain
brand out of a habit. On the third level customers are satisfied, but if they were to switch there
would be a switching cost in time, money and risk. These customers are usually referred to as
“switching cost-loyal”. On the fourth level consumers really like the brand, and this sympathy
could have been based on perceived quality or past experiences with the brand. Customers in the
category are often called “brand friends”. On the fifth and final level customers present the
highest level of brand loyalty and they often feel an obligation towards the brand. Consumers
identify strongly with the brand as well, and feel proud of it and could even stand up for and

11
defend it. They are also more than happy to recommend it to others (Melin, 1999) (Aaker, 1991,
Ch. 1).
2.2 Marketing Communications
Pelsmacker et al. (2010) state that “Marketing communications are the voice of a brand” pp. 72.
The authors argue that the role of marketing communication is to inform, persuade and remind
consumers of the brand’s core in an attempt to engage consumers in a dialog to build
relationships. Melin (1999) refer to marketing communication as the process when the
positioning of a brand is communicated.
Model 4: Elements in the Communications Process. Kotler and Keller (2012) pp. 502.
Kotler and Keller (2012, Part 7) talk about a macro model (Model 4) with nine key factors in
effective marketing communication. The sender and the receiver represent the two major parties
in the process, whereas message and media are the two major tools. Encoding, decoding,
response and feedback represent the four communication functions, and the last element is noise
which demonstrates the random and competing messages that can interfere with the intended
communication. In addition, people’s values, culture, upbringing, religion etc. affect how the
intended message is perceived. This collection of factors is often referred to as the “black box”
(Solomon. 2009, Ch. 7), which needs to be taken into consideration in the marketing
communication process.
Important in marketing communication is to emphasize the advantages of differentiation that
forms the basis of the positioning. The concept of the positioning has to permeate all marketing
communication, that is to say, the marketing communication has to be consistent (Melin, 1999
pp. 101).
2.2.1 Promotion Mix
The specific blend of advertising, sales promotion, public relations, personal selling and direct
marketing tools form the company´s total promotion mix, also referred to as the marketing
communications mix. These tools must be well-utilized in order to communicate the company's
value propositions to the customers. Good communication is a vital part in a company´s effort to

12
build profitable customer relationships in the same way as good communication is essential in
building and maintaining any kind of relationship (Kotler, 2008 pp. 691).
While definitions of new media vary, these often include electronic communication channels
such as social networking web sites, blogs, chat rooms, discussion boards, and customer service
rating web sites, all of which can provide important links and opportunities for a two-way
communication between marketers and consumers, according to Bernhardt, Mays and Hall,
(2012).
2.2.2 Direct Marketing - Online Marketing
Direct Marketing refers to “Direct communications with carefully targeted individual customers
to both obtain an immediate response and cultivate lasting customer relationships” (Kotler, 2008,
pp. 823). One branch of direct marketing is online marketing which is the fastest growing sort of
direct marketing. Due to the technological advances a digital age has been created in which the
use of Internet and other strong new technologies have a huge impact on buyers and marketers
(Kotler, 2008, pp. 839).
Early in its existence the Internet was seen as an opportunity for marketers to communicate with
consumers, and engage them in two-way communications. Recently, it has become apparent
though, that consumers are using the Internet to communicate with each other, and an estimated
40 million people worldwide participate in some form of virtual community (Sicilia and Palazón,
2008).
The new communication media has given social marketers increased ways of reaching target
consumers in a more personalized way and directly engage consumers in their natural settings
such as home, work, or schools, where the purchasing decisions are made. When marketers can
reach consumers at their critical behavioural decision points promotions will have the greatest
impact on consumers and the implication are that the place where consumers meet promotions
and brands can shift from restrooms and grocery stores, to being in people’s natural settings by
reaching them via computers, mobile phones or tablets that are accessible to them almost
anytime and anywhere. In short, social marketers can now leverage new media to engage large
numbers of consumers more deeply and closer to the right place and right time than ever before
(Bernhardt et al., 2012).
2.2.3 Online Brand Communities
An online community is a specialized, geographically dispersed community based on a
structured and dynamic network of relationships among participants sharing a common focus.
Muniz and O’Guinn (2001) define it as a group of people with common interests in a brand and
who communicate with each other online in a brand platform provided by the company. Sicilia
and Palazón (2008) argue that since the Internet overcomes geographical limitations the
restrictions that have hindered the development of communities offline does not apply to the
online communities (Model 5). Through the creation of a virtual space, a site can become a
meeting point where members develop their relationships in an environment where the brand is
ever present.

13
Model 5: From offline community to online community. Adapted from Sicilia and Palazón (2008)
pp.258.
Muniz and O’Guinn (2001) envision a brand community as a customer to customer to brand triad
formed by two types of relationships, those established between the brand and the customers,
and those that are created between community members. The authors state that it is impossible
for a brand community to be successful without interaction and relationships between members.
In fact, the connection members feel for each other could be even more important than the
connection the members feel towards the brand. Shang, Chen and Liao (2006) suggest that
consumers join communities in order to learn from others’ experiences or acquire information,
and information searching has been proposed to be the main purpose for members’ participation
in communities.
Members of online communities usually register using their real names and information, such as
email address, telephone number, and residential address and so on. They are very involved in
the exchange of favour-for-favour interactions which characterise real-life social relations.
General activities carried out by brand community members are posting comments on discussion
pages and having other daily interactions with other members (Royo-Vela and Casamassima,
2011). This shared information among community members create strong word of web effects
which significantly influence sales and the brand images, according to Park and Cho (2012).
Muniz and O’Guinn (2001) argue that there are at least three core components of a community.
The most important one is consciousness of kind, which represents the deep connection that
members feel toward each other, and the collective sense of difference from others outside of the
community and an opposition to other brands Bagozzi and Dholakia (2006).

14
The second indicator of community is the presence of shared rituals and traditions, often referred
to as group norms. These protect the community’s shared history and culture. The third
component of community is a sense of moral responsibility, a sense of duty or obligation to the
community and its members. This sense of responsibility can drive some members to collective
action in times of threat to the community, says Muniz and O’Guinn (2001).
2.3 Brand Loyalty in Online Brand Communities Members of a brand community are according to Muniz and O’Guinn (2001) supposed to be
more loyal to the own brand, as well as substantially less loyal to other competing brands. The
authors describe the phenomena as oppositional brand loyalty and say that it can lead to
enhanced intergroup stereotyping, trash talk targeted at members outside the community, and
emotional pleasures from news about a rival brand’s miss fortune. In some cases, oppositional
brand loyalty can turn into active consumer resistance or anti-brand communities, say Felix
(2012).
To say that an online brand community would enhance brand loyalty towards the brand is not
especially controversial. Many theories would support this claim. For example, Mavis, Noble
and Noble (2012) say that online brand communities may strengthen brand loyalty. However,
Won-Moo, Kwang-Ho and Kim (2011) have thoroughly investigated this matter even deeper by
concluding that the degree of commitment to an online brand community determines how strong
the brand loyalty will be. In other words, solely being a member of an online brand community
might not result in particularly high brand loyalty, but members being more committed to an
online brand community would show a higher degree of brand loyalty.
In addition to this, Won-Moo et al., 2011, claims that there are two factors which in turn
determine how committed a member will be to the online brand community. High levels of trust
and ability to affect the online brand community will result in a high level of commitment
towards the online brand community, and consequently a high level of brand loyalty.

15
3. Method In the following paragraphs our choices regarding our methodology is presented and discussed. We will
also address any advantages and disadvantages our choices have entailed and the chapter will conclude
with sections relating to reliability, validity and criticism.
3.1 General Choice of Method Jacobsen (2002, Ch. 1) state that descriptive and explanatory research are the most commonly
used research types. A descriptive research is used when authors want to examine a subject
thoroughly and get a better insight into how the reality of a phenomenon is. The explanatory
research aims to understand and explain why a phenomena occurs, and try to find correlations
between variables (Mattson and Örtenblad, 2008). The purpose of this research paper is to
examine if sporting goods companies can use online social communities to build brand loyalty,
and therefore a descriptive research method was chosen.
Patel and Davidson (2011) claim that there are three ways in which you can link theory to
reality; deduction and induction, as well as abduction.
Model 6: Induction and Deduction in Social Science Theory. Lee and Lings (2008) pp. 7.
The deductive way means that you with support from theory create hypothesis which you then
test in reality (Birkler, 2008, Ch. 4). The disadvantage of using this alternative is that the scholar
often look for information which support theories that has been read and miss out on finding new
information in the field (Patel and Davidson, 2011). The inductive way is essentially the opposite
of the deductive, says Lee and Lings (2008, Ch. 1) and instead of going from theory to empirics,
the inductive way investigate how something occurs in reality and then see what has been written
in the subject (Model 6). The benefits will be that the scholar will have an open mind when

16
collecting data, or as open as possible, according to Jacobsen (2002, Ch. 2). The third approach
is the abductive approach which in essence is a combination of the other two (Patel and
Davidson, 2011).
A deductive research approach was chosen due to the authors’ insufficient previous knowledge
in appropriate theories and models surrounding online brand communities’ impact on customers
brand loyalty. Hence, to get the best possible result the subject needed to be studied in depth
beforehand and the deductive approach was consequently the most suitable alternative.
3.2 Method Approach According to Jacobsen (2002, Ch. 2), empirical data can be collected in two methodical
approaches; either quantitative or qualitative. The two methods have their separate benefits and
drawbacks; hence the choice of approach should be decided with regard to the type of
information that is going to be collected. The choice of approach is therefore determined at the
same time as the research question is decided.
A qualitative approach is often used as a synonym for any data collection technique that
generates or uses non-numerical data, says Saunders, Lewis and Thornhill (2009, Ch. 5). It is
preferably used when one's purpose is to develop new theories and when you want to gain
detailed information from few units and where there is no wish to generalise the findings. The
benefits of a qualitative approach are flexibility and openness in the information collection
process, and that the researcher will gain deep and detailed information from the interviewees.
Intensive research questions are most suitable to the qualitative approach (Jacobsen, 2002, Ch.
2). A quantitative approach is often used as a synonym for any data collection technique which
generates or uses numerical data, says Saunders et al. (2009, Ch. 5). The quantitative approach is
appropriate when you want to test theories or hypothesis and when you want to try to apply your
results to a wider context than the one studied, says Lee and Lings (2008, Ch. 1), as this
approach provides the highest levels of reliability due to the extensive approach with many
respondents.
When you wish to examine the frequency or extent of a phenomenon, the quantitative approach
is also the approach that is the most suitable one, according to Jacobsen (2002, Ch. 6).
3.2.1 Quantitative Approach
With regards to the research question and the purpose the empirical data in this thesis have been
collected by using the quantitative research approach. The goal was to examine if, and if so, to
which extent online brand communities have an impact on brand loyalty. The reason why the
quantitative approach was the most suitable is because of the bigger number of respondents
partaking in the survey, which will make the sample more conformable with the population as
whole. According to Jacobsen (2002, Ch. 6) the quantitative approach was also best suited when
researchers already know quite a bit about the subject they want to study. Because a deductive
research method have been chosen, a quantitative approach when collecting primary data is
therefore the best choice.

17
3.3 Method of Collecting Empirical Data
3.3.1 Primary Data
We chose the quantitative research approach to standardize the data collecting process.
According to Birkler (2008, Ch. 4) primary data can be collected using many different
mechanics; questionnaires, interviews, observations and experiments. There are disadvantages
connected to all, but common among them all is that no matter how you choose to collect your
primary data it can be very time consuming and costly. However, the advantage with collecting
primary data is that the information that is gathered has been collected for that specific purpose
which makes it current and relevant (Jacobsen, 2002, Ch. 6).
This study consists of a self-completion questionnaire, meaning that respondents answer
questions by completing the questionnaire themselves. Self-completion questionnaires can come
in several forms and while the most well-known of these forms probably is via mail or post
(Saunders et al., 2009, Ch. 11) an online questionnaire have been chosen for this paper.
To make the process as simple as possible for both researchers and respondents the questionnaire
was created and utilized on the Internet site Enalyzer, www.enalyzer.com, which provides online
questionnaires. Since the study was constrained by limited funding an online-questionnaire was
suitable which limited the cost, as well as give the possibility to distribute the survey to a larger
sample, to make the precision higher in the findings (Saunders et al., 2009, Ch. 11). This choice
would also eliminate the influence the interviewer has on the respondents (Ejvegård, 2002, ch.
4). The data was then collected and downloaded from the website.
Online Questionnaire
An ideal way to carry out this research would have been to examine consumers’ actual buying
behaviour in terms of what brand the consumers bought before joining an online brand
community and comparing this to what brand they chose after being members for some time.
This would have been a straightforward way of seeing if the online brand community would
have helped to build brand loyalty.
However, there are a number of complications which prevented this. As the authors cannot
predict who will become a member of an online brand community we would have had to study
an enormous amount of purchases by a vast number of people before a buyer possibly becomes a
member of an online brand community. This is due to the fact that only a small share of buyers
will become members of an online brand community. It is namely a prerequisite that we can
study purchases that are being made by the same person, before they have become members of
the specific online brand community, and a period of time after they have been members.
Concerning the first measuring point in this ideal way of doing the research, which is to say the
point before the consumers become members of an online brand community, we could, for
obvious reasons, not target the big amount of purchasers that would be required for making sure
that an enough amount of those purchasers later on decide to become members of an online
brand community. Yet, if this would have been possible, we would at the second measuring
point, sometime after the purchaser became member of the online brand community, register
what brand(s) the purchaser was buying. This would have given a correct picture of how the
consumers brand preferences and brand loyalty to a specific brand would have been affected by
the online brand community.
18
Since this way of carrying out the study was not possible, as it required far too many resources to
study the huge amount of purchases before the possible membership of an online community
starts, another way to perform this study was chosen. Instead, members of online brand
communities was asked what brand they used to buy before they became members of the specific
online brand community, whereas at the same time they were asked what brand they buy after
being members for some time. Members which had been member less than two months was
excluded from the survey, as it is expected that this time is required for the online brand
community to possibly change the mind-set of the consumer when it comes to brand loyalty.
Also, two months is a reasonable time for new members to get to know the community and its
functions.
What were obtained were the buyers’ alleged purchases, e.g. what they told us they bought. We
believe that consumers will not have any particular reason for lying about what brand(s) they
used to purchase before their membership, nor would they have any particular reason for not
giving us the true story about their brand selection of purchases at the time after they have been
members of the online brand community for at least two months. We would also like to point
out, for those who might criticize us for that consumers might not remember what they have
purchased back in time, that it is our strong belief that this is not the case when it comes to
members of online brand communities in the sports industry. Sporting goods consumers, who are
members of online brand communities, would never have been members if they weren't very
much concerned about what brands they buy and wear, which mean that it is highly unlikely that
they by mistake would specify a former, not correctly remembered, brand of purchase. Having
this said, we nevertheless consider that the results of this study can be trusted to a high degree.
Questionnaire Design
When designing the questionnaire (Appendix) there were several considerations that were taken
into account, and regardless if a questionnaire is self-administered or completed by an
interviewer, it must always be well designed says Saunders et al. (2009, Ch. 11). According to
Saunders et al. (2009, Ch. 11) the design of the questionnaire will have a direct impact on the
response rate and an indirect impact on the reliability and validity of the collected data. The
layout was made as clear as possible to limit misunderstandings, and a vertical format was used
when formatting the questionnaire. A clear and concise covering letter was produced explaining
the reasons for the research and why the respondents’ participation was important. Closed
questions were used since these are best suited and the questions were kept as simple as possible
to avoid confusion. It is argued that closed questions enable respondents to participate in the
survey without it having to take up too much of their time and hence will maximise the response
rate. It is important that a questionnaire is not too long and demanding on the respondents,
because that could result in a lower participation rate, says Saunders et al. (2009, Ch. 11). That
was taking into consideration while designing the survey, as well as keeping the language simple
and avoiding to use words which could be ambiguous and wording that could imply that a
certain answer was correct. We also chose to make the questionnaire anonymous since this
maximises response rates as it enables respondents to be more truthful (Jacobsen, 2002, Ch. 12).
We also kept in mind that Jacobsen (Ibid.) argues that you should always start with “safe” and
easier questions and end the questionnaire with the more complex or sensitive questions, and that
respondents can be influenced to give certain answers depending on previous asked questions.
Category questions were designed so that respondents’ answers only could place in one category,
and the questions had no more than five response categories. These type of questions are
particular useful when you want to collect data about behaviour (Saunders et al., 2009, Ch. 11).

19
The majority of the questions in our questionnaire were therefore category questions. For the
questions where we wished to examine the intensity we used a Likert scale, with five levels with
a range from Strongly Disagree (1) to Strongly Agree (5). Filter questions can aggravate
respondents from getting through surveys (Jacobsen, 2002), but to assist the flow of a survey it
may be necessary according to Saunders et al. (2009, Ch. 11). Since the questionnaire was sent
to people where some were not eligible respondents, we needed to screen out these respondents
before analysing the data. By having a filter question we could easily pick out those that were
insignificant to the study.
3.3.2 Secondary Data
Our secondary data have been collected mainly through scientific journals and books in the areas
surrounding our research question. Christensen, Engdahl, Grääs and Haglundet (2010) and
Jacobsen (2002, Ch. 6) state that secondary data is all type of data that someone else prior have
collected and therefore it has often been collected in relations to a different research question
than the one that the scholar is trying to answer. If there has been a longer time span from the
time the data was first collected up until the point it is used as a secondary source, there is also a
risk that the data has become obsolete and is no longer suitable (Christensen et al., 2010). We
have tried to get around this risk by cross checking sources against each other in an attempt to
verify their accuracy.
According to Jacobsen (2002, Ch. 6) the most important factor to consider when handling
secondary data is the origin of the source, and because of this we have strived to only use
published scientific articles and books written by acknowledged authors and scholars within the
marketing community.
3.4. Selection
3.4.1. Selection of Sporting Goods Brands
Since the goal is to examine if sporting goods brands’ online brand communities help in building
brand loyalty, the biggest sporting goods brands were chosen as they are most relevant because
they play the biggest role on the sporting goods market. Two of the companies chosen, adidas
and NIKE, are believed to control around 40 percent of the world wholesale market for active
sportswear and athletic footwear, and a little over half of the branded segment (Just-Style, 2007).
Hence, even if forced to limit ourselves in choice of brands, communities were chosen that
would give a picture of the industry which was as representative as possible. However, the
criteria has been put up, that the brand must offer an online brand community for consumers.
Consequently, two of the biggest brands - Under Armour and Reebok - will not partake in this
thesis as they do not offer online brand community for consumers of sporting goods.
NIKE
NIKE, named after the Greek goddess of victory, is an American sporting goods manufacturer
and the world’s leading shoe and apparel company, who launched their first line of products in
1972 (Hoovers, 2013). The US-based company sells its products in close to 700 NIKE-owned
retail outlets, and employs over 35.000 people worldwide and operates in more than 160
countries (Reportlinker, 2012). NIKE also possesses the number one position amongst sport
20
brands in the world in its brand value of almost 15 billion USD (Brandirectory, 2013). NIKE’s
top competitors are according to Hoovers (2013) New Balance, PUMA and adidas.
adidas
adidas was founded by Adi Dassler in Germany in 1949 (Hoovers, 2013). After NIKE, it is the
second biggest company in the world in the sporting goods industry (Forbes, 2013), and the
second most valuable sport brand in the world by its brand value of just shy of 5.8 billion USD
(Brandirectory, 2013). The company sells sporting shoes, apparel, and equipment sporting its
iconic three-stripe logo in 170 countries. NIKE, PUMA and Callaway Golf Company are
considered to be adidas biggest competitors (Hoovers, 2013).
PUMA
PUMA was formed in 1948 when German brothers Rudi and Adi Dassler feuded and split their
family firm into adidas and PUMA (Hoovers, 2013). While shoes are PUMA's heritage, apparel
accounts for a growing portion of sales and they distributes its sports apparel in over 120
countries and employs close to 10.000 people worldwide (Reportlinker, 2012). The brand value
of PUMA is estimated to just shy of 2.3 billion USD (Brandirectory, 2013). PUMA is the 4th
most valuable sporting goods brand in the world (Forbes, 2013), and Hoovers’ (2013) list NIKE,
adidas and Asics as the company’s biggest competitors.
3.4.2 Selection of Marketing Communications Channels
Stated below are the online brand communities that will be included in this thesis. Each and one
of them are being operated by their respective brand.
NIKE+
NIKE+ is an online brand community that anybody who enters the NIKE homepage, will be
offered to sign up for. Getting registered is quick and easy, and once registered you will be
offered a variety of services from NIKE+. This includes help in your personal training, by using
hardware solutions from NIKE which will enable you to upload your training performance (e.g.
distance, route, pace). Moreover, at NIKE+ the members can search and add friends with whom
they later can challenge in real life by comparing data, or in virtual competitions and games.
Members might also interact with others by sharing their achievements among other members.
NIKE+ also helps you to improve your performance by showing statistics of your performance
and suggesting insights which might help you improve. In a survey conducted by Headstream
Consulting, NIKE+ was ranked number two based on the brand’s ability to connect with online
communities using the power of social media (Headstream, 2011). NIKE+ can be used by
customers both on the website and by downloading the NIKE+ app. NIKE+ has according to
NIKE (2013) roughly 7 million members and the community was founded in 2006.
adidas miCoach
Once entering the homepage of adidas, finding the adidas miCoach page is not as easy as with
the previous brand. Anyhow, once the consumer is there, it´s easy to sign up for adidas miCoach
and become a member. adidas miCoach describes themselves as “your personal coach”, and
allow members to choose from already designed training plans or for them to create their very
own. The workout progress can be tracked and the member can get coaching feedback on his or
hers performance. The adidas miCoach practical training solutions given to the consumer are on

21
the same level as with NIKE+, with the one exception that adidas miCoach until recently has not
offered members to share their performance and challenge with each other to the same degree
that Nike has offered continuously since launching NIKE+. adidas miCoach is still more focused
on crowd sourcing where members can help each other out and discuss among each other in
topics which mainly concerns the miCoach hardware solutions. adidas miCoach can be used both
on the website of adidas miCoach and by downloading the adidas miCoach app. It was difficult
to get an answer to how many members adidas miCoach has since this information is not shared
by adidas. However, once searching for friends to add to your own network on adidas miCoach,
we were faced with 61492 pages of 18 members per page (adidas, 2013) which we through
simple math calculated the estimated total number of members of adidas miCoach to be
1 106 856 members.
PUMA Social
PUMA differentiates themselves from their competitors by using a brand strategy which focuses
on bringing joy to their consumers; this is highly noticeable in their online brand community. It
is simple to sign up for PUMA Social, however, similar to adidas miCoach, it takes a bit more
effort to find PUMA Social on the PUMA homepage then it did finding NIKE+. PUMA Social
differs clearly from its competitors when it comes to the service they offer. PUMA Social is
exactly what it sounds like - a place for socializing. You will not find practical services for
technical hardware products like would at adidas miCoach and NIKE+, but instead this online
brand community invites you to create your own photo sets and take part in discussions about
events, media and products which refer to PUMA. PUMA Social can be used both on the
website of PUMA Social and by downloading the PUMA Social app. However, one could claim
that PUMA Social requires the user to not only use the website but also the app. This is because
the primary focus of PUMA Social is to create photo sets which are being shared with your
community friends and in order to share those photos you will need the PUMA Social app.
Apart from adidas miCoach, it was also tricky to estimate the number of memberships for
PUMA Social, as PUMA too was unwilling to share this information. As mentioned before,
using the full potential of the PUMA Social community requires the Puma Social app. Once
looking at how many monthly active app users there are of PUMA Social of which has
connected their profile to Facebook, there is according to Facebook (2013) only a number of
1655 monthly active users. Worth mentioning is that it is highly likely that a significant amount
of members might not have connected their profile to Facebook, or they might actually not use
the app. It is indeed unfortunate that we are not able to give a clearer answer on this issue, but
the authors estimate the numbers of members of PUMA Social to be considerably lower than for
adidas miCoach and especially lower than NIKE+.
3.4.3 Selection of Population and Respondents
The theoretical population is the population we wish to investigate but for obvious practical
reasons it is very hard and cost-consuming to ask the whole theoretical population, and hence a
limitation had to be made while still keeping in mind to make the sample as representative to the
theoretical population as possible. Jacobsen (2002, Ch. 12) says that less than 100 respondents
makes it difficult to carry through a good analysis of the collected data, and somewhere between
400 and 600 respondents is desirable depending on the size of the theoretical population. As
previously being discussed we cannot confirm a definite size of the population. However,
knowing that NIKE+ has roughly 7 million members and adidas miCoach just over 1 100 000
while PUMA most probably have less than the mentioned communities, we can assume that the

22
total population of members would probably be somewhere between 8.100.000 and 9.000.000
members.
The respondents were reached out to through multiple different ways. Firstly, the online
questionnaire was sent through the previously mentioned brand communities; adidas miCoach
and PUMA Social. NIKE+ website was constructed in a way that prevented us to use this site as
a channel to reach community members. However, we encountered some difficulty since adidas
miCoach interjected multiple times and told us to stop posting in their community. Hence, we
were unable to use this channel to find respondents in the intended capacity. Secondly, Twitter
was used to reach participants through posting the link to our online questionnaire and hash
tagging the different community names in the post. The hash tags we used were; #adidas,
#adidasopenrun, #adidas_miCoach, #NIKE, #NIKEfuel, #PUMA and #PUMAsocial. However,
it turned out to be hard to reach the community members, hence, the different brands’ Facebook
pages was our last resort to access the respondents through. The thought behind this strategy was
to utilize the massive number of members that these platforms have attracted, and we chose to
use the Facebook channels with the most member and greatest buzz, regardless if that meant
using a specific sports page, e.g. football. The Facebook pages we linked our survey through
were; adidas, adidas miCoach, NIKE, NIKE+ fuelBand, NIKE football, PUMA (clothes), PUMA
(company), PUMA football. Here as well, we met resistance from adidas which forbid us from
posting on their pages. We however, continued posting on PUMA’s page.
Because the number of respondents was low for a long time, we had to seek out individual
members and chose people who had liked or commented on the different Facebook pages. In
total we managed to make 125 respondents complete the survey. Ideally, we would have had a
considerable larger amount of respondents completing the survey in order to make our
conclusions generalizable to a higher extent. However, all in all having 125 respondents is a
result from extremely hard work in terms of seeking up respondents who were willing to answer
the survey. This low number of respondents that have completed our survey has to some degree
forced us to be careful when making generalizations.
Lee and Lings (2008) say that probability sampling is the “gold standard” of quantitative
sampling but that it is more often an ideal than a reality, and that it is more common to see
research project use non-probability samples. The most common one being convenience sample.
Internet based questionnaires, which is the collecting method we have used in this thesis, is said
to be a convenience sample since the respondents chose themselves if they want to participate in
the survey or not.
According to Jacobsen (2002, Ch. 12) a respondent rate above 50 percent is acceptable; a rate
over 60 percent is very good and above 70 percent is excellent. Extra care have been put into
designing the questionnaire in a way which will try to maximising the response rate since
questionnaires are known for having lower response rates than telephone interviews for instant.
Because Saunders et al. (2009, Ch. 11) state that online surveys have low participation rates, as
many questionnaires as possible need to be sent out to be able to give us the best starting-point
when analysing the data. The most important factor when looking at the respondents was that
they were members in one of the mentioned communities, how the contact was made is less
central.

23
3.5 Operationalization To be able to measure abstract concepts, like brand loyalty, the concepts have to be made
operative, or measurable, says Jacobsen (2002, Ch. 11). The concept are made measurable
through finding appropriate indicators for the concept and by doing this, the abstract concept can
be measured indirect. Numerous scholars (Aaker; Rosenbaum-Elliot et al.; Keller; Lazarevic;
Melin; Ganesh et al.) divide brand loyalty into two different types; behavioural and attitudinal
loyalty (Model 7).This division have been adopted when creating the survey questions.
Moreover, Aaker’s (1991, Ch. 2) brand loyalty pyramid has been used to distinguish more
operative areas of interest when trying to understand the community members’ loyalty levels.
Model 7: Operationalization of Brand loyalty. Adapted from Aaker (1991) pp. 40.
The questions regarding the behavioural loyalty was aimed to cover the community members’
memberships, if the members are keen to share their experience of the community brand to
others, but mostly to see if the purchase behaviour patterns have changed since entering a
community. The attitudinal loyalty questions are very much designed to help us better grade the
degree of the loyalty, having Aaker’s loyalty pyramid in mind. The questions aimed to capture
whether or not the members had developed attachments to the brand and if they felt a sense of
belonging to the community. Due to the interlinked relationship between behavioural and
attitudinal it was however hard to keep them completely separated when designing the survey
questions.
3.6 Credibility
3.6.1 Validity and Reliability
Regardless which research method approach an author of a thesis chooses, the information that is
collected must fulfil two requirements; the information must have validity and reliability
(Jacobsen, 2002, Ch. 1). Validity refers to the issue of whether or not you measure what you
intend to measure, and if the results from one restricted area at one point in time also could be
valid in other contexts (Ejvegård, 2003, Ch. 4). That is, could we generalise our findings and
apply them elsewhere? We feel that our results measure what we aim to measure since the base of our survey is
constructed through having well-established definitions of brand loyalty in mind.
Brand Loyalty
Attitudinal Loyalty
Behavioural Loyalty

24
Reliability is addressing to which extent the results have credibility. Have there been weaknesses
in the implementation of the data collecting process, and if we did the process all over again
would we get the same results?
3.7 Criticism
3.7.1 Criticism of Sources
To evaluate the validity and reliability of this thesis, we have been critical when looking at the
quality of collected data. The survey must be carried out in a way which will ensure a reliable
result and should be based on a relevant sample of community participants (Jacobsen, 2002, Ch.
1).
In our frame of reference we have used different books, journals, industry statistics and reports
and websites within the areas we are examining closer. According to Saunders et al. (2009, Ch.
8) the sources mentioned are all documentary secondary sources that are well suited for a thesis.
However, we have tried to use journals to the greatest possible extent, because we value the fact
that these sources have been audited before being published (Jacobsen, 2002, Ch. 6). Most of the
journals used have been collected from the computer data-bases Emerald and ProQuest at the
University in Halmstad.
We are aware that some of the sources are older than what would be preferred, for instant
Aaker’s books from 1991 and 1996a;b and Melin’s book from 1999, which we realize have had
an impact since the industries we are examining are fast moving (Pwc, 2012). However, since
the older sources only describe fundamental theories around brand equity and not the areas that
are changing rapidly we do not see this as a significant problem. Also, because Aaker and Melin
are well- acknowledged authors within their respective area, whom are still used in the
educational books for marketing students today as well as referred to in newly published
journals, we do not feel that these sources constitute any problem. Therefore, we consider the
material we founded this thesis upon to be credible.
3.7.2 Criticism of Methodology
We have already discussed weaknesses surrounding our method, population and selections
throughout the methodology chapter. Therefore, we will only address the most central and severe
criticism in this section. Choices around population are usually hard. Since we knew very little of
who was and wasn’t members of online communities for at least two months, we were unable to
make a good selection. As a result of this the external validity has been lowered and the
possibility of doing straightforward generalizations about the population as a whole, limited.
This is unfortunate when this is one of the great advantages of using a quantitative study
approach (Jacobsen, 2002 Ch. 14). Hence, we had no other choice but to do a nonprobability
sample, which we already have discussed.
Our choice of method approach can also be discussed. If we had used a qualitative approach and
studied this subject in depth with interviews instead of in width, would the result be more
rewarding? If so, we probably would have received a deeper, rather than wider, look on brand
loyalty among the members.
We realized quickly that our biggest endeavour were to seek out respondents. With this in mind
we tried to follow as many advices as possible which Jacobsen (2002, Ch. 12) have mentioned to

25
boost the answer frequency. The respondents have been allowed to be anonymous and the
purpose of the survey was explained in the introduction to the questionnaire. Because of the
anonymity, we could not send reminders which could have helped the response rate and the
dropout rate could not be determined either. As mentioned before Jacobsen (2002, Ch. 12) say
that motivation levels when it comes to answer questionnaires is lacking to some extent which
also has influenced the response rate. The motivation of respondents is an additional factor
which may have influenced the accuracy level of the study, since their ambition and willingness
to answer correctly affects the outcome. Another weak point in our method is that because the
respondents were anonymous, we couldn’t keep track of who participated in the survey and if
they participated multiple times, which influence the accuracy level as well. Also, because we
used an online questionnaire the number of potential respondents was great, as well as also hard
to track. Hence, it was impossible to measure the answering frequency because we didn’t know
how many had seen the questionnaire and chosen not to participate.
We chose to mainly base our theoretical foundation upon Aaker’s brand loyalty model; however
other models could have been used in order to achieve a different approach of the thesis.
We also regret the positioning and formulation of a couple of questions in the survey. We wished
our first question would have been to ask if they were members of one of the communities and
for how long instead they had been members, instead of asking their age, sex and which
community they were members of. This would have meant that we would have had a more
precise data on these variables. These are flaws that could have been prevented, had we sent out
a pilot-questionnaire, which we regret not doing.

26
4. Empirical Framework This chapter will present the empirical data that have been collected through
the online questionnaire.
4.1 Respondents Overview In total, 208 people have entered the questionnaire to participate in the survey. Out of these
people, 138 were members of one or more of the mentioned communities, and 125, had been
members for more than two months. The majority of respondents were male, 60%, and the most
recurrent age group among the respondents were 21-30 years which represent 72 % in total,
followed by 31- 40 years which stood for 14 % of the respondents.
NIKE+ and adidas miCoach are quite equally represented among the respondents, 52 % are
members of NIKE+ and 45 % of adidas miCoach. A mere 3 % have claimed to be members of
PUMA Social, see Chart 1. The duration of memberships vary some among the respondents. 9
% of the respondents have been members for less than 2 months, 23 % have been members for 2-
6 months and 27 % has been members for 7 months to a year. Most respondents have been
members for more than 1 year, 41 %.
Chart 1: Respondents’ Memberships
4.2 Attitudinal Loyalty A high majority of respondents say to have both positive feelings towards the community brand
(92 %) and towards the community itself (80 %). More respondents were undecided towards
their positive feelings towards the community, (7 %), than the community brand (2 %). 46 % of
the respondents agree to feeling a sense of belonging with the community brand and an extra 10
% strongly agree with the statement. Hence, a total of 56 % agree to feel a sense of belonging to
the community grand to some extent. A total of 81 % also either agree or agree strongly with the
3%
45%
52%
0% 10% 20% 30% 40% 50% 60%
PUMA Social
adidas miCoach
NIKE+

27
statement I trust my community brand. Only 3 % disagreed or strongly disagreed with the
statement. Prior to being members however, more respondents, 47 %, have chosen a neutral
answer. 38 % claim to have felt a high level of trust towards their community brand to some
degree, and 15 % disagree with the statement to some degree (Table 1).
“I feel a sense of
belonging to my
community brand”
“I trust my community
brand”
“I felt a high level of
trust prior to my
membership”
Strongly Disagree 2 % 1 % 2 %
Disagree 3 % 2 % 13 %
Neutral 37 % 18 % 47 %
Agree 46 % 66 % 28 %
Strongly Agree 10 % 15 % 10 %
Table 1: Respondents’ Trust in and Belonging to Community
4.3 Behavioural Loyalty A clear majority of the respondents in the survey are willing to spread positive word-of-mouth,
where 66 % agree and 24 % strongly agree with the statement: I am willing to say positive things
about the community brand to other people. In total, 87 % of the respondents are likely to some
degree encourages friends and family to use the community brand, and 3 % disagreed to some
level with the statement (Table 2).
“I am willing to say positive
things about the community brand
to other people”
“I will encourage friends and
relatives to use the community
brand”
Strongly Disagree 1 % -
Disagree 2 % 2 %
Neutral 7 % 11 %
Agree 66 % 62 %
Strongly Agree 24 % 25 %
Table 2: Community Members’ Word-of-Mouth
90 % claim to have recommended the community brand to people they know, though the extent
vary. 23 % say that they recommend the community brand as often as possible, whereas 45 %
would classify it as now and again. 25 % say that it occurs more seldom and 7 % never.
When asked if they had ever talked degrading about sporting goods brands different from their
community brand, 52 % displayed a level of disagreement and 21 % a level of agreement. 27 %
gave a neutral answer. 42 % agree and 28 % strongly agree with the statement I intend to
continue using the community brand for a long time. Hence, a total of 70 % of the respondents

28
intend to continue using the community brand for a long time. 4 % disagree with the statement
and 26 % chose not to take a stand, (Table 3).
“I have at one point or another
talked degrading about other
sporting goods brands different
from my community brand”
“I intend to continue using the
community brand for a long
time”
Strongly Disagree 14 % -
Disagree 38 % 4 %
Neutral 27 % 26 %
Agree 18 % 42 %
Strongly Agree 3 % 28 %
Table 3: Recurrence of Degrading Talk and Intention to Continue Buying the Brand Long-Term
76 % of the respondents claim to continue using the community brand even if the price is higher
than the competitors. 91 % state that it is likely or very likely, that their next sporting purchase
will be from the brand of their community. A total of 9 % state that it is not likely to any degree.
If the respondents’ community brands were temporarily not available, 26 % argue that they
would wait with the purchase, 52 % would go to a different store and 17 % would buy another
brand, see Chart 2.
Chart 2: Response to Branded Goods Being Temporarily Unavailable
The largest segment of respondents, 45 %, has bought more than 8 pieces of sporting goods
during the last two years. 36 % have bought 5-8 pieces of sporting goods followed by 18 % that
have bought 1-4 pieces. 1 % has bought none.
26%
52%
17%
5%
0%
10%
20%
30%
40%
50%
60%
Wait Go to a
different store
Buy another
brand
Other

29
The largest segment of respondents, 39 %, grades the level of branded goods being from their
community brand to be around 3/4. Coming in at a very close second are 1/2, see Chart.
Chart 3: Proportion of Community Branded Goods
64 % of the respondents state to have bought sporting goods from a competitive brand while
member of their community, 31 % claim to have not. 5 % state to not remember.
NIKE and adidas was the brands that were most usually bought by the respondents, NIKE
ending up with 62 % of the answers and adidas 26 %. The category Other, received 7 % of the
responses. When asked what other brands they also buy, 34.5 % answered adidas, 26 % NIKE
and 18 % Other (Table 4). The same table demonstrates the respondents most recently bought
brands. In this case, NIKE (56 %) and adidas (30 %) are once again the top two, followed by
Other (8 %). The respondents’ perceived image of what brand would be their next sporting
goods purchase were NIKE (40 %), adidas (28 %) and Other (17 %).
NIKE adidas PUMA Reebok Under
Armour
Other
Usually bought brand 62 % 26 % 2 % 1 % 2 % 7 %
Also bought brands 26 % 34.5 % 7.5 % 8 % 6 % 18 %
Most recently bought brand 56 % 30 % 3 % 1 % 2 % 8 %
Perceived next bought brand 40 % 28 % 4.5 % 4.5 % 6 % 17 %
Table 4: Respondents’ Buying Behaviour
5%
11%
33%
39%
12%
0%
10%
20%
30%
40%
50%
None 1/4 1/2 3/4 All

30
4.4 Mean Value and Confidence interval Mean Value of all variables n Average SD Confidence interval* Are you a member of any of the following
brand communities?
208 1.34 0.47 1.28 - 1.40
Which of the communities are you a member
of?
150 1.51 0.56 1.46 - 1.56
How long have you been a member? 138 3.93 1.13 3.74 - 4.12
Do you consider yourself to have positive
feelings towards your community brand?
125 1.10 0.38 1.03 - 1.17
Do you consider yourself to have positive
feelings towards your community?
125 1.27 0.59 1.17 - 1.37
Have you ever recommended your
community brand to people you know?
125 1.10 0.31 1.05 - 1.15
If yes, how often? 125 2.16 0.87 2.01 - 2.31
I feel a sense of belonging with my
community brand
125 3.61 0.78 3.47 - 3.75
I trust my community brand 125 3.93 0.67 3.81 - 4.05
I am willing to say positive things about the
community brand to other people
125 4.10 0.67 3.98 - 4.22
I will encourage friends and relatives to use
the community brand
125 4.10 0.65 3.99 - 4.21
I intend to continue using the community
brand for a long time
125 3.94 0.84 3.86 - 4.02
Even if other brands' price is lower, I will go
on using the community brand
125 3.89 0.96 3.72 - 4.06
I felt a high level of trust towards my
community brand prior to my membership
125 3.30 0.90 3.14 - 3.46
I have at one point or another talked
degrading about other sporting goods brands
different from my community brand
125 2.58 1.03 2.40 - 2.76
How many pieces of sporting goods have
you purchased during the last two years
125 3.25 0.78 3.11 - 3.39
What portion of those sporting apparel pieces
were of the same brand as the community
that you are now a member of
125 3.42 1.0 3.24 - 3.60
Have you during your membership bought
sporting goods from a brand other than your
community brand
125 1.41 0.58 1.31 - 1.51
Which brand of sporting goods do you
usually buy for most part
125 1.77 1.41 1.52 - 2.02
Do you also buy products from any of the
following brands
226 2.89 1.83 2.65 - 3.13
Which brand did you most recently buy 125 1.86 1.43 1.61 - 2.11
What brand do you think you will buy next
time…
192 2.59 1.87 2.33 - 2.85
How likely is it that your next sporting
apparel purchase will be from the brand of
your community
125 1.68 0.68 1.56 - 1.80
If your community brand had temporarily not
been available for purchase, what would you
do
125 2.02 0.81 1.88 - 2.16
(*) The confidence interval is calculated with a z-test using a 95 % confidence degree. Hence α (significance level)
= 5 %.
Table 5: Mean Value and Confidence Interval
31
5. Analysis In this chapter we aim to put the collected empirical data in relations to the relevant theories in
order to create a base for answering the research question in the next chapter.
5.1 Analysis of Questionnaire
5.1.1 Attitudinal Loyalty
Won-Moo et al. (2011), argue that high levels of commitment towards the online brand
community will generate a high level of brand loyalty. The authors claim that commitment in its
turn is affected by the degree of trust towards the online brand community. Before becoming
members of an online brand community 28 % agreed and 10 % strongly agreed with saying they
felt a high level of trust towards the community brand. This indicates that prior to entering the
community the majority of members did not trust the community, but became members anyway.
Since becoming members of the online brand community, 66 % agreed and 15 % strongly agreed
with the statement I trust my community brand, indicating that a strong majority of members
now trust their community brand. This is an indication of an increase of trust in the community
brand after being members for at least two months; prior to membership the total trust level
placed at 38 % and after entering the community 81 %. This is a significant trust increase. This
result implies that online brand communities tend to increase the level of trust towards the
community brand.
As Lazarevic (2012) has argued, high brand loyalty is partially composed by customers having a
positive attitude towards the brand. Our survey shows that as many as 92 % of the respondents’
state to have positive feelings towards their community brand. 80 % also agree to have positive
feelings towards their online brand community. Taking this data in, it seems as though the actual
brand enjoys a higher level of positive feelings from the members than the community does. By
examining Table 5 and observing these specific questions’ average and confidence interval, we
can also with 95 % confidence support this statement. Why that is, is hard to tell. It might be
easier for the members to display their feelings towards a brand which actually has physical
products where the feelings can be directed towards, than to an electronic platform.
Nevertheless, the majority of respondents demonstrate positive feelings overall which signals
that they possess partial high attitudinal brand loyalty. However, it is unclear to what extent the
members entered into the community with an already positive state of mind, and to what extent
the online brand community has participated in creating that mind-set.
As we have talked about before, the fifth and final level of Aaker’s loyalty pyramid refer to those
consumers that present the highest level of brand loyalty. They often feel an obligation towards
the brand, feel proud of it and strongly identify with the brand. In an attempt to measure how
strongly the online community members really identify with the community brand we asked
them to grade their level of belonging with the brand. From our survey we have found that 56 %
agree to some level on saying that they feel a sense of belonging with their community brand.
This would mean that a majority of the community members state to feel some level of
belonging. In addition, this could imply that they identify themselves with the community brand
and hence would be place in the top of Aaker’s loyalty pyramid and demonstrate a high level of
brand loyalty. 37 % considered themselves to be neutral, which means they do not feel a sense of
belonging to the community brand but they do not not feel a sense of belonging either. This is a

32
significant amount of respondents whose brand loyalty in this aspect we are unfortunately unable
to grade.
5.1.2 Behavioural Loyalty
Consumers that are keen on recommending their community brand to others also belong to the
top segment in Aaker’s loyalty pyramid. Aaker terms them “committed buyers” and as
mentioned they display the highest degree of brand loyalty. It can be concluded from the survey
that a rich majority of members of online brand communities seem to be committed buyers since
90 % of the respondents’ state that they have recommended their community brand to their
acquaintances. The average of this statement is 1.10, Table 5, which in the survey closely
corresponds with the answer Yes. This further verifies our argument. 23 % state to recommend as
often as possible, 45 % to do it now and again and 25 % do it more seldom. This means that
close to a quarter of the respondents are true brand ambassadors, claiming to promote the
community brands when the possibility present itself. Because of a technical problem
respondents that claimed they did not recommend the community brand to others still answered
this question and hence 7 % answered that they never recommend their community brand. This
is a technical mistake on our side, but since the occurrence itself and not the degree of it is the
primary information we were seeking, this is not an issue. What we can make out is that a clear
majority of the respondents recommend their community brand to others, and hence demonstrate
the highest level of brand loyalty according to Aaker’s pyramid.
Moreover, 90 % of respondents agreed to some degree with the closely related statement: I am
willing to say positive things about the community brand to other people, which further confirm
our conclusion. Our statistical data from Table 5, give us no reason to question this since the
confidence interval (3.98 - 4.22) with 95 % certainty tell us that community members would
share positive word-of-mouth about the community to others. The results of these three questions
clearly indicate that the members of online brand communities seem to show a high degree of
brand loyalty in this particular aspect of brand loyalty, however, we also have to consider the
consumers’ future intentions, according to our definition of what brand loyalty is. When taking
into account that 87 % would agree or strongly agree with encouraging friends and relatives to
use the community brand in the future, with similar statistical data as the previous question, we
can conclude that members of online brand communities show signs of having a high degree of
brand loyalty in this behavioural aspect of brand loyalty.
Brand loyalty is also partly about showing an intense dedication to purchase the same brand now
as well as in the future (Lazarevic, 2012). Our survey showed that 45 % of the respondents had
bought 8 or more pieces in the last two year, whereas 36 % had bought 5-8 pieces and 18 % had
bought 1-4 pieces. This shows that members definitely buy sporting goods and almost 50 %,
show a purchasing capacity which is quite remarkable as their average purchase amount is at
least 1 piece of sporting goods every third month. Worth underlining is that we regret we did not
have more specific response options for numbers bigger than 8, since most of our respondents
placed in this group. However, the extent to which the respondents buy sporting goods is of
inferior importance, and the more interesting factor for us to look at is the proportion of those
purchases being community branded goods.
Taking a closer look at the purchase behaviour among our respondents for the last two years, we
can see that 12 % of the respondents bought all their pieces of sporting goods from their
community brand, which is not a particularly high number. 39 % estimated that 3/4 of their

33
purchases were of the same brand as their community brand and 33 % estimated half of their
purchases were of the same brand as their community brand. This does not give us a clear insight
into the respondents’ possible behavioural brand loyalty and you have to think about how large
proportion of the purchases will need to be from the community brand to consider them loyal?
Muniz’s and O’Guinn’s (2001) theories state that members of a brand community are supposed
to be more loyal to the own brand, which would mean that loyalty is not absolute and that a
community member does not necessarily need to buy solely community branded goods to be
considered loyal. In that case, the members who bought community branded goods 3/4 of the
time would then be considered loyal, together with the members who exclusively both
community branded goods that is. In the big picture however, we probably should have had to
see a higher proportion of purchases being made from the same brand as the community brand
than what was being presented from the results in the survey to absolutely be able to say that the
community brand members are brand loyal in their purchasing behaviour. We have to keep in
mind though, that the largest segment of members, 41 %, stated to have been members for more
than 1 year and 27 %, a significant amount of respondents, stated to have been members for 7-12
months’ time. Hence, when we asked to look at the last two years’ worth of purchases it is
possible that a portion of those purchases could have been made prior to their membership. This
is very unfortunate and creates an uncertainty in how to interpret the findings. It is likely that at
least a portion of the purchases was made prior to becoming members and ideally should not be
part of the survey. Therefore, it is plausible that the proportion of community branded goods is
higher than our survey suggests.
When asking the respondents how likely it is that their next sporting goods purchase will be from
the brand of their community a striking percentage of 91 % in total indicated that it was likely or
very likely that this would be the case. Table 5 shows that the confidence interval is 1.56 - 1.8
thus placing in between the response options Very Likely (1) and Likely (2). These numbers
clearly indicates that the members of the online brand communities show great brand loyalty in
terms of their future purchases. What strengthens this perception is that we can from the survey
infer that only 17 % would choose to buy another brand than their community brand, if their
community brand was temporarily not available for purchase in a future purchase situation. The
majority of members, 52 %, would instead visit another store and buy the community branded
goods there.
The empirical data shows that 78 out of 150 memberships are registered on NIKE+ which
represents a percentage of 52 %. adidas miCoach enjoys membership from 67 out of those 150
memberships, which represents a percentage of 45 %. Taking into account that 9 % of the
respondents have not been members for at least two months and therefore are not included in the
rest of the survey, we however do not know if the percentages above are exactly what they
appear to be in the rest of the survey. Most reasonably, both NIKE’s percentage of 52 % and
adidas miCoach's percentage of 45 % should be considered as slightly lower. Nonetheless, NIKE
received 40 % response selections when the respondents were asked what brand they will buy
next time. adidas miCoach received 28 % response selections on the same question. One should
be careful about drawing conclusions from this, but it looks as if community members of NIKE+
show a slightly higher degree of brand loyalty also in this situation where the members’ future
purchases are being studied. NIKE have a proportion, of the total amount of memberships
registered among the respondents, of most probably slightly below 52 % whilst also 40 % of the
respondents intend to buy a NIKE product next time they buy a piece of sporting goods. adidas
miCoach’s members do not show the same extent of brand loyalty; adidas miCoach enjoys most
probably slightly less than 45 % of the total amount of registered memberships among the

34
respondents, however, only 28% of the future purchases being carried out among the
respondents, will according to the results of the survey be an adidas branded product.
Bagozzi and Dholakia (2006) defines one of the components that constitute a community, as
members deep connection towards each other while feeling a collective sense of difference from
others outside of the community. In addition to this they feel an opposition to other brands which
we have mentioned in previous chapters, called oppositional brand loyalty. In order to measure
the community members potential oppositional brand loyalty we asked our respondents if they
had ever talked in a degrading manner about competitive sporting goods brands. A mere 3 %
strongly agreed and 18 % agreed with the statement, and consequently the majority of
community members do not seem to display oppositional brand loyalty. This is further
confirmed as the confidence interval is 2.40- 2.76 and hence the response options indicating
oppositional loyalty, Agree (4) and Strongly Agree (5), is placed outside of the interval with 95
% certainty. It leads us to believe that the phenomenon of oppositional brand loyalty is not well
dispersed in the context of sporting goods brands’ online brand communities.
Rosenbaum et al. (2011) argue that brand loyal consumers have reluctance to switching brands.
Casaló et al. (2007), explains that psychological aspects of loyalty behaviour, which the
reluctance to switch brands is a specific example of, is difficult to measure and that behavioural
aspects are easier to measure. We therefore measured the reluctance to switch brand in a
behavioural way by asking if the respondents had bought sporting goods from another brand than
their community brand during their membership. It turned out that that 64 % of the respondents
had bought sporting goods from other brands than the community brand during their membership
in the specific online brand community. This number could hardly be interpreted as that the
members of online brand communities in the sporting goods industry show a reluctance to switch
brands, which is also supported in the statistical data from Table 5. This goes against previous
theories like the one of Muniz and O’Guinn (2001) who claim that members of a brand
community are supposed to be more loyal to the own brand. This conclusion could be reinforced
when examining what brand of sporting goods that usually is bought by the respondents.
Since a majority of our respondents, 52 %, are members of NIKE+ it would be natural that the
most bought brand would be NIKE. That is also the case as 62 % of the respondents usually buy
the NIKE brand. However, among our respondents 45 % are members of adidas miCoach, yet
when examining what brand is usually bought among the respondents only 26 % state that they
usually buy the adidas brand. It seems as if there is a considerable amount of respondents who
are members of the adidas miCoach community but prefer to buy NIKE products. From an
adidas brand loyalty point of view, this is unfortunate in building brand loyalty through their
online brand community, whereas for NIKE it seems as consumers are loyal to their brand even
without being members of their community.
Reasons for this could be numerous. We would like to stress that it does not automatically have
to be related to issues concerning online brand communities, but could very well be rooted in
other reasons which are beyond the topic of this paper. However, the theories of Muniz and
O’Guinn (2001) and Shang et al. (2006) are of interest in this case. The first mentioned authors
describe that a brand community consists of a triad formed by two types of relationships, partly
the relationship between the brand and the consumer, partly the relationship between the
community members. The authors say that without interaction and a relationship between
consumers, it is impossible for a brand community to be successful. Since a large proportion of
the members of the adidas miCoach community seem to buy NIKE branded products, we need to

35
take a closer look at how the communities of adidas miCoach and NIKE+ work. As previously
explained, adidas miCoach has not until recently enabled their members to share their
performance and challenge their community friends something NIKE+ has done for some time.
adidas miCoach has traditionally been a meeting point for crowd sourcing in which members
interact with each other when they have a particular issue that they need assistance to manage.
NIKE+ on the other side, has traditionally been focused on keeping a continuously interaction
among the members since the primary focus of the community has been to encourage members
to share their performances and challenge each other on a daily basis. NIKE+’s strategy does
undeniably align closer to the previously discussed theories of Muniz and O’Guinn (2001) and
Chen and Liao (2006).
We can conclude that the reason for this behaviour does not necessarily relate to the topic of
sporting goods brands’ online brand communities. However, when studying the differences in
how NIKE+ and adidas miCoach are operated from a strategically point of view, it is apparent
that NIKE+’s strategy is more uniformed with the scientific theories which deal with how a
successful brand community should be operated. All in all, if the disloyal behaviour shown by
the adidas miCoach members is a result of that adidas miCoach is a poor online brand
community, or if external factors beyond this paper drive this behaviour, we cannot say. But it is
not hard to believe that the NIKE+ community, which has for a long time been more oriented on
keeping a daily interaction, is a strategy which much more enforces brand loyalty in online brand
communities than adidas miCoach’s strategy.
More importantly however, one might argue, are the respondents’ future intentions when buying
sporting goods. We asked the respondents if they intended to continue using the community
brand long term and 70 % agreed to some extent. An average of 3.94 and a very narrow
confidence interval strengthens our argument that we take this as a clear indication of the
members’ plans for being loyal to their community brand.
Lazarevic (2012) have also stressed in her definition of brand loyalty that a brand loyal consumer
express attitudinal and behavioural loyalty regardless of competitors’ actions. This aspect of
brand loyalty was found to be existing in this case of online brand communities within the
sporting goods industry, as we asked if the community members would choose the community
brand even if the price was higher than competitors’ price points. The empirical data shows that
76 % would either agree or strongly agree on continuing using the community brand even if
other brands’ prices were lower, which further confirm that the majority of community members
seems to show signs that would indicate that they are planning on being loyal to the community
brand in the future. This claim is also strengthen through the confidence interval being 3.72 -
4.06, which indicates that we with 95 % certainty can say that the respondents demonstrate an
agreement with the statement.

36
6. Conclusion Below, conclusions that has emerge during this thesis will be presented as well as propositions on further
research in this vast and interesting subject.
The purpose of this thesis was to investigate if the use of online brand communities helps
sporting goods brands in building brand loyalty. Fulfilling this purpose should enable us to
provide an answer to our research question: How do online brand communities affect consumers’
brand loyalty to sporting goods brands? It is clear from the analysis of the collected data that the answer to the research question should
not be considered as an absolute, since the data is not completely uniform. We have found that
many circumstances suggest that online brand communities affect brand loyalty to sporting
goods brands positively, for example a clear majority, more than ¾ of the respondents, are
willing to encourage friends to partake in the community and would also continue to buy the
brand even if it is more expensive than competitive brands. This give us some indications of the
positive affect online brand communities could have on behavioural loyalty. Also, a very high
number of respondents seem to intend their next sporting goods product to be from the
community brand. Trust towards the community brand, which by itself does not create brand
loyalty but however increases commitment to the online brand community and consequently
increases brand loyalty, was also found to have increased significantly among members since
becoming members of an online brand communities. Other circumstances seem to suggest that online brand communities do not affect brand loyalty
for sporting goods brands. For example high levels of respondents have stated to have bought
sporting goods from competitive brands during the time of their membership, however we have
argued against the likelihood of this in previous chapters. Also, the proportion of the community
branded goods among the members total sporting goods purchases have not been shown to be
very high. In addition, the online brand community members do not seem to demonstrate
oppositional brand loyalty, which argues against a positive impact on brand loyalty through
online brand communities in this respect. Oppositional loyalty however, is crème de la crème
and the highest level of brand loyalty and just because the members do not show signs of this
particular loyalty that does not mean that they are not loyal. Taking a look at how the members demonstrate the different types of brand loyalty; our
empirical chapter revealed that the data collected from the survey relating to attitudinal brand
loyalty is quite coherent and unified. The respondents demonstrate some level of attitudinal
brand loyalty when answering all the questions and hence we can argue that online brand
communities in the sporting goods industry seem to have a positive effect on attitudinal brand
loyalty. The data collected about behavioural brand loyalty on the other hand, is less homogenous and
the presence of brand loyalty varies. The respondents’ level of behavioural loyalty is high
regarding recommending the community brand to others and their future purchase intentions,
where a high majority claim to intend to continue using the community brand in spite of different
issues, e.g. higher prize and hard to get a hold on. The members also show signs of being loyal to
the community in present time, after comparing their memberships with their latest bought
brand, particularly NIKE+ members. The online brand community members do not show any

37
signs of oppositional brand loyalty however, and a majority of respondents have asserted that
they, during their membership, have bought sporting goods from competitive brands. This
contradiction makes it more difficult for us to draw a conclusion regarding behavioural brand
loyalty. Though the extent of the loyalty varies some both between the different loyalty types, as well as
depending on community brand, we claim to have found some signs of, and come to the
conclusion that, online brand communities have a positive impact on attitudinal loyalty and
overall also on behavioural brand loyalty within the sporting goods industry. The
acknowledgement on such a relationship, between brand loyalty and online brand communities,
contribute to the marketing field as practitioners can invest time in using this communication
channel to interact with consumers and strengthen brand loyalty.
6.1 Further Research Suggestion During the process of writing this thesis the authors have reflected on some questions that could
be of interest in additional studies concerning this topic.
With additional time and monetary complements a quantitative study with a qualitative follow-
up had been applicable. This would allow the authors to receive more profound knowledge about
the respondents and their actions. A suggestion for further studies could be to look at the same
research question but to choose a qualitative method based on this research. In order to enable
this we would suggest the scholars to collaborate with one or many of the communities to get
their assistance in seeking out respondents, as this has been quite difficult and where, as we have
mentioned, the communities made it hard for us to reach out to community members.
It would also be interesting to see to what extent the communities’ different functions and how
they are run affect consumers’ loyalty levels, since indications of higher levels of loyalty in
communities that enable members to interact have been visible during the process of writing this
paper.
In addition, it would be interesting to study the relationship between online brand communities
and brand loyalty by looking at, and analysing, individual responses instead of looking at the
responses as a whole. We were unable to do this since the data we collected through Enalyzer
did not enable us to follow individual community members.
Our final suggestion for further research is to investigate the subject from a financial point of
view to see what financial benefits an online brand community can have for the company.
38
7. References Aaker, D., (1996b). Measuring Brand Equity Across Products and Markets. California
Management Review, Vol. 38 (No.3) pp.102-120.
Aaker, D., (1996a). Building Strong Brands. New York: The Free Press.
Aaker, D., (1991). Managing Brand Equity. New York: The Free Press.
Aaker, D., Joachimsthaler, E., (2000). Brand Leadership. New York: The Free Press.
adidas. (2013). Adidas miCoach; Find people to follow. Collected 2013-05-20 from
http://community-micoach.adidas.com/people
AMA, American Marketing Association, (2012). Resource Library: Dictionary. Collected 2013-
12-12 from http://www.marketingpower.com/_layouts/dictionary.aspx?dletter=b
Bagozzi, R.P., Dholakia, U. M., (2006). Antecedents and purchase consequences of customer
participation in small group brand communities. International Journal of Research in Marketing
Vol. 23, Iss. 1, pp. 45–61.
Bernhardt, J. M., Mays, D., Hall, A. K., (2012). Social marketing at the right place and right time
with new media. Journal of Social Marketing, Vol. 2, Iss. 2, pp. 130 - 137.
Birkler, J., (2008) Vetenskapsteori - En grundbok. Stockholm: Liber AB.
Brandirectory. (2013). The definitive encyclopedia of brands. Collected 2013-04-13 from
http://brandirectory.com/compare/NTIxLDg2Nyw2MTg%3D
Bruhn, M., Schoenmueller, V., Schäfer, D., (2012). Are social media replacing traditional media
in terms of brand equity creation? Management Research Review, Vol. 35 (No. 9), pp. 770-790.
Butt, O. J., Wang, Y. J., Wei, J., (2011). Digital and Virtual World Research on Brands. Journal
of Brand Management, Vol. 19 Special Iss. 1, pp. 45-56.
Casaló. L., Flavián, C., Guinalíu, M., (2007). The impact of participation in virtual brand
communities on consumer trust and loyalty: The case of free software. Online Information
Review Vol. 31 Iss. 6, pp. 775- 792.
Carroll. A., (2009). Brand communications in fashion categories using celebrity endorsement.
Brand Management Vol. 17, Iss. 2, pp. 146–158.
Chirani, E., Taleghani,M., Moghadam, N.E., (2012). Brand Performance and Brand Equity.
Interdisciplinary Journal of Contemporary Research In Business, Vol. 3 (No 9), pp. 1033-1036.
Christensen, L., Engdahl, N., Grääs, C., and Haglund, L. (2010). Marknadsundersökning – en
handbok. Lund: Studentlitteratur AB.
Ejvegård, R., (2002) Vetenskaplig Metod för Projektarbete. Lund: Studentlitteratur AB.

39
Facebook. (2013). Facebook Search Filters. Collected 2013-05-20 from
https://www.facebook.com/search/results.php?q=puma%20social&type=apps&init=quick&tas=0
.7283539329655468
Felix, R., (2012). Brand communities for mainstream brands: the example of the Yamaha R1
brand community. Journal of Consumer Marketing, Vol. 29 Iss. 3, pp. 225 – 232. Forbes.com (2012, April) The World’s Biggest Public Companies. Collected 2013-01-14 from
http://www.forbes.com/global2000/list/#p_1_s_d3_ApparelSLASHAccessories_All%20countrie
s_All%20states
Ganesh, J., Arnold, M.J. and Reynolds, K.E., (2000). Understanding the customer base of service
providers: an examination of the differences between switchers and stayers. Journal of
Marketing, Vol. 64 (No 3), pp. 65-87.
Global Information (2013, March). Athletic apparel revenue to reach $180 billion a year by
2018.
Collected 2012-03-25 from http://beforeitsnews.com/sports/2013/03/athletic-apparel-revenue-to-
reach-180-billion-a-year-by-2018-2496620.html
Gummerus., J, Liljander., V, Weman., E, Pihlström., M, (2012). Customer engagement in a
Facebook brand community. Management Research Review, Vol. 35 Iss. 9, pp. 857 – 877.
Headstream (2011) Collected 2012-04-10 from http://popsop.com/44090
Hoovers.com (2013, April) Company Profile adidas. Collected 2013/04/11 from
http://www.hoovers.com/company-information/cs/company-
profile.adidas_AG.79a5676ce80e686e.html
Hoovers.com (2013, April) Company Profile NIKE. Collected 2013/04/11 from
http://www.hoovers.com/company-information/cs/company-
profile.NIKE_Inc.095b58e0d70133d6.html
Hoovers.com (2013, April) Company Profile PUMA. Collected 2013/04/11 from
http://www.hoovers.com/company-information/cs/company-
profile.PUMA_SE.e0bd6fc82dc0cea9.html
Hur, W., Ahn, K., Kim, M., (2011). Building brand loyalty through managing brand community
commitment. Management Decision, Vol. 49 Iss. 7, pp. 1194 – 1213.
Interbrand (2013) Best Global Brands 2012 Report. Collected 2013-02-20 from
http://www.interbrand.com/en/best-global-brands/2012
International Telecommunication Union, (2012). Key Global Telecom Indicators for the World
Telecommunication Service Sector. Collected 2012-12-10 from http://www.itu.int/ITU-
D/ict/statistics/at_glance/keytelecom.html
Jacobsen, I. J., (2002). Vad, hur och varför? Om metodval i företagsekonomi och andra
samhällsvetenskapliga ämnen. Lund: Studentlitteratur AB.
40
Janonis, V., Dovalienė, A., Virvilaitė, R., (2007). Relationship of Brand Identity and Image.
Inžinerinė ekonomika. Vol. 1 (No 51). pp. 69-79.
Just-style.com (2007, August) Sportswear market to sprint past recession. Collected 2013-02-20
from http://www.just-style.com/analysis/sportswear-market-to-sprint-past-
recession_id104903.aspx
Keller, K.L., (2008). Strategic Brand Management - Building, Measuring, and Managing Brand
Equity. 3rd Edition. Harlow: Prentice Hall.
Kim, M., Kwang-Ho, A., Won-Moo, H., (2011). Building brand loyalty through managing brand
community commitment. Management Decision, Vol. 49, Iss. 7, pp. 1194-1213.
Kotler, P., Armstrong, G., Wong, V., Saunders, J., (2008). Principles of Marketing. Harlow:
Prentice Hall.
Kotler, P., Keller, K.L., (2012) Marketing Management 14th Edition Global Edition. Harlow:
Pearson.
Kozinets, R.V., de Valck, K., Wojnicki, A.C., Wilner, S.J.S., (2010). Networked narratives:
understanding word-of-mouth marketing in online communities. Journal of Marketing, Vol. 74
(No 3), pp. 71-89.
Lazarevic, V., (2012). Encouraging brand loyalty in fickle generation Y consumers. Young
Consumers: Insight and Ideas for Responsible Marketers, Vol. 13 Iss. 1, pp. 45 - 61.
Lee, N., Lings, I., (2008). Doing Business Research: A guide to theory and practice. London:
Sage Publications Ltd.
Mattson, P., Örtenblad, A., (2008). Smått och Gott om vetenskapliga rapporter och
referensteknik. Lund: Studentlitteratur AB.
Mavis, T.A., Noble, C.H., Noble, S.M., (2012). Enhancing relationships with customers through
online brand communities. MIT Sloan Management Review, Vol. 53 (No 4), pp. 22.
Melin, F., (1999). Varumärkesstrategi. Malmö: Liber.
Muniz, A.M Jr., O’Guinn, T.C., (2001). Brand Community. Journal of Consumer Research, Vol.
27 (No 4), pp. 412-432.
Møller Jensen, J., Hansen, T., (2006). An empirical examination of brand loyalty. Journal of
Product & Brand Management, Vol. 15 Iss. 7, pp. 442 - 449.
Mörling, M., Strannegård, L., (2004). Silence of the brands. European Journal of Marketing,
Vol. 38 (1/2), pp. 221-238.
Nam, J., Ekinci, Y., Whyatt, G., (2011). Brand equity, brand loyalty and consumer satisfaction.
Annals of Tourism Research, Vol. 38 Iss. 3, pp 1009-1030.

41
Nike. (2013). The new NIKE+ running experience: smarter, more social, more motivational.
Collected 2013-05-20 from http://nikeinc.com/news/nikeplus-experience
Park, H., Cho, H., (2012). Social network online communities: information sources for apparel
shopping. Journal of Consumer Marketing, Vol. 29 Iss. 6, pp. 400 - 411.
Patel, R., Davidson, B., (2011). Forsknings-metodikens grunder: Att planera, genomföra och
rapportera en undersökning. Lund: Studentlitteratur AB.
Pelsmacker, P., Geuens, M., Bergh, J., (2010). Marketing Communication: A European
perspective 4th Edition. Harlow: Prentice Hall.
Phillips, K., (2003). Brand Equity. Beverage World, Vol. 122 (No 1733), pp. 44.
Pwc.co.uk (2012) Collected 2012-02-22 from
http://www.pwc.co.uk/consulting/issues/changing-the-game-outlook-for-the-global-sports-
market-to-2015.jhtml
Ratten, V., Ratten, H., (2011). International sport marketing: Practical and future research
implications. Journal of Business & Industrial Marketing, Vol. 26, Iss. 8, pp. 614-620.
Reportlinker.com (2012). Sport Clothing and Accessories Industry: Market Research Reports,
Statistics and Analysis. Collected 2013-04-02 from
http://www.reportlinker.com/ci02121/Sport-Clothing-and-Accessories.html
Roberts, K., (2004). Lovemarks - The Future Beyond Brands. powerHouse Books.
Rosenbaum-Elliott, R., Percy, L., Pervan, S., (2011). Strategic Brand Management. 2nd Edition.
Oxford University Press.
Rowley, J., (2005). The four Cs of customer loyalty. Marketing Intelligence & Planning, Vol. 23
Iss. 6, pp. 574 - 581.
Royo-Vela, M., Casamassima, P., (2011). The influence of belonging to virtual brand
communities on consumers' affective commitment, satisfaction and word-of-mouth advertising:
The ZARA case, Online Information Review, Vol. 35 Iss. 4, pp. 517 – 542.
Salinas, G., (2009). The International Brand Valuation. Chichester: John Wiley & Sons.
Saunders, M., Lewis, P., Thornhill, A., (2009). Research methods for business students. 5th
Edition. Harlow: Prentice Hall.
Sempo.org (2010). SEM Glossary. Collected 2012-12-12 from
http://www.sempo.org/?page=glossary&hhSearchTerms=dictionary#s
Shang, R., Chen, Y., Liao, H., (2006). The value of participation in virtual consumer
communities on brand loyalty. Internet Research, Vol. 16 Iss. 4, pp. 398 - 418.
Sheean, B., (2010). Online Marketing. London: AVA Publishing.

42
Silveira, C., Lages, C., Simões, C., (2013). Reconceptualizing brand identity in a dynamic
environment. Journal of Business Research, Vol. 66 (No 1), pp. 28-36.
Sicilia, M., Palazón, M., (2008). Brand communities on the internet: A case study of Coca-Cola's
Spanish virtual community. Corporate Communications: An International Journal, Vol. 13 Iss.
3, pp. 255 - 270.
Smith, A., Segall, L., Cowley, S., (2012). Facebook reaches one billion users. CNN Money.
Collected 2013-02-10 from http://money.cnn.com/2012/10/04/technology/facebook-billion-
users/index.html
Solomon. M., Bamossy. G., Askegaard. S., Hogg. M.K. (2009) Consumer behaviour - A
European Perspective 4th Edition. Prentice Hall.
Tiwari, M.K., (2010). Separation of Brand Equity and Brand Value. Global Business Review,
Vol. 11(No 3), pp. 421–434.
Tong. X., Hawley., J.M (2009) Measuring customer-based brand equity: empirical evidence
from the sportswear market in China. Journal of Product & Brand Management Vol. 8 Iss. 4, pp.
262–271.
Veblen, T., (1975). The Theory of the Leisure Class. Collected 2012-12-16 from
http://digamo.free.fr/veblen99.pdf
Wood, L., (2000). Brands and brand equity: definition and management. Management Decision
Vol. 38 Iss. 9, pp. 662-669.
Zeithaml, V.A., (1988). Consumer perception of price, quality, and value: A means-end model
and synthesis of evidence. Journal of Marketing. Vol. 52 (No 3), pp. 2-22.

43
8. Appendix
8.1 Questionnaire
Online Brand Community
We are two Swedish students currently developing a research into the consumer behaviour of the members of sporting goods brands’ online brand communities. The information collected will be totally confidential and will be the foundation of our examination paper in international marketing. For the approval of our thesis your cooperation is essential and we would appreciate if you could spare 4 minutes to complete this questionnaire. This is a non-profit work and the only benefit that we receive is strictly academic. Below are a few clarifications of terms which will help to simplify the completion of the questionnaire. Online brand community = A place on the specific brand’s website where people can meet and interact while a brand has a central role. Community brand = The brand of which the community belong. For example: NIKE+ => NIKE, adidas miCoach => adidas, PUMA Social=> PUMA. Sporting goods = Sporting gear in terms of apparel, footwear, equipment, accessories and services. Thank you so much in advance, your participation is much appreciated! Kind Regards Caroline Benson and Martin Hedrén
Please enter your sex
Male Female
Please enter your age
20 or younger 21-30 31-40 41-50 51-60

44
Are you a member of any of the following online brand communities: NIKE+, adidas miCoach, PUMA Social?
Yes No - Go to 27
Which of the following online brand communities are you a member of? If member of more than one community please mark multiple answers.
NIKE+ adidas miCoach PUMA Social
How long have you been a member of that/those community/communities?
Less than 1 month - Go to 27
1-2 months - Go to 27
More than 2 months but less than 7 months
7-12 months More than 1 year
Do you consider yourself to have positive feelings towards your community brand?
Yes No I don't know
Do you consider yourself to have positive feelings towards your community?
Yes No I don't know
Have you ever recommended your community brand to people you know?
Yes No

45
If yes, how often?
As often as possible Now and again Seldom Never
Please grade your level of agreement with the following statements 1-5, 1 being the lowest, 5 being the highest. I feel a sense of belonging with my community brand
1 strongly disagree 2 disagree 3 neutral 4 agree 5 strongly agree
I trust my community brand
1 strongly disagree 2 disagree 3 neutral 4 agree 5 strongly agree
I am willing to say positive things about the community brand to other people
1 strongly disagree 2 disagree 3 neutral 4 agree 5 strongly agree
I will encourage friends and relatives to use the community brand
1 strongly disagree 2 disagree 3 neutral 4 agree 5 strongly agree
I intend to continue using the community brand for a long time
1 strongly disagree 2 disagree 3 neutral 4 agree 5 strongly agree
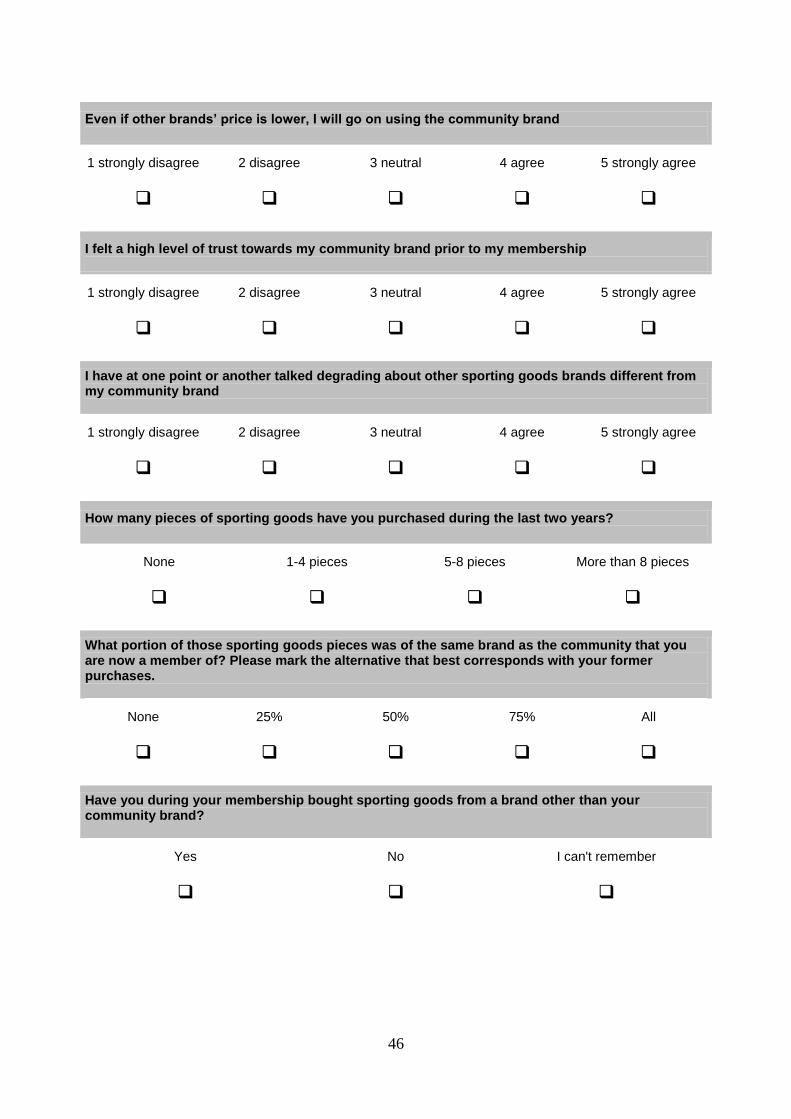
46
Even if other brands’ price is lower, I will go on using the community brand
1 strongly disagree 2 disagree 3 neutral 4 agree 5 strongly agree
I felt a high level of trust towards my community brand prior to my membership
1 strongly disagree 2 disagree 3 neutral 4 agree 5 strongly agree
I have at one point or another talked degrading about other sporting goods brands different from my community brand
1 strongly disagree 2 disagree 3 neutral 4 agree 5 strongly agree
How many pieces of sporting goods have you purchased during the last two years?
None 1-4 pieces 5-8 pieces More than 8 pieces
What portion of those sporting goods pieces was of the same brand as the community that you are now a member of? Please mark the alternative that best corresponds with your former purchases.
None 25% 50% 75% All
Have you during your membership bought sporting goods from a brand other than your community brand?
Yes No I can't remember

47
Which brand of sporting goods do you usually buy for most part?
NIKE
adidas
PUMA
Reebok
Under Armour
Other
Do you also buy products from any of the following brands? Multiple answers are allowed.
NIKE
adidas
PUMA
Reebok
Under Armour
Other
Which brand did you most recently buy?
NIKE
adidas
PUMA
Reebok
Under Armour
Other

48
What brand do you think you will buy next time you buy sporting goods? Multiple answers are allowed.
NIKE
adidas
PUMA
Reebok
Under Armour
Other
How likely is it that your next sporting goods purchase will be from the brand of your community?
Very likely Quite likely Not quite likely Not likely
If your community brand had temporarily not been available for purchase, what would you do?
Wait Go to a different store Buy another brand Other
Thank You!
Please press "End Survey" in order to send your answers. Your participation is much appreciated! Caroline and Martin

HALMSTAD UNIVERSITY • PO Box 823 • SE-301 18 Halmstad, Sweden • www.hh.se


