ONTARIO ENERGY REPORT Q3 2015 JULY – SEPTEMBER 2015 OIL AND NATURAL GAS 1 Natural Gas Effective Prices (¢/m 3 ) Union Gas 11.17¢ Enbridge 14.75¢ Source: OEB Natural Gas Rates effective July 1, 2015. Eastern Canada Natural Gas Storage Balance (at quarter end) 233.9 Bcf Bcf of Gas in Storage (for week ending September 25, 2015) Source: Canadian Enerdata Ltd. In Eastern Canada, natural gas is stored primarily at Dawn hub near Sarnia. Regular Gasoline and Diesel Provincial Average Retail Prices ($/L) Regular Gasoline $1.11 Diesel $1.05 Source: Ministry of Energy Fuel Prices. Average Natural Gas Spot Price ($/GJ) Dawn (ON) $3.68 Henry Hub (US) $3.42 AECO (AB) $2.75 Source: Dawn and AECO from Canadian Enerdata Ltd.; Henry Hub from U.S. Energy Information Administration. Gas Transmission TransCanada Mainline Union Gas TransCanada’s Delivery Areas Western Delivery Area Northern Delivery Area North Central Delivery Area Eastern Delivery Area Central Delivery Area Southwestern Delivery Area Storage Area Interconnection Point Legend Natural Gas Transmission Infrastructure
Transcript
ONTARIO ENERGY REPORT Q3 2015
JULY – SEPTEMBER 2015OIL AND NATURAL GAS
1
Natural Gas Effective Prices (¢/m3)
Union Gas 11.17¢
Enbridge 14.75¢
Source: OEB Natural Gas Rates effective July 1, 2015.
Eastern Canada Natural Gas Storage Balance (at quarter end)
233.9 BcfBcf of Gas in Storage (for week ending September 25, 2015)
Source: Canadian Enerdata Ltd. In Eastern Canada, natural gas is stored primarily at Dawn hub near Sarnia.
Regular Gasoline and Diesel Provincial Average Retail Prices ($/L)
Regular Gasoline $1.11
Diesel $1.05
Source: Ministry of Energy Fuel Prices.
Average Natural Gas Spot Price ($/GJ)
Dawn (ON) $3.68
Henry Hub (US) $3.42
AECO (AB) $2.75
Source: Dawn and AECO from Canadian Enerdata Ltd.; Henry Hub from U.S. Energy Information Administration.
Gas Transmission
TransCanada Mainline
Union Gas
TransCanada’s Delivery Areas
Western Delivery Area
Northern Delivery Area
North Central Delivery Area
Eastern Delivery Area
Central Delivery Area
Southwestern Delivery Area
Storage Area
Interconnection Point
Legend
Natural Gas Transmission Infrastructure
Ontario Energy Report Q3 2015 – Oil and Natural Gas July – September 2015
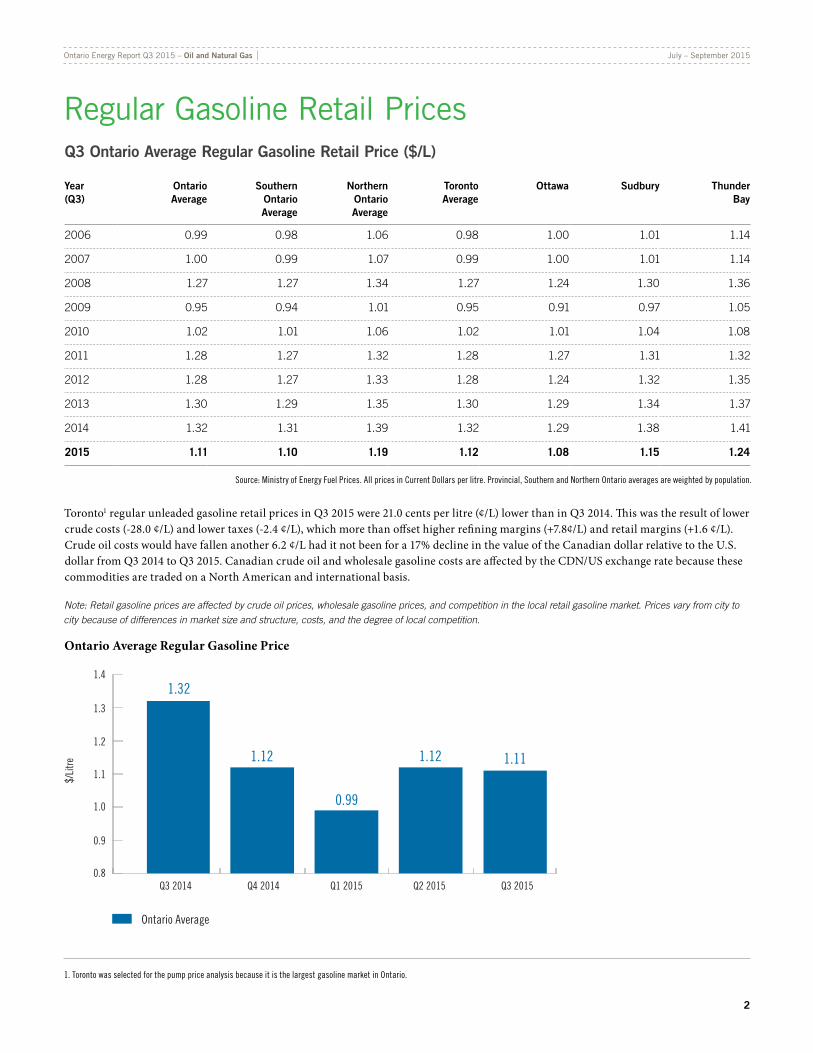
Source: Ministry of Energy Fuel Prices. All prices in Current Dollars per litre. Provincial, Southern and Northern Ontario averages are weighted by population.
Toronto1 regular unleaded gasoline retail prices in Q3 2015 were 21.0 cents per litre (¢/L) lower than in Q3 2014. This was the result of lower crude costs (-28.0 ¢/L) and lower taxes (-2.4 ¢/L), which more than offset higher refining margins (+7.8¢/L) and retail margins (+1.6 ¢/L). Crude oil costs would have fallen another 6.2 ¢/L had it not been for a 17% decline in the value of the Canadian dollar relative to the U.S. dollar from Q3 2014 to Q3 2015. Canadian crude oil and wholesale gasoline costs are affected by the CDN/US exchange rate because these commodities are traded on a North American and international basis.
Note: Retail gasoline prices are affected by crude oil prices, wholesale gasoline prices, and competition in the local retail gasoline market. Prices vary from city to city because of differences in market size and structure, costs, and the degree of local competition.
Ontario Average Regular Gasoline Price
0.8
0.9
1.0
1.1
1.2
1.3
1.4
Q3 2014 Q4 2014 Q1 2015 Q2 2015 Q3 2015
Ontario Average
1.11
1.32
1.12
0.99
1.12
$/Li
tre
1. Toronto was selected for the pump price analysis because it is the largest gasoline market in Ontario.
Ontario Energy Report Q3 2015 – Oil and Natural Gas July – September 2015
3
Retail Diesel PricesQ3 Ontario Average Diesel Retail Prices ($/L)
Year (Q3)
Ontario Average
Southern Ontario Average
Northern Ontario Average
Toronto Average
Ottawa Sudbury Thunder Bay
2006 0.99 0.99 1.01 0.99 0.99 1.00 N/A
2007 0.95 0.95 0.97 0.95 0.95 0.96 N/A
2008 1.33 1.32 1.37 1.32 1.33 1.36 1.37
2009 0.89 0.88 0.91 0.88 0.89 0.91 0.91
2010 0.99 0.99 1.01 0.99 1.00 1.00 1.01
2011 1.23 1.23 1.24 1.23 1.24 1.25 1.24
2012 1.21 1.21 1.25 1.21 1.22 1.23 1.27
2013 1.25 1.25 1.29 1.25 1.27 1.28 1.33
2014 1.28 1.27 1.32 1.27 1.29 1.28 1.38
2015 1.05 1.04 1.08 1.05 1.04 1.05 1.10
Source: Ministry of Energy Fuel Prices. All prices in Current Dollars per litre. Provincial, Southern and Northern Ontario averages are weighted by population.
Toronto1 retail diesel prices in Q3 2015 were 22.1 ¢/L lower than in Q3 2014. This was the result of lower crude oil costs (-28.0 ¢/L) and lower taxes (-2.5 ¢/L), which more than offset higher refining margins (+6.2 ¢/L) and retail margins (+2.3 ¢/L). Crude oil costs would have fallen another 6.2 ¢/L had it not been for a 17% decline in the value of the Canadian dollar relative to the U.S. dollar from Q3 2014 to Q3 2015. Canadian crude oil and wholesale diesel costs are affected by the CDN/US exchange rate because these commodities are traded on a North American and international basis.
Note: Retail diesel prices are affected by crude oil prices, wholesale diesel prices, and competition in the local retail diesel market. Prices vary from city to city because of differences in market size and structure, costs, and the degree of local competition.
Ontario Average Retail Diesel Price
0.8
0.9
1.0
1.1
1.2
1.3
1.4
Q3 2014 Q4 2014 Q1 2015 Q2 2015 Q3 2015
Ontario Average
1.05
1.281.22
1.14 1.13
$/Li
tre
1. Toronto was selected for the pump price analysis because it is the largest gasoline market in Ontario.
Ontario Energy Report Q3 2015 – Oil and Natural Gas July – September 2015
4
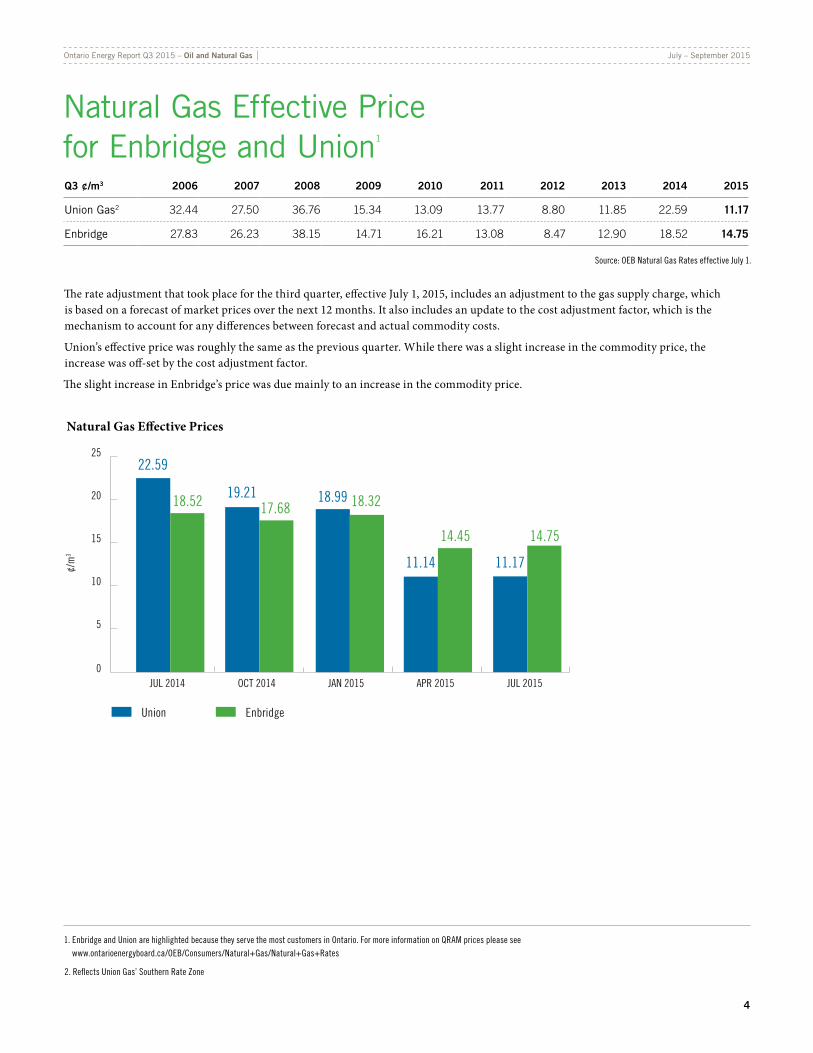
Natural Gas Effective Price for Enbridge and Union1
The rate adjustment that took place for the third quarter, effective July 1, 2015, includes an adjustment to the gas supply charge, which is based on a forecast of market prices over the next 12 months. It also includes an update to the cost adjustment factor, which is the mechanism to account for any differences between forecast and actual commodity costs.
Union’s effective price was roughly the same as the previous quarter. While there was a slight increase in the commodity price, the increase was off-set by the cost adjustment factor.
The slight increase in Enbridge’s price was due mainly to an increase in the commodity price.
Natural Gas Effective Prices
18.52 19.2117.68
18.99 18.32
11.14
14.45
11.17
14.75
22.59
0
5
10
15
20
25
¢/m
3
JUL 2015
Union Enbridge
JUL 2014 OCT 2014 JAN 2015 APR 2015
1. Enbridge and Union are highlighted because they serve the most customers in Ontario. For more information on QRAM prices please see www.ontarioenergyboard.ca/OEB/Consumers/Natural+Gas/Natural+Gas+Rates
2. Reflects Union Gas’ Southern Rate Zone
Ontario Energy Report Q3 2015 – Oil and Natural Gas July – September 2015
5
Average Natural Gas Spot PricesMonthly average prices at Dawn, ON ($/GJ)
$/GJ
$/GJ
JUL2015
AUG2015
SEP2015
0
1
2
3
4
5
6
JUL2014
AUG2014
SEP2014
OCT2014
NOV2014
DEC2014
JAN2015
APR2015
FEB2015
MAR2015
JUN2015
MAY2015
Source: Canadian Enerdata Ltd.
Quarterly average natural gas spot prices at select trading hubs ($/GJ)
Source: Dawn and AECO prices from Canadian Enerdata Ltd.; Henry Hub prices from U.S. Energy Information Administration.
Q3 2014
$/GJ
4.064.21 4.344.05
3.42
4.31
3.38
2.63
3.36 3.18
2.52
3.683.42
2.75
3.81
Q4 2014 Q1 2015 Q2 2015 Q3 2015
Dawn Henry Hub AECO
0
1
2
3
4
5
Ontario Energy Report Q3 2015 – Oil and Natural Gas July – September 2015
6
Quarterly average natural gas spot prices at select trading hubs ($/GJ)
Source: Dawn and AECO from Canadian Enerdata Ltd.; Henry Hub from U.S. Energy Information Administration.
Natural gas prices at Dawn hub were approximately 13% lower in Q3 2015 than in the same quarter last year.
The average price in the first nine months of 2015 has been substantially lower than the 2014 average at all three hubs. (Recall: The winter of 2013-2014 was notably long and cold.)
Production in regions exporting natural gas to Ontario was very strong in Q3 2015 and supply remains strong.
Annual average natural gas spot prices at select trading hubs ($/GJ)
Trading Hub
2014
2015 to the end of Q3
Dawn (ON) 6.51 3.78
Henry Hub (US) 4.57 3.33
AECO (AB) 4.26 2.63
Source: Dawn and AECO from Canadian Enerdata Ltd.; Henry Hub from U.S. Energy Information Administration.
Natural gas price forecasts for select trading hubs, 2015 and 2016
Trading Hub 2015 2016 2017
Dawn (ON) US$3.05/MMBtu US$2.46/MMBtu US$2.60/MMBtu
Henry Hub (US) US$2.78/MMBtu US$2.97/MMBtu US$3.09/MMBtu
AECO (AB) C$2.67/GJ C$3.04/GJ C$3.31/GJ
Source: Canadian Enerdata Ltd. as of October 1, 2015.
Ontario Energy Report Q3 2015 – Oil and Natural Gas July – September 2015
7
Eastern Canada Natural Gas Storage Balances (as of quarter end)
Storage Survey Week
Storage Level (Billion Cubic Feet)
Storage Level vs. Same Week the Year Before (%)
Storage Level vs. Total Capacity (%)
Q3 2014 – Sept 19, 2014 223.0 120% 87%
Q4 2014 – Dec 26, 2014 221.9 150% 82%
Q1 2015 – March 20, 2015 48.5 213% 18%
Q2 2015 – June 26, 2015 123.0 127% 44%
Q3 2015 – Sept 25, 2015 233.9 105% 84%
Source: Canadian Enerdata Ltd.
Note: In Q3 2015, 233.9 bcf represented only 84% of total capacity (compared to Q3 2014 where 223.0 bcf was 87% of capacity) because capacity increased during that time from 255.7 bcf to 279.0 bcf.
In Eastern Canada, natural gas is stored primarily at Dawn, ON with a small amount of storage in New Brunswick.
Natural gas storage levels in Eastern Canada continued to rise in Q3 2015 and were slightly above levels at the same time last year.
According to seasonal patterns, storage levels normally peak in late October or early November as withdrawals for natural gas heating begin to outpace storage injections. Prices are also more likely to see a cyclical rise during the winter heating season.