Oil market highlights Crude Oil Price Movements The OPEC Reference Basket fell $1.23 in March to average $104.15/b. Global crude oil markets were impacted by the slowing pace of economic growth in China, lower refinery demand, and ample supply, which outweighed supply disruptions and geopolitical tensions. The Nymex WTI front-month slipped by a marginal 17¢ to average $100.51/b, while ICE Brent dropped $1.09 to average $107.75/b. This caused the Brent-WTI spread to narrow further, averaging $7.25/b in March.
World Economy World economic growth for 2014 has been revised down to 3.4%, while the 2013 growth estimate remains at 2.9%. The OECD is forecast to grow by 2.0% in 2014, compared to 1.3% in the previous year. China’s growth for 2014 has been revised down to 7.5%, following growth of 7.7% in 2013. India’s 2014 forecast remains at 5.6% and the estimate for 2013 at 4.7%.
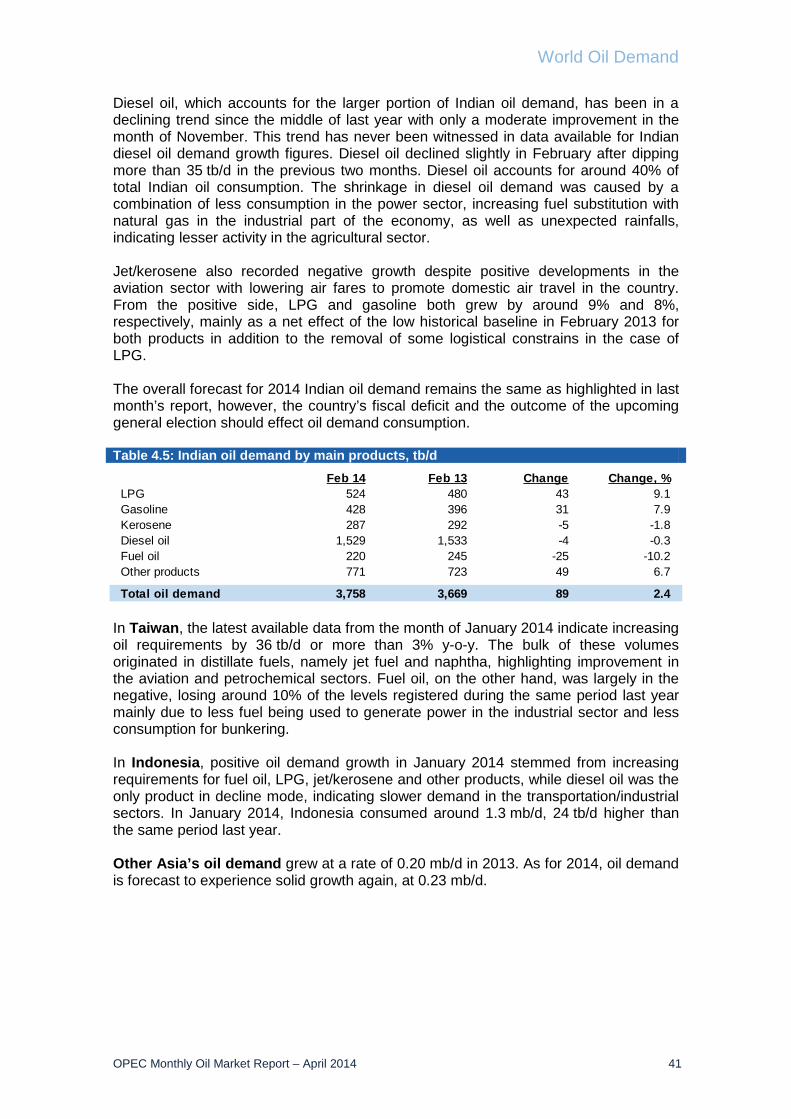
World Oil Demand World oil demand is forecast to grow by 1.14 mb/d in 2014, broadly unchanged from the previous report, to average 91.2 mb/d. In 2013, world oil demand grew by 1.05 mb/d to average 90.01 mb/d, also in line with the prior assessment. The bulk of growth came from non-OECD, as most of the OECD is still showing a contraction.
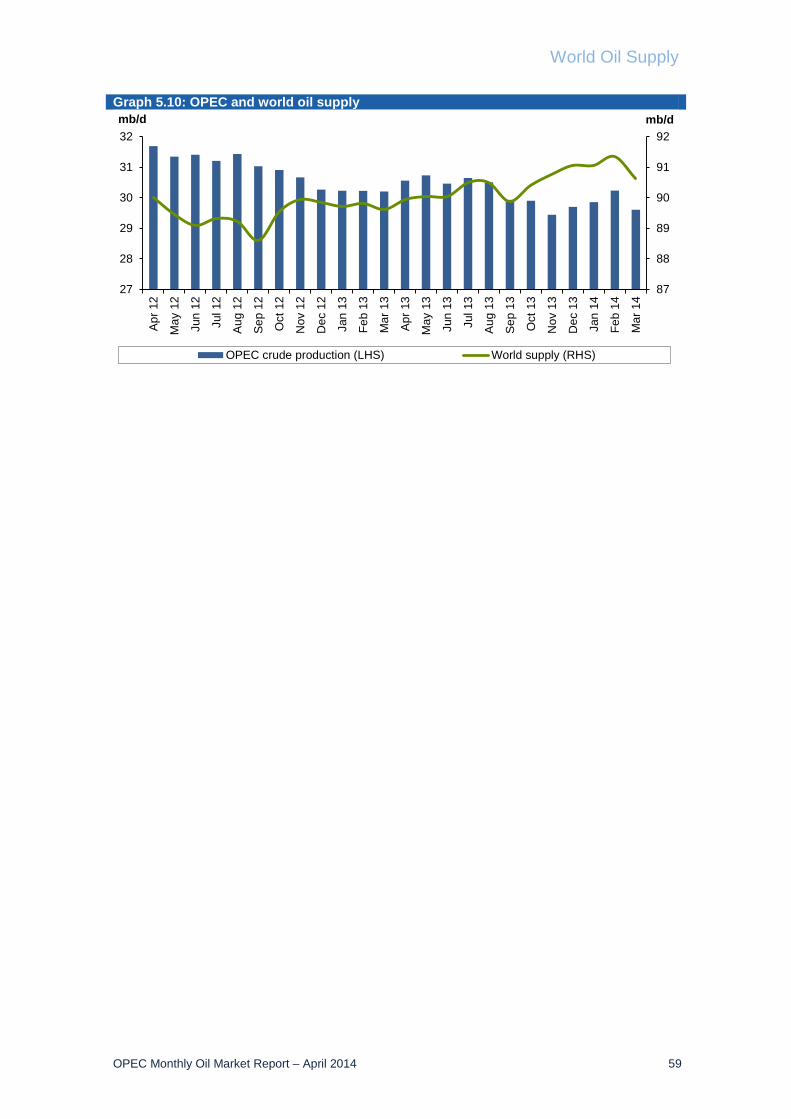
World Oil Supply Non-OPEC oil supply growth in 2014 was revised up to stand at 1.37 mb/d. The estimate for 2013 growth was also increased slightly to 1.34 mb/d. Growth this year is seen coming mainly from the US, Canada, and Brazil, while Norway, UK and Mexico are expected to decline. OPEC NGL production is forecast to average 5.95 mb/d in 2014. In March, OPEC crude oil production as estimated by secondary sources averaged 29.61 mb/d, down by 0.63 mb/d from a month ago.
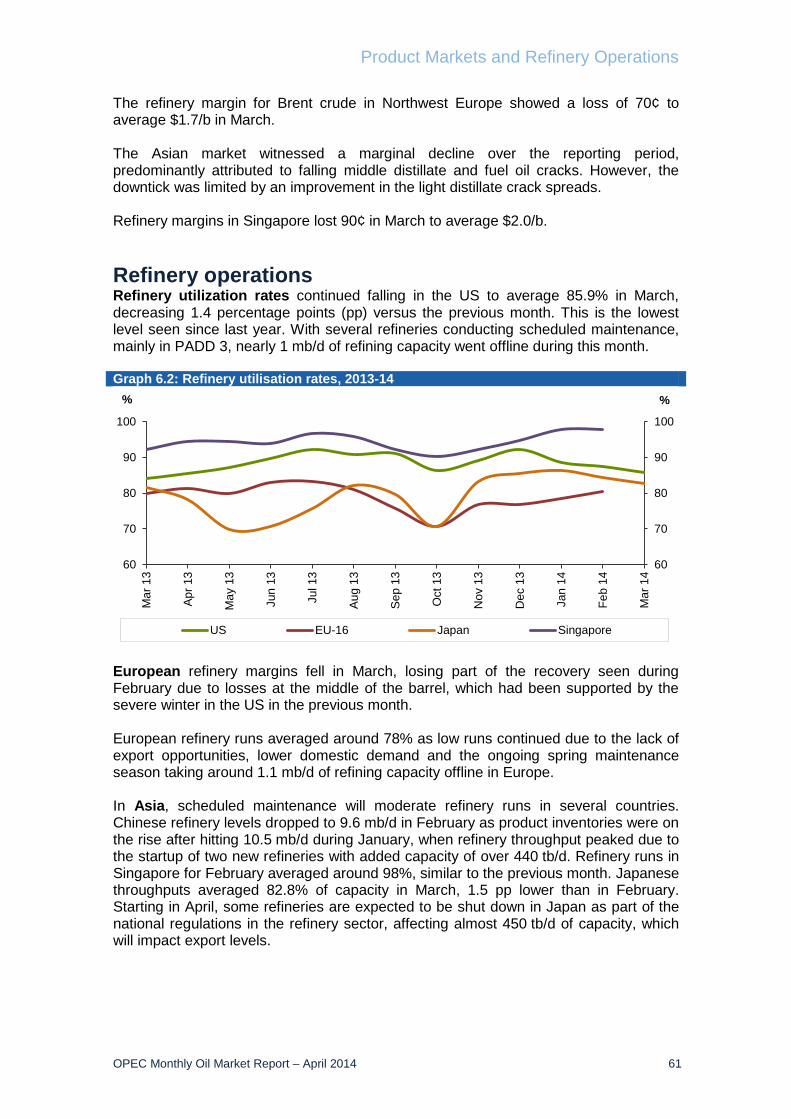
Product Markets and Refining Operations Product markets in the Atlantic Basin have begun to weaken since mid-March on diminished support from heating fuel demand in the US. Product markets in Europe have also weakened due to a decline in export opportunities. In Asia, the negative performance at the middle and bottom of the barrel outweighed the continued recovery in light distillates.
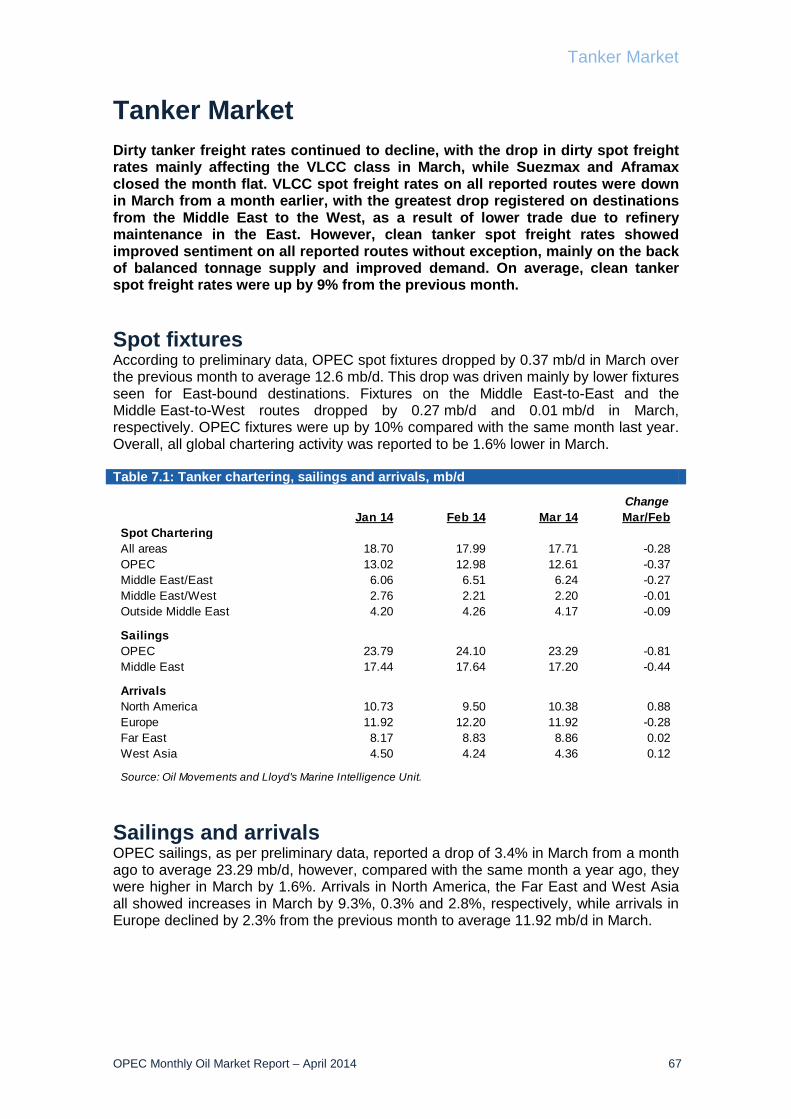
Tanker Market Dirty tanker spot freight rates declined in March, mainly on the back of lower tonnage demand and refinery maintenance in the east. Tonnage availability on many key routes continued to pressure tanker spot freight rates, which declined 5%. Clean tanker spot freight rates improved, with east and west of Suez rates up by 7% and 10% respectively.
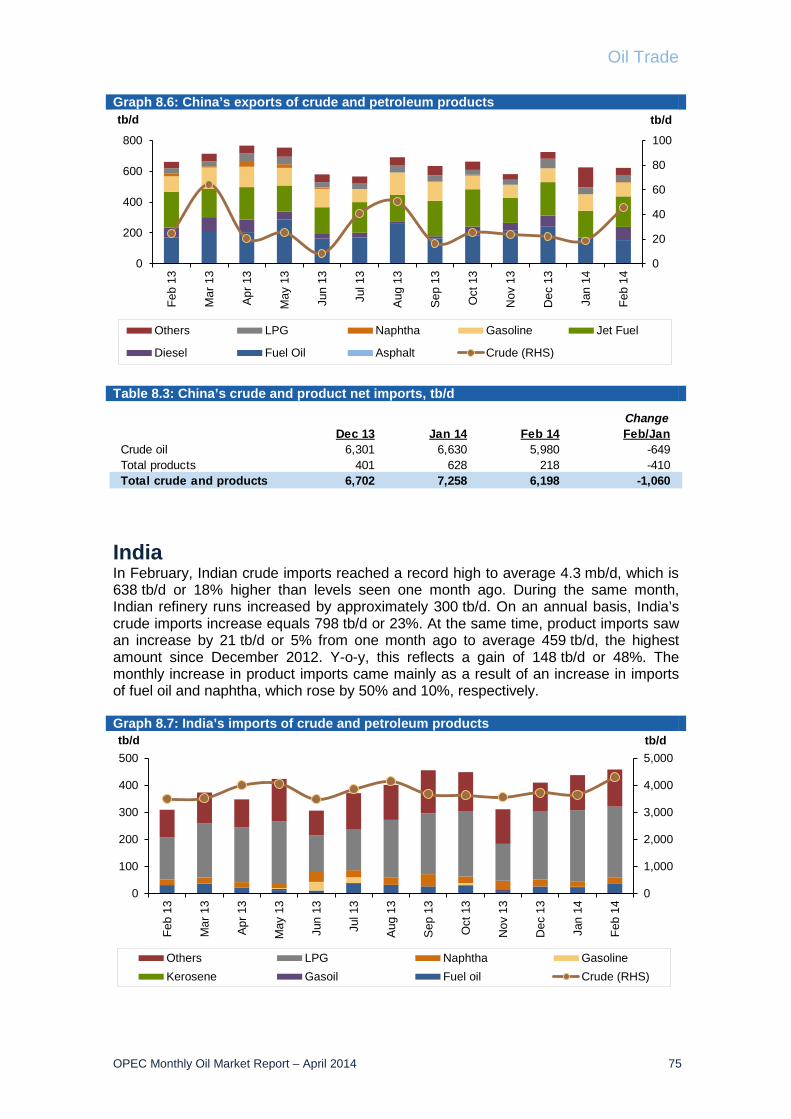
Stock Movements OECD commercial oil stocks continued to fall in February, driven by a decline in products, as crude stocks experienced a build. Compared to the five-year average, crude and product stocks showed a deficit of 35 mb and 96 mb, respectively. In terms of days of forward cover, OECD commercial stocks rose by 0.2 days in February to stand at 56.5 days. In March, US total commercial oil stocks rose, but remained 36.0 mb below the five-year average, with crude around 11.1 mb above the seasonal norm.
Balance of Supply and Demand Demand for OPEC crude in 2014 saw a downward revision of 0.1 mb/d to average 29.6 mb/d, representing a decline of 0.4 mb/d compared to last year. Demand for OPEC crude in 2013 remains unchanged from the last MOMR at 30.0 mb/d, which is 0.5 mb/d lower than the previous year.
Oil Market Highlights
2 OPEC Monthly Oil Market Report – April 2014
OPEC Monthly Oil Market Report – April 2014 3
Summer oil market outlook In the summer, the oil market is generally driven by product market developments, particularly gasoline and to some extent diesel demand. Before turning to the outlook for the product markets, it is important to first review developments seen in recent months.
Product markets in 4Q13 showed a mixed picture across the globe, with US heating fuel demand strengthening, supported by the severe winter. However, this was partially outweighed by reduced demand for motor fuels, as the extended cold snap disrupted driving habits, which limited some of the gains in refinery margins. The extreme cold weather also attracted higher imports of gasoil to the US East Coast, thus capping a further rise in prices. With the end of winter, demand for heating fuels in the US has declined, encouraging a restart in exports in March with several cargoes scheduled to leave the US Gulf Coast, mainly to Latin America, West Africa and Europe.
In contrast, European margins continued to be impacted by reduced domestic demand. This was despite the open gasoil arbitrage to the US East Coast, which lasted until mid-March. Meanwhile, Asian refinery margins have maintained a slight recovering trend on the back of stronger demand, mainly from the petrochemical industry.
Looking ahead, global product markets are expected to receive support from gasoline demand, not only from the on-going recovery in consumption in the OECD region (Graph 1), but also increasing demand growth in Asia. Factors driving the improvement in the OECD have been the better-than-expected growth in the US economy, increasing US car sales, and the European economies’ return to growth. In Asia, rising gasoline demand has been driven by demand growth in China, where refineries – which have traditionally been geared to high diesel production – have been switching yields towards gasoline to meet the continued increase in demand (Graph 2).
At the same time, the diesel market should see support from the on-going recovery in demand for that product in the OECD. This would offset the reduction in growth coming from Asia, where the slowing pace of the Chinese economy has damped demand growth for diesel. On the supply side, diesel production is projected to increase this year, with 700 tb/d of additional refining capacity coming on line in the Middle East and China. Meanwhile, in the Atlantic Basin, the addition of several hydrocrackers will increase the availability of diesel in the region. Amid this improving balance in the diesel market, gasoline is expected to assume its traditional role as the main driver of the market during the summer season, supported by the on-going increase in demand.
Moreover, with the end of the winter season, oil markets have now entered into a period of lower demand, which provides the opportunity to re-build tight product inventories in the OECD. Seasonal refinery maintenance this spring will also allow OECD crude stocks to replenish. These developments, along with the continued build in inventories in non-OECD Asia, will represent a supply buffer for the market ahead of the summer driving season.
-400
-300
-200
-100
0
100
200
Jan12
Mar12
May12
Jul12
Sep12
Nov12
Jan13
Mar13
May13
Jul13
Sep13
Nov13
Jan14
tb/d
Motor gasoline Gas/diesel oil
-500
50100150200250300350400
Jan12
Mar12
May12
Jul12
Sep12
Nov12
Jan13
Mar13
May13
Jul13
Sep13
Nov13
Jan14
tb/d
Motor gasoline Gas/diesel oil
4 OPEC Monthly Oil Market Report – April 2014
Crude Oil Price Movements
OPEC Monthly Oil Market Report – April 2014 5
Crude Oil Price Movements The OPEC Reference Basket dipped below $105/b in March to average $104.15/b as the global crude market slowed over the month, impacted by concerns over China’s economic growth, lower refinery demand and ample availability, outweighing ongoing supply outages and geopolitical tension. ICE Brent declined by 1% m-o-m amid extremely weak market fundamentals, despite drawing support from Libyan supply outages and the situation in Ukraine. Nymex WTI also fell, though moderately, remaining above the $100/b mark, steadied by a continued drawdown in oil stocks at Cushing, Oklahoma. Nymex WTI front-month slipped by a marginal 17¢, to average $100.51/b, while ICE Brent front-month dipped by $1.09 to an average of $107.75/b. The stronger gains for WTI relative to Brent continued to narrow the transatlantic spread, with the Brent–WTI spread averaging at a six-month low. OPEC Reference Basket The OPEC Reference Basket (ORB) slipped below the $105/b level in March to around $104/b, as the global crude market lost momentum over the month, impacted by concerns over a slowdown in China’s economic growth, lower demand and ample supply availability, despite ongoing production outages in Libya and geopolitical tension in Ukraine. Crude prices fell in most regions, as northern hemisphere temperatures rose and refineries entered maintenance, while the situation between Russia and the Ukraine did not lead to any immediate energy supply losses. The Brent market reached its lowest outright prices in almost five months, as poor refining margins weighed on light sweet crude in Europe. Medium sour grades were also plentiful, as maintenance at Russian refineries frees up more crude for export. Graph 1.1: Crude oil price movement, 2013-14
In Asia-Pacific demand was thin, weighing on Middle East crude values and causing many to lower their official selling price formulae. In the US Gulf Coast (USGC), the sale of sour crude from the US Strategic Petroleum Reserve (SPR) weighed temporarily on sour grades, while the inland sour crude differential to WTI at Cushing widened significantly in the face of limited storage in Midland for rising crude output. Meanwhile, Libya's exports have been well below the country’s capacity of around 1.25 mb/d since July 2013.
90
95
100
105
110
115
120
90
95
100
105
110
115
120
01 N
ov
08 N
ov
15 N
ov
22 N
ov
29 N
ov
06 D
ec
13 D
ec
20 D
ec
27 D
ec
03 J
an
10 J
an
17 J
an
24 J
an
31 J
an
07 F
eb
14 F
eb
21 F
eb
28 F
eb
07 M
ar
14 M
ar
21 M
ar
28 M
ar
04 A
pr
US$/bUS$/b
OPEC Basket WTI Brent Dated
Crude Oil Price Movements
6 OPEC Monthly Oil Market Report – April 2014
On a monthly basis, the ORB dropped to an average of $104.15/b in March, down $1.23, or 1.17%, from the previous month. On a year-to-date basis, the ORB was also lower compared with the same period a year ago. The ORB year-to-date value stood at $104.73/b compared with an average of $109.48/b the previous year at the same period. On a quarterly basis, the ORB was $1.69 or 1.6% lower than in the previous quarter. Table 1.1: OPEC Reference Basket and selected crudes, US$/b
All Basket component values decreased in March, particularly Ecuador’s Oriente, which dropped 2.6% after a significant 4% increase from the previous month. Despite the continued disruption of Libyan supplies, Brent-related light sweet crudes were pressured by plentiful supplies, a 25% increase in exports of BTC Blend and weaker light product margins, which weighed on regional light sweet crudes. Weak naphtha margins and an excess of light crude in the Mediterranean region weighed on the Caspian’s CPC Blend and Algeria’s Saharan Blend. Saharan Blend’s premium to the benchmark fell to its lowest point since July. Naphtha margins weakened as a mild winter in Europe left LPG stocks full, pressuring prices and encouraging petrochemical producers to turn to propane as feedstock at naphtha’s expense. Mediterranean light crude prices also fell steeply as Asia-Pacific demand for these grades was particularly thin. Asia-Pacific demand for West African crudes was also slow, and plentiful supplies of alternative grades capped prices. Furthermore, North Sea Dated Brent remained under pressure amid sluggish demand due to seasonal refinery maintenance and a lack of VLCC shipments to Asia. Brent-related crudes Saharan Blend, Es Sider, Girassol and Bonny Light fell $1.25/b on average. Latin American Basket components,
Note: Arab Light and other Saudi Arabian crudes as well as Basrah Light preliminarily based on AmericanCrude Market (ACM) and subject to revision.
Source: Platt's, Direct Communication and Secretariat's assessments.
Crude Oil Price Movements
OPEC Monthly Oil Market Report – April 2014 7
including Venezuela’s Merey and Ecuador’s Oriente — as well as the multi-destination Basket components — were affected by the decline in prices in the USGC and generally poor performance among midcontinent sour crudes over the month. US sour WTS fell to a record discount to WTI at the Midland pricing point in Texas, after a leak on the Mid-Valley Pipeline cut shipments from West Texas to refineries in Ohio and Michigan. The sale of sour crude from the US SPR weighed on USGC sour grades. Venezuela’s Merey and Ecuador’s Oriente edged 77¢ and $2.48 lower, respectively, compared with their values of the previous month. Middle East crude sales to Asian buyers were slow, as refinery maintenance and weaker naphtha and fuel oil markets capped demand. Middle Eastern spot components and multi-destination grades slipped by around 97¢ and $1.20, respectively. On 9 April, the ORB stood at $104.22/b, 7¢ above the March average. The oil futures market ICE Brent declined by 1% m-o-m amid very weak market fundamentals. This occurred despite the continued impact of Libyan supply outages as well as the crisis in Ukraine. Brent crude fell as a seasonal slump in demand and ample supply led to a near 3% price slide since the beginning of the month, though it briefly jumped to a three-month high above $112/b on developments in the Crimea. Concerns over a slowdown in China’s economic growth offset tensions in Ukraine, pushing down prices. China’s GDP growth target for 2014 has been set at 7.5%, similar to the preceding two years. The growth target has gained importance in recent years, as the country experienced a slowdown in its growth rates, making 2013 the first year in which it has not overshot its goal. Since the government has not lowered its target, it might hint at a willingness to impose stimulus programmes to keep growth in a range of 7.0-7.5%. Nymex WTI front-month also fell, though moderately. It remained above $100/b for the second month in a row. Earlier in the month, Nymex WTI recorded its biggest drop in two months following an US Energy Information Administration (EIA) report showing a large crude stock build, while a surprise announcement of the test release of 5 mb from the SPR added further pressure. Most of the crude build was on the USGC, as spring refinery maintenance caused US utilization rates to decline to a five-month low. Nevertheless, the drop in the US benchmark has been capped by a continued drawdown in oil stocks at Cushing, Oklahoma, its pricing point, as rising pipeline capacity draws down stocks in the US midcontinent. The US benchmark was also supported by positive US employment and factory output data. The Nymex WTI front-month slipped by a marginal 17¢, to average $100.51/b in March. Compared with the same period in 2013 or to the first quarter a year ago, WTI values are significantly higher, by $4.31 or 4.6%, reaching $98.68/b. ICE exchange Brent front-month plunged $1.09 to an average of $107.75/b. ICE Brent was lower in value compared with the same period last year. Its value weakened by $4.75 or 4.22% to $107.90/b from $112.65/b. Crude oil futures prices improved further in the 2nd week of April. On 9 April, ICE Brent stood at $107.98/b and Nymex WTI at $103.60/b. Data from the US CFTC showed that hedge funds and money managers reduced their bullish bets in US crude oil futures and options, cutting their net long US crude futures and options positions during March as prices slid. The speculator group cut its
Crude Oil Price Movements
8 OPEC Monthly Oil Market Report – April 2014
combined futures and options positions in US crude oil contracts from a record number reached the previous month by 45,649 lots to 293,403 contracts over the month. Similarly, net long positions of the speculative community in ICE Brent dropped by 9,849 contracts to 130,072 lots by the end of the month. Moreover, the total futures and options open interest volume in the two markets decreased in March by 80,370 contracts to 3.9 million lots. Meanwhile, investors appeared to be pulling out of commodities like oil to take advantage of the equities rally. Graph 1.2: Nymex WTI price vs. speculative activity, 2013-14
Graph 1.3: ICE Brent price vs. speculative activity, 2013-14
The daily average traded volume during March for Nymex WTI contracts increased by 38,108 lots to average 557,118 contracts. ICE Brent volume also moved up by 28,906 lots to 562,348 contracts. The daily aggregated trade volume in both crude oil futures markets increased by 67,014 lots in March to around 1.12 million futures contracts, equivalent to 1.12 billion b/d. The total traded volume in Nymex WTI and ICE Brent contracts was 11.70 million and 11.81 million contracts, respectively, over the month. The futures market structure Drawdowns of crude commercial stocks at the WTI delivery hub continued to push the Nymex WTI front-month contract up higher relative to future months’ contracts. The latest figures for crude oil stocks at Cushing, Oklahoma — the delivery point for WTI futures — fell by 7.5 mb to 27.3 mb by the end of March, the lowest level since beginning of November 2009, according to EIA data. It was the ninth week in a row that stocks fell at Cushing, a period that corresponds to the opening of TransCanada's 700 tb/d USGC pipeline, helping to take supply away from the storage hub. As a result, the prompt-month Nymex WTI futures contract saw its premium vs. the second month contract increase around 5¢ to close to 65¢/b. Backwardations in the Brent market structure continued to weaken over the month, despite supply outages from Libya. In fact, the front-month contract briefly fell to parity with the second-month contract, threatening to move to a discount, or contango, which signals ample supply and weak demand. This came as refiners in Europe were in maintenance and arbitrage opportunities to the Far East were scant, ahead of peak Asian maintenance. The spread between the second and first month of the ICE Brent contract averaged around 35¢/b in March compared with 45¢/b the previous month.
100
150
200
250
300
350
80859095
100105110115
Apr
13
May
13
Jun
13Ju
l 13
Aug
13
Sep
13
Oct
13
Nov
13
Dec
13
Jan
14Fe
b 14
Mar
14
US$/b
Managed money net long positions (RHS)WTI (LHS)
'000 Contracts
Source: CFTC.
0
50
100
150
200
250
90
95
100
105
110
115
120
Apr
13
May
13
Jun
13Ju
l 13
Jul 1
3A
ug 1
3S
ep 1
3O
ct 1
3N
ov 1
3D
ec 1
3Ja
n 14
Feb
14M
ar 1
4
US$/b
MM net long positions (RHS)ICE Brent (LHS)
'000 Contracts
Source: IntercontinentalExchange, Inc.
Crude Oil Price Movements
OPEC Monthly Oil Market Report – April 2014 9
Table 1.2: Nymex WTI and ICE Brent forward curves, US$/b
For the second month, stronger gains for WTI relative to Brent continued to squeeze the transatlantic spread, with the front-month Brent–WTI spread averaging a six-month low. WTI has been supported by steady drawdowns in crude stocks at the Cushing, Oklahoma, delivery hub that have lent upside support to WTI, while Brent remains pressured by ample supply and low demand. The spread between the two benchmarks, Nymex WTI and ICE Brent, narrowed by almost $1 to settle at an average of $7.25/b in March, staying at single digit values. Graph 1.4: Nymex WTI and ICE Brent forward curves, 2014
The light sweet/medium sour crude spread Global sweet/sour differentials were mixed again over the month, narrowing in Asia and Europe, while widening in the USGC. In Asia both, light sweet and medium-heavy sour came under pressure from a slowdown in sales to Asia-Pacific buyers, as refinery maintenance and weaker naphtha and fuel oil markets capped demand. Plentiful supplies also pressured the Asian crude oil market, particularly light sweet crudes. Rising supply from Iran and Iraq in the past few months coupled with lower demand in Asia due to seasonal refinery maintenance has weighed on the Asian crude oil market. Global oil production outages fell to 3.26 mb/d in February, from 3.33 mb/d in January and 3.79 mb/d in October, as increases from Iran and Iraq outweighed worsening shortages in Africa. Availability of Vietnamese crude due to the scheduled maintenance of Vietnam's sole refinery, Dung Quat, also weighed on the market. The Tapis–Dubai spread narrowed to average $7.05/b, compared to $8.70/b in the previous month, a drop of over $1.60.
ICE Brent: 25 Feb 14 ICE Brent: 25 Mar 14Nymex WTI: 25 Feb 14 Nymex WTI: 25 Mar 14
FM = future month.
Nymex WTI 1st FM 2nd FM 3rd FM 6th FM 12th FM
25 Feb 14 101.83 101.12 100.24 97.26 91.7825 Mar 14 99.19 98.53 97.68 95.02 90.40
ICE Brent1st FM 2nd FM 3rd FM 6th FM 12th FM
25 Feb 14 109.51 109.03 108.61 106.96 103.9525 Mar 14 106.99 106.81 106.48 104.91 102.51
FM = future month.
Crude Oil Price Movements
10 OPEC Monthly Oil Market Report – April 2014
In Europe, the Russian medium sour Urals discount to North Sea Dated Brent narrowed in the Mediterranean on firmer demand and tighter sour supplies. Tighter supplies of alternative medium sour grades and strong fuel oil margins lifted Urals values. The Mediterranean sour crude market tightened on prolonged loading delays for Iraqi Kirkuk crude at the Turkish port of Ceyhan after a bomb attack on the Kirkuk–Ceyhan pipeline at the start of March cut deliveries. Fuel oil demand in Europe is steady, lending further support to medium-heavy sour crude markets. However, the market still has to compensate for missing or low Iranian, Syrian, Iraqi and Libyan volumes. On the other hand, poor refining margins and ample supply weighed on light sweet North Sea Dated Brent. On average, the Dated Brent/Urals spread in March narrowed by 55¢/b to 90¢/b. Graph 1.5: Brent Dated vs. Sour grades (Urals and Dubai) spread, 2013-14
In the US, the LLS/Mars spread widened in March as the sale of 5 mb of sour crude from its West Hackberry and Big Hill reserve sites on the USGC hit medium sour Mars values. In a related trend, US sour WTS also fell to a record discount to WTI at the Midland pricing point in Texas after a leak on the Mid-Valley Pipeline cut shipments from West Texas to Ohio and Michigan refineries earlier, before recovering late in the month on strong demand. Meanwhile, a bearish crude oil market trend began on the USGC, particularly for light sweet grades, as more oil arrived into the US Gulf region via newly built pipelines while refineries took units offline for planned work. Analysts expect the spread between international Brent and LLS to widen in March and April as 20 mb of oil move from the Cushing, Oklahoma storage hub over that period. The premium of LLS over Mars averaged $4.05/b in March compared with $3.35/b in February.
-2
0
2
4
6
8
-2
0
2
4
6
8
01 N
ov
08 N
ov
15 N
ov
22 N
ov
29 N
ov
06 D
ec
13 D
ec
20 D
ec
27 D
ec
03 J
an
10 J
an
17 J
an
24 J
an
31 J
an
07 F
eb
14 F
eb
21 F
eb
28 F
eb
07 M
ar
14 M
ar
21 M
ar
28 M
ar
04 A
pr
US$/bUS$/b
Dubai Urals
Commodity Markets
OPEC Monthly Oil Market Report – April 2014 11
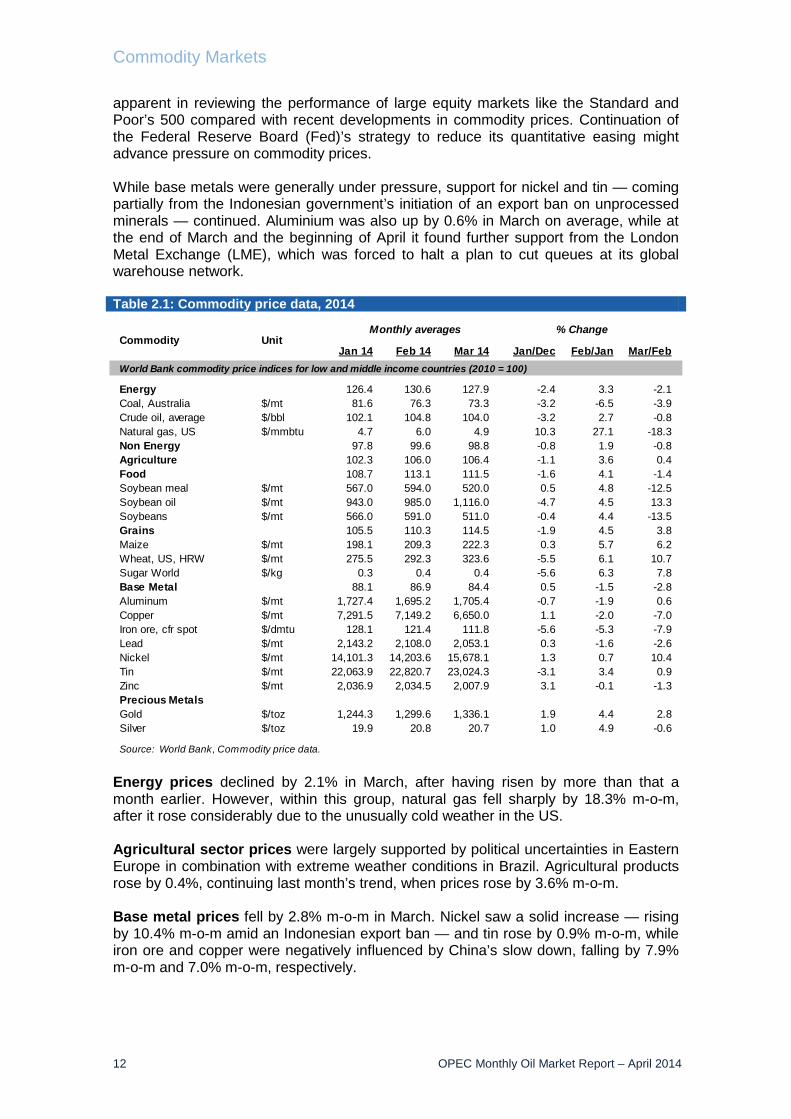
Commodity Markets Commodity markets continued with differing trading patterns in March, but the general trend has been one of decline. With the exception of nickel, tin, gold, grains and, to some extent, agricultural commodities, most of the major commodity categories witnessed declining prices. Meanwhile, demand from the major emerging economies seems to continue slowing and the need to hedge inflation via investments into commodities as an asset class has abated. This seems to have led to a shift in investments from commodities mainly into equities in developed economies. In addition, generally rising interest rates, primarily influenced by a reduction in monetary stimulus in the US, have led to a decline in commodity prices on average. Geopolitical developments in Ukraine — in combination with bad weather in Brazil — have, however, supported agricultural sector price levels in the past months. Trends in selected commodity markets Generally, deceleration in emerging economies and low inflation in developed economies continued to pressure commodity markets. The commodities sector witnessed a declining trend for most of March, with a few exceptions. Commodity groups, such as agriculture, or specific commodities like gold, tin and nickel were supported by particular developments. The underlying trend in the commodities market continued to be largely influenced by the current economic growth pattern, improvement in the OECD and a slowdown in the emerging economies. Uncertainty in Eastern Europe was again an influential factor, mainly in the energy and agricultural sectors. On the energy side, the impact of the Crimea situation is sensitive, given the fact that the European Union is importing around 30% of its gas from Russia with around 15% of this supply arriving via Ukraine. The impact may have been limited so far by sufficient storage levels in the EU after an unusually mild winter and the coming end of heating season. Concerns remain in the agricultural sector due to the large influence of Ukraine, particularly in the corn market, but in the wheat market as well. Ukraine ranks among the top three exporters of corn and is the sixth largest exporter of wheat. Hence, prices in these two agricultural commodities have reacted sharply. Both groups of commodities remained well supported - wheat prices increased by more than 10% in March and corn prices also rose by almost 10%. The geopolitical concerns come at a time when Brazil’s output may also be negatively influenced by bad weather. Brazil is the second-largest corn exporter. China’s apparent deceleration could lead to a further negative impact for commodities which are crucial to the economy’s growth development. This has already become very much evident in copper prices, which fell by more than 10% from mid-February to mid-March. Since then, they recovered again by around 2%, but not because of rising demand expectations from the commodity’s largest consumer, but rather due to supply disruptions in Chile, the metal’s largest producer. Declining commodity input prices also currently offer the opportunity for the Chinese economy to develop a more flexible currency regime, as commodity imports naturally become more expensive with a declining currency. The expected continuation of tapering monetary stimulus in the US is also forecast to put some weight on commodity prices due to less investment in the emerging economies as well as a slowdown in speculative activity. This has also become
Commodity Markets
12 OPEC Monthly Oil Market Report – April 2014
apparent in reviewing the performance of large equity markets like the Standard and Poor’s 500 compared with recent developments in commodity prices. Continuation of the Federal Reserve Board (Fed)’s strategy to reduce its quantitative easing might advance pressure on commodity prices. While base metals were generally under pressure, support for nickel and tin — coming partially from the Indonesian government’s initiation of an export ban on unprocessed minerals — continued. Aluminium was also up by 0.6% in March on average, while at the end of March and the beginning of April it found further support from the London Metal Exchange (LME), which was forced to halt a plan to cut queues at its global warehouse network. Table 2.1: Commodity price data, 2014
Energy prices declined by 2.1% in March, after having risen by more than that a month earlier. However, within this group, natural gas fell sharply by 18.3% m-o-m, after it rose considerably due to the unusually cold weather in the US. Agricultural sector prices were largely supported by political uncertainties in Eastern Europe in combination with extreme weather conditions in Brazil. Agricultural products rose by 0.4%, continuing last month’s trend, when prices rose by 3.6% m-o-m. Base metal prices fell by 2.8% m-o-m in March. Nickel saw a solid increase — rising by 10.4% m-o-m amid an Indonesian export ban — and tin rose by 0.9% m-o-m, while iron ore and copper were negatively influenced by China’s slow down, falling by 7.9% m-o-m and 7.0% m-o-m, respectively.
World Bank commodity price indices for low and middle income countries (2010 = 100)
UnitCommodity Monthly averages % Change
Commodity Markets
OPEC Monthly Oil Market Report – April 2014 13
Among precious metals, rising demand seems to have been supportive, with gold up for a third consecutive month by 2.8% m-o-m in March. Graph 2.1: Major commodity price indices, 2012-14
The Henry Hub (HH) natural gas price index dropped sharply in March, after it ended at its highest level since January 2010 in the previous month. The index settled a hefty $1.10 or 18% lower at $4.9 per million British thermal units (mbtu), after trading at an average of $6/b the previous month. Nevertheless, prices are still almost 34% higher than they were at the beginning of this year. Market sentiment was bearish during the month, as the winter heating season started to wind down and forecasts showed continuing mild weather that will reduce heating demand. Although some forecasts showed colder-than-normal temperatures for the Northeast, the general shift to milder weather spurred some speculative traders to exit their long positions on a technical response to the end of the withdrawal season rather than a change in fundamentals. By late March, utilities had withdrawn a record 2.938 trillion cubic feet of gas from storage since the start of the heating season in November, leaving just 896 billion cubic feet, the lowest amount since 2003. Graph 2.2: Inventories at the LME
20406080100120140160
20406080
100120140160
Apr
12
May
12
Jun
12
Jul 1
2
Aug
12
Sep
12
Oct
12
Nov
12
Dec
12
Jan
13
Feb
13
Mar
13
Apr
13
May
13
Jun
13
Jul 1
3
Aug
13
Sep
13
Oct
13
Nov
13
Dec
13
Jan
14
Feb
14
Mar
14
IndexIndex
Energy Non-energy Agriculture Food
Base metals HH natural gas Gold
Source: World Bank, Commodity price data.
Base year 2010 = 100
6,600
6,800
7,000
7,200
7,400
7,600
7,800
6,600
6,800
7,000
7,200
7,400
7,600
7,800
Mar
13
Apr 1
3
May
13
Jun
13
Jul 1
3
Aug
13
Sep
13
Oct
13
Nov
13
Dec
13
Jan
14
Feb
14
Mar
14
'000 Tonnes'000 Tonnes
Sources: London Metal Exchange and Haver Analytics.
Commodity Markets
14 OPEC Monthly Oil Market Report – April 2014
Meanwhile, nuclear plant outages — which create demand for natural gas as a substitute fuel for electric generation — were at 18,300 megawatts (MW) in late March. That compares with 24,600 MW a year ago and a five-year average of 20,300 MW. Moreover, the premium of the front-month gas Nymex contract over the front-month Appalachian coal contract eased to $1.86/mbtu. The natural gas premium was slightly below the $2/mbtu spread, which is considered wide enough to offset the cost of transporting coal from mines to generating plants and the differences in efficiency between gas and coal plants. Investment flows into commodities The total open interest volume (OIV) in major US commodity markets decreased by around 2.8% m-o-m to 8.6 million contracts in March as natural gas, agriculture and copper OIVs worsened by 6.9%, 4.6% and 1.8%, respectively. On the other hand, crude oil, precious metal and livestock OIVs increased by 1.7%, 3.7% and 0.9%, respectively. Gold’s OIV increased this month by 6.8%. Total net length speculative positions in commodities increased by a hefty 43.9% m-o-m to 1,605,878 contracts in March, a change mainly attributed to a sharp increase in the managed money net length of agriculture and livestock. Money managers’ activities in copper continued to reflect deep bearish sentiment amid concerns over China’s economic growth. Graph 2.3: Total open interest volume
Agricultural OIV was down 4.6% m-o-m to 4,418,306 contracts in March. Meanwhile, money managers’ net long positions in agriculture continued to rebound sharply by more than twofold to 834,515 lots in March after consecutive months of retreat. The bullish move occurred as the futures market rallied on dry weather concerns in top grower Brazil.
7,000
7,500
8,000
8,500
9,000
9,500
7,000
7,500
8,000
8,500
9,000
9,500
Mar
13
Apr 1
3
May
13
Jun
13
Jul 1
3
Aug
13
Sep
13
Oct
13
Nov
13
Dec
13
Jan
14
Feb
14
Mar
14
'000 contracts
Source: US Commodity Futures Trading Commission.
'000 contracts
Commodity Markets
OPEC Monthly Oil Market Report – April 2014 15
Graph 2.4: Speculative activity in key commodities, net length
Henry Hub natural gas OIV decreased by 6.9% m-o-m to 1,644,163 contracts in March. Money managers decreased their net length positions by 17% to stand at net long positions of 138,490 lots, as winter heating season demand started to unwind. Graph 2.5: Speculative activity in key commodities, as % of open interest
Copper OIV slipped again by 1.8% m-o-m to 153,671 contracts in March. The group of investors doubled their net short positions to 12,926 contracts, as worries mounted over slowing economic growth in China, the world's top consumer of many raw materials.
-300-1500150300450600750900
-300-150
0150300450600750900
Mar
13
Apr 1
3
May
13
Jun
13
Jul 1
3
Aug
13
Sep
13
Oct
13
Nov
13
Dec
13
Jan
14
Feb
14
Mar
14
'000 contracts'000 contracts
Agriculture Gold WTI Natural gas Livestocks Copper
Source: US Commodity Futures Trading Commission.
-10
0
10
20
30
-10
0
10
20
30
Mar
13
Apr 1
3
May
13
Jun
13
Jul 1
3
Aug
13
Sep
13
Oct
13
Nov
13
Dec
13
Jan
14
Feb
14
Mar
14
%%
Agriculture Gold WTI Livestocks Copper Natural gas
Source: US Commodity Futures Trading Commission.
Commodity Markets
16 OPEC Monthly Oil Market Report – April 2014
Table 2.2: CFTC data on non-commercial positions, ‘000 contracts
Gold OIV increased by 6.8% m-o-m to 406,874 contracts in March. Hedge funds and money managers continued to be very bullish in US gold, expanding their net long positions by 67% to stand at 108,819 contracts from 65,191 lots the previous month. Meanwhile, late in the month gold investors cut their net long position stance in gold contracts sharply amid easing geopolitical tensions and a stronger tone to the US economy triggered gold selling. The drop also came after the US Federal Reserve said it will probably end its massive bond-buying programme this fall and could start raising interest rates around six months later. Monetary stimulus by the Fed has bolstered bullion prices for the past four years. Graph 2.6: Inflow of investment into commodities, 2011-14
World Economy Global GDP growth for 2014 has been slightly revised down by 0.1 percentage points (pp) to 3.4% due to a continued deceleration in the emerging economies and some softening in Japan. While the emerging markets of China and Brazil have experienced some slight downward revision by 0.1 pp and 0.3 pp, respectively, the largest revision took place for the Russian economy, whose growth forecast has been lowered from 1.9% to 1.0% for the current year. So far, the global growth recovery in the current year from 2.9% in 2013 has been supported by a gradual recovery in the US and modest growth in the Euro-zone. While a continuation of the trend in both economies could provide some upside, the softening trend in Japan, also amid the sales tax increase in April, and the ongoing softening momentum in emerging markets have so far counterbalanced a better trend in the global economy. In addition to this, geopolitical developments will also require close monitoring. Table 3.1: Economic growth rate and revision, 2013-14, %
OECD OECD Americas US After the cold snap-related slow-down in the United States’ economy at the beginning of the year, the growth dynamic has regained traction. Moreover, the latest release of the 4Q13 GDP numbers has indicated that firstly, the momentum was better in the fourth quarter than initially indicated, and that secondly, the crucial private household consumption was also higher. Also, the latest job additions have been supportive for this year’s recovery, and the agreement on budgetary issues leading to a less severe fiscal drag all point to a continued recovery for the remaining quarters of the year. Some downside to current growth estimates could still come from a spill-over of global economic issues, geopolitical events or effects from a further tightening of monetary stimulus. Due to the strength of the US economy and the depth of capital markets, this possibility however, at least currently, seems relatively limited, and it is expected that the US economy itself might turn out to be a vital growth engine for the global economy. While the positive development in the US economy is continuing, there is still a gap between current growth and the economy’s potential output level. This gap, however, could be closed by next year, if the current growth trend continues. The third and last release of 4Q13 GDP stood at 2.6% q-o-q, seasonally adjusted annualized rate (SAAR), better than the second release number of 2.4% q-o-q SAAR, but still significantly lower than the first estimate of 3.2% q-o-q SAAR. Also, as a comparison, GDP grew by 4.1% q-o-q SAAR in 3Q13. While the 3Q13 quarter numbers
World OECD US Japan Euro-zone China India Brazil Russia
have also confirmed a significant recovery from the sluggish 1H13, they have been largely driven by inventory building and to a lesser extent by consumption of private households, which constitutes the main factor for US GDP growth. The latest set of 4Q13 numbers, however, showed an improvement in the composition of GDP-supporting factors. Consumption increased by 3.3%, more than the 22-year average of 3.0% in consumption growth. Private household consumption also provided the largest single contribution to 4Q GDP growth at 2.2 pp. On average, consumption (i.e. private household expenditures), accounted for around 70% of US GDP, thus the current development indicates that the trend is going back to normal. At the latest meeting of the US Federal Reserve (US Fed), it was highlighted that an interest rate increase could potentially happen earlier than previously directed in its forward guidance. This comes also as a result of the better-than-anticipated US recovery. However, it was emphasised that the situation is still not entirely robust, but that the development so far has been encouraging. This also led to the decision to again reduce the extraordinary monetary stimulus by $10 billion. The continuation of this strategy is supported by the slowly improving labour market with ongoing job additions. Inflation, however, has again retreated somewhat and now stands at only 1.1%, slightly lower than in January at 1.6%. It is obvious that in the past quarter, the inflationary trend, while not alarmingly low, has been clearly below the 2%-level that the US Fed is aiming for. Positively, excluding the volatile price factors of food and energy, inflation stood at 1.6% y-o-y in both January and February. While the labour market has continued improving, the dynamic is still mixed. After the unemployment rate moved from 6.6% to 6.7% in February, it remained at this level in March. On the other hand, non-farm payroll additions grew by 192,000 in March and positive February numbers were revised up to 197,000 from 175,000 previously. The participation rate has remained at a relatively low 63.2%, but has improved from 63.0% in February and is now increasing from its bottom level of 62.8% in December. The share of long-term unemployed has also improved and now stands at 35.8%, substantially below the 37.0% seen in February. Graph 3.1: Manufacturing and non-manufacturing ISM indices
The purchasing manager’s index (PMI) for the manufacturing sector, as provided by the Institute of Supply Management (ISM), has also posted a rising trend once again in March after having declined significantly in January to 51.3 due to the cold snap. In February, the important lead indicator improved to 53.2, confirming the view that the January dip might have been temporary. In March, it stood at 53.7. Industrial
45
50
55
60
Apr
13
May
13
Jun
13
Jul 1
3
Aug
13
Sep
13
Oct
13
Nov
13
Dec
13
Jan
14
Feb
14
Mar
14
Index
ISM manufacturing index ISM non-manufacturing index
Source: Institute for Supply Management.
World Economy
OPEC Monthly Oil Market Report – April 2014 19
production rose by a healthy 3.0% y-o-y in February, the same level as in January, while manufacturing orders were weak in February, declining by 0.7% y-o-y, after an increase of 1.7% y-o-y in January. On the other hand, the ISM for the services sector, which constitutes more than two-thirds of the economy, rose to 53.1 in March, compared to 51.6 in February. When reviewing the latest indicators, the momentum leads to considerably higher growth this year, and this should be expected to continue. Consumer confidence, as provided by the Conference Board, reached 82.3, the highest level seen since January 2008. These positive developments have led to a rising GDP growth level this year, which is forecast to be 2.7%, compared to 2013 growth of 1.9%. Canada In Canada, improvements continue as well. New orders have increased by 0.8% y-o-y in January and by 1.1% y-o-y in February, indicating rising industrial output numbers in the coming months. Industrial production in January stood at 2.5% y-o-y, almost the same level as in 4Q13, when it increased by 2.7%. The GDP growth expectation for 2014 remains unchanged at 2.3%, after growth of 2.0% in 2013. Mexico In March, the Central Bank of Mexico kept its policy rate unchanged at 3.50%, while inflation in February stayed above the upper-limit target set by the bank. The higher rate of inflation was primarily caused by a tax increase and removal of tax exemptions for border cities. Industrial production accelerated by 0.51% m-o-m in January. Three components of the industrial production index (mining, construction and utilities) posted negative growth, while manufacturing soared by 2.34%. Manufacturers in Mexico experienced slower rates of production and new order growth last month despite the modest rebound in new export business. The country’s manufacturing PMI fell to 51.7 in March, from 52.0 in the previous month. The survey marked the fastest rise in hiring levels among manufacturers since April of last year. The growth forecast remains unchanged at 3.1% for 2014, a large increase from last year’s 1.3%. OECD Asia-Pacific Japan The policy of the current government in Japan has so far been remarkably successful, however, many challenges remain. The aim to reach an inflation rate of 2% by the end of 2014 has almost been achieved. The depreciation of the yen has led to a substantial recovery in exports, and domestic demand has also picked up considerably since the past year, when the three-arrow policy of the then newly elected government was introduced. Of the three arrows — monetary and fiscal stimulus accompanied by structural reforms — mainly monetary policy has been utilised, while the fiscal policy was responsible for some recovery at the beginning of the previous year and will probably play some role in the coming months to counterbalance the potentially upcoming drag from the sales tax increase, which has been implemented as of 1 April. Given Japan’s very high public debt level, the fiscal room for manoeuvre is very limited, and the policy to reduce the dependency on debt is an encouraging development. However, in this situation, the economy’s structural improvements will gain a more important role to continue the progress. Recently, and already before the sales tax increase in April, some signs of a slight slow-down appeared. GDP numbers for 4Q were revised down and pushed total yearly growth in 2013 to 1.5% from the previous estimated 1.6%. Quarterly growth in 4Q13 stood at only 0.7% q-o-q SAAR compared to 1.0% in the previous estimate and again
World Economy
20 OPEC Monthly Oil Market Report – April 2014
below expectations. Total industrial production shows a slowing but expansionary trend, growing by 7.0% y-o-y in February, after a growth rate of 10.4% y-o-y in January. Given that the sales tax increase from the current 5% to 8% will largely affect this year’s 2Q growth numbers, the momentum in the current year is forecast at below last year’s trend. Also, lead indicators imply a slight slow-down, but support a positive growth trend in general. The main question, however, for this year’s growth pattern will be how much the sales tax increase in April will impact 2Q growth and potentially beyond as consumers are expected to slow down their spending. The government has already announced that it will try to counteract the 2Q14 slow-down with fiscal spending, and also the Bank of Japan (BoJ) has signalled that it is ready to increase the monetary stimulus, if needed. The necessary fiscal adjustments will continue, and the sales tax will be increased further from 8% to 10% in October of next year. The most recent inflation number for February stood at 1.5%, higher than in the previous month, when it reached 1.4% y-o-y. However, inflation without the volatile factors of food and energy is still low at only 0.7% y-o-y in February, slightly higher than the 0.6% y-o-y from January. One challenge to this policy, however, might be that household incomes have not risen at the same pace. So, while a reasonable inflation level might be a positive development, this is only the case if consumers can afford it. Earnings in the 4Q13 rose only by 1.1% y-o-y (i.e. below the inflation level). With the current extremely low level of unemployment, it is expected that earnings will rise soon as the labour market is very tight at an unemployment rate of only 3.6% in February, again lower than the 3.7% of January. Graph 3.2: Japanese PMI indices Graph 3.3: Co-movement of Japanese yen
and exports
Exports continued a slowing trend in February when, after January’s low level of 9.5% — the lowest growth level in seven months — the increase was again below the recent double digit levels of the past months, when it rose by 9.8% y-o-y. This probably has also been impacted by the slow-down in China, to which around a quarter of exports are being shipped. Domestic demand has remained strong. Retail sales in January rose by 4.4% y-o-y and by 3.6% y-o-y in February. Lead indicators point to a continuation of the slowing growth trend in manufacturing, but the important services sector PMI has risen again considerably. The latest PMI, as provided by Markit, shows that the manufacturing PMI in February stood at 53.9 in March, below the February level of 55.2 and significantly below the January number of 56.6. So while the
48
50
52
54
56
58
Mar
13
Apr 1
3M
ay 1
3Ju
n 13
Jul 1
3Au
g 13
Sep
13O
ct 1
3N
ov 1
3D
ec 1
3Ja
n 14
Feb
14M
ar 1
4
Index
Sources: Markit, Japan Materials Management Association and Haver Analytics.
Services
Manufacturing
020406080100120
-15-10
-505
101520
Sep
12
Nov
12
Jan
13
Mar
13
May
13
Jul 1
3
Sep
13
Nov
13
Jan
14
¥/US$
Exports (LHS)JP¥/US$ exchange rate (RHS)
Sources: Bank of Japan, Ministry of Finance and Haver Analytics.
% change y-o-y
World Economy
OPEC Monthly Oil Market Report – April 2014 21
momentum in the manufacturing sector has slowed, the important services sector PMI has increased again to above the growth-indicating 50 level to now stand at 52.2 in March, after 49.3 in February. Considering the latest signs of a slowing growth trend, the GDP growth estimate for 2014 has been revised down to 1.3% from the previous 1.5%, which is below last year’s growth level of 1.5%. South Korea Growth in South Korea remains solid, but weakened slightly at the beginning of the year. Industrial production stood at only 0.9% y-o-y in January and at 1.7% y-o-y in February, considerably lower than the 4Q average of 2.5% y-o-y. The composite leading index of the National Statistical Office, however, reached a new record high of 117.9 in February. The manufacturing PMI also moved again above the growth-indicating 50 level to stand at 50.4 in March, compared to 49.8 in February. The growth forecast for 2014 remains unchanged at 3.0%, but given the slow-down in some of South Korea’s main trading partners in Asia, the growth pattern will need close monitoring. OECD Europe Euro-zone Economic development in the Euro-zone has been modest as the somewhat fragile recovery continues. Current improvements are again supported mainly by the momentum in the Euro-zone’s biggest economy, Germany, but the so-called peripheral economies also continue their tender improvement. France remains somewhat of a weak spot, but given that it is also expected to recover, the positive trend is forecast to gain traction in the coming months. Some concern has been expressed that the low inflation in the Euro-zone on average might pose a challenge in the near future. The European Central Bank (ECB) has highlighted that it currently considers the low inflation of only limited concern as it expects price development to pick up in coming months. In this connection, it should also be highlighted that inflation levels are very different among the Euro-zone’s economies, and that deflationary developments in the peripheral economies are mainly due to the fact that domestic devaluation of income has taken hold as currency devaluation is not a possibility anymore in the single-currency block. This trend, however, should turn by around next year, and inflation levels might then possibly move up to more reasonable levels again. Moreover, the ECB indicated that due to the relatively heterogeneous landscape of the Euro-zone’s economy, extraordinary measures such as quantitative easing would need to target certain areas or geographies of the economy and not the Euro-zone as a whole, which should be considered a reasonable argument. Industrial output, excluding construction in Germany, expanded again by a considerable 4.1% y-o-y in February, at around the same level as in January. Also, Spain posted a considerably positive 3.1% y-o-y, a significant improvement after a decline of 0.5% in January, signalling that the economy is starting to recover. The same positive developments became visible in manufacturing order numbers from Germany, which are a good lead indicator for future output levels in the Euro-zone. German industrial orders rose by 6.8% y-o-y in February, an increase from the already impressive 5.8% y-o-y posted in January. Inflation remains low with development differing in the various economies. For the Euro-zone as a whole, it stood at only 0.5% in March, after an already low 0.8% y-o-y in February. In Germany, inflation rose by 0.8% y-o-y, while it fell by 0.2% y-o-y in
World Economy
22 OPEC Monthly Oil Market Report – April 2014
Spain. In France, the most recently available number for February stood above 1% at 1.1% y-o-y. This is the sixth consecutive month of inflation below the 1.0%-level. Lending of financial intermediaries to private households has also improved slightly again. While still negative on a yearly comparison by 2.5% y-o-y in February, it came off its low of -3.2% in November. Graph 3.4: Euro-zone PMI indices Graph 3.5: Euro-zone CPI and lending
activity
The continued high unemployment rate of 11.9% in February, the same level as in January, is a hurdle that remains a significant challenge to the economy for a faster recovery. The difference in unemployment rate levels continues to also highlight the varying speeds of recovery within the Euro-zone. Germany has the lowest unemployment rate of the larger economies. It stood at 5.1% and shows a positive trend. Spain, in contrast, remains at an elevated level of 25.6% jobless, but is decreasing from its peak level of 26.6% a year earlier. Lead indicators confirm the unevenness of the Euro-zone’s growth pattern. The latest PMI for manufacturing, as provided by Markit, stood at 53.0 in March, almost unchanged from the 53.2 in February and just slightly below the January level of 54.0. It reached 53.7 in Germany and moved considerably higher to 52.1 in France. In Italy, it reached 52.4. The recovery in the Euro-zone has gained some traction lately, but given the continued modest levels of growth, the GDP growth forecast for 2014 remains at 0.8%, which is a considerable improvement from last year’s decline of 0.4%. UK The United Kingdom’s most recent economic performance shows continued improvement and stands above the average level of most of its fellow EU countries. Industrial production increased by 2.9% y-o-y in February, higher from the January level of 1.9% y-o-y and also above the December level of 2.0%. PMI for manufacturing stood at a significant level of 55.3 in March, only slightly below the 56.9 of February. The important services PMI remained at almost the same level as in February, when it stood at 58.2, while it reached 57.6 in March. This positive development confirms the GDP growth forecast for 2014 of 2.3%, but a continuation of positive development could lead to even higher growth this year.
46
48
50
52
54
56
Mar
13
Apr 1
3M
ay 1
3Ju
n 13
Jul 1
3Au
g 13
Sep
13O
ct 1
3N
ov 1
3D
ec 1
3Ja
n 14
Feb
14M
ar 1
4
Index
Sources: Markit and Haver Analytics.
Services
Manufacturing
-4%
-2%
0%
2%
4%
6%
-1%
0%
1%
2%
3%
4%
Mar
09
Sep
09
Mar
10
Sep
10
Mar
11
Sep
11
Mar
12
Sep
12
Mar
13
Sep
13
Mar
14
CPI (LHS) MFI lending (RHS)
Sources: Statistical Office of the European Communities, European Central Bank and Haver Analytics.
% change y-o-y % change y-o-y
World Economy
OPEC Monthly Oil Market Report – April 2014 23
Emerging and Developing Economies This month’s forecast for Brazil’s GDP growth rate in 2014 has been slightly pared back from 2.3% to 2.0%. An important trigger of this revision is the softening sentiment in the domestic economy, which represents more than 60% of the country’s GDP. On the other hand, however, the comfortable stock of foreign currency reserves is seen helping Brazil to cope with uncertainties and volatility in international markets. Geopolitical uncertainty continued to push investment out of Russia with an estimated outflow of $70 billion in 1Q14, adding to the already downward momentum in foreign direct investment and consumer spending noticed even before the latest tensions. As such, we slashed our forecast for Russia’s GDP growth to 1.0% this month, with a further cut possible, pending future developments. India’s economy should gradually pick up in the medium term as financial stability returns after last year’s volatility and as inflation eases due to lower food prices and tighter monetary policy. According to the PMI number in March, the momentum in India's manufacturing sector remains weak, although the March deterioration may be specifically related to the general election due to begin on 7 April. China’s economic slowing goes along with the attempt to steer economic restructuring. Business conditions in China’s manufacturing sector deteriorated for the third consecutive month in March. China's export performance will also firm as external demand conditions improve, especially in the North America and the EU. Table 3.2: Summary of macroeconomic performance of BRIC countries
Brazil Exports from Brazil exhibited an 8.8% y-o-y decline last month to register the sharpest drop since February 2013. Consumer confidence, on the other hand, remained largely stable at a low level last month. The consumer confidence index posted 108.0 in March, up from 107.8 a month earlier. This suggests a stagnation in consumer spending in Brazil. The unemployment rate stood at 5.1% in February, a much lower reading than in the same month of the past few years. The Central Bank has kept its benchmark interest rate unchanged at 10.75, signalling that the end of its tightening policy is close. March’s consumer price inflation inched up at 5.6% from 5.4% in February. An ease in inflation to around 5.0% is less likely with an end of interest rate increases together with a tight labour market and high utilization capacity. In addition, the World Cup is expected to add further upward pressure on inflation.
Seasonally adjusted data has shown a partial rebound in Brazil's industrial production in January by 2.9% m-o-m. This improvement was driven by strong growth in capital goods production (up 10.0% m-o-m). Output in the other two categories - intermediate goods and consumption goods - expanded 1.2% m-o-m and 2.3% m-o-m, respectively. Nevertheless, when compared to January 2013 and using raw data, industrial production shrunk by 2.4%, and capital goods was the only category that expanded while intermediate and consumption goods declined. This month’s forecast for Brazil’s GDP growth rate in 2014 has been slightly pared back from 2.3% to 2.0%. An important trigger of this revision is the softening sentiment in the domestic economy, which represents more than 60% of the country’s GDP. On the other hand, however, the comfortable stock of foreign currency reserves is seen as helping Brazil to cope with uncertainties and volatility in international markets and to appease investors that otherwise would be tempted to take their capital out of the country. Russia Russia’s GDP growth in 4Q13 advanced by 2% y-o-y following 1.3% growth in the previous three months. The weaker rouble helped compensate for sluggish domestic demand with lower imports. According to the Russian Statistical Office, exports increased by 5.6% in 4Q13, whereas imports fell by 0.1%. Growth of household consumption decreased markedly in the 4Q13, when compared to 4Q12. Household consumption advanced by 4.1% y-o-y in 4Q13 compared to 7.3% in 4Q12. Government consumption expenditures rose by only 0.4% y-o-y in 4Q13 from 3.9% y-o-y in 4Q12.
Feb 125.7 Feb 13
5.6Feb 14
5.1
3.5
4.0
4.5
5.0
5.5
6.0
6.5
7.0Fe
b 11
May
11
Aug
11N
ov 1
1Fe
b 12
May
12
Aug
12N
ov 1
2Fe
b 13
May
13
Aug
13N
ov 1
3Fe
b 14
%
Sources: Instituto Brasileiro de Geografia e Estatística and Haver Analytics.
5.6
10.8 11.0
7
8
9
10
11
12
5
6
7
8
Apr 1
3M
ay 1
3Ju
n 13
Jul 1
3Au
g 13
Sep
13O
ct 1
3N
ov 1
3D
ec 1
3Ja
n 14
Feb
14M
ar 1
4Ap
r 14
National consumer price index (LHS)Selic rate (RHS)
Source: Banco Central do Brasil, Instituto Brasileiro de Geografia e Estatística and Haver Analytics.
% change y-o-y % per annum
World Economy
OPEC Monthly Oil Market Report – April 2014 25
Graph 3.8: Russian GDP growth, NSA
The rouble, along with the Russian stock market, showed better performance at the end of last month. It is nearly back to its pre-tensions rate, while the stock market eased losses last month to close around 5% lower than its commencement. This came on the back of diplomatic meetings that eased tensions over the situation in Ukraine. Russia’s stock funds received more than $200 million in inflows in the week ended 26 March. The manufacturing sector continued to experience a downturn in Russia last month. The HSBC manufacturing PMI had a fractional drop from 48.5 in February to 48.3 in March. This marks the fifth consecutive month below the 50 contraction level. The survey showed the strongest declines in output and new orders in approximately five years. The unemployment rate stood unchanged in February at 5.6%, slightly less than the same month of last year, while consumer price inflation rose to 6.9% in March, up from 6.2% a month earlier. Graph 3.9: Russian unemployment rate Graph 3.10: Russian consumer price index,
NSA
The central bank announced that despite the need to support the economy, above-target inflation in combination with external risks are constraining its ability to cut interest rates. It recently announced that the key lending rate will be kept unchanged at
-2.6%
1.3%2.0%2013
1.3%
-15%
-10%
-5%
0%
5%
10%
1Q08
2Q08
3Q08
4Q08
1Q09
2Q09
3Q09
4Q09
1Q10
2Q10
3Q10
4Q10
1Q11
2Q11
3Q11
4Q11
1Q12
2Q12
3Q12
4Q12
% change y-o-y
Sources: State Committee of the Russian Federation and Haver Analytics.
Feb 135.8 Feb 14
5.6
4.5
5.0
5.5
6.0
6.5
Mar
12
May
12
Jul 1
2Se
p 12
Nov
12
Jan
13M
ar 1
3M
ay 1
3Ju
l 13
Sep
13N
ov 1
3Ja
n 14
Mar
14
Sources: Central Bank od the Russian Federation and Haver Analytics.
% change y-o-y
6.2%
6.9%
5%
6%
7%
8%
Mar
13
Apr 1
3M
ay 1
3Ju
n 13
Jul 1
3Au
g 13
Sep
13O
ct 1
3N
ov 1
3D
ec 1
3Ja
n 14
Feb
14M
ar 1
4
% change y-o-y
Sources: Federal State Statistics Service and Haver Analytics.
World Economy
26 OPEC Monthly Oil Market Report – April 2014
7% until June at the earliest. If capital outflows reach $150 billion in 2014, the Economy Ministry did not rule out the possibility of a less than 1% rate of growth in output. On the other hand, the government is discussing measures to stimulate domestic consumption amid calls to increase public spending. In conclusion, geopolitical uncertainty continued to push investment out of Russia with an estimated outflow of $70 billion in 1Q14, adding to the already downward momentum in foreign direct investment and consumer spending noticed even before the latest tensions. As such, the forecast for Russian GDP growth was reduced to 1.0% this month. India India’s general elections are scheduled to take place in nine phases between 7 April and 12 May. The upcoming general election could be the most partisan that India has seen in decades. In December 2013, the Aam Aadmi Party (AAP), which campaigned on a strong anti-corruption platform, with free water and cheaper electricity among its main campaign pledges, formed the state government in Delhi with outside support from Congress, after the Bharatiya Janata Party (BJP), Indian People's Party, secured the greatest number of seats but failed to get a majority. According to the latest information, India's Bombay Stock Exchange (BSE) and the National Stock Exchange of India, reached record highs in the first week of April 2014. The surge partly reflects increasing private sector confidence in a government led by the Indian BJP resulting from India's parliamentary election. It seems that after the election, the BJP-led government will probably increase investment opportunities, particularly in infrastructure, which the opposition party is keen to develop. These will be strengthened by the fact that any government after the election will enjoy renewed political capital, giving it roughly two years in which new legislation can be passed with relatively little opposition. Some firms have already announced their intention to invest heavily in Indian infrastructure: Bloomberg reported on 18 March that the India-based TATA Group plans to invest more than $8 billion in roads, airports, and housing after the election. India's current account deficit continued to narrow during 4Q13, in line with the government's targets. The current account deficit stood at $4.2 billion or 0.9% of GDP, down further from $5.2 billion (1.6% of GDP) in the previous quarter and down sharply from $31.9 billion (6.5% of GDP) in the corresponding quarter of the previous year. The outlook is now more promising, but underlying weaknesses remain. Although the rupee has remained stable over the past few months, it is still around 11% weaker against the US dollar than this time last year. A lower exchange rate should support exports, and the government’s efforts to curb gold imports, together with sluggish domestic demand, should keep import volumes weak. As a result, current account deficit financing has shifted to volatile equity and debt financing, and borrowing from abroad.
World Economy
OPEC Monthly Oil Market Report – April 2014 27
Graph 3.11: Indian current account balance Graph 3.12: Indian merchandise imports and exports, NSA, million US$
India’s economy should gradually pick up in the medium term as financial stability returns after last year’s volatility and inflation eases due to lower food prices and tighter monetary policy. It seems that various factors will affect India’s economy in the coming months, such as CPI, the current account balance, government balance, government debt and external debt. According to the PMI number in March, the momentum in India's manufacturing sector remains weak, although the March deterioration may be specifically related to the general election due to begin on 7 April. As companies expect more clarity on the new government and the nature of its policies towards the manufacturing sector and investment, they may have delayed new orders immediately prior to the election. Policy factors aside, recent developments still point to a tentatively mild recovery in manufacturing in the coming months. Graph 3.13: Indian industrial production breakdown
Graph 3.14: Indian inflation vs. repo rate
-35,000
-30,000
-25,000
-20,000
-15,000
-10,000
-5,000
0
1Q12
2Q12
3Q12
4Q12
1Q13
2Q13
3Q13
4Q13
US$ mn
Sources: Reserve Bank of India and Haver Analytics.
-20%
-10%
0%
10%
20%
30%
1Q12
2Q12
3Q12
4Q12
1Q13
2Q13
3Q13
4Q13
Exports (fob) Imports
Sources: Reserve Bank of India and Haver Analytics.
% change y-o-y
0.0%-0.7%
0.5%
-20%
-10%
0%
10%
20%
Feb
12
May
12
Aug
12
Nov
12
Feb
13
May
13
Aug
13
Nov
13
Total ManufacturingFood products
% change y-o-y
Sources: Central Statistical Organisation of India and Haver Analytics.
Jan 14
02468
1012
Mar
13
Apr 1
3M
ay 1
3Ju
n 13
Jul 1
3Au
g 13
Sep
13O
ct 1
3N
ov 1
3D
ec 1
3Ja
n 14
Feb
14M
ar 1
4
%
Repo rateConsumer price index (CPI)Wholesale price index (WPI)
Sources: Ministry of Commerce and Industry, Reserve Bank of India and Haver Analytics.
World Economy
28 OPEC Monthly Oil Market Report – April 2014
Graph 3.15: Indian PMIs Graph 3.16: Indian GDP growth
Having already anticipated the current positive dynamic, the GDP growth forecast remains unchanged at 5.6% in 2014, a considerable rise from last year’s 4.7%. However, inflation and consequently, monetary policy, will remain influential factors and will need close monitoring in the coming months, particularly after the finalization of the current general elections by mid-May. China China’s Finance Minister reaffirmed the country’s growth target of 7.5% for 2014 at the recent National People’s Congress (NPC). Growth in consumption (both public and private) should remain firm in 2014. China's export performance will also firm as external demand conditions improve, especially in North America and the EU. However, the tightening of credit conditions is likely to ensure a significant slowdown in investment growth in 2014. Industrial production and investment growth continued to slow in January and February. Retail sales were also weaker, up less than 12% over the year, and the flash PMI for March came in at an eight-month low of 48.1. Graph 3.17: China exports to the EU Graph 3.18: China exports to the US
Mar 1451.3
Mar 1448.9
44
46
48
50
52
54
56
58M
ar 1
2M
ay 1
2Ju
l 12
Sep
12N
ov 1
2Ja
n 13
Mar
13
May
13
Jul 1
3Se
p 13
Nov
13
Jan
14M
ar 1
4
Index
Sources: HSBC, Markit and Haver Analytics.
Manufacturing PMI
Composite PMI
10.2
8.36.8
5.84.9
3.4 2.93.9
0
2
4
6
8
10
12
1Q 2Q 3Q 4Q 1Q 2Q 3Q 4Q 1Q 2Q 3Q 4Q
2011 2012 2013
Sources: National Informatics Centre (NIC) and Haver Analytics.
% change y-o-y
Avg. 2013 4.6%
-20%-15%-10%
-5%0%5%
10%15%20%25%
Jan
13Fe
b 13
Mar
13
Apr 1
3M
ay 1
3Ju
n 13
Jul 1
3Au
g 13
Sep
13O
ct 1
3N
ov 1
3D
ec 1
3Ja
n 14
% change y-o-y
Sources: China Customs and Haver Analytics.
-10%
-5%
0%
5%
10%
15%
20%
Jan
13Fe
b 13
Mar
13
Apr 1
3M
ay 1
3Ju
n 13
Jul 1
3Au
g 13
Sep
13O
ct 1
3N
ov 1
3D
ec 1
3Ja
n 14
% change y-o-y
Sources: China Customs and Haver Analytics.
World Economy
OPEC Monthly Oil Market Report – April 2014 29
In terms of private consumption, China’s first urbanization plan was announced after the NPC meetings. As expected, one major objective is to register more urban residents under the “Hukou” scheme, allowing them to access local health, education and social security. The plan, covering 2014−20, envisages Hukou coverage increasing from two-thirds to three-quarters of the urban population. The reforms should provide additional stimulus to private consumption and constitute a crucial aspect of economic rebalancing as the government continues to focus on infrastructure investment. Regarding the recent shadow banking problem, it seems the fragilities within China's financial sector have become clearly visible during March. The financial system is vulnerable because of interconnections between local government debt, inflated property prices, the banking system and corporate debt. Chinese authorities continue to proclaim their commitment to reform. This month, they announced plans to liberalize deposit rates further and to set up five private banks. They also reiterated their intention to establish a bank deposit protection scheme related to the grand reform agenda at the 3rd Plenum of the 18th CPC Party Congress. Most recently, Beijing has introduced a series of pro-growth measures to stabilize growth as a mini stimulus package, including:
· Accelerating fiscal expenditure in infrastructure; · A compositional shift in fiscal expenditure by cracking down on extravagance
expenditures and administrative expenses; · Accelerating administrative reform; · Service sector reform; · Resource pricing reform that aims to fix the distortions of a government-
controlled resource product pricing mechanism. These reforms may be connected to the recent depreciation of the renminbi (RMB). It seems that markets are confused and concerned about these mentioned reforms, and recent market data from China is contradictory. The final reading of the China Manufacturing PMI in March confirmed the weakness of domestic demand conditions. This implies that 1Q GDP growth is likely to have fallen below the annual growth target of 7.5%. It seems Beijing plans to fine-tune policy sooner rather than later to stabilize growth. February data also confirm that growth in China is slowing. Industrial output rose by 8.6% in January and February together, while investment rose by 17.9% and retail sales were up by 11.8%. All were lower than 4Q growth. We expect output to be moderate this year, but if the current pace of deceleration in industrial production continues (based on business cycle analysis), the risks in the near-term may be to the downside and for this reason the GDP growth forecast has been slightly revised down to 7.5% for this year, compared to 7.6% as projected last month. This is in line with the government’s 7.5% target. China’s economic slowing reflects short-term pain as new leaders attempt to steer economic restructuring. Several factors could have contributed to the softened growth momentum:
· Normalizing the monetary policy and addressing credit imbalances have caused the economy to slow;
· The manufacturing industry is facing overcapacity and declining rates of return. Cutting capacity in “old China” industries is hurting growth momentum while the “new China and high value-added” sectors are picking up;
· Encouraging public consumption as well as public investment; · Household income growth, especially for urban households.
World Economy
30 OPEC Monthly Oil Market Report – April 2014
Graph 3.19: Chinese PMIs Graph 3.20: Chinese GDP growth, SAAR
OPEC Member Countries Last month, Fitch Ratings upgraded the credit rating of Saudi Arabia to AA with a stable outlook, which is higher than many emerging and developing economies. The upwards revision is believed to be mainly driven by the continued improvement in the economy over the past years. The SABB HSBC PMI of March signalled the index well above the no-change line despite the moderation from February’s figure. The PMI posted 57.0 in March, compared to 58.6 a month earlier. The survey showed a record surge in exports from the country’s private non-oil producing sector. In Iraq, consumer prices decreased by 0.9% y-o-y in February, while the 12-month inflation rate was 3.0% higher due to a 7% increase in food prices. International reserves in Iraq grew to $78 billion at the end of 2013, from $71 billion a year earlier. This accounts for approximately 10 months of imports of goods and services. Retail trade and construction have led non-oil activity to grow by 7% y-o-y in 2013. Graph 3.21: Saudi Arabia and UAE: manufacturing PMIs
In the United Arab Emirates (UAE), non-oil private sector companies reported an output increase in March with the PMI reaching 57.7, up from February's 57.3. The survey showed that order intakes had their second-sharpest performance in the series’
49.3
48.0
51.9
46
48
50
52
54Ap
r 13
May
13
Jun
13Ju
l 13
Aug
13Se
p 13
Oct
13
Nov
13
Dec
13
Jan
14Fe
b 14
Mar
14
Index
Composite PMIManufacturing PMIServices business activity
Sources: HSBC, Markit and Haver Analytics.
9.8
9.5
9.2
8.9
8.1
7.6
7.4 7.
97.
77.
5 7.8
7.7
5
6
7
8
9
10
11
1Q 2Q 3Q 4Q 1Q 2Q 3Q 4Q 1Q 2Q 3Q 4Q
2011 2012 2013
Source: China's National Bureau of Statistics and Haver Analytics.
% change y-o-y
57.0
57.7
50
55
60
65
Mar
12
Apr
12
May
12
Jun
12
Jul 1
2
Aug
12
Sep
12
Oct
12
Nov
12
Dec
12
Jan
13
Feb
13
Mar
13
Apr
13
May
13
Jun
13
Jul 1
3
Aug
13
Sep
13
Oct
13
Nov
13
Dec
13
Jan
14
Feb
14
Mar
14
Index
Saudi Arabia UAE
Sources: SAAB, HSBC, Markit and Haver Analytics.
World Economy
OPEC Monthly Oil Market Report – April 2014 31
history. New export business accelerated last month, though the rate of expansion has eased from February's record high. In line with trends for output and new orders, purchasing activity rose in March. Other Asia Last month, the Central Bank in Vietnam reduced the refinance rate from 7% to 6.5%. This was intended to support business by spurring credit growth. The central bank data showed that lending contracted by 1.05% in March from the end of 2013, while the government’s growth target stands at between 12%−14% in 2014. In its attempts to attract more foreign investment, Vietnam is trying to create favourable conditions for foreign investors to take part in the sale/purchase of bad debt. Earlier this year, foreigners were allowed to buy larger stakes in the country’s banks. The new entity bought bad debt of around $1.9 billion worth last year and may buy more than four times this amount in 2014. Furthermore, a legal framework is to be set up to help create a regulated market for bad debt. The successful management of bad debt would support lending and businesses, in addition to providing a less risky environment for foreign investment. Inflation in Vietnam registered 4.7% y-o-y, signalling the slowest pace since November 2009, while exports perked up by 12.3% y-o-y in January and February of this year. The HSBC manufacturing PMI showed that new orders rose at the fastest pace since October 2013. The reading was up slightly from 51.0 in February and pointed to a seventh consecutive monthly improvement in operating conditions. Graph 3.22: Manufacturing PMIs in Other Asia
The recent months’ increases of electricity tariffs and subsidized fuel are putting pressure on inflation in Malaysia. Inflation climbed by 3.4% y-o-y in January, the fastest pace since October 2011. Thus, the more downside risks to the nation’s GDP growth are now officially acknowledged by the central bank, which brought down its lower range of 2014’s growth to 4.5% from 5.0%. Accordingly, the officially forecasted range now stands between 4.5% and 5.5%. Last year, portfolio investment outflow from Malaysia amounted to around 2.8 billion ringgit against an inflow of 58.4 billion ringgit in 2012. In Indonesia, inflation eased to 7.8% in February, dipping below 8% for the first time since October of last year. Bank Indonesia maintained the reference rate at 7.5% on the back of slowing inflation and a strengthening rupiah. The Ministry of Finance expects a possible growth slowdown this year of 5.5%−5.8%, the least since 2009, as the government is trying to limit the current account deficit. The country’s
50.1
52.751.3
49.9
4244464850525456
Apr
12
May
12
Jun
12
Jul 1
2
Aug
12
Sep
12
Oct
12
Nov
12
Dec
12
Jan
13
Feb
13
Mar
13
Apr
13
May
13
Jun
13
Jul 1
3
Aug
13
Sep
13
Oct
13
Nov
13
Dec
13
Jan
14
Feb
14
Mar
14
Index
Indonesia Taiwan Vietnam Hong Kong
Sources: HSBC, Markit and Haver Analytics.
World Economy
32 OPEC Monthly Oil Market Report – April 2014
manufacturing sector continued to grow, but at a slower pace, with the manufacturing PMI dropping slightly, close to 50. The PMI posted 50.1 last month, down from 50.5 in February, with output contracting despite faster growth seen in new orders. In Taiwan, the PMI in March showed that business conditions improved at the slowest pace in six months, posting 52.7, down from February’s 54.7. The survey indicated that both output and new orders have expanded at weaker rates. Africa The tourism sector in Morocco registered record arrivals in 2013 of more than 10 million, a 7% increase over the previous year. In 2014, official forecasts point to an 8% increase. The sector generated more than 20,000 jobs last year and was expected to continue being a key driver of the economy, accounting for around 9% of the GDP. In Tunisia, the unemployment rate edged lower during 4Q13 but remained elevated at 15.3%, as shown by the National Institute of Statistics. This figure compares to 15.7% unemployment in 3Q13 and 16.7% in 4Q12. The number of jobs created rose to 27,500 in 4Q13, from 25,900 in the previous quarter, while Tunisia's labour force grew by 16,800. The service sector accounted for the major share of employment at 51%, followed by manufacturing (19%), agriculture (15%) and the non-manufacturing sector (15%). Egypt's urban consumer price index inflation moderated to a 9.8% annual rate in February, from 11.4% y-o-y in January and 11.7% y-o-y at the end of 2013, according to recent data from the country's Central Agency for Public Mobilization and Statistics (CAPMAS). On a monthly basis, consumer price inflation continued apace, rising 1.0% during the second month of 2014. The economy’s PMI showed a fractional deterioration in private sector business conditions with the headline index falling slightly from February’s 50.0 to 49.8. The survey indicated that the rate of job shedding has eased to an 18-month low. Graph 3.23: Manufacturing PMIs in South Africa and Egypt
In South Africa, the South African Chamber of Commerce and Industry's business confidence index increased to 91.9 in February, after slowing to 90.5 in January; however, the expected trade activity index remained unchanged over the same period. The First National Bank and Bureau of Economic Research business confidence index, which measures confidence on a quarterly basis, sank back to 41 in the first quarter,
50.349.8
35
40
45
50
55
60
Apr 1
2
May
12
Jun
12
Jul 1
2
Aug
12
Sep
12
Oct
12
Nov
12
Dec
12
Jan
13
Feb
13
Mar
13
Apr 1
3
May
13
Jun
13
Jul 1
3
Aug
13
Sep
13
Oct
13
Nov
13
Dec
13
Jan
14
Feb
14
Mar
14
Index
South Africa Egypt
Sources: Investec, IPSA, Markit, Reuters Telerate and Haver Analytics.
World Economy
OPEC Monthly Oil Market Report – April 2014 33
following a reading of 43 index points in the previous quarter. Retail trade in South Africa showed a slow start to the year. Latest official data shows South Africa's seasonally adjusted real retail sales were up 6.0% y-o-y in January, from 4.1% y-o-y in December 2013; however, this increase only reflects the previous year's low base. A more accurate picture can be gained from the slowdown on a monthly basis, as growth slowed to 0.8% m-o-m in January, from an increase of 1.0% m-o-m in the previous month. Inflation in South Africa increased to 5.9% y-o-y in February 2014 from 5.8% y-o-y in January 2013. On a monthly basis, prices accelerated by 1.1% m-o-m from 0.7% m-o-m in the previous month. The rise in inflation is attributed to the more expensive fuel and health insurance. Fuel price increases added 0.3 pp to the overall rise in monthly inflation, while miscellaneous goods and services, mainly an increase in health insurance prices, added 0.6 pp. Services inflation jumped 1.5% m-o-m and goods inflation by 0.8% m-o-m between January and February 2014. The PMI survey showed that mining strikes caused a contraction in private sector output in March. The seasonally adjusted headline PMI fell from February’s 51.5 to 50.2 in March, signalling the weakest improvement in operating conditions in the current six-month period of growth. Latin America Moody’s rating agency downgraded the rating for Argentina's public debt by one step to Caa1, citing the increased risk to debt service for government bonds given a significant deterioration in the country’s foreign exchange reserves and unclear policy-making by local authorities. The country’s foreign exchange reserves deteriorated over the past three years from $52.7 billion in 2011 to $27.5 billion in 2014. The outlook on the rating was set as stable, from negative. Argentina's national statistics institute published the second data point of the new consumer price index (CPI). According to the data release, Argentina's monthly consumer inflation was 3.4% m-o-m in February 2014, compared to the 3.6% m-o-m registered in January 2014. Chile's Central Bank released national income accounts data showing that the economy expanded by 2.7% y-o-y in 4Q13, decelerating the growth pace and contrasting the stronger rates posted in the first three quarters at 4.9%, 3.8% and 5.0%, respectively. Overall, GDP expanded at an annual rate of 4.1% for 2013, following 5.4% in 2012. In Peru, the Central Bank kept the monetary policy rate unchanged at 4.0% in March amid mixed signals on the balance of risks. According to the Central Bank, such a rate level aligns with projected inflation at 2.0% in 2014–15. Inflationary expectations are aligned with the inflation target range while GDP growth rates continue to be below potential. Transition region In Poland, retail sales data for early 2014 signal that household demand has continued to strengthen after rising 2.1% y-o-y in 4Q13. Retail sales soared to 7.0% y-o-y in February, the highest rate since May 2012. According to Poland's Central Statistical Office, retail sales rose in nearly all categories in February, with declining fuels serving as the only mitigating factor. Sales of cars soared 24.9% y-o-y in February as consumer confidence increased to its highest level since December 2010 before falling back modestly in March. Consumer sentiment has benefited from an improving labour market as enterprise employment jumped 0.7% y-o-y in February, marking the fifth straight month of growth. Moreover, the registered unemployment rate also decreased
World Economy
34 OPEC Monthly Oil Market Report – April 2014
to 13.9% in February, down from 14.4% a year earlier. That marked the strongest y-o-y improvement in the jobless rate since January 2009. The Polish manufacturing economy continued to expand last month, though at a relatively slower pace. The manufacturing PMI posted 54.0 in March, down from February’s 38-month high of 55.9. The survey highlighted a weaker rise in new orders, which reflects a slower growth in exports. Graph 3.25: Manufacturing PMIs in transition region
Last month, the National Bank of Hungary continued its easing policy by reducing the main policy rate by 10 basis points to 2.60%. This is the 20th consecutive reduction in as many months, although the size of the cuts has decelerated, bringing the interest rate to a new record low. In the Czech Republic, the manufacturing economy remained strong last month despite the fall in its PMI from February’s 34-month high. The index fell to 55.5 last month from 56.5 in February, still well above the long-run average of 52.5. According to the latest balance of payment data published by the National Bank of Belarus, the current account of the country in 2013 posted a deficit totalling $7.3 billion. This result represents a near tripling of the gap compared with 2012. In the fourth quarter, the deficit stood at $2.0 billion, which marks a widening of 11% y-o-y and of some 4% q-o-q. The goods trade deficit, in particular, amounted to $4.5 billion in sharp contrast to the 2012 surplus of $565 million. Financial account results show that the FDI account deficit widened by some 58% compared with 2012 to stand at $2.1 billion.
55.5
53.754.0
444648505254565860
Apr
12
May
12
Jun
12
Jul 1
2
Aug
12
Sep
12
Oct
12
Nov
12
Dec
12
Jan
13
Feb
13
Mar
13
Apr
13
May
13
Jun
13
Jul 1
3
Aug
13
Sep
13
Oct
13
Nov
13
Dec
13
Jan
14
Feb
14
Mar
14
Index
Czech Republic Hungary Poland
Sources: HALPIM, HSBC, Markit and Haver Analytics
World Economy
OPEC Monthly Oil Market Report – April 2014 35
Oil prices, US dollar and inflation In March, as in the previous month, the US dollar was relatively resilient compared to its major currency counterparts. Interesting developments were once again observed in the emerging market currencies. While the slight decline of the yuan continued, the Indian rupee recovered from its decline that started last year and reached a level of below INR60/$ at the end of March for the first time since July of last year. Compared to the major currencies, the US dollar changed only slightly on a monthly average. Compared to the euro, the US dollar fell by 1.2% in March and stood at a monthly average of $1.3822/€. Versus the Japanese yen, it gained 0.1% to reach ¥102.273/$. Compared to the pound sterling, it fell again for the fourth consecutive month by 0.5%, while compared to the Swiss franc, it declined by 1.5%. With the ongoing recovery in the US, the tapering of the US Fed, the expectation of continued monetary stimulus from the ECB and the ongoing efforts to stimulate the economy by the the BoJ, and given the current slow-down in the emerging markets, the US dollar should be expected to appreciate in the coming months. However, capital inflows into the peripheral economies of the Euro-zone have kept the euro unexpectedly strong so far. In nominal terms, the price of the OPEC Reference Basket (ORB) declined by a monthly average of $1.23/b, or 1.0%, from $105.38/b in February to $104.15/b in March. In real terms, after accounting for inflation and currency fluctuations, the ORB declined by 2.0%, or $1.09/b, to $62.35/b from $63.44/b (base June 2001=100). Over the same period, the US dollar fell by 1.0% against the import-weighted modified Geneva I + US dollar basket* while inflation was unchanged.
* The ‘modified Geneva I+US$ basket’ includes the euro, the Japanese yen, the US dollar, the pound sterling and the Swiss franc, weighted according to the merchandise imports of OPEC Member Countries from the countries in the basket.
World Oil Demand
36 OPEC Monthly Oil Market Report – April 2014
World Oil Demand In 2013, world oil demand remained relatively unchanged, with total world oil demand growth standing at 1.05 mb/d to average 90.01 mb/d. For 2014, growth is expected to be around 1.14 mb/d, unchanged from last month’s forecast of 91.15 mb/d. The bulk of the growth will be seen in non-OECD, as most of the OECD is still in contraction. In OECD Americas, the slow-down in US oil demand figures witnessed at the beginning of 2014 were mainly attributed to lower consumption of transportation fuels due to exceptional cold snaps in the northern hemisphere. The remarkable oil growth gains recorded in 4Q13 didn't last into 2014 or at least the first two months. Actual data and preliminarily data for the months of January and February 2014 indicate a slower momentum in US oil demand, with the bulk of this slowdown attributed to lower consumption of gasoline as well as propane/propylene. In OECD Europe, the oil consumption situation is relatively unchanged from last month. Oil demand in the Big 4 consuming nations declined during the month by around 0.1 mb/d, which is the same level of decline seen in the past five to six months. Focus will be on industrial activities in addition to the automobile market in the region to support any potential oil demand growth. Auto sales in the region have grown for six consecutive months from the levels seen in 2013. Table 4.1: World oil demand in 2013, mb/d
Demand for petrochemical feedstock seems to be driving product consumption in OECD Asia Pacific, in both Japan and South Korea. However, oil demand growth in Japan is highly dependent on the re-start of nuclear plants in the country and how much crude oil and fuel oil will be used in the power generation plants. The outlook for the region is very much similar to expectations drawn back in July 2013.
Totals may not add up due to independent rounding.
Change 2013/12
World Oil Demand
OPEC Monthly Oil Market Report – April 2014 37
Table 4.2: World oil demand in 2014, mb/d
In Other Asia, India was back to average growth levels in February 2014, a level not seen since May of 2013. Most of the oil demand growth originated from LPG and gasoline, which are largely affected by the low base line of 2013. It remains to be seen whether this level of growth will continue in the coming months as the country holds general elections. In Latin America, oil consumption growth in Brazil has been decreasing since October of 2013. Oil consumption growth was just around 80 tb/d for the month of January 2013. The country registered around 0.13 mb/d of growth, as an average, for 2013. Graph 4.1: Quarterly world oil demand growth
In China, February 2014 oil consumption levels as well as growth levels were both lower than in January 2014, however oil demand grew above the 0.2 mb/d. Rising demand for LPG, jet fuel and gasoline were the reasons for most of the gains. The overall 2014 outlook for China is now slightly skewed to the downside, largely because
Totals may not add up due to independent rounding.
World Oil Demand
38 OPEC Monthly Oil Market Report – April 2014
of economic slow-down risks related to pollution and the implementation policies and measures necessary to address it, mainly in the transportation sector. OECD Americas The most recent monthly US oil demand data for January 2014 show gains in oil requirements just below 2% y-o-y. These developments follow increases in 4Q and overall in 2013, especially during the second half, partly influenced by baseline effects — lower effects for 2013 and higher for January 2014. Specifically considering the product categories for January 2014, gains in distillates, which move in line with higher industrial production, have been partly offset by decreasing residual fuel oil and gasoline demand negatively affected by the cold weather — through less mileage travelled and increasing substitution with natural gas. Moreover, jet fuel demand was another contributor to the volume increases during January 2014, consistent with increasing air traffic figures. Preliminary February 2014 weekly data show falling overall requirements during a month with exceptionally cold temperatures. Driving and gasoline demand were less as compared to the previous month last year, while substitution of oil with natural gas continued. In March 2014, preliminary figures suggest overall growth of around 0.5% y-o-y. Gains in gasoline demand were partly offset by losses in residual fuel and propane/propylene requirements. While 2014 US oil demand remains strongly dependent on the development of the US economy, the risks are quite balanced as compared to last month’s publication. Graph 4.2: US oil consumption, y-o-y changes
Canadian data showed gains in fuel oil and distillate requirements, which were more than offset by declining demand for other product categories, notably transportation fuels. The latter were affected by the cold weather, similar to the situation in the US. 2014 projections for Canadian oil demand remain unchanged from those reported last month. In Mexico, February 2014 was another disappointing month for oil demand and was characterized by falling needs for all product categories, the largest declines seen in residual fuel oil. Mexican oil demand is projected to grow slightly in 2014, however, risks are more skewed to the downside as compared to last month’s report.
-1,500
-1,000
-500
0
500
1,000
1,500
Jan
12Fe
b 12
Mar
12
Apr
12
May
12
Jun
12Ju
l 12
Aug
12
Sep
12
Oct
12
Nov
12
Dec
12
Jan
13Fe
b 13
Mar
13
Apr
13
May
13
Jun
13Ju
l 13
Aug
13
Sep
13
Oct
13
Nov
13
Dec
13
Jan
14Fe
b 14
Mar
14
tb/d
All other Distillates Gasoline Total oil
World Oil Demand
OPEC Monthly Oil Market Report – April 2014 39
In 2013, OECD Americas oil demand grew by 0.32 mb/d as compared to 2012. In 2014, OECD Americas oil demand is projected to grow once again, by 0.19 mb/d, as compared to 2013. OECD Europe The upward movement of European oil demand during 2013 has somehow stagnated during the first two months of 2014 despite the extremely low baseline during the last three years. Big 4 total oil demand data from February 2014 indicates more than a 1.5% decline y-o-y, with distillates being the product mostly affected, partly due to the mild winter. During the same month, gasoline demand remained flat while jet fuel requirements grew y-o-y. Declines in oil demand for most of the countries with debt issues seemed, however, to have stabilized. In January 2014, oil demand fell specifically in Spain and Greece, while it increased in Portugal y-o-y. There seem to be no clear signs, however, as to the direction in which short-term developments in European oil demand are heading. Table 4.3: Europe Big 4* oil demand, tb/d
Factors that could possibly boost European oil demand in the short term are increasing industrial production and an upswing in the automobile market, after a very long negative history, showing gains in February 2014 for the sixth consecutive month. Downside risks are mainly of a financial nature and remain the same as in previous months — unsolved debt issues in a number of countries in the region and rigorous austerity measures. Moreover, the fact that European oil demand is strongly taxed, especially in the transportation sector, encourages a rather conservative approach as far as future projections are concerned. As a result, the general expectations for the region’s oil demand during 2014 have remained unchanged since last month’s projections and are largely connected to the developments of the economy. In 2013, OECD Europe oil demand shrank by 0.17 mb/d as a result of the deep economic crisis in several regions’ countries, while oil demand in 2014 is projected to decrease again, but to a lesser extent, by 0.16 mb/d. OECD Asia Pacific In Japan, February 2014 oil demand decreased slightly, by more than 1% y-o-y, with diverse developments in the main product categories. Oil requirements in crude and fuel oil for electricity generation fell slightly as a result of continuing substitution with natural gas and coal, while naphtha demand grew impressively by more than 10%. Furthermore, demand for transportation fuels shrank for another month, y-o-y. The structure of Japanese oil demand growth has evolved during the last year from electricity generation fuels (crude and fuel oil) to the petrochemical industry (naphtha) as the dominating factors.
Feb 14 Feb 13 Change from Feb 13 Change from Feb 13, %LPG 417 456 -39 -8.6Gasoline 1,064 1,066 -2 -0.2Jet/Kerosene 732 694 38 5.4Gas/Diesel oil 3,176 3,201 -25 -0.8Fuel oil 319 327 -8 -2.5Other products 981 1,051 -71 -6.7
Total 6,689 6,796 -107 -1.6
* Germany, France, Italy and the UK.
World Oil Demand
40 OPEC Monthly Oil Market Report – April 2014
The outlook risks for 2014 remain unchanged from last month’s forecasts and are determined by the degree of coal and gas usage for electricity generation as well as by the likelihood for the restart of some of the country’s nuclear plants during 2014. In South Korea, January 2014 figures came up decreasing, y-o-y. Flourishing petrochemical activities, which called for increasing naphtha requirements, were more than offset by declining demand for all other product categories, the largest declines seen in fuel oil. The outlook for South Korean oil consumption during 2014 remained unchanged as compared to last month’s projections. Table 4.4: Japanese domestic sales, tb/d
2013 OECD Asia Pacific oil consumption shrank by 0.22 mb/d. The downward trend will continue in 2014, but to a smaller degree, by 0.13 mb/d. Other Asia After declining in January 2014, Indian oil demand growth turned positive in February, registering around 90 tb/d, an approximate 2.5% increase as compared to a year earlier to average 3.8 mb/d. Growth was witnessed across all product categories, with LPG and gasoline recording the highest gains while middle distillates and fuel oil fell, the latter at a significant pace. Graph 4.3: Changes in Indian oil demand, y-o-y
-300-200-100
0100200300400500
Jan
12
Feb
12
Mar
12
Apr
12
May
12
Jun
12
Jul 1
2
Aug
12
Sep
12
Oct
12
Nov
12
Dec
12
Jan
13
Feb
13
Mar
13
Apr
13
May
13
Jun
13
Jul 1
3
Aug
13
Sep
13
Oct
13
Nov
13
Dec
13
Jan
14
Feb
14
tb/d
LPG Gasoline Kerosene Diesel oil Fuel oil Other products
Feb 14 Change from Feb 13 Change from Feb 13, %LPG 527 -16 -3.0Gasoline 799 -58 -6.8Naphtha 793 74 10.3Jet fuel 52 1 2.7Kerosene 566 -14 -2.4Gas oil 548 -17 -3.0Fuel oil 812 -26 -3.1Other products 64 -6 -8.6Direct crude burning 284 10 3.7
Total 4,444 -52 -1.2
World Oil Demand
OPEC Monthly Oil Market Report – April 2014 41
Diesel oil, which accounts for the larger portion of Indian oil demand, has been in a declining trend since the middle of last year with only a moderate improvement in the month of November. This trend has never been witnessed in data available for Indian diesel oil demand growth figures. Diesel oil declined slightly in February after dipping more than 35 tb/d in the previous two months. Diesel oil accounts for around 40% of total Indian oil consumption. The shrinkage in diesel oil demand was caused by a combination of less consumption in the power sector, increasing fuel substitution with natural gas in the industrial part of the economy, as well as unexpected rainfalls, indicating lesser activity in the agricultural sector. Jet/kerosene also recorded negative growth despite positive developments in the aviation sector with lowering air fares to promote domestic air travel in the country. From the positive side, LPG and gasoline both grew by around 9% and 8%, respectively, mainly as a net effect of the low historical baseline in February 2013 for both products in addition to the removal of some logistical constrains in the case of LPG. The overall forecast for 2014 Indian oil demand remains the same as highlighted in last month’s report, however, the country’s fiscal deficit and the outcome of the upcoming general election should effect oil demand consumption. Table 4.5: Indian oil demand by main products, tb/d
In Taiwan, the latest available data from the month of January 2014 indicate increasing oil requirements by 36 tb/d or more than 3% y-o-y. The bulk of these volumes originated in distillate fuels, namely jet fuel and naphtha, highlighting improvement in the aviation and petrochemical sectors. Fuel oil, on the other hand, was largely in the negative, losing around 10% of the levels registered during the same period last year mainly due to less fuel being used to generate power in the industrial sector and less consumption for bunkering. In Indonesia, positive oil demand growth in January 2014 stemmed from increasing requirements for fuel oil, LPG, jet/kerosene and other products, while diesel oil was the only product in decline mode, indicating slower demand in the transportation/industrial sectors. In January 2014, Indonesia consumed around 1.3 mb/d, 24 tb/d higher than the same period last year. Other Asia’s oil demand grew at a rate of 0.20 mb/d in 2013. As for 2014, oil demand is forecast to experience solid growth again, at 0.23 mb/d.
Latin America 2014 total oil consumption in Latin America is estimated to reach 6.7 mb/d, growing by around 0.23 mb/d from 2013 levels, roughly unchanged from last month’s expectations. In Brazil, January 2014 data signifies average oil demand growth in the country, with most of the product categories recording modest to average growth with the exception of fuel oil, which fell significantly. Firm demand for transportation fuels were more than offset by fuel oil declines. Gasoline and diesel oil both grew by more than 7% in line with car sale statistics. In January 2013, Brazilian light passenger vehicles were slightly higher for the first time since September 2013. The total product increase came in spite of the country’s PMI index being almost level with threshold point of 50 in January 2014. Total oil demand for January 2014 stood at around 2.3 mb/d, 83 tb/d higher than the level seen during the same month last year. Table 4.6: Brazilian inland deliveries, tb/d
In Argentina, oil demand in January 2014 grew more than 7% y-o-y. Other products, fuel oil and gasoline have been the most demanded product categories, signalling improvement in the transportation sector as well as the industrial sector. The acceleration of oil consumption was very much in line with signs of improvement in economic activities and manufacturing output in the country. Latin American oil demand is estimated to have grown in 2013 by 0.22 mb/d. During 2014, Latin American oil demand is forecast to increase slightly by 0.24 mb/d. Middle East In the Middle East, oil demand is anticipated to continue growing in 2014 at a stable rate, increasing by 0.31 mb/d above the 2013 total consumption levels. Similar to 2013, most of this growth is expected to come from Saudi Arabia, with expected growth of 0.15 mb/d. In Saudi Arabia, oil consumption in 2014 began with oil growth of around 0.1 mb/d or around 5% y-o-y. Most of this growth is directed towards other products, direct crude burning and jet/kerosene, indicating improvements in the industrial and aviation sectors. Similarly, oil demand figures for January 2014 in Iraq were encouraging with growth of approximately 80 tb/d, an increase of around 12% y-o-y. The bulk of this growth originated from crude oil burning for power generation with moderate growth also in transportation fuels, namely jet/kerosene and diesel oil. In 2013, Middle East oil demand grew by 0.28 mb/d, while in 2014, it is projected to increase by 0.31 mb/d.
Graph 4.4: Oil demand growth in the Middle East, y-o-y
China According to the latest statistics, February 2014 Chinese oil demand growth registered modest growth of 0.26 mb/d from a year earlier. However, total consumption levels and growth levels were both lower than January 2014, when they were around 10.2 mb/d and around 0.3 mb/d, respectively. Increasing LPG requirements for the petrochemical industry in combination with rising jet fuel demand accounted for the bulk of these gains. Moreover, gasoline demand grew as a result of growth in motor vehicle sales, which also increased by almost 18% y-o-y. During the same month, distillate requirements rose in line with the improvements in industrial production. Fuel oil requirements declined notably in February 2013 y-o-y. Graph 4.5: Chinese gasoline demand growth, y-o-y
Recently, plans towards accelerating the implementation of national Phase 5 emission standards for gasoline and diesel in a number of major cities and provinces were announced to be in place by the end of 2015 rather than 2018. Phase 5 emission standards are very much similar to the Euro 5 emission standards, which limit the content of sulfur to 10 ppm, forcing producers to invest in their facilities to produce the required quality standards. According to the National Development and Reform Commission (NDRC), gasoline and diesel prices are to increase by more than $47/mt and $60/mt, respectively, to upgrade those products from Phase 4 standards to
-50
0
50
100
150
200
250
300
350
-50
0
50
100
150
200
250
300
350
1Q12 2Q12 3Q12 4Q12 1Q13 2Q13 3Q13 4Q13
tb/dtb/d
Saudi Arabia I.R. Iran Kuwait UAE Others
-10
-5
0
5
10
15
20
Jan
12
Feb
12
Mar
12
Apr
12
May
12
Jun
12
Jul 1
2
Aug
12
Sep
12
Oct
12
Nov
12
Dec
12
Jan
13
Feb
13
Mar
13
Apr
13
May
13
Jun
13
Jul 1
3
Aug
13
Sep
13
Oct
13
Nov
13
Dec
13
Jan
14
Feb
14
tb/d
World Oil Demand
44 OPEC Monthly Oil Market Report – April 2014
Phase 5 standards. Other measures to combat environmental concerns in China would also include the promotion of natural gas in transportation and controls on new car registrations. As a result, possible shrinkage in the consumption of transportation fuels is anticipated. The overall 2014 outlook is slightly skewed to the downside, mainly due to risks of an economic slowdown and the implementation of some measures against air pollution in cities, in which case transportation demand would slow down. Graph 4.6: Changes in Chinese apparent oil demand, y-o-y
In 2013 Chinese oil demand grew by 0.33 mb/d, while in 2014, it is projected to increase again by 0.34 mb/d.
-600
-400
-200
0
200
400
600
800
1,000
-600
-400
-200
0
200
400
600
800
1,000
Jan Feb Mar Apr May Jun Jul Aug Sep Oct Nov Dec
tb/dtb/d
Historical range 2011 2012 2013 2014
World Oil Supply
OPEC Monthly Oil Market Report – April 2014 45
World Oil Supply Non-OPEC oil supply growth in 2013 was revised up by 10 tb/d over the previous MOMR to stand at 1.34 mb/d, driven by strong growth from OECD Americas. In 2014, non-OPEC oil supply is projected to grow by 1.37 mb/d — up by 60 tb/d from the previous assessment — to average 55.6 mb/d. OPEC NGLs production is forecast to average 5.95 mb/d in 2014, following output of 5.80 mb/d in 2013, unchanged from the last report. In March 2014, OPEC production dropped by 626 tb/d to average 29.61 mb/d, according to secondary sources. As a result, preliminary data indicates that global oil supply decreased 712 tb/d in March to average 90.63 mb/d. Non-OPEC supply Estimate for 2013 Non-OPEC oil supply is estimated to have averaged 54.18 mb/d in 2013, an increase of 1.34 mb/d over the previous year. This constitutes a negligible upward revision from the previous Monthly Oil Market Report (MOMR), coming from changes to supply estimates for the second half of 2013. In 2013, non-OPEC supply growth was supported mainly by OECD Americas, the former Soviet Union (FSU), China, Latin America and Africa, while supply from all the other regions declined. Graph 5.1: Regional non-OPEC supply growth, y-o-y
In 2013, OECD Americas’ supply experienced the largest growth of all non-OPEC regions at 1.34 mb/d. This was followed by the FSU, with an increase of 150 tb/d over the previous year. Supply in Africa, Latin America and China grew by 110 tb/d, 100 tb/d and 90 tb/d, respectively. The biggest decline came from OECD Europe, with a drop of 0.2 mb/d. Middle East supply saw the second-largest drop, followed by OECD Asia-Pacific and Other Asia. On a quarterly basis, non-OPEC supply in 2013 is estimated at 53.73 mb/d, 53.64 mb/d, 54.12 mb/d and 55.21 mb/d, respectively. Compared with the same quarters of 2012, growth reached 0.60 mb/d, 1.26 mb/d, 2.00 mb/d and 1.44 mb/d, respectively.
-0.5
0.0
0.5
1.0
1.5
-0.5
0.0
0.5
1.0
1.5
OECDAmerica
OECDEurope
OECD AsiaPacific
OtherAsia
LatinAmerica
Middle East Africa FSU
mb/dmb/d
12/11 13/12 14/13
World Oil Supply
46 OPEC Monthly Oil Market Report – April 2014
Table 5.1: Non-OPEC oil supply in 2013, mb/d
Forecast for 2014 Non-OPEC supply is expected to increase by 1.37 mb/d to average 55.55 mb/d in 2014, representing an upward revision of 60 tb/d from the previous MOMR. Upward revisions to US and Canada’s supply in the first quarter are the reason for this revision. Table 5.2: Non-OPEC oil supply in 2014, mb/d
The OECD supply forecast had the biggest upward revision, followed by the FSU, while the other regions remained unchanged compared with the last monthly assessment. On a regional basis, OECD Americas’ supply is expected to witness the highest growth among all non-OPEC regions in 2014, followed by the FSU and Latin America, while OECD Europe’s supply is forecast to see the largest decline by 130 tb/d, but less than the last prediction of 150 tb/d. On a quarterly basis, non-OPEC supply is expected to average 55.23 mb/d, 54.99 mb/d, 55.47 mb/d and 56.51 mb/d, respectively. According to preliminary and estimated data, non-OPEC liquids supply decreased by 80 tb/d in March compared with the previous month. Therefore, estimations of non-OPEC supply in 1Q14 will be 55.23 mb/d, 20 tb/d more than in 4Q13 and 1.5 mb/d higher than the same quarter a year earlier. OECD Total OECD oil supply in 2013 is registered to grow by 1.06 mb/d to average 22.13 mb/d, indicating an upward revision of 20 tb/d from the previous MOMR. Output in 4Q13 reached 22.86 mb/d, up by 1.24 mb/d compared with the same quarter of the previous year. An upward revision for 4Q13 came only from OECD Americas compared with the last MOMR. On a quarterly basis, total OECD supply is estimated to average 21.71 mb/d, 21.66 mb/d, 22.27 mb/d and 22.86 mb/d, respectively. Graph 5.2: OECD’s quarterly production Graph 5.3: OECD’s quarterly production,
annual comparison
Total OECD oil supply is forecast to grow by 0.87 mb/d and average 23 mb/d in 2014, indicating an upward revision of 60 tb/d from the previous MOMR. The expected increase is lower than the previous year’s growth, though more than 110 tb/d above the average growth of the past five years (2009–2013) at 760 tb/d. The anticipated strong output increase from OECD Americas lies behind this, supported by projected growth in the US and Canada, where the highest growth among all non-OPEC countries is expected in 2014. The anticipated growth from OECD Americas is seen to more than offset the declines from OECD Europe and OECD Asia-Pacific. OECD Europe’s supply forecast experienced a minor upward revision from the previous MOMR. Upward revisions to individual countries’ supply profiles more than offset downward revisions. OECD Asia-Pacific’s oil supply outlook remained unchanged from the previous MOMR.
19
20
21
22
23
24
1Q11
2Q11
3Q11
4Q11
1Q12
2Q12
3Q12
4Q12
1Q13
2Q13
3Q13
4Q13
1Q14
2Q14
3Q14
4Q14
mb/d
19
20
21
22
23
24
1Q 2Q 3Q 4Q
mb/d
2011 20122013 2014
World Oil Supply
48 OPEC Monthly Oil Market Report – April 2014
On a quarterly basis, OECD supply is seen to average 22.90 mb/d, 22.61 mb/d, 22.91 mb/d and 23.57 mb/d, respectively. According to preliminary data, total OECD production in 1Q14, averaged 22.90 mb/d, 40 tb/d higher than in 4Q13 and 1.19 mb/d more than in the same quarter of 2013. Estimations show that total OECD output within the months of 1Q14 registered 22.98 mb/d, 22.92 mb/d and 22.80 mb/d, respectively. OECD Americas OECD Americas’ oil supply is recorded to have increased by 1.34 mb/d in 2013, the highest among all non-OPEC regions, averaging 18.08 mb/d and indicating an upward revision of 18 tb/d from the previous MOMR. The forecast of supply growth for the US and Canada in 2014 is seen to more than offset a reduced decline in Mexico and drive a healthy supply increase for the region. On a quarterly basis, the region’s supply in 2013 is expected to stand at 17.63 mb/d, 17.59 mb/d, 18.30 mb/d and 18.78 mb/d, respectively. This suggests an increase of 0.99 mb/d for this region in 2014 to average 19.07 mb/d, while on a quarterly basis, supply will be at 18.79 mb/d, 18.74 mb/d, 19.14 mb/d and 19.59 mb/d, respectively. US The US oil supply increased by 1.14 mb/d to average 11.17 mb/d in 2013, indicating a downward revision of 10 tb/d from the previous MOMR, while growth remained steady. The downward revision affected all quarters on the back of the historical revision. By quarter, US oil supply in 2013 registered an average of 10.62 mb/d, 10.92 mb/d, 11.38 mb/d and 11.74 mb/d, respectively. Updated production data for the early part of the first quarter supported the revision. US oil supply is projected to increase by 0.86 mb/d in 2014, the highest growth predicted among all non-OPEC countries, to average 12.03 mb/d, representing an upward revision of 10 tb/d from the previous MOMR. This revision was supported by a lower baseline in 2013. It is expected that US crude oil production growth, primarily concentrated in the Bakken, Eagle Ford and Permian regions, will continue in 2014 at a slower pace of growth than in the previous year. On a quarterly basis, US oil supply in 2014 is forecast to average 11.70 mb/d, 11.81 mb/d, 12.10 mb/d and 12.45 mb/d, respectively. Actual production data from the Federal offshore Gulf of Mexico (GOM) and Alaska showed a decline in January from the previous month, while output in Texas and North Dakota continued their healthy growth. Expected growth in 2014 is supported by an anticipated supply increase from shale oil plays in North Dakota and Texas, as well as by minor growth from other areas with developed shale plays. On a quarterly basis, US supply in 2014 is expected to average 11.78 mb/d, 11.80 mb/d, 12.09 mb/d and 12.45 mb/d, respectively. Based on the US Energy Information Administration (EIA)’s monthly oil production report for January, regular crude oil output registered at 4.93 mb/d, tight oil production increased to 3 mb/d, NGLs output reached 2.64 mb/d and biofuels and other non-conventional oils recorded the highest output at 1.22 mb/d. The use of energy from biomass resources in the United States grew by more than 60% over the decade between 2002 and 2013 — primarily through increased use of biofuels like ethanol and biodiesel which are produced from biomass. According to the EIA, biomass accounted for about half of all renewable energy consumed in 2013 and 5% of total US energy consumed. According to the above production levels of different US oil supply
components in January 2014, the growth of each component in the last five-year period (January 2009 - January 2014) was 0.17 mb/d, 2.68 mb/d, 0.93 mb/d and 0.39 mb/d, respectively. Upstream projects in 2014 include the development of Mars B in the deep waters of the Gulf of Mexico by Shell. To this end, production started in February on Olympus, the newly installed platform with a capacity of 100 tb/d. The development of two other projects— Na Kika (phase 3) and Cardamom Deep — was also scheduled for 1Q14, with a production capacity of 40 tb/d and 45 tb/d, respectively. The first BP Na Kika Phase 3 well began oil production on 19 February, with a second well expected to start up in the second quarter. The project includes the drilling and completion of the two new wells, the addition of subsea infrastructure to tie back to the Na Kika platform and new equipment to allow increased production from an existing well at the site. It will utilize available production capacity at the Na Kika hub. Na Kika Phase 3 is BP’s third new major upstream project set to begin production in 2014 following the Shell Mars B project in the Gulf of Mexico. The Cardamom project is expected to produce 50,000 barrels of oil equivalent (boe) a day at peak production. The operator company plans to add 45 tb/d from this field in 1Q14. Big Foot is another deep offshore project currently under development and is expected to commence production in 2Q14 with initial production of 75 tb/d. Graph 5.4: US quarterly production Graph 5.5: US quarterly production,
annual comparison
Canada and Mexico Canada’s oil production is expected to increase by 0.23 mb/d to average 4.01 mb/d in 2013, representing an upward revision of 30 tb/d from the previous MOMR. Fourth quarter supply was higher than expected compared with an increase of 360 tb/d and 120 tb/d for 2Q13 and 3Q13, respectively, to average 4.03 mb/d, up by 50 tb/d compared with the same quarter one year earlier. On a quarterly basis, Canada’s 2013 supply is estimated to average 4.08 mb/d, 3.78 mb/d, 4.02 mb/d and 4.03 mb/d, respectively. Canada’s oil output is forecast to grow by 0.18 mb/d to average 4.19 mb/d in 2014, showing an upward revision by 50 tb/d of production over the previous MOMR, in which growth for 2014 was recorded to be 0.16 mb/d over 2013. On a quarterly basis, Canada’s supply in 2014 is expected to average 4.13 mb/d, 4.12 mb/d, 4.20 mb/d and 4.31 mb/d, respectively.
8
9
10
11
12
13
1Q11
2Q11
3Q11
4Q11
1Q12
2Q12
3Q12
4Q12
1Q13
2Q13
3Q13
4Q13
1Q14
2Q14
3Q14
4Q14
mb/d
8
9
10
11
12
13
1Q 2Q 3Q 4Q
mb/d
2011 20122013 2014
World Oil Supply
50 OPEC Monthly Oil Market Report – April 2014
Steam injection began at the Algar Lake oil sands project, located about 60 km southwest of Fort McMurray in Alberta in January, employing the Steam-Assisted Gravity Drainage (SAGD) method. The initial 10 horizontal well pairs for Phase 1 were drilled and completed from a single pad in mid-2012. Field assembly of the central processing facility concluded in the summer of 2013. Initial steam injection began in January. Phase 1 should reach a peak production of more than 6 tb/d in early 2015. Moreover, Sunshine's West Ells location, which began construction of a 10 tb/d commercial SAGD facility in October 2012, is scheduled for first steam in 2014. The first phase of the West Ells SAGD project will proceed in two phases of 5 tb/d each. Modular expansion will increase production in phases. West Ells is expected to be capable of producing greater than 100 tb/d of bitumen from the Wabiskaw zone over a period of 18 years. The Black Gold oil sands project is another project located in the bitumen-rich southern Athabasca oil sands region of Alberta and is expected to produce at a design capacity of 10 tb/d of bitumen using SAGD technology. The initial project was approved by regulators in March 2010. Construction of the production facility is ongoing and the first 15 SAGD well pairs from two well pads were successfully drilled in October 2012. First oil production is expected in 2014. Phase 2 of the project includes plans to expand production to a design capacity of 20 tb/d additional bitumen, reaching a combined production of 30 tb/d. Oil supply from Mexico is expected to average 2.89 mb/d in 2013, indicating a decline of 30 tb/d from the previous year and remaining unchanged from the previous month. The country’s total liquids production is anticipated to drop by 500 tb/d in 2014 to average 2.84 mb/d, remaining unchanged from the previous month’s forecast. Out of Mexico’s total crude oil output of 2.5 mb/d in 2014, an average of 1.26 mb/d is expected from the shallow water Ku-Maloob-Zaap and Cantarell fields. It goes without saying that EOR techniques — used in brown fields and the offshore Cantarell giant field, which is currently producing approximately 0.4 mb/d — have helped to keep production steady to compensate for a failure to bring green fields on stream. The Mexican government recently passed a constitutional reform to overhaul the country’s oil and gas sector that could possibly attract international companies to take part in upstream oil and gas projects through production-sharing agreements. The reforms — which will open Mexico's energy industry to foreign companies — could solicit investment, leading to more oil and gas flowing to markets. On a quarterly basis, Mexico’s oil supply in 2014 is expected to average 2.87 mb/d, 2.82 mb/d, 2.84 mb/d and 2.83 mb/d, respectively. OECD Europe OECD Europe’s oil production is projected to decline by 130 tb/d in 2014 from the previous year to average 3.45 mb/d, indicating an upward revision of 30 tb/d from the previous MOMR. The bulk of the revision came from updated production data in the early part of 2014 which was partly carried across the year, in addition to changes to individual countries’ supply profiles. The anticipated decline is lower than in the previous year, as maintenance and unplanned outages are expected to be less in 2014. Oil output from the region’s main producers is expected to fall in 2014. On a quarterly basis, OECD Europe’s supply is seen to stand at 3.64 mb/d, 3.39 mb/d, 3.26 mb/d and 3.9 mb/d, respectively. Norway’s oil supply is predicted to decrease by 50 tb/d and average 1.79 mb/d in 2014, which is an upward revision of 10 tb/d from the previous MOMR. This revision
World Oil Supply
OPEC Monthly Oil Market Report – April 2014 51
came on the back of adjustments to current production data during the early part of the first quarter, when data indicated lower output than had been expected. Installation of the Brynhild (formerly Nemo) subsea template manifolds and production and injection flowlines have been successfully completed. The first of four development wells has reached total depth and encountered the top of the reservoir on prognosis. It is forecast to produce first oil in 2Q14 at a gross plateau production of 12 tb/d. The Knarr field, including Knarr West in the northern North Sea is expected to yield around 85 mb of recoverable oil equivalent when it comes on stream in 2014. According to preliminary data, Norway’s 1Q14 supply averaged 1.91 mb/d and its monthly breakdown from January to March averaged 1.97 mb/d, 1.92 mb/d and 1.84 mb/d, respectively — 70 tb/d higher than in 1Q13. On a quarterly basis in 2014, the country’s supply is expected to average 1.91 mb/d, 1.76 mb/d, 1.68 mb/d and 1.83 mb/d, respectively. The UK’s oil output is forecast to average 0.82 mb/d in 2014, a decline of 50 tb/d from the previous year and an upward revision of 20 tb/d from the previous month. The revision came on the back of adjustments to current production data during the early part of the first quarter. On a quarterly basis, UK supply is seen to stand at 0.89 mb/d, 0.80 mb/d, 0.75 mb/d and 0.83 mb/d, respectively. The East Rochelle E2 well is in production, with oil flowing to the Scott Platform. The West Rochelle W1 well is anticipated to restart production in a few days. Production from the two wells is expected to exceed available capacity limits across the Scott Platform. The East Rochelle oil and gas field is located in Block 15/27 of the Greater Rochelle area in the UK section of the North Sea. The Kinnoull reservoir, which is estimated to contain 45 mboe, is considered the largest of three reservoirs being brought on as part of the Andrew Area developments project. Kinnoull is expected to reach a peak production of 45 tboe/d after start up in 2014. Development drilling and installation of subsea equipment is nearing completion at the EnQuest-operated Alma and Galia development, with 15 tboe/d of capacity, in the UK North Sea. First production has been pushed back to 2Q14 due to expanded work. According to preliminary data, the UK’s production during 1Q14 registered at 0.92 mb/d, 0.88 mb/d and 0.87 mb/d, respectively, on monthly basis. Output in 1Q14 showed a decline of 40 tb/d over the same period of 2013. OECD Asia Pacific OECD Asia Pacific’s oil production is projected to average 0.49 mb/d in 2014, an increase of 10 tb/d from the previous year and unchanged from the previous MOMR. On a quarterly basis, OECD Asia-Pacific’s supply is expected to average 0.47 mb/d, 0.48 mb/d, 0.51 mb/d and 0.49 mb/d, respectively. Australia’s oil supply is forecast to increase by 10 tb/d to average 0.42 mb/d in 2014, a downward revision in growth of 10 tb/d compared with the last MOMR. Australia’s oil production outlook for 2014 remains steady on expected healthy oil supplies from new startup projects. Balnaves field — situated at a water depth of about 135 metres in the northern Carnarvon Basin about 180 km off the Western Australian coast — is one of the new projects expected to come on stream in 2Q14. The field is estimated to hold gross recoverable reserves of up to 17 mboe and 30 billion cubic feet of gas. It will
World Oil Supply
52 OPEC Monthly Oil Market Report – April 2014
produce 30 tb/d upon entering production. The Balnaves field is scheduled to be produced by four subsea wells, all connected to a single manifold. Liquids production from two other new projects — Gorgon phase II and Coniston-Novara — is expected to come on stream in 2Q14 and 4Q14. In 2014, on a quarterly basis, Australian supply is seen to average 0.40 mb/d, 0.43 mb/d, 0.45 mb/d and 0.47 mb/d, respectively. Developing countries Total Developing Countries’ (DCs’) oil supply in 2013 is expected to grow by only 10 tb/d to average 12.11 mb/d, unchanged from the previous MOMR. Output in 4Q13 reached 12.21 mb/d, up by 40 tb/d compared with the same quarter of the previous year. On a quarterly basis, total OECD supply averaged 12.09 mb/d, 12.07 mb/d, 12.07 mb/d and 12.21 mb/d, respectively in 2013. Under normal conditions, the quarterly pattern of DCs’ oil output would resemble that of other regions – however, the large geo-political risk factors prevent the supply trend from being more homogenous and thus lead to increased uncertainty in production projections. Total DCs’ oil production is expected to increase by 0.24 mb/d in 2014 to average 12.36 mb/d, indicating a downward revision of 10 tb/d from the previous MOMR. The revision came about from the preliminary oil supply data, which was 36 tb/d lower than expected in 1Q14 in Africa, Middle East and Latin America. Growth is expected to come from all regions except Other Asia. Latin America remains the region that is expected to experience the most growth in 2014 among all DC regions, followed by Africa and the Middle East, while Other Asia will decline by 30 tb/d. On a quarterly basis, DCs’ total oil supply is expected to stand at 12.23 mb/d, 12.31 mb/d, 12.38 mb/d and 12.50 mb/d, respectively in 2014. According to preliminary data, DC’s oil supply increased by 140 tb/d on average for 1Q14, compared with the same period one year earlier. Graph 5.6: Developing Countries’ quarterly production
Other Asia Other Asia’s total oil supply is expected to decrease by 30 tb/d in 2014 to average 3.53 mb/d, unchanged from the previous MOMR. On a quarterly basis, total oil supply in Other Asia in 2014 is predicted to average 3.54 mb/d, 3.52 mb/d, 3.53 mb/d and 3.51 mb/d, respectively. All countries of this region are expected to show a decline in production, except Malaysia which will see minor growth and Vietnam, which will remain steady. Indonesia, as the biggest producer of oil and other liquids in the region, is expected to decline by 10 tb/d in 2014 to average 0.93 mb/d. Indonesian oil production has been down compared with government targets for the last five years and another shortfall is expected in 2014. Liquids production declined by 50 tb/d to average 0.94 mb/d in 2013, while crude oil output dropped to 0.83 mb/d last year, 7% lower than what the government expected. It is anticipated that crude oil output will drop to 0.82 mb/d this year. It is also estimated that production dropped by 30 tb/d to 0.91 mb/d in 1Q14 compared with 4Q13. India’s stand as the region’s second-largest producer will be sustained more or less at 0.86 mb/d in all quarters of 2014, with a decline expected of 10 tb/d compared with 2013, although production grew 15 tb/d more than expected in 1Q14 to register at 0.89 mb/d. Moreover, the redevelopment of the Heera and South Heera fields — at an average water depth of 50 m and located 70 km offshore southwest of Mumbai — is scheduled to add 10 tb/d in first half of 2014. Malaysia’s liquids supply is expected to see growth of 10 tb/d to average 0.66 mb/d, with no expected decline in the region for 2014. Preliminary data shows production in 1Q14 at 0.66 mb/d. Thailand’s output in 2014 is expected to drop by 10 tb/d to average 0.35 mb/d, although its production in 1Q14 did not change compared with its 4Q13 average of 0.37 mb/d. Vietnam’s production was 0.39 mb/d last year — it will remain unchanged this year. The Dua oil project, with a full capacity of 25 tb/d, is located in Block 12W in the Nam Con Son Basin, offshore from southern Vietnam. At the end of February 2014, the project was over 67% complete and on track for first oil in mid-2014. FPSO modifications, riser pull-in and spool tie-in activities have been successfully completed and tested. Development drilling is currently underway. Brunei’s oil supply in 2013 declined by 20 tb/d to average 0.14 mb/d. It is forecast to see a decline in 2014, to average 0.12 mb/d. Other Asia’s oil supply is forecast to decline by 10 tb/d to average 0.21 mb/d in 2014. Latin America Latin America’s liquids supply is forecast to grow by 0.17 mb/d to average 4.95 mb/d in 2014, representing the third-highest global growth level, after OECD Americas and the FSU. Brazil, Colombia and Latin America will see the growth in the current year. On a quarterly basis, Latin America’s supply in 2014 is expected to stand at 4.84 mb/d, 4.90 mb/d, 4.97 mb/d and 5.09 mb/d, respectively. Preliminary production data in 1Q14 shows an increase by 60 tb/d to average 4.84 mb/d compared with 4Q13.
World Oil Supply
54 OPEC Monthly Oil Market Report – April 2014
Argentina’s oil output in 2013 registered 0.67 mb/d, a decline of 20 tb/d compared with the previous year. The country’s supply is expected to remain unchanged in 2014 at the same level. However, the Argentinian Oil and Gas Institute (IAPG) reported that year-on-year increases will come after more than a decade of decline caused by weak exploration, limited finds and maturing reserves. The country reached a record of 847 tb/d in 1998. Argentina’s state-run YPF is producing approximately 40% of the crude in the country. In relation to shale plays, the Vaca Muerta shale development project is now producing shale oil and gas and should continue ramping up in the near future. For the time being, a YPF/Chevron joint venture project is running 15 active rigs in the area and output is expected to increase from an average of 13 tboe/d in December to a gross of 16 tboe/d in the first half of 2014. Brazil’s liquids supply is estimated to average 2.68 mb/d in 1Q14, indicating an increase of 90 tb/d over the same quarter one year earlier, but 30 tb/d less than 3Q13. Brazilian ethanol production in the key center-south cane-growing region was reported to reach 25,226 million liters in the first 15 days of March. Ethanol production was estimated at 2,173 million liters, up 1.061% over the same period last year. It is said that up to 40 mills will be processing cane by the end of March, allowing much higher than usual production for that month. Output typically drops during January to March, as mills slow or stop production during Brazil’s rainy season. In its business plan, Petrobas added 1 mb/d of capacity in 2013 through nine floating production, storage and offloading (FPSO) platforms and expects to add another 300 tb/d through two platforms to be installed this year. In addition, Petrobras said eight pipe-laying support vessels will be delivered in 2014, adding to the 11 now operating and allowing it to connect wells to platforms faster. In the state company’s 2014–2018 business plan, released late February, it projects oil output in the current year will rise 7.5% more than in 2013 to about 2.075 mb/d. Petrobras has announced the startup of its P-58 floating production, storage and offloading (FPSO) unit at the offshore Parque das Baleias complex. The FPSO is a key piece of production infrastructure that Petrobras is counting on to raise its output by 7.5% this year. Delays in its launch and that of other production units were a major reason behind the company falling short of its output target in 2013. P-58 will handle production from a northern group of fields within the Parque das Baleias complex: Baleia Franca, Cachalote, Jubarte, Baleia Azul and Baleia Ana. It is moored about 85 kilometres off the coast of Espirito Santo state in 1,400 metres of water. The FPSO has the capacity to process 180 tb/d of oil and 6 million cubic metres (about 210 million cubic feet) of natural gas per day. However, Petrobras’s outlook may be overly optimistic, thus Brazil total liquids supply is expected to reach 2.79 mb/d, with growth of 150 tb/d in 2014, a downward revision of 10 tb/d in production but not growth compared with the last MOMR. On a quarterly basis, Brazil’s liquids supply in 2014 is expected to stand at 2.68 mb/d, 2.74 mb/d, 2.84 mb/d and 2.90 mb/d, respectively. Colombia’s oil supply in 2014 is expected to grow by 30 tb/d, registering 1.05 mb/d. On a quarterly basis, Colombia’s liquids output in 2014 is expected to stand at 1.04 mb/d, 1.06 mb/d, 1.02 mb/d and 1.09 mb/d, respectively.
World Oil Supply
OPEC Monthly Oil Market Report – April 2014 55
Middle East The Middle East’s oil supply is estimated to decrease by 0.12 mb/d in 2013 from one year earlier to average 1.35 mb/d, remaining unchanged from the previous MOMR. Preliminary production data shows that the region’s output in 1Q14 registered at 1.33 mb/d, a drop by 20 tb/d over 4Q13. The Middle East’s oil supply forecast is generally associated with a very high level of risk; nevertheless, it is forecast to increase by 20 tb/d to average 1.37 mb/d in 2014 compared with the previous year. On a quarterly basis, the region’s production in 2014 is estimated to average of 1.33 mb/d, 1.38 mb/d, 1.38 mb/d and 1.39 mb/d, respectively. Oman’s supply is expected to increase by 30 tb/d in 2014 to average 0.97 mb/d, unchanged from the previous prediction. Syria’s production is expected to drop by 30 tb/d in 2014 to average 30 tb/d. The downward movement is due to the country’s current political situation, which is associated with a high level of risk. Yemen’s production is expected to average 0.15 mb/d in 2014, showing an increase of 10 tb/d from one year earlier when output resumed at Block 10 in East Shabwa. Nevertheless, due to continued attacks on infrastructure, the supply forecast is at a high risk. Africa Africa’s oil supply is estimated to average 2.42 mb/d in 2013, an increase of 0.11 mb/d from the previous year and unchanged from the previous MOMR. The current year’s supply is expected to grow by 0.10 mb/d to average 2.51 mb/d and remains unchanged from last month’s prediction. On a quarterly basis, Africa’s oil supply in 2014 is expected to average 2.52 mb/d, 2.51 mb/d, 2.51 mb/d and 2.51 mb/d, respectively. According to preliminary production data in 1Q14, oil output from non-OPEC oil producers in Africa increased by 100 tb/d to average 2.52 mb/d compared with 4Q13. The production of Chad, Congo, Equatorial Guinea, Gabon, South Africa and Africa other are estimated at: 0.15 mb/d, 0.27 mb/d, 0.33 mb/d, 0.24 mb/d, 0.19 mb/d and 0.35 mb/d, respectively, whereas Egypt and the Sudans are more or less steady at 0.69 mb/d and 0.31 mb/d, respectively. FSU, other regions Total FSU oil supply is estimated to grow by 150 tb/d in 2013 to average 13.41 mb/d, showing a downward revision of 20 tb/d compared with the last monthly report; all quarters were affected. FSU oil output is expected to increase by 0.2 mb/d to average 13.60 mb/d in 2014, indicating a downward revision of 10 tb/d from the previous month. Updated production data from Russia and Kazakhstan during the first quarter was the main driver behind this month’s revisions. Risk and uncertainty remain high for the FSU’s forecast. On a quarterly basis, total supply in 2014 is expected to stand at 13.48 mb/d, 13.51 mb/d, 13.60 mb/d and 13.81 mb/d, respectively. According to preliminary data, FSU supply averaged 13.48 mb/d in 1Q14, a drop of 80 tb/d over the same period one year earlier.
World Oil Supply
56 OPEC Monthly Oil Market Report – April 2014
On a quarterly basis, FSU’s 2014 supply is estimated to average 13.48 mb/d, 13.51 mb/d, 13.60 mb/d and 13.81 mb/d, respectively. Other Europe’s output is forecast to remain steady from the previous MOMR in 2014, averaging 0.14 mb/d. China’s supply is projected to grow by 40 tb/d to average 4.27 mb/d in 2014. Russia Russia’s oil supply is forecast to increase by 90 tb/d to average 10.59 mb/d in 2014, which is a minor downward revision of 10 tb/ from the previous report, adjusting for updated production data in the first quarter. Russian production remained near record-high levels in March, as did production in the first quarter generally. The outlook for Russian supply remains steady, with strong output during the year as expected new volumes from green fields are likely to offset natural decline in mature producing areas. This is happening thanks to Russian oil companies. For example, in 2013, Bashneft’s crude output rose 4.1% y-o-y to 321 tb/d, mainly thanks to production at Russia’s republic of Bashkortostan, the company’s key production area, and the start of pilot production at Trebs and Titov. In addition, the healthy performance of Russia’s oil operators in the previous year is supporting brown field investment and moderating natural declines. According to preliminary data, Russian supply averaged 10.58 mb/d in 1Q14, with a monthly distribution of 10.64 mb/d, 10.57 mb/d and 10.55 mb/d, respectively. Y-o-y quarterly growth is seen to slow in the coming quarter with a lower volume of additions from new fields. The risk to Russia’s supply forecast remains high on technical, political and natural decline grounds. In 2014, on a quarterly basis, Russian supply is seen to average 10.58 mb/d, 10.54 mb/d, 10.56 mb/d and 10.69 mb/d, respectively. Graph 5.8: Russia’s quarterly production Graph 5.9: Russia’s quarterly production,
annual comparison
10.1
10.2
10.3
10.4
10.5
10.6
10.7
10.8
1Q11
2Q11
3Q11
4Q11
1Q12
2Q12
3Q12
4Q12
1Q13
2Q13
3Q13
4Q13
1Q14
2Q14
3Q14
4Q14
mb/d
10.1
10.2
10.3
10.4
10.5
10.6
10.7
10.8
1Q 2Q 3Q 4Q
mb/d
2011 20122013 2014
World Oil Supply
OPEC Monthly Oil Market Report – April 2014 57
Caspian Kazakhstan’s oil supply increased by 60 tb/d over one year ago to average 1.64 mb/d in 2013. It is expected that total output will increase by 80 tb/d in 2014 to average 1.72 mb/d, unchanged from last month’s prediction. Kazakhstan’s Ministry of Environmental Protection is seeking $737 million in damages from the seven-member North Caspian Operating Co. (NCOC) for excessive flaring of sour gas. The final results of tests and inspections in the wake of pipeline leaks at the Kashagan mega-project will not now be available until the second quarter. The giant Kashagan project has sucked in almost $50 billion without yielding/b of oil. On a quarterly basis, supply in 2014 is forecast to average 1.65 mb/d, 1.68 mb/d, and 1.73 mb/d and 1.81 mb/d, respectively. Azerbaijan’s oil output is expected to continue to average 0.87 mb/d in 2014, with projections unchanged from the previous MOMR. It is estimated that oil production in 1Q14 was steady at 0.83 mb/d. On a quarterly basis, supply in 2014 is forecast to average 0.83 mb/d, 0.86 mb/d, 0.88 mb/d and 0.89 mb/d, respectively. China China’s oil production is seen to increase by 40 tb/d in 2014 to average 4.27 mb/d; the number is unchanged from the previous month. Estimated Chinese oil output in 2013 registered at 4.24 mb/d, a growth of 90 tb/d. However, China’s liquids supply declined by 10 tb/d in 1Q14. Preliminary data showed production on a monthly basis: January, February and March registered at 4.28 mb/d, 4.29 mb/d and 4.31 mb/d, respectively. The decline came mainly from offshore oil production. On a quarterly basis, China’s supply in 2014 is seen to average 4.29 mb/d, 4.24 mb/d, 4.26 mb/d and 4.31 mb/d, respectively. OPEC NGLs and non-conventional oils OPEC NGLs and non-conventional oils are estimated to have averaged 5.80 mb/d in 2013, representing growth of 0.24 mb/d over the previous year. In 2014, they are forecast to increase by a further 0.15 mb/d to average 5.95 mb/d. There are no changes in the 2013 estimation and 2014 forecast for OPEC NGLs compared with the last MOMR. Table 5.3: OPEC NGLs + non-conventional oils, 2011-14
OPEC crude oil production Total OPEC crude oil production averaged 29.61 mb/d in March, according to secondary sources, a decrease of 626 tb/d from last month. Crude oil output decreased from Iraq, Angola, Libya and Saudi Arabia. OPEC crude oil production — not including Iraq — averaged 26.42 mb/d in March, a drop of 338 tb/d compared with the previous month. Table 5.4: OPEC crude oil production based on secondary sources, tb/d
Table 5.5: OPEC crude oil production based on direct communication, tb/d
World oil supply Preliminary data indicates the global oil supply decreased by 712 tb/d to average 90.63 mb/d in March 2014 compared with the previous month. The share of OPEC crude oil in total global production decreased slightly to 32.7% in March. Estimates are based on preliminary data for non-OPEC supply and OPEC NGLs while estimates for OPEC crude production come from secondary sources.
Totals may not add up due to independent rounding... Not availab le.
World Oil Supply
OPEC Monthly Oil Market Report – April 2014 59
Graph 5.10: OPEC and world oil supply
87
88
89
90
91
92
27
28
29
30
31
32A
pr 1
2
May
12
Jun
12
Jul 1
2
Aug
12
Sep
12
Oct
12
Nov
12
Dec
12
Jan
13
Feb
13
Mar
13
Apr
13
May
13
Jun
13
Jul 1
3
Aug
13
Sep
13
Oct
13
Nov
13
Dec
13
Jan
14
Feb
14
Mar
14
mb/dmb/d
OPEC crude production (LHS) World supply (RHS)
Product Markets and Refinery Operations
60 OPEC Monthly Oil Market Report – April 2014
Product Markets and Refinery Operations Product markets in the Atlantic Basin weakened after diminishing winter support for heating fuels in the US since mid-March, causing a decline in US refining margins over the month due to losses across the barrel. Product markets in Europe lost part of the vibrant recovery seen last month due to declines at the middle of the barrel on the lack of export opportunities, while domestic demand for products remained lacklustre. The Asian market weakened during March due to a negative performance at the middle and bottom of the barrel, which outweighed the continued recovery seen in light distillates. Graph 6.1: Refinery margins, 2013-14
US product markets continued to weaken in March with rising temperatures reducing demand for heating fuels in the US East Coast (USEC) market, weighing on diesel and fuel oil crack spreads. Even though domestic gasoline demand continued to recover from the lower level seen in January when demand was affected by bad weather, lower exports to Latin America amid increasing production kept the crack spread under pressure with players selling winter stocks as a result of the switch to summer quality. The refinery margin for WTI crude on the US Gulf Coast (USGC) fell $5 to average $7/b in March. Meanwhile, the margin for Light Louisiana Sweet (LLS) crude on the USGC fell to average $10/b during March, exhibiting lower losses due to the drop in the LLS price. European refining margins lost part of the vibrant recovery seen last month due to declines at the middle of the barrel after support from export opportunities opened up by the severe winter in the US diminished, while domestic demand for products in Europe remained lacklustre. The gasoline market received some support from higher buying interest from West Africa and an open arbitrage to the Middle East, however, the gain was limited by lack of support from domestic demand.
-5
0
5
10
15
20
25
30
-5
0
5
10
15
20
25
30
Mar
13
Apr 1
3
May
13
Jun
13
Jul 1
3
Aug
13
Sep
13
Oct
13
Nov
13
Dec
13
Jan
14
Feb
14
Mar
14
US$/bUS$/b
WTI (US Gulf) Arab Heavy (US Gulf) Brent (Rotterdam)Dubai (Singapore) LLS (US Gulf)
Product Markets and Refinery Operations
OPEC Monthly Oil Market Report – April 2014 61
The refinery margin for Brent crude in Northwest Europe showed a loss of 70¢ to average $1.7/b in March. The Asian market witnessed a marginal decline over the reporting period, predominantly attributed to falling middle distillate and fuel oil cracks. However, the downtick was limited by an improvement in the light distillate crack spreads. Refinery margins in Singapore lost 90¢ in March to average $2.0/b. Refinery operations Refinery utilization rates continued falling in the US to average 85.9% in March, decreasing 1.4 percentage points (pp) versus the previous month. This is the lowest level seen since last year. With several refineries conducting scheduled maintenance, mainly in PADD 3, nearly 1 mb/d of refining capacity went offline during this month. Graph 6.2: Refinery utilisation rates, 2013-14
European refinery margins fell in March, losing part of the recovery seen during February due to losses at the middle of the barrel, which had been supported by the severe winter in the US in the previous month. European refinery runs averaged around 78% as low runs continued due to the lack of export opportunities, lower domestic demand and the ongoing spring maintenance season taking around 1.1 mb/d of refining capacity offline in Europe. In Asia, scheduled maintenance will moderate refinery runs in several countries. Chinese refinery levels dropped to 9.6 mb/d in February as product inventories were on the rise after hitting 10.5 mb/d during January, when refinery throughput peaked due to the startup of two new refineries with added capacity of over 440 tb/d. Refinery runs in Singapore for February averaged around 98%, similar to the previous month. Japanese throughputs averaged 82.8% of capacity in March, 1.5 pp lower than in February. Starting in April, some refineries are expected to be shut down in Japan as part of the national regulations in the refinery sector, affecting almost 450 tb/d of capacity, which will impact export levels.
60
70
80
90
100
60
70
80
90
100
Mar
13
Apr
13
May
13
Jun
13
Jul 1
3
Aug
13
Sep
13
Oct
13
Nov
13
Dec
13
Jan
14
Feb
14
Mar
14
%%
US EU-16 Japan Singapore
Product Markets and Refinery Operations
62 OPEC Monthly Oil Market Report – April 2014
US market US gasoline demand stood at around 8.8 mb/d in March, around 470 tb/d higher than the previous month and up by 180 tb/d from the same month a year earlier. Despite the recovery in domestic demand, gasoline cracks trended lower due to pressure from the supply side due to higher production as refineries shifted to producing gasoline, rather than distillates, ahead of the driving season and increasing imports to the region. The USGC gasoline prices dropped, thus widening the arbitrage to the USEC, but the staggered shift to summer-specification product limited the opportunities, while companies sold off winter-grade product, adding pressure to the supply overhang. On the other hand, easing Latin American gasoline demand weighed on USGC prices, with Mexican demand slowing this spring. The gasoline crack spread fell $2 to average $26/b in March. Graph 6.3: US Gulf crack spread vs. WTI, 2013-14
Middle distillate demand stood at around 3.8 mb/d in March, some 170 tb/d higher than the previous month and 10 tb/d above the same month a year earlier. In the middle of the barrel, US gasoil continued losing ground over March with USEC heating oil demand falling as temperatures in the region climbed, thus reducing the support seen by the severe winter conditions in the previous months. Losses were capped due to USGC exports rebounding and halted increases in inventories during March. Distillate yields remained relatively low, staying under 30%, as refineries turned to gasoline. The lower distillate prices encouraged exports, and more than 30 diesel cargoes were scheduled to load in the USGC with the main destinations being Latin America (Argentina, Brazil, Colombia, the Dominican Republic, Ecuador and Mexico), Europe and West Africa. The USGC gasoil crack dropped $1 to average around $19/b in March.
At the bottom of the barrel, the fuel oil crack showed a mixed performance with the market continuing to tighten due to a lack of low-sulphur fuel oil supplies on the USEC with imports from Europe decreasing. However, increasing temperatures reduced demand from power utilities, in line with seasonality, and despite the need to replenish natural gas stocks, lending some support to the USEC fuel oil market, low-sulphur fuel oil cracks fell, weighed down mainly by a seasonal drop in heating fuel demand. The fuel oil crack in the USGC exhibited a loss of $1 to average 60¢/b during March. European market Product markets in Europe lost part of the vibrant recovery seen last month due to declines at the middle of the barrel after fading support from export opportunities opened by the severe winter in the US, while domestic demand for products in Europe remained lacklustre. Gasoline cracks continued to recover on the switch to summer quality with higher buying interest from West Africa and an open arbitrage to the Middle East lending support. The potential gain was limited by lack of support from domestic demand with production outpacing demand despite refinery turnarounds and run cuts reducing supplies in Northwest Europe. The gasoline crack spread against Brent crude rose $2 versus the previous month to stand at an average of $13/b in March. The crack of fellow light distillate naphtha reversed the downtick seen last month on the back of support stemming from gasoline blending, although demand from the petrochemical industry continues to be weak, particularly with alternative feedstock LPG remaining at a discount to naphtha. The outlook is, however, more skewed towards the downside as cracker maintenance in Asia is expected to limit import demand from Europe over the coming month. Graph 6.4: Rotterdam crack spreads vs. Brent, 2013-14
Middle distillate cracks lost the ground they recovered last month due to weaker domestic demand amid a lack of export opportunities.
The middle of the barrel crack spread witnessed declines due to the already weak demand hit by above-average temperatures seen in most European countries and reduced opportunities to send cargoes to the US. Losses were capped by support from the supply side as US diesel exports into Europe remained on the lower side amid reduced diesel inflows from Primorsk. The gasoil crack spread against Brent crude at Rotterdam in February lost 90¢ versus the previous month’s level to average $13.5/b. At the bottom of the barrel, fuel oil cracks continued to climb over the reporting month, and the LSFO crack reached the highest level in at least one year on the back of firm demand, with buying interest remaining robust from utilities in Turkey, Greece, Cyprus and Jordan, amid export opportunities to the Asia Pacific region. Support came from a tight supply environment of low-sulphur fuel oil because of refinery maintenance and less production due to lighter throughputs to the refineries with the narrowed sour-sweet price differential, which also caused the low-sulphur fuel oil premium to high-sulphur barges to fall. The Northwest European fuel oil crack against Brent gained more than $3 versus the previous month’s level to average minus $8/b in March. Asian market The Asian market weakened during March due to a negative performance at the middle and bottom of the barrels, which outweighed the continued recovery seen in light distillates. The Singapore gasoline crack continued to strengthen as demand developments outweighed pressure stemming from the supply side and elevated stocks in Singapore and Japan. On the demand side, support stemmed from buying interest seen from Vietnam (ahead of planned maintenance at the Dung Quart refinery), and from Africa (Tanzania). However, the support was partially offset by expectations of lower requirements from the main importers in the coming weeks. The supply side started to exert some pressure as China reported a large uptick with refineries trying to move their yields away from weak middle distillates. In Japan, exports have also been on the rise. Meanwhile, Singapore’s onshore light distillate stocks were seen at high levels. The gasoline crack spread against Dubai crude in Singapore gained 60¢ to average $12.2/b in March. The Singapore naphtha crack inched slightly higher during March as some support came from Taiwan and South Korea. The uptick was limited by steady naphtha exports from India, which helped to compensate for lower imports from Europe. On the arbitrage scene, European inflows to Asia for April are expected to be relatively low, which has added support to the Asian market in recent weeks. However, this could
Product Markets and Refinery Operations
OPEC Monthly Oil Market Report – April 2014 65
be offset by heavy maintenance at petrochemical steam crackers in Northeast Asia, mainly in Japan. Graph 6.5: Singapore crack spread vs. Dubai, 2013-14
At the middle of the barrel, despite some positive demand developments, the gasoil crack trended down slightly over the month due to pressuring under plentiful supplies in the region. The supply side has been exerting pressure with increasing exports not only from Indian export-oriented refiners, Essar and Reliance, but also from South Korea and Japan. The demand side lent some support with solid buying activity in the region, particularly with demand firming in Vietnam, Indonesia and Thailand. In addition, elevated volumes were directed to East Africa and the Middle East. However, this support was not enough to avoid losses in the margins. Meanwhile, China’s latest data revealed a demand downtick, reflecting the slowing momentum in Chinese economic activity, while production rose by 520 tb/d m-o-m to some 3.7 mb/d during February. The gasoil crack spread in Singapore against Dubai showed a loss of $1 to average around $18.1/b in March. Looking ahead, the crack is likely to remain steady and may even have the potential to increase over the coming months during spring’s peak maintenance at several refineries in Asia. The fuel oil crack continued to weaken in Singapore as higher volumes were coming in from the West. However, the downward trend was limited by some support lent by the demand side. Asian demand for power generation was relatively steady. Higher requirements were seen in South Korea, where a nuclear reactor was temporarily shut down due to a technical glitch, and in Vietnam as the country is trying to cover for shortfalls during upcoming maintenance. In addition, higher requirements from Bangladesh increased fuel oil imports due to higher power generation requirements ahead of summer. The fuel oil crack spread in Singapore against Dubai lost 40¢ to average minus $11.4/b in March.
Tanker Market Dirty tanker freight rates continued to decline, with the drop in dirty spot freight rates mainly affecting the VLCC class in March, while Suezmax and Aframax closed the month flat. VLCC spot freight rates on all reported routes were down in March from a month earlier, with the greatest drop registered on destinations from the Middle East to the West, as a result of lower trade due to refinery maintenance in the East. However, clean tanker spot freight rates showed improved sentiment on all reported routes without exception, mainly on the back of balanced tonnage supply and improved demand. On average, clean tanker spot freight rates were up by 9% from the previous month. Spot fixtures According to preliminary data, OPEC spot fixtures dropped by 0.37 mb/d in March over the previous month to average 12.6 mb/d. This drop was driven mainly by lower fixtures seen for East-bound destinations. Fixtures on the Middle East-to-East and the Middle East-to-West routes dropped by 0.27 mb/d and 0.01 mb/d in March, respectively. OPEC fixtures were up by 10% compared with the same month last year. Overall, all global chartering activity was reported to be 1.6% lower in March. Table 7.1: Tanker chartering, sailings and arrivals, mb/d
Sailings and arrivals OPEC sailings, as per preliminary data, reported a drop of 3.4% in March from a month ago to average 23.29 mb/d, however, compared with the same month a year ago, they were higher in March by 1.6%. Arrivals in North America, the Far East and West Asia all showed increases in March by 9.3%, 0.3% and 2.8%, respectively, while arrivals in Europe declined by 2.3% from the previous month to average 11.92 mb/d in March.
SailingsOPEC 23.79 24.10 23.29 -0.81Middle East 17.44 17.64 17.20 -0.44
ArrivalsNorth America 10.73 9.50 10.38 0.88Europe 11.92 12.20 11.92 -0.28Far East 8.17 8.83 8.86 0.02West Asia 4.50 4.24 4.36 0.12
Source: Oil Movements and Lloyd's Marine Intelligence Unit.
Tanker Market
68 OPEC Monthly Oil Market Report – April 2014
Spot freight rates VLCC The Middle East VLCC market saw lower demand for VLCCs at the beginning of March due to less activity in the region, leading to a decline in freight rates. Light demand led to a tonnage buildup which cast a shadow on VLCC spot freight rates during the whole month of March. Abundant vessel supply gave charterers an upper hand during the month, as inquiries were limited in the market versus the long tonnage availability list. The total number of March fixtures was low, even when compared with a short month like February. On average, VLCC freight rates dropped by 21% in March from the previous month to average 31 world scale (WS) points. The greatest decline in VLCC freight rates was exhibited for tankers trading on the Middle East-to-East route, where the drop was 23% over the previous month to average WS43 points, the lowest since the beginning of 2014. Tanker freight rates operating on the West Africa-to-East route dropped similarly. As seen in the Middle East, VLCC freight rates on this route went down by 21% from last month to average WS44 points. The tanker supply for transatlantic fixtures remained more than sufficient, putting pressure on freight rates. VLCC freight rates in West Africa followed rates in the Middle East market, with both routes negatively affected by lower trade to the east ahead of refinery maintenance season. VLCC freight rates for West-bound destinations were not excluded from the general downward trend seen in the market. Under the influence of the same elements, VLCC freight rates for tanker operations on the Middle East-to-West route suffered from a surplus in vessel supply, which consequentially led to coverage of all requirements at softer rates. Freight rates for VLCCs on the Middle East-to-West route reported a decline of 11% from the previous month to average WS31 points in March. Graph 7.1: Monthly averages of crude oil spot freight rates
20406080100120140160180
20406080
100120140160180
Mar
13
Apr 1
3
May
13
Jun
13
Jul 1
3
Aug
13
Sep
13
Oct
13
Nov
13
Dec
13
Jan
14
Feb
14
Mar
14
WorldscaleWorldscale
Mediterranean/Northwest Europe (Aframax) West Africa/USGC (Suezmax)Middle East/East (VLCC)
Suezmax The Suezmax market was relatively balanced in March, after experiencing a significant drop in freight rates over the past couple of months. Suezmax freight rates managed to hold at the same levels seen the previous month, despite slow activity and a lack of interest from charterers. The occasional firm trend seen irregularly during March was not enough to create a wave in Suezmax rates, as deals were mostly reported at the last-done level. However, freight rates for Suezmax in West Africa did encounter some gains for April fixtures as the result of a busy market on certain dates. Tighter availability was seen in the Black Sea and the Mediterranean as well towards the end of the month, leading to improved freight rates. Yet, on average, Suezmax freight rates ended the month flat compared with last month, standing at WS58 points in March. Freight rates on the West Africa-to-US route averaged WS60 points, while averaging WS56 points for tankers trading on the Northwest Europe-to-US East Coast (USEC) route. On an annual comparison, Suezmax average freight rates in March were higher than those seen in the same month a year earlier, by 12%. Aframax Aframax freight rates saw a mixed pattern in March. In general, Aframax activity was volatile in March, with regional variations. Activity in the North Sea and the Baltics slowed at the beginning of the month; tonnage availability increased at the same time that ice restrictions in the ports of Primorsk and Ust Luga were lifted. Aframax freight rates in the Caribbean were under pressure due to weak market activity and a limited number of inquiries. In addition, fewer fog-related delays increased the surplus of tonnage in the region. Freight rates for Aframax tankers operating on the Caribbean-to-USEC declined by 14% from the previous month to average WS100 points. In the Mediterranean, tonnage supply was thinner at the beginning of the month, which — in combination with a fair amount of activity — supported moderate freight rate increases. Freight rates in the Mediterranean were also supported by operational delays and geo-political tension. Freight rates on the Mediterranean-to-Mediterranean and Mediterranean-to-Northwest Europe routes increased from one month ago by 11% and 19% to average WS94 and WS89 points, respectively.
Source: Galbraith’s tanker market report and Platts.
Tanker Market
70 OPEC Monthly Oil Market Report – April 2014
Clean spot freight rates In March, clean tanker spot freight rates increased on all reported routes. West of Suez clean spot freight rates showed the highest increase, rising 10% from the previous month. On the whole, the clean tanker market was mostly balanced in March as the amount of activity matched available tonnage, despite occasional availability seen on long range 2 vessels. In East of Suez, clean tanker spot freight rates on the Middle East-to-East route experienced an increase in March compared with the previous month as a result of tonnage demand for jet fuel trade. On average, freight rates registered for the Middle East-to-East and Singapore-to-East routes rose by 7% and 8%, respectively, from February, mainly on the back of stable tonnage demand for deliveries to Japan. Clean tanker spot freight rates experienced gains on several other routes as well. Market activity on the Mediterranean-to-Mediterranean and the Mediterranean-to-Northwest Europe routes supported tonnage demand and was the main driver behind the increase in clean spot freight rates in March; rates increased by 12% for each route compared with a month earlier. The Mediterranean market showed date sensitivity in March for medium range and long range 1 (LR1) vessels. Clean spot freight rates increased by 5% on the Northwest Europe-to-USEC and US Gulf Coast routes to average WS132 points. Graph 7.2: Monthly average of clean spot freight rates
Source: Galbraith’s tanker market report and Platts.
Oil Trade
OPEC Monthly Oil Market Report – April 2014 71
Oil Trade Preliminary data for March shows that US crude oil imports dropped by 108 tb/d from the previous month to average 7.26 mb/d. US product imports increased by 72 tb/d to average 1.8 mb/d m-o-m. Japan’s crude oil imports declined in February by 48 tb/d or 1% to average 3.95 mb/d. On an annual basis, crude imports increased in February by 390 tb/d or 11%. Meanwhile, Japan’s product imports dropped in February by 17 tb/d to average 703 tb/d, reflecting a decline of 2% m-o-m and 10.5% y-o-y. China’s crude oil imports declined in February after reaching record-high levels the previous month. China’s crude imports were down by 622 tb/d or 9% from one month ago to average 6 mb/d in February. India’s crude imports reached a record-high level in February to average 4.3 mb/d, which is 638 tb/d or 18% higher than a month earlier. US Preliminary data for March shows that US crude oil imports dropped by 108 tb/d from the previous month to average 7.26 mb/d on an annual basis, reflecting a loss of 193 tb/d or 3% from one year earlier. US product imports increased by 72 tb/d to average 1.8 mb/d m-o-m, while on a y-o-y basis they dropped by 192 tb/d or 10%. Product imports in March were the highest since November 2013. On a year-to-date comparison, crude imports dropped by 152 tb/d, while product imports declined by 278 tb/d. US product exports in March were stable from the previous month, averaging 3.7 mb/d. When compared annually, figures reflect an increase of 687 tb/d or approximately 23%. Thus, US total net imports dropped in March to average 5.3 mb/d, around 1% lower than the previous month and 16% below the previous year’s level. Graph 8.1: US imports of crude and petroleum products
In January, Canada remained the country’s top supplier, accounting for 37% of total US crude imports, up 3% or 90 tb/d from the previous month. Canada has held the top supplier position since March 2006. Saudi Arabia was the second-largest supplier to the US, with a 19% share of total crude imports, while Mexico came in third, with a share of 13%. Mexico slightly increased its exports to the US from the previous month — by 3 tb/d — while Saudi Arabia’s crude exports to the US dropped by 57 tb/d from a month ago.
*Others: Contains natural gas liquids, liquefied refinery gases (LRG's), other liquids and all finished petroleum productsexcept gasoline, jet fuel/kerosene, fuel oil and propane/propylene.
Oil Trade
72 OPEC Monthly Oil Market Report – April 2014
Graph 8.2: US exports of crude and petroleum products
In January, crude imports from OPEC Member Countries were lower than the previous month by 194 tb/d, or 6%, and accounted for 42% of total US crude imports. At the same time, US product imports from OPEC Member Countries dropped from one month earlier to stand at 151 tb/d, representing a share of 9% of total product imports in an annual comparison. Product imports from OPEC Member Countries in January were at 108 tb/d, less than in the same month a year earlier. Canada and Russia maintained their positions as first and second product suppliers to the US with shares of 35% and 12%, respectively. However, while Canada increased its volumes by 4%, imports from Russia dropped by 14% from a month earlier. The United Kingdom came in as third product supplier to the US, though its product exports were lower than in the previous month by 22 tb/d or 15%. Table 8.1: US crude and product net imports, tb/d
Japan Japan’s crude oil imports declined in February by 48 tb/d or 1% to average 3.95 mb/d. On an annual basis, crude imports increased in February by 390 tb/d or 11%. Saudi Arabia came in as first crude supplier to Japan — as it had the previous month — holding a share of 31% of total crude exports to the country, a volume increase from the previous month of 88 tb/d or 8%. The UAE was the second-largest supplier to Japan, with a share of 23% of total crude imports, and Qatar held third position with a share of 13%. While UAE crude exports to Japan increased by 94 tb/d or 11% from last month, Qatar saw a decline in its monthly exports by 37 tb/d or 7%. Similarly, Japan’s product imports dropped in February by 17 tb/d to average 703 tb/d, reflecting a decline of 2% m-o-m and 10.5% y-o-y. The drop in Japan’s product imports came mainly as a result of lower imports of naphtha, which fell by 13% from the previous month, while imports of gasoline and gasoil were higher.
*Others: Contains natural gas liquids, liquefied refinery gases (LRG's), other liquids and all finished petroleum productsexcept gasoline, jet fuel/kerosene, fuel oil and propane/propylene.
Graph 8.3: Japan’s imports of crude and petroleum products
Japanese product exports increased in February by 81 tb/d or 17% to average 548 tb/d, the highest since September 2013. Annually, a gain was seen of 244 tb/d or 80%. Graph 8.4: Japan’s exports of petroleum products
Accordingly, Japan’s net imports declined in February by 147 tb/d to average 4.1 mb/d, reflecting a monthly drop of 3.5% but an annual gain of 2%. Table 8.2: Japan’s crude and product net imports, tb/d
China China’s crude oil imports declined in February by 622 tb/d or 9% from the previous month, when they reached a peak high. The country’s crude imports averaged 6 mb/d in February, and refinery throughputs were lower, too. In an annual comparison, China’s crude imports saw a similar drop, declining by 593 tb/d or 11%. On a year-to-date analysis, figures reflect a decline of 652 tb/d or 11%. Saudi Arabia, Angola and Russia were the top crude suppliers to China in February, holding shares of 19%, 16% and 12%, respectively. However, volumes imported from Saudi Arabia were lower than in the previous month by 78 tb/d, while volumes imported from Angola and Russia were up from a month earlier by 62 tb/d and 184 tb/d, respectively. All top suppliers showed increased volumes in their exports to China in February from a year ago, in the range of 8%–40%. However, Chinese product imports declined in February by 414 tb/d from the previous month and 236 tb/d from one year earlier to average 841 tb/d, the lowest level since August 2012. Graph 8.5: China’s imports of crude and petroleum products
China’s crude exports increased in February by 27 tb/d to average 46 tb/d — the highest amount since August 2013 — while Chinese product exports were almost stable from last month, averaging 623 tb/d. As a result, China’s net oil imports saw a drop of 1,060 tb/d or 15% from the previous month, while they increased 374 tb/d or 6% y-o-y.
01,0002,0003,0004,0005,0006,0007,000
0200400600800
1,0001,2001,4001,600
Feb
13
Mar
13
Apr 1
3
May
13
Jun
13
Jul 1
3
Aug
13
Sep
13
Oct
13
Nov
13
Dec
13
Jan
14
Feb
14
tb/dtb/d
Others LPG Naphtha Gasoline Jet Fuel
Diesel Fuel Oil Asphalt Crude (RHS)
Oil Trade
OPEC Monthly Oil Market Report – April 2014 75
Graph 8.6: China’s exports of crude and petroleum products
Table 8.3: China’s crude and product net imports, tb/d
India In February, Indian crude imports reached a record high to average 4.3 mb/d, which is 638 tb/d or 18% higher than levels seen one month ago. During the same month, Indian refinery runs increased by approximately 300 tb/d. On an annual basis, India’s crude imports increase equals 798 tb/d or 23%. At the same time, product imports saw an increase by 21 tb/d or 5% from one month ago to average 459 tb/d, the highest amount since December 2012. Y-o-y, this reflects a gain of 148 tb/d or 48%. The monthly increase in product imports came mainly as a result of an increase in imports of fuel oil and naphtha, which rose by 50% and 10%, respectively. Graph 8.7: India’s imports of crude and petroleum products
India’s product exports increased in February by 226 tb/d or 19% from the previous month to average 1.4 mb/d, with a volume increase of 169 tb/d or 13% from a year earlier. Monthly exports of diesel, fuel oil, petrol and naphtha increased by 12%, 98%,11% and 8%, respectively, from the previous month. Consequentially, India’s net imports increased by 433 tb/d to average 3.32 mb/d, 15% higher than levels seen in January and 30% more than in February 2013. Graph 8.8: India’s exports of petroleum products
Table 8.4: India’s crude and product net imports, tb/d
FSU In February, total crude oil exports from the former Soviet Union (FSU) increased by 93 tb/d or 1.5% to average 6.3 mb/d. Crude exports through Russian pipelines increased by 79 tb/d or 2% to average 4 mb/d. Shipments from the Druzhba pipeline to Central and Eastern Europe increased by 23 tb/d or 2.3% to average 1,044 tb/d. Black Sea exports increased by 40 tb/d or 6% to average 661 tb/d, while exports from the Baltics increased by 42 tb/d or 3% to average 1,355 tb/d in February. Loadings of CPC Blend rose 163 tb/d or 22% from January to average 905 tb/d. FSU total product exports rose by 285 tb/d or 9% from the previous month to average 3.5 mb/d. This increase in product exports was mainly supported by increased volumes of gasoil and naphtha, which rose by 146 tb/d and 118 tb/d, respectively. On the other hand, gasoline exports declined in February by 62 tb/d or 33% from the previous month.
* PreliminaryTotals may not add due to independent rounding.
Sources: Nefte Transport, Global Markets, Argus Fundamentals, Argus FSU and OPEC.
Stock Movements
78 OPEC Monthly Oil Market Report – April 2014
Stock Movements OECD commercial stocks fell in February, driven by a decline in products as crude rose. At 2,554 mb, stocks stood at 131 mb below the five-year average, divided between crude (35 mb) and products (96 mb). In terms of days of forward cover, OECD commercial stocks rose by 0.2 days in February to stand at 56.5 days. This is around two days lower than the five-year average. Preliminary data for March shows that US commercial oil stocks rose by 2.1 mb, with crude rising by 16.3 mb, while products dropped by 14.2 mb. At 1,037 mb, US commercial inventories stood at 36 mb below the latest five-year average. Chinese total oil commercial inventories rose strongly by nearly 33.0 mb in February, driven by a build of crude and products, which increased by 10.2 mb and 22.5 mb, respectively. OECD Preliminary data for February shows that total OECD commercial oil stocks declined further by 16.3 mb for the fifth consecutive month to stand at 2,554 mb. At this level, inventories were around 111 mb below the same period the previous year and showed a deficit of 131 mb compared with the five-year average. Within the components, better-than-expected demand in OECD countries and higher US product exports, along with a lower refinery utilization rate, led to a drop in product stocks by around 18.4 mb, while crude oil commercial stocks rose slightly by 2.1 mb, driven by lower crude demand during the period of refinery maintenance. At 1,233 mb, OECD crude commercial inventories stood 34 mb below the seasonal norm and 40 mb less than the same period a year ago. Product stocks stood at 1,322 mb, indicating a deficit of 96 mb below the five-year average and representing a drop of around 70 mb over a year earlier. Graph 9.1: OECD’s commercial oil stocks
In terms of days of forward cover, OECD commercial stocks rose in February by 0.2 days to stand at 56.5 days. This is around two days lower than both the latest five-year average and the same month a year earlier. OECD Americas were 2.2 days below the historical average at 53.6 days in February and OECD Europe stood at 1.7 days below the seasonal average to finish the month at 67.1 days. Meanwhile, OECD Asia-Pacific indicated a deficit of 2.4 days, averaging 47.2 days.
2,500
2,550
2,600
2,650
2,700
2,750
2,800
2,850
2,500
2,550
2,600
2,650
2,700
2,750
2,800
2,850
Jan Feb Mar Apr May Jun Jul Aug Sep Oct Nov Dec
mbmb
2013 2014 Average 2009-13
Max/Min2009-13
Stock Movements
OPEC Monthly Oil Market Report – April 2014 79
Table 9.1: OECD’s commercial stocks, mb
In February, commercial stocks in OECD Americas fell by 10.0 mb for the fifth consecutive month to stand at 1,278 mb. With this drop, inventories were 40 mb below the seasonal norm, and stood 67 mb below a year ago at the same time. Within the components, the total stock draw is attributed to products, as crude remained almost unchanged from the previous month. At the end of February, crude commercial oil stocks in OECD Americas remained almost unchanged versus the previous month, following a build of 3.7 mb in January. At 649 mb, OECD Americas’ crude oil commercial stocks finished the month at 7.5 mb above the latest five-year average, but 25 mb less than a year ago at the same time. OECD Americas’ product stocks fell in February, declining by 10.1 mb following a strong stock draw of 30.3 mb in January. At 629 mb, this represents a deficit of 48 mb below the seasonal norm, and 42 mb below the same time a year ago. The bulk of the drop came from gasoline, which fell by 7 mb, while distillate stocks experienced a drop of only 2.0 mb. Cold winter weather and higher exports in the US left the distillate market tight, as highlighted by the deficit of 33.0 mb below the latest five-year average, while gasoline stocks remained in line with the seasonal norm. In February, OECD Europe’s commercial stocks rose by 1.5 mb for the second consecutive month to stand at 898 mb. At this level, OECD Europe’s commercial stocks stood at 72 mb below the seasonal norm and 28 mb less than a year ago at the same time. Within the components, crude stocks went up by 2.4 mb, while product stocks abated the build, declining by 0.9 mb. OECD Europe’s crude oil stocks in February stood at 369 mb, indicating a deficit of 26.1 mb below the seasonal norm; they stood 7.5 mb below the same time a year ago. The build in crude oil inventories came mainly from higher supply, especially from the North Sea. In contrast, OECD Europe’s commercial product stocks fell slightly by 0.9 mb in February, reversing the build of last two months. At 529 mb, OECD Europe’s commercial product inventories showed a deficit of 46 mb below the seasonal norm and stood 20 mb lower than a year ago at the same time. Higher refinery output has limited a further decline in OECD Europe’s commercial product stocks. Commercial inventories in OECD Asia-Pacific fell by 7.8 mb in February, reversing the previous month’s build to stand at 378 mb. At this level, they were 18 mb below the same period a year ago and 16 mb lower than the latest five-year average. Within the components, both crude and product inventories fell by 0.4 mb and 7.4 mb, respectively. Crude inventories ended the month of February at 215 mb and stood at 16 mb below a year ago and 7 mb lower than the seasonal norm. OECD Asia-Pacific’s total product inventories indicated a deficit of 8.9 mb compared with a year ago and showed a deficit of 2.7 mb over the seasonal norm.
EU plus Norway Preliminary data for February shows that European stocks rose by 1.5 mb, for the second consecutive month to stand at 1,076.0 mb. Despite this build, European stocks stood at 9.8 mb or 0.9% lower than the same time a year ago, and are 44.5 mb or 4.0% below the latest five-year average. The total stock build came from crude as it increased by 2.4 mb, while products abated the build, declining by 0.9 mb. European crude inventories rose in February, reversing the fall of last two months to stand at 463.8 mb. Crude inventories were 8.6 mb or 1.9% above the same period last year, but are still 3.5 mb or 0.7% below the latest five-year average. The build in crude oil inventories came mainly from higher supply, especially from the North Sea. An increase in refinery crude runs limited a further build in crude stocks. Indeed, crude runs were 270 tb/d higher in February compared with January, averaging around 10.0 mb/d. Graph 9.2: EU-15 plus Norway’s total oil stocks
In contrast, OECD Europe’s product stocks fell by 0.9 mb in February following a build of 20.0 mb in January. At 612.2 mb, European stocks were 18.4 mb or 2.9% below the same level a year ago and 41.0 mb or 6.3% below the seasonal norm. Within products, the picture is mixed; residual fuel oil stocks dropped, while gasoline and distillate stocks saw builds. Naphtha stocks remained unchanged from the previous month. Gasoline stocks rose by 0.7 mb for the third consecutive month, ending February at 113.3 mb. At this level, gasoline stocks showed a deficit of 5.2 mb or 4.4% below a year ago and 6.6 mb or 5.5% less than the seasonal norm. The build in gasoline stocks mainly reflects higher refinery output, as improved demand in the region, along with higher exports to the US, capped a further increase. Distillate stocks also rose in February by 0.4 mb following two consecutive months of builds to stand at 397.1 mb, indicating a surplus of 2.8 mb or 0.7% below a year ago, but 1.4 mb or 23.6% below the five-year average. The build came from higher refinery output. Relatively weaker domestic demand also contributed to the build in European distillate stocks. However, cold weather in the US led to a draw European middle distillate stocks, capping the increase. Residual fuel oil stocks fell by 2.0 mb, reversing the build of the previous month to end February at 77.6 mb. This was 11.2 mb or 12.6% below the same time a year ago and
1,040
1,060
1,080
1,100
1,120
1,140
1,160
1,180
1,040
1,060
1,080
1,100
1,120
1,140
1,160
1,180
Jan Feb Mar Apr May Jun Jul Aug Sep Oct Nov Dec
mbmb
2013 2014 Average 2009-13
Max/Min2008-12
Stock Movements
OPEC Monthly Oil Market Report – April 2014 81
24.0 mb or 23.6% less than the seasonal average. Higher exports, especially towards Singapore were the main reason behind the decline in fuel oil stocks. Naphtha stocks remained unchanged in February to stand at 24.2 mb, showing a deficit of 16.3 mb or 9.1% with a year ago and 9.1 mb or 27.3% below the latest five-year average. Table 9.2: EU-15 plus Norway’s total oil stocks, mb
US Preliminary data for March shows that US total commercial oil stocks rose by 2.1 mb, reversing the decline of the previous five consecutive months. At 1,037.0 mb, inventories stood at 60 mb or 5.5% below a year ago in the same period, representing a deficit of 36 mb or 3.4% below the latest five-year average. Within the components, the picture was mixed; crude experienced a build, while products witnessed a draw. US commercial crude stocks saw a build of 16.3 mb in March to stand at 380.1 mb, the highest level since October 2013. At this level, US crude oil commercial stocks finished the month at 11.1 mb or 3.0% above the five-year average, while they were 12.0 mb, or 3.1% lower than a year ago at the same time. Graph 9.3: US weekly commercial crude oil stocks
The build in crude commercial stocks was driven by lower crude refinery runs, which fell by around 140 tb/d to stand at 15.1 mb/d. Refineries operated at 85.9% of capacity, down from 87.3% the previous month. However, they were running 2.2 percentage points (pp) higher than in the same period last year. It should be highlighted that during the week ending 28 March, US crude stocks fell against expectation by around 2.4 mb from the previous week, driven by the closure of the Houston Ship Channel to clean up an oil spill, thus lowering crude imports. While total US commercial crude oil stocks
rose in March, inventories at Cushing, Oklahoma dropped by 7.5 mb, to end the month at 27.3 mb, 22.2 mb lower than in the same period a year ago. Total product stocks fell further by 14.2 mb in March for the sixth consecutive month, losing almost 108 mb to stand at 656.9 mb. At this level, US product stocks stood at 48.2 mb or 6.8% below a year ago at the same time, showing a deficit of 47.1 mb or 6.7% below the seasonal norm. All products saw a decline, with the bulk in gasoline. Gasoline stocks declined by 13.4 mb in March, following a fall of 6.7 mb in February. At 215.6 mb, gasoline stocks were 9.3 mb or 4.8% lower than in the same period a year ago, and remained 4.3 mb or 2.0% less than the latest five-year average. A rise of around 470 tb/d in apparent demand was behind the stock draw in gasoline inventories. However, higher gasoline output limited a further drop in gasoline stocks. Graph 9.4: US weekly gasoline stocks
Distillate stocks also fell by 1.5 mb in March to stand at 113.0 mb. At this level, distillate stocks were 5.7 mb or 4.8% below a year ago and remained 25.5 mb or 18.4% lower than the seasonal average. The fall in middle distillate stocks came mainly from higher apparent demand, which increased by around 170 tb/d to average 3.8 mb/d. The increase in distillate production limited a further drop in distillate stocks. Residual fuel oil stocks fell by 0.4 mb to end March at 36.5 mb, which is 0.5 mb or 1.2% lower than a year ago and 1.4 mb or 3.6% below the seasonal norm. Jet fuel stocks also fell by 2.3 mb to stand at 35.6 mb, down by 4.3 mb or 10.7% from the same month a year ago and 5.2 mb or 12.7% below the latest five-year average. Table 9.3: US onland commercial petroleum stocks, mb
Source: US Department of Energy’s Energy Information Administration.
Stock Movements
OPEC Monthly Oil Market Report – April 2014 83
US Strategic Petroleum Reserve sales On 12 March 2014, the US Department of Energy announced that it would sell 5 mb of medium sour crude from its Strategic Petroleum Reserve (SPR). The US SPR is located along the US Gulf Coast and currently holds 696 mb of crude, divided in 434 mb of sour crude and 262 mb of sweet crude. According to the US Energy Information Administration (EIA), a drawdown in the US SPR in the past only occurred either to perform “test sales”, or in the case of emergency disruptions. The first test sale was undertaken in 1985 and consisted of around 1 mb. A second test sale took place in 1990, which amounted to less than 5 mb. Three months later, in response to the conflict between Kuwait and Iraq, which disrupted some 4.3 mb/d, the first emergency release from the SPR was announced, eventually amounting to 17.3 mb. The federal government once again released oil in response to Hurricane Katrina in 2005 — this time 20.8 mb of crude oil — out of which 9.8 mb represented loans to refiners. This was part of a coordinated response with the International Energy Agency (IEA) for the release of almost 60 mb of crude and refined products by its members. The next emergency release took place in June 2011, when some 60 mb of strategic oil stocks were made available under a coordinated release with the IEA, of which around 30.6 mb was US light sweet crude. The recently announced test sale of 5 mb is largely due to test the logistics of moving crude from the SPR to refiners. Surging US tight oil production has upended the logistics of US crude markets. Major pipelines that traditionally moved oil from the US Gulf have been reversed to move a glut of tight oil to refiners on the US Gulf Coast (USGC). The government has said that the test sales are needed to appropriately assess the system’s capabilities. Following the EIA’s announcement, Nymex WTI crude oil prices fell by $2.04 to $97.99/b at the end of the day, before rebounding five days later to the same level as before the decision. The minimal lasting impact on crude oil prices is mainly due to the fact that the amount is small, and will be delivered between 1 April and 10 May, amounting to 125 tb/d over this period. As a consequence, the USGC may see a minor decline in already reduced volumes of crude imports. As a member of the IEA, the US is required to hold the equivalent of 90 days of net oil imports in public and private storage. Currently, the US holds more than 200 days of net oil imports, much higher than the mandated requirement. At the same time, due to the surge in US domestic crude oil production, US crude net imports have fallen in recent years to their lowest level since 1996, to average 7.6 mb/d in 2013. This development would allow the US to sell off further amounts of crude held in its SPR and at potentially higher volumes.
Japan In Japan, total commercial oil stocks fell by 7.8 mb in February, reversing last month’s build of 2.2 mb. At 148.1 mb, Japanese oil inventories are 7.8 mb or 5.0% below what they were a year ago and 15.5 mb or 9.5% lower than the five-year average. Within components, crude and product stocks fell by 0.4 mb and 7.4 mb, respectively.
Stock Movements
84 OPEC Monthly Oil Market Report – April 2014
Japanese commercial crude oil stocks fell slightly in February, reversing the previous month’s stock build, to stand at 88.8 mb. At this level, they are 2.6 mb or 3.0% above a year ago at the same time, but remained 5.1 mb or 5.4% below the five-year average. The stock draw in crude oil was driven by lower crude imports, which fell by around 50 tb/d or 1.2%, to average nearly 4.0 mb/d. At this level, crude imports were 11.0% higher than a year ago at the same time. Refinery throughput saw a minor increase in February, averaging 3.7 mb/d. At this level, it was 1.8% lower than the previous year at the same time. Japanese refiners were running at 82.8% of capacity in February, around 1.5 pp lower than in the previous month, but 0.2 pp more than in the same period a year ago. Direct crude burning in power plants saw an increase of 6.3% in February compared with the previous month, averaging 280.3 tb/d, and showing an increase of 7.0% over the same period a year ago. Graph 9.5: Japan’s commercial oil stocks
Japan’s total product inventories fell by 7.4 mb in February, reversing the build of last month to stand at 59.3 mb. At this level, product stocks showed a deficit of 10.4 mb or 14.9% compared with a year ago at the same time and remained below the five-year average by a deficit of 10.4 mb or 14.9%. Higher domestic sales — which rose by 180 tb/d or 4.9% in February to average 3.9 mb/d — were behind the fall in product inventories. At this level, Japanese oil product sales were 1.1% lower than one year earlier. A 1.5% decline in refinery output and 2.8% fall in oil product imports also contributed to the drop in product inventories. With the exception of gasoline, all products witnessed a stock draw, with the bulk coming from distillates. Gasoline stocks rose by 0.9 mb in February for the second consecutive month to stand at 13.0 mb, which is 0.6 mb or 4.3% less than the same time the previous year and 1.0 mb or 11.0% below the five-year average. A decline of 8.4% in domestic sales was behind the stock build, as well as stronger imports. Distillate stocks fell by 5.6 mb in February for the sixth consecutive month to finish at 25.6 mb, which is 3.6 mb or 12.4% below the same period a year ago and 3.2 mb or 11.0% lower than the seasonal average. Within distillate components, jet fuel oil stocks rose, while kerosene and gasoil dropped. In February, jet fuel inventories rose by 7.5% on the back of lower domestic sales, which declined by almost 30%. Higher output also contributed to this build. Kerosene stocks fell strongly by 36%, driven by lower production combined with reduced imports. Gasoil inventories also fell by 5.5% on the back of lower production, dropping by 2.8% combined with a 3.0% increase in domestic sales.
140
150
160
170
180
190
140
150
160
170
180
190
Jan Feb Mar Apr May Jun Jul Aug Sep Oct Nov Dec
mbmb
2013 2014 Average 2009-13
Max/Min2008-12
Stock Movements
OPEC Monthly Oil Market Report – April 2014 85
Naphtha stocks fell by 0.6 mb, finishing the month of February at 8.0 mb, indicating a deficit of 2.1 mb or 21% compared with a year ago and 3.4 mb or 21.2% below the seasonal norm. The stock draw came from lower production, which declined by nearly 10%. A 20% decline in naphtha imports also contributed to this build. Total residual fuel oil stocks dropped by 2.1 mb to end the month of February at 12.8 mb, which is 4.1 mb or 24.2% less than a year ago and 2.8 mb or 26.2% lower than the five-year average. Within fuel oil components, fuel oil A stocks fell by 10.0%, and fuel oil B.C stocks declined by 16.7%. The fall in fuel oil A stocks could be attributed to higher domestic sales, which rose by 6.6%. The fall in fuel oil B.C stocks is attributed to lower production. Table 9.4: Japan’s commercial oil stocks*, mb
China The latest information showed Chinese total oil commercial inventories rose strongly for the second consecutive month by 32.7 mb in February, following a build of 28.1 mb in January, to stand at 420.8 mb. Within the components, both commercial crude and products rose by 10.2 mb and 22.5 mb, respectively. The build in crude commercial stocks came mainly from lower crude throughput outpacing a decline in crude production. Total product stocks in China also went up in February, with the bulk of the build coming from an increase of 15.6 mb in diesel inventories. Gasoline and kerosene stocks rose by 6.2 mb and 0.7 mb, respectively. The build in product stocks came from weaker demand during the Lunar New Year holiday. Table 9.5: China’s commercial oil stocks, mb
Singapore and Amsterdam-Rotterdam-Antwerp (ARA) At the end of February, product stocks in Singapore rose by 3.5 mb for the second consecutive month to stand at 42.9 mb. With this build, product stocks in Singapore represented a surplus of 3.5 mb or 1.5% over the same period the previous year. Within products, the picture was mixed; light and residual fuel oil saw a build, while middle distillates experienced a drop. Light distillate stocks rose by 2.5 mb in February — the third consecutive month — to a record high of 14.0 mb. At this level, stocks stood 2.5 mb or 3.4% higher than a year ago during the same period. At the same time, fuel oil stocks also rose by 1.1 mb, ending February at 18.6 mb, but remained 3.0 mb or 13.7% below a year ago in the same period. Meanwhile, middle distillate stocks fell slightly by 0.1 mb in February as arrivals remained relatively low. At 10.3 mb, middle inventories are almost in line with the previous year. Product stocks in Amsterdam-Rotterdam-Antwerp (ARA) declined by 3.3 mb in February, after an increase of 5.7 mb in January. At 30.2 mb, product stocks in ARA stood at 3.1 mb or 9.3% below a year ago at the same time. All products saw a drop, with the exception of gasoil. Fuel oil stocks fell by 2.5 mb to end the month of February at 4.1 mb, indicating a deficit of 0.5 mb or 10.5%. Gasoline stocks fell by 0.9 mb in February, reversing the build of the last three months to stand at 7.6 mb, which is 0.6 mb or 7.7% lower than the same period last year. This stock draw was driven by a relative improvement in demand from the region. Gasoil stocks rose by 1.1 mb, ending January at 14.7 mb. Despite this build, gasoil stocks stood at 2.8 mb or 16% below the previous year.
Balance of Supply and Demand
OPEC Monthly Oil Market Report – April 2014 87
Balance of Supply and Demand Demand for OPEC crude in 2013 remained unchanged from the previous report to stand at 30.0 mb/d, which is 0.5 mb/d lower than the 2012 level. In 2014, the demand for OPEC crude saw a downward revision of 0.1 mb/d to average 29.6 mb/d, 0.4 mb/d less than last year. Estimate for 2013 Demand for OPEC crude in 2013 remained unchanged from the previous report. Within quarters, the first and the third quarters remained unchanged, while the second quarter saw an upward revision of 0.1 mb/d. The fourth quarter experienced a downward adjustment of 0.1 mb/d. The demand for OPEC crude stood at 30.0 mb/d in 2013, representing a decrease of 0.5 mb/d from the 2012 level. The first quarter is estimated to remain unchanged versus the same quarter last year; while the second was lower by 0.3 mb/d. The third and the fourth quarters saw negative growth of 0.8 mb/d and 1.0 mb/d, respectively. Table 10.1: Summarized supply/demand balance for 2013, mb/d
Forecast for 2014 Demand for OPEC crude for 2014 was revised down by 0.1 mb/d from the previous report, reflecting the upward adjustment of non-OPEC supply as world oil demand remained unchanged. Within quarters, the first and the third quarters were revised down by 0.1 mb/d, while the second and the fourth quarters remained unchanged versus last report. The demand for OPEC crude is forecast at 29.6 mb/d in 2014, a decrease of 0.4 mb/d from the previous year. The first and the second quarters are estimated to show a decline of 0.5 mb/d each, versus the same period last year. The third quarter is expected to see negative growth of 0.2 mb/d, while the fourth quarter is forecast to drop by 0.3 mb/d versus the same quarter last year. Table 10.2: Summarized supply/demand balance for 2014, mb/d
Note: Totals may not add up due to independent rounding. * Excludes China and FSU.na: Not available. ** Estimated figure when Baker Hughes Incorporated did Sources: Baker Hughes Incorporated & Secretariat's estimates. not reported the data.
94 OPEC Monthly Oil Market Report – April 2014
Contributors to the OPEC Monthly Oil Market Report Editor-in-Chief Omar S. Abdul-Hamid, Director, Research Division email: [email protected] Editor Hojatollah Ghanimi Fard, Head, Petroleum Studies Department email: [email protected] Analysts Crude Oil Price Movements Eissa Alzerma
The data, analysis and any other information contained in the Monthly Oil Market Report (the “MOMR”) is for informational purposes only and is not intended as a substitute for advice from your business, finance, investment consultant or other professional. The views expressed in the MOMR are those of the OPEC Secretariat and do not necessarily reflect the views of its Governing Bodies and/or individual OPEC Member Countries.
Whilst reasonable efforts have been made to ensure the accuracy of the MOMR’s content, the OPEC Secretariat makes no warranties or representations as to its accuracy, currency reference or comprehensiveness, and assumes no liability or responsibility for any inaccuracy, error or omission, or for any loss or damage arising in connection with or attributable to any action or decision taken as a result of using or relying on the information in the MOMR.
The MOMR may contain references to material(s) from third parties whose copyright must be acknowledged by obtaining necessary authorization from the copyright owner(s). The OPEC Secretariat shall not be liable or responsible for any unauthorized use of third party material(s). All rights of the Publication shall be reserved to the OPEC Secretariat, including every exclusive economic right, in full or per excerpts, with special reference but without limitation, to the right to publish it by press and/or by any communications medium whatsoever, including Internet; translate, include in a data base, make changes, transform and process for any kind of use, including radio, television or cinema adaptations, as well as sound-video recording, audio-visual screenplays and electronic processing of any kind and nature whatsoever.
Full reproduction, copying or transmission of the MOMR is not permitted in any form or by any means by third parties without the OPEC Secretariat’s written permission, however the information contained therein may be used and/or reproduced for educational and other non-commercial purposes without the OPEC Secretariat’s prior written permission, provided that OPEC is fully acknowledged as the copyright holder.
Next report to be issued on 13 May 2014.
OPEC Basket average price US$/b
March OPEC crude production mb/d, according to secondary sources
Economic growth rate per cent
down 1.23 in March
down 0.63 in March
March 2014 104.15
February 2014 105.38
Year to date 104.73
March 2014 29.61
February 2014 30.24
World OECD US Japan Euro-zone China India
2013 2.9 1.3 1.9 1.5 –0.4 7.7 4.7
2014 3.4 2.0 2.7 1.3 0.8 7.5 5.6
Supply and demand mb/d
OECD commercial stocks mb
2013 12/13 2014 13/14
World demand 90.0 1.0 World demand 91.1 1.1
Non-OPEC supply 54.2 1.3 Non-OPEC supply 55.6 1.4
OPEC NGLs 5.8 0.2 OPEC NGLs 5.9 0.1
Difference 30.0 –0.5 Difference 29.6 –0.4
Dec 13 Jan 14 Feb 14 Feb 14/Jan 14 Feb 13Crude oil 1,231 1,230 1,233 2.1 1,272