1 Salet N, et al. BMJ Open 2018;8:e019405. doi:10.1136/bmjopen-2017-019405 Open Access Is Textbook Outcome a valuable composite measure for short-term outcomes of gastrointestinal treatments in the Netherlands using hospital information system data? A retrospective cohort study Nèwel Salet, 1,2 Rolf H Bremmer, 2 Marc A M T Verhagen, 3 Vivian E Ekkelenkamp, 4 Bettina E Hansen, 5,6 Pieter J F de Jonge, 6 Rob A de Man 6 To cite: Salet N, Bremmer RH, Verhagen MAMT, et al. Is Textbook Outcome a valuable composite measure for short-term outcomes of gastrointestinal treatments in the Netherlands using hospital information system data? A retrospective cohort study. BMJ Open 2018;8:e019405. doi:10.1136/ bmjopen-2017-019405 ► Prepublication history and additional material for this paper are available online. To view these files, please visit the journal online (http://dx.doi. org/10.1136/bmjopen-2017- 019405). Received 31 August 2017 Revised 11 January 2018 Accepted 23 January 2018 For numbered affiliations see end of article. Correspondence to Dr Rolf H Bremmer; [email protected]Research ABSTRACT Objective To develop a feasible model for monitoring short- term outcome of clinical care trajectories for hospitals in the Netherlands using data obtained from hospital information systems for identifying hospital variation. Study design Retrospective analysis of collected data from hospital information systems combined with clinical indicator definitions to define and compare short-term outcomes for three gastrointestinal pathways using the concept of Textbook Outcome. Setting 62 Dutch hospitals. Participants 45 848 unique gastrointestinal patients discharged in 2015. Main outcome measure A broad range of clinical outcomes including length of stay, reintervention, readmission and doctor–patient counselling. Results Patients undergoing endoscopic retrograde cholangiopancreatography (ERCP) for gallstone disease (n=4369), colonoscopy for inflammatory bowel disease (IBD; n=19 330) and colonoscopy for colorectal cancer screening (n=22 149) were submitted to five suitable clinical indicators per treatment. The percentage of all patients who met all five criteria was 54%±9% (SD) for ERCP treatment. For IBD this was 47%±7% of the patients, and for colon cancer screening this number was 85%±14%. Conclusion This study shows that reusing data obtained from hospital information systems combined with clinical indicator definitions can be used to express short-term outcomes using the concept of Textbook Outcome without any excess registration. This information can provide meaningful insight into the clinical care trajectory on the level of individual patient care. Furthermore, this concept can be applied to many clinical trajectories within gastroenterology and beyond for monitoring and improving the clinical pathway and outcome for patients. INTRODUCTION Background Indicators for measuring healthcare quality can be divided into three main groups: structure indicators, clinical indicators and genuine health outcomes. 1–3 Structure indi- cators focus on infrastructure and the pres- ence of protocols and guidelines. Clinical indicators largely focus on the presence of evidence-based treatment and adverse events like infection or readmission rates directly impacting the individual patient. Finally, genuine health outcomes consist of patient-reported health and quality of life after receiving care. Although genuine health outcomes are considered to be the most valu- able indicators, these health outcomes are however mostly unavailable for most diseases. Moreover, collecting data concerning genuine health outcomes requires substan- tial effort, is time consuming and usually not routinely part of standard care in most hospi- tals. Although clinical indicators provide inad- equate information on long-term outcome, they can provide useful information on the clinical path of individual patients. Moni- toring clinical indicators can be used to improve the quality of healthcare 4 and bears most value when analysed in a combination of multiple indicators, due to the multidi- mensional nature of most diseases. 5 Strengths and limitations of this study ► The data and analyses were obtained from existing data from hospital information systems. ► The approach used in this study is applicable for evaluating various interventional processes. ► The study does not provide insight into post- discharge outcomes. on May 22, 2020 by guest. Protected by copyright. http://bmjopen.bmj.com/ BMJ Open: first published as 10.1136/bmjopen-2017-019405 on 1 March 2018. Downloaded from
Transcript
1Salet N, et al. BMJ Open 2018;8:e019405. doi:10.1136/bmjopen-2017-019405
Open Access
Is Textbook Outcome a valuable composite measure for short-term outcomes of gastrointestinal treatments in the Netherlands using hospital information system data? A retrospective cohort study
Nèwel Salet,1,2 Rolf H Bremmer,2 Marc A M T Verhagen,3 Vivian E Ekkelenkamp,4 Bettina E Hansen,5,6 Pieter J F de Jonge,6 Rob A de Man6
To cite: Salet N, Bremmer RH, Verhagen MAMT, et al. Is Textbook Outcome a valuable composite measure for short-term outcomes of gastrointestinal treatments in the Netherlands using hospital information system data? A retrospective cohort study. BMJ Open 2018;8:e019405. doi:10.1136/bmjopen-2017-019405
► Prepublication history and additional material for this paper are available online. To view these files, please visit the journal online (http:// dx. doi. org/ 10. 1136/ bmjopen- 2017- 019405).
Received 31 August 2017Revised 11 January 2018Accepted 23 January 2018
For numbered affiliations see end of article.
Correspondence toDr Rolf H Bremmer; rolf. bremmer@ logex. nl
Research
AbstrACtObjective To develop a feasible model for monitoring short-term outcome of clinical care trajectories for hospitals in the Netherlands using data obtained from hospital information systems for identifying hospital variation.study design Retrospective analysis of collected data from hospital information systems combined with clinical indicator definitions to define and compare short-term outcomes for three gastrointestinal pathways using the concept of Textbook Outcome.setting 62 Dutch hospitals.Participants 45 848 unique gastrointestinal patients discharged in 2015.Main outcome measure A broad range of clinical outcomes including length of stay, reintervention, readmission and doctor–patient counselling.results Patients undergoing endoscopic retrograde cholangiopancreatography (ERCP) for gallstone disease (n=4369), colonoscopy for inflammatory bowel disease (IBD; n=19 330) and colonoscopy for colorectal cancer screening (n=22 149) were submitted to five suitable clinical indicators per treatment. The percentage of all patients who met all five criteria was 54%±9% (SD) for ERCP treatment. For IBD this was 47%±7% of the patients, and for colon cancer screening this number was 85%±14%.Conclusion This study shows that reusing data obtained from hospital information systems combined with clinical indicator definitions can be used to express short-term outcomes using the concept of Textbook Outcome without any excess registration. This information can provide meaningful insight into the clinical care trajectory on the level of individual patient care. Furthermore, this concept can be applied to many clinical trajectories within gastroenterology and beyond for monitoring and improving the clinical pathway and outcome for patients.
IntrOduCtIOnbackgroundIndicators for measuring healthcare quality can be divided into three main groups:
structure indicators, clinical indicators and genuine health outcomes.1–3 Structure indi-cators focus on infrastructure and the pres-ence of protocols and guidelines. Clinical indicators largely focus on the presence of evidence-based treatment and adverse events like infection or readmission rates directly impacting the individual patient. Finally, genuine health outcomes consist of patient-reported health and quality of life after receiving care. Although genuine health outcomes are considered to be the most valu-able indicators, these health outcomes are however mostly unavailable for most diseases. Moreover, collecting data concerning genuine health outcomes requires substan-tial effort, is time consuming and usually not routinely part of standard care in most hospi-tals. Although clinical indicators provide inad-equate information on long-term outcome, they can provide useful information on the clinical path of individual patients. Moni-toring clinical indicators can be used to improve the quality of healthcare4 and bears most value when analysed in a combination of multiple indicators, due to the multidi-mensional nature of most diseases.5
strengths and limitations of this study
► The data and analyses were obtained from existing data from hospital information systems.
► The approach used in this study is applicable for evaluating various interventional processes.
► The study does not provide insight into post-discharge outcomes.
on May 22, 2020 by guest. P
rotected by copyright.http://bm
jopen.bmj.com
/B
MJ O
pen: first published as 10.1136/bmjopen-2017-019405 on 1 M
2 Salet N, et al. BMJ Open 2018;8:e019405. doi:10.1136/bmjopen-2017-019405
Open Access
Textbook Outcome (TO) is a composite measure of clinical process indicators. TO is realised for patients for whom all desired short-term health indicators are met.6 This approach enables a simple comprehensive summary of clinical care, and an in-depth analysis to get clinical insight into daily practice, per patient group and indi-cator, all the way down to the clinical pathway per indi-vidual patient. The approach of TO is particularly suited for clinical interventions (surgery, invasive diagnostics) and was previously used in a study performed in the Netherlands in patients undergoing colon resection due to colon cancer.6 The concept was also used in the form of a questionnaire in which patients reported their consid-erations in the choice of a hospital,7 in patients with oesophagogastric cancer in need of surgery,8 and elective aneurism surgery.9 However none of these studies used existing data primarily used for reimbursement.
ObjectiveThe objective of this study is to develop a model for moni-toring short-term outcome of clinical care trajectories for hospitals in the Netherlands using data obtained from hospital information systems. The model is expected to successfully identify hospital variation on short-term outcomes on a large scale in a feasible and reproductive manner. In order to assess the discriminative value of the indicators used, the specificity score per indicator will be calculated.
In order to establish these objectives we further elon-gate on previous approaches using TO, and apply this means of clinical pathway measurement on a larger scale based on clinical indicators for high-volume treatments. A TO was defined for three different treatments performed by gastroenterologists, consisting of at least five evidence-based indicators as reviewed by an undisclosed panel of
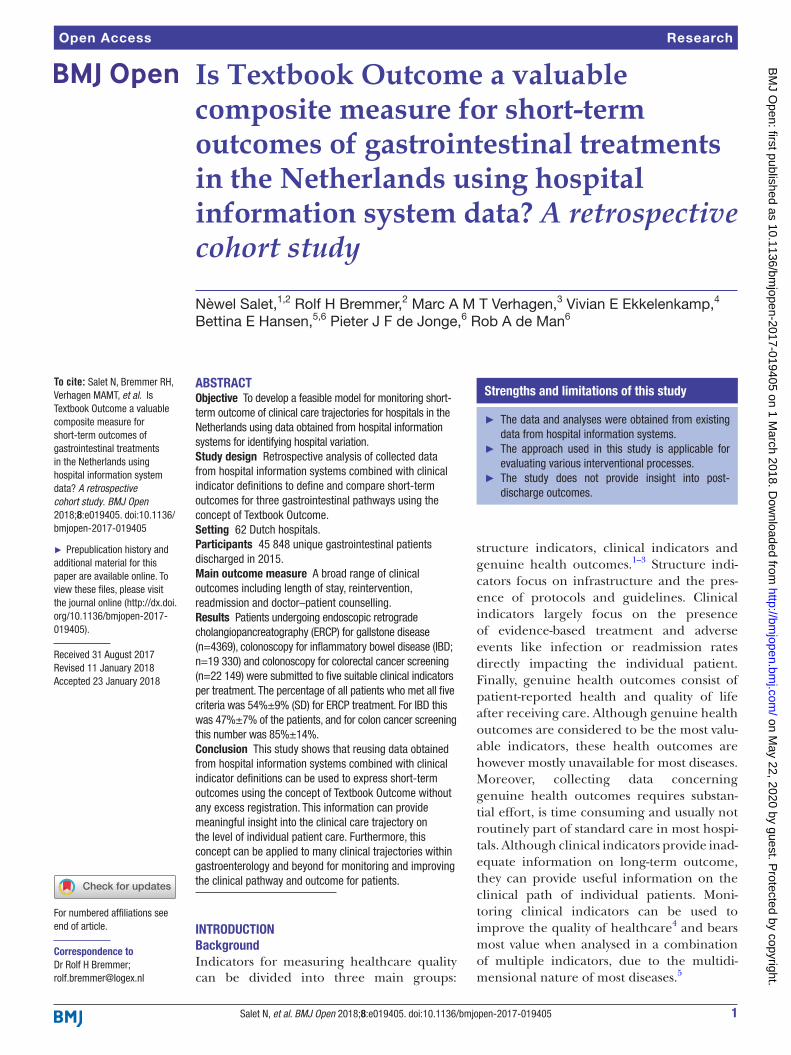
Figure 1 Flow chart of included hospitals and corresponding patient trajectories. *Hospitals affiliated with LOGEX are included in this study. ERCP, endoscopic retrograde cholangiopancreatography; IBD, inflammatory bowel disease.
on May 22, 2020 by guest. P
rotected by copyright.http://bm
jopen.bmj.com
/B
MJ O
pen: first published as 10.1136/bmjopen-2017-019405 on 1 M
3Salet N, et al. BMJ Open 2018;8:e019405. doi:10.1136/bmjopen-2017-019405
Open Access
Dutch gastroenterologists. In order to give a valid repre-sentation of the care patients received in any included hospital, these indicators should cover as many stages of care as the data allow. This study aims to include indicators covering preprocedural, procedural and postprocedural care. The value of clinical indicators for patients in need of an endoscopic retrograde cholangiopancreatography (ERCP) due to gallstone disease will serve as an example in this study, focusing on the treatment trajectory prior, during and after ERCP. Furthermore, clinical indicators will be applied on two other major gastrointestinal treat-ments based on the registration of available operational care activities. While analysing a great number of treat-ments and providing a clear but comprehensive measure of the proportion of patients who have reached a TO, a new approach of assimilating existing data is exerted.
MethOdsstudy designThis study was reported in accordance with the Strength-ening the Reporting of Observational Studies in Epide-miology statement for reporting observational studies.10
The potential of TO was assessed by choosing three high-prevalent gastrointestinal diagnoses requiring endo-scopic intervention. The first trajectory included patients with the diagnosis of ‘gallstone disease’ who under-went ERCP for stone extraction. The second trajectory included patients who underwent at least one colonos-copy for ‘colorectal cancer screening’. The third trajec-tory included patients with ‘Inflammatory bowel disease’ (IBD), who also underwent a colonoscopy.
setting and data sourcesThe data set was retrieved from the benchmark data-base owned by LOGEX (Amsterdam, The Netherlands). This database contains specific care activities and treat-ment characteristics registered within the hospital infor-mation system from hospitals associated with LOGEX. Each of these data sets is carefully validated in cooper-ation with hospital information technology specialists, medical specialists and LOGEX. This validation process
includes comparison with previous data deliveries (to identify unexpected outliers) and comparison of outpa-tient contacts, inpatient contact and operations with the electronic patient records of the hospital. The retrieved benchmark database includes a wide variety of informa-tion, such as, but not limited to: start and end dates of treatment, doctor–patient contacts, performed endo-scopic, radiologic or laboratory diagnostics, surgical intervention, time of admission and days of inpatient stay. These activities per patient combine into care prod-ucts (so called ‘DBC-DOT Zorgproducten’), comparable with diagnosis-related groups, which are primarily used for structuring and reimbursement of delivered care to healthcare providers. A recent study has shown that administrative data are a valid venue of data, and can be used for quality assessment of healthcare in cardiac patients.11 In 2015, the total number of hospitals in the Netherlands was 83, of which 62 were included in this study (75%); academic hospitals were excluded as will be discussed in the Discussion section, as well as four hospi-tals without a gastrointestinal department. An overview of the selection of included hospitals per treatment is illus-trated in figure 1.
study size and participantsAll patients (n=45 848) with one of the three defined trajectories discharged between 1 January 2015 and 31 December 2015 were evaluated. By definition, all patients were discharged within 42 days after interven-tion and inpatient stay (related to reimbursement regu-lations). All analysed patient trajectories were required to have at least one ‘core’ care intervention registered for their diagnosis; for gallstone disease this was the ERCP activity, and for IBD and colon cancer screening this core activity was the colonoscopy. For example, to be included in the analysis of ‘gallstone disease’, patients were required to fulfil the following inclusion criteria: (1) patients were diagnosed with gallstone disease, (2) were treated by a gastroenterologist and (3) underwent at least one ERCP for stone extraction (being the core activity), and (4) patient was discharged in 2015; there were no
Table 1 Overview of the criteria per treatment structured by preprocedural, procedural and postprocedural indicators
DiagnosisTreatment/core activity Volume
Preprocedural indicators
Procedural indicators
Postprocedural indicators
Choledocholithiasis(Gallstone disease)
ERCP 4369 patients;51 hospitals
Doctor–patient contact prior to ERCP20 21
Maximum number of ERCP is 1.22–24
Inpatient stay maximum 7 days25
No CT after ERCP26
No readmission within 30 days27
Colorectal cancer screening
Colonoscopy 22 149 patients;53 hospitals
Doctor–patient contact prior to colonoscopy28 29
No CT colon30
No lab tests31 32No hospital admission33 34
No ER admission after colonoscopy35
Morbus Crohn and colitis ulcerosa (IBD)
Colonoscopy 19 330 patients;62 hospitals
Maximum 56 days between first consult and colonoscopy36
Maximum number of colonoscopy is 1.Inpatient stay maximum 3 days37 25
4 Salet N, et al. BMJ Open 2018;8:e019405. doi:10.1136/bmjopen-2017-019405
Open Access
additional exclusion criteria for patients. An overview of the selection of included patients per treatment is illus-trated in figure 1; all diagnoses and used indicators are shown in table 1.
VariablesExtensive literature search was conducted prior to defining TO indicators. The indicators listed in table 1 show the selected criteria to assess the clinical outcomes of ERCP, colorectal cancer screening and IBD. The selec-tion choice of the clinical indicators is described in the online supplementary appendix in more detail.
Outcome definitionThis study’s primary goal was to determine the varia-tion among hospitals’ treatment score. For each patient treated, we determined if the treatment was considered to conform with TO—a binary outcome score (1/0). A patient was considered TO when all five indicators were met; if one or more of the five indicators were not met, the treatment was not considered TO. The selected set of indicators was applied to all patients, regardless of their background or medical complexity. The hospital score per
treatment consists of every individual patient accumulated into a total score illustrated in a percentage of patients who have reached TO in the corresponding hospital: the TO score (%) is the quotient of total number of patients treated while fulfilling all five indicators (numerator) and the total number of treated patients in that hospital for that intervention (denominator). The indicators in the TO scope range from the first outpatient contact with the gastroenterologist up to the last registered care activity in the care trajectory, usually being a consult to check-up on the patient after the treatment to conclude the care cycle. If no new care activity is registered for a patient related to this intervention after patient discharge, the care trajec-tory closes automatically.
statistical methodsThe clinical indicators were assessed for each patient and the product of all clinical indicators resulted in the number and proportion of patients for whom all desired outcomes were realised and thereby a ‘Textbook Outcome’ was achieved. Per treatment and for each hospital, the propor-tion of patients with a ‘Textbook Outcome’ was calculated.
Figure 2 Distribution of the scores per indicator shown for 53 hospitals: (A) distribution of scores on doctor–patient contact prior to ERCP, (B) no second ERCP, (C) inpatient stay, (D) no CT scan after ERCP, (E) no readmission within 30 days, and (F) product of all criteria, defined as Textbook Outcome. ERCP, endoscopic retrograde cholangiopancreatography.
on May 22, 2020 by guest. P
rotected by copyright.http://bm
jopen.bmj.com
/B
MJ O
pen: first published as 10.1136/bmjopen-2017-019405 on 1 M
5Salet N, et al. BMJ Open 2018;8:e019405. doi:10.1136/bmjopen-2017-019405
Open Access
To assess the impact of clinical indicators where the total TO was not met (TO=0), the specificity of each indicator was determined. The mean specificities across hospitals were depicted along with the percentage of TO that was not met (score=0) in order to provide increasing discriminative value of each singular indicator.
Second, a pairwise comparison between TO score on hospital level and score per indicator was performed per treatment to assess the relationship between reported score per hospital on individual indicators and total TO score. The relation is expressed in Pearson’s correlation. Additionally, pairwise comparison between clinical indi-cators on hospital level was assessed. Pearson’s correla-tion coefficient >0.7 was considered a strong correlation. The variation in score among hospitals is displayed by the SD. Statistical analyses were performed in Excel and SPSS V.25.
resultsdescriptive dataIn total, 62 of the LOGEX-affiliated hospitals were included in this study (figure 1). For the ERCP trajectory a total number of 4369 ERCP patients treated in 51 hospi-tals were included, of which 41.5% were male; and the average age was 66±18 years (SD). For the IBD colonos-copy subgroup a total of 19 330 patients were included, 45.0% were male; the average age was 48±17 years (SD). For colon cancer screening with a total of 22 149 patients, 60.4% were male; the average age was 67±4 years (SD).
Outcome data and main resultThe average TO score (score=1) for ERCP due to gall-stone disease was 54%, with an SD of 9%. Accordingly, 54% of 4369 unique patient trajectories have met all five criteria: doctor–patient contact prior to ERCP, not more than one ERCP, inpatient stay equal or shorter than 7 days, no CT scan after ERCP and no readmission within
30 days. Individual scores per indicator are illustrated in figure 2A–F; average score per indicator ranged from 96% (no readmission within 30 days after ERCP) to 79% (length of stay does not exceed 7 days).
Each indicator was assessed in closer detail with regard to specificity in order to assess discriminative value. Figure 3A–C illustrates the specificity and variance between the TO score and each individual indicator. For patients who underwent an ERCP, indicator 5 (no read-mission within 30 days) shows the lowest variance, and therefore is influencing the hospital’s total TO score the least. Indicator 3 (inpatient stay <7 days), however, shows the largest variance.
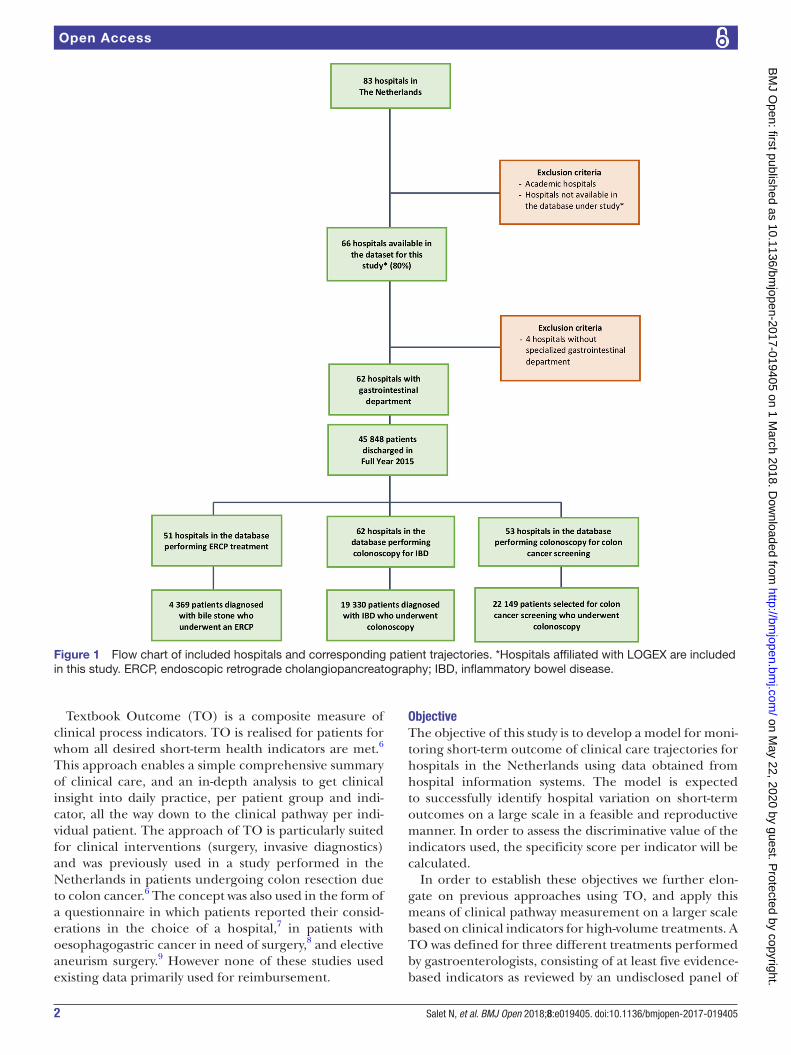
Figure 4A–F illustrates the association between the total TO score on hospital level and the hospital score per individual indicator. The calculated Pearson’s correla-tion coefficient depicts the correlation between the score per individual indicator on hospital level and the total TO score. The statistical correlation for the score on doctor–patient contact with the total TO score proved weak-moderate positive (r=0.38). The correlation for scores on readmission (r=0.56) and no CT scan (r=0.62) were higher than with patient contact, being considered as a moderate positive linear relationship. The correla-tion for scores on the indicators’ inpatient stay ≤7 days (r=0.74) and no second ERCP (r=0.80) proved strong positive. Pairwise comparison of the two indicators with highest correlation with total TO score on hospital level gives a weak correlation of r=0.55 (figure 4F).
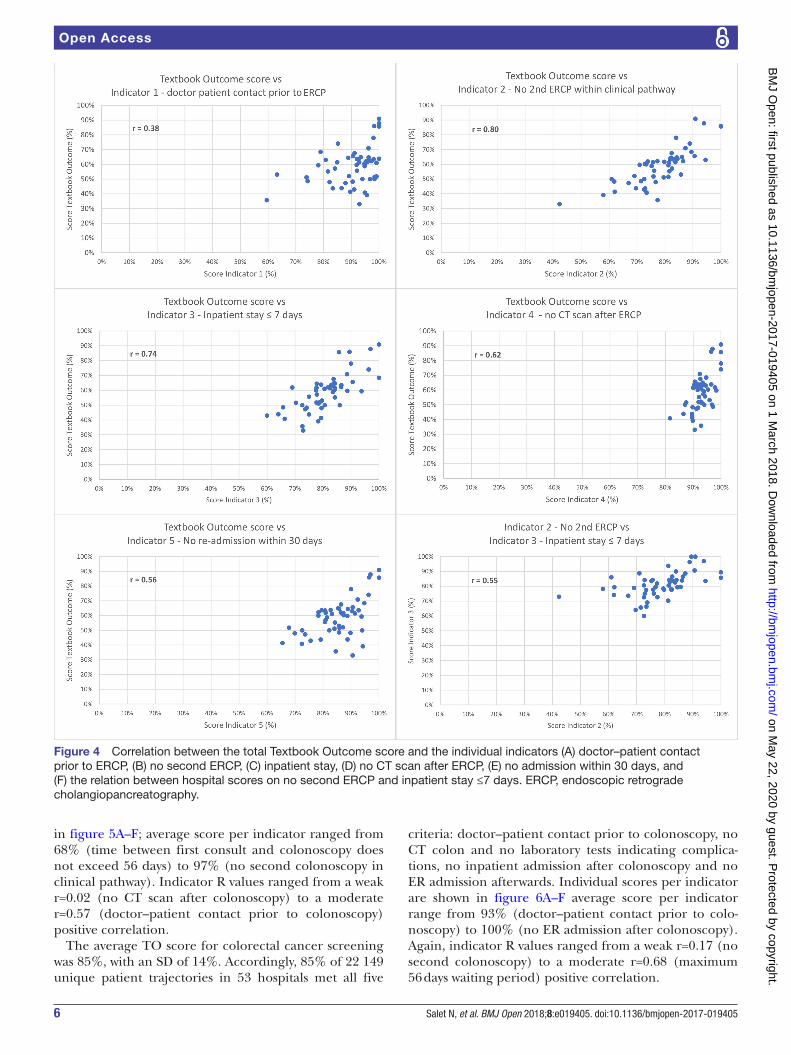
The average TO score for IBD was 47%, with an SD of 7%. Accordingly, 47% of 19 330 unique patient trajecto-ries in 62 hospitals met all five criteria: time between first consult and colonoscopy does not exceed 56 days, the amount of colonoscopies is not more than one, inpatient stay equal or shorter than 3 days, no emergency room (ER) admission after colonoscopy and doctor–patient counsel-ling afterwards. Individual scores per indicator are shown
Figure 3 Specificity score per indicator. (A) ERCP for (1) doctor–patient contact prior to ERCP, (2) no second ERCP, (3) inpatient stay, (4) no CT scan after ERCP, (5) no readmission within 30 days, and per cent of all patients not meeting the five criteria. (B) IBD colonoscopy: (1) distribution of time scores between first consult and colonoscopy, (2) no second colonoscopy, (3) inpatient stay, (4) no emergency room (ER) admission after colonoscopy, (5) follow-up doctor–patient consult after colonoscopy, and per cent of all patients not meeting the five criteria. (C) Colon screening colonoscopies: (1) doctor–patient consult before colonoscopy, (2) no CT scan indicating complications, (3) no laboratory diagnostics indicating complications, (4) no inpatient admission after colonoscopy, (5) no ER admission after colonoscopy, and per cent of all patients not meeting the five criteria. ERCP, endoscopic retrograde cholangiopancreatography; IBD, inflammatory bowel disease; TO, Textbook Outcome.
on May 22, 2020 by guest. P
rotected by copyright.http://bm
jopen.bmj.com
/B
MJ O
pen: first published as 10.1136/bmjopen-2017-019405 on 1 M
6 Salet N, et al. BMJ Open 2018;8:e019405. doi:10.1136/bmjopen-2017-019405
Open Access
in figure 5A–F; average score per indicator ranged from 68% (time between first consult and colonoscopy does not exceed 56 days) to 97% (no second colonoscopy in clinical pathway). Indicator R values ranged from a weak r=0.02 (no CT scan after colonoscopy) to a moderate r=0.57 (doctor–patient contact prior to colonoscopy) positive correlation.
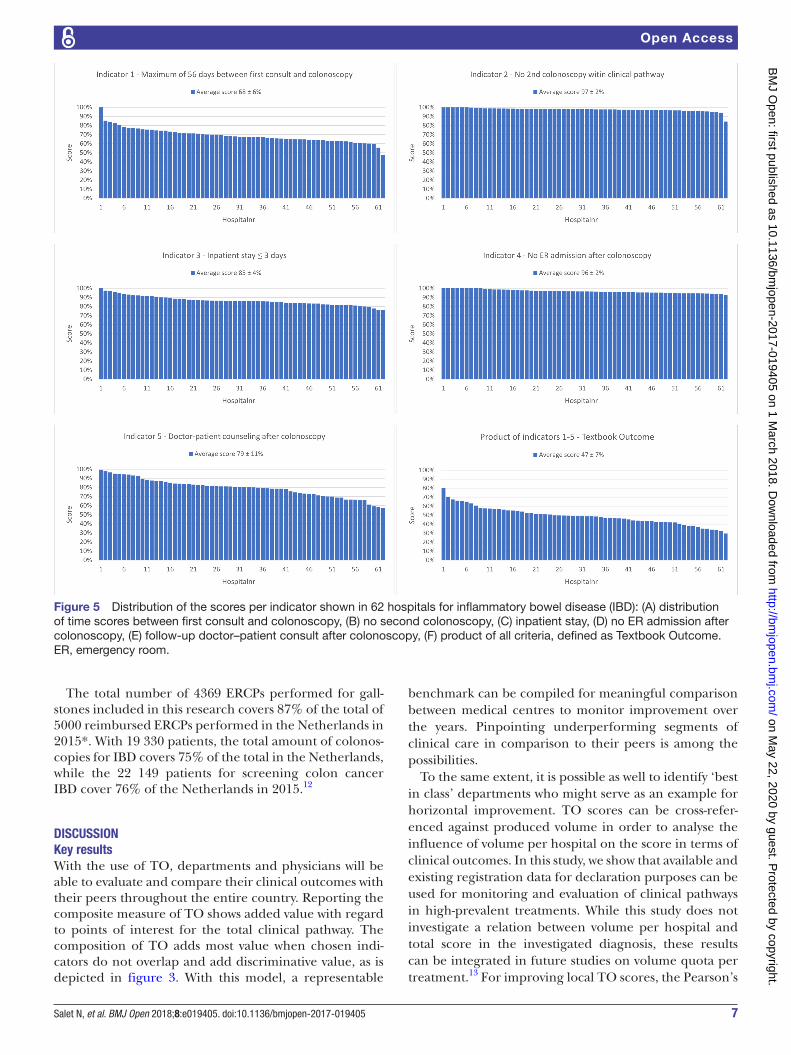
The average TO score for colorectal cancer screening was 85%, with an SD of 14%. Accordingly, 85% of 22 149 unique patient trajectories in 53 hospitals met all five
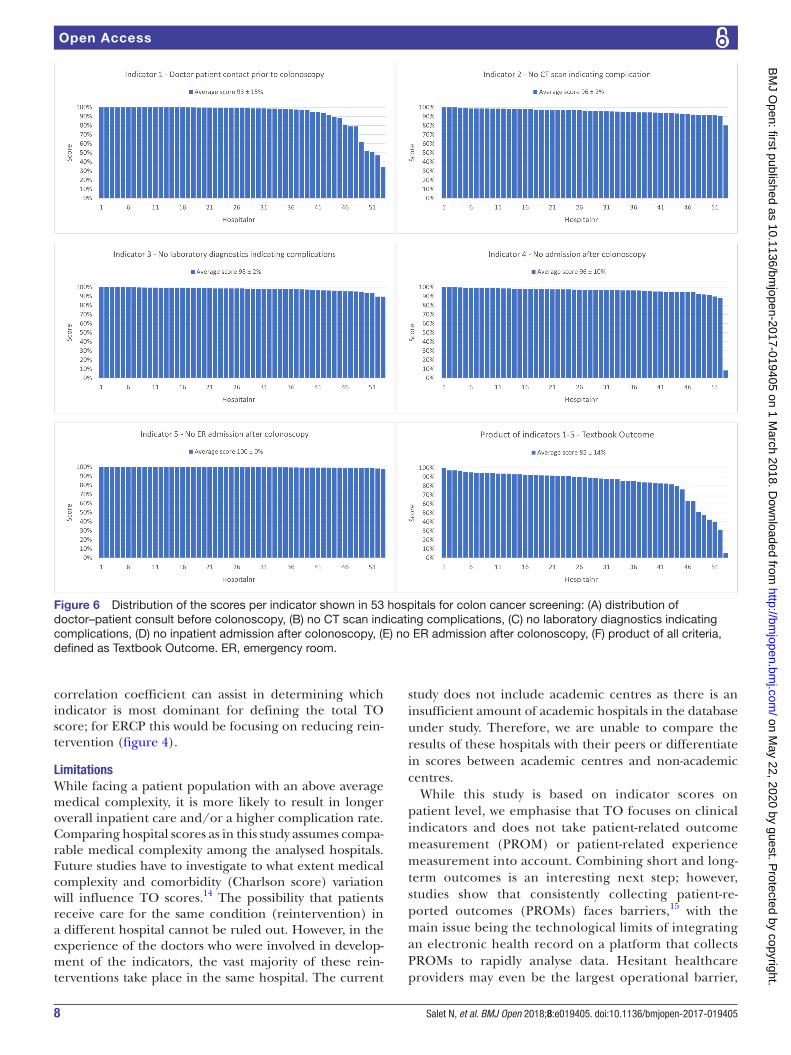
criteria: doctor–patient contact prior to colonoscopy, no CT colon and no laboratory tests indicating complica-tions, no inpatient admission after colonoscopy and no ER admission afterwards. Individual scores per indicator are shown in figure 6A–F average score per indicator range from 93% (doctor–patient contact prior to colo-noscopy) to 100% (no ER admission after colonoscopy). Again, indicator R values ranged from a weak r=0.17 (no second colonoscopy) to a moderate r=0.68 (maximum 56 days waiting period) positive correlation.
Figure 4 Correlation between the total Textbook Outcome score and the individual indicators (A) doctor–patient contact prior to ERCP, (B) no second ERCP, (C) inpatient stay, (D) no CT scan after ERCP, (E) no admission within 30 days, and (F) the relation between hospital scores on no second ERCP and inpatient stay ≤7 days. ERCP, endoscopic retrograde cholangiopancreatography.
on May 22, 2020 by guest. P
rotected by copyright.http://bm
jopen.bmj.com
/B
MJ O
pen: first published as 10.1136/bmjopen-2017-019405 on 1 M
7Salet N, et al. BMJ Open 2018;8:e019405. doi:10.1136/bmjopen-2017-019405
Open Access
The total number of 4369 ERCPs performed for gall-stones included in this research covers 87% of the total of 5000 reimbursed ERCPs performed in the Netherlands in 2015*. With 19 330 patients, the total amount of colonos-copies for IBD covers 75% of the total in the Netherlands, while the 22 149 patients for screening colon cancer IBD cover 76% of the Netherlands in 2015.12
dIsCussIOnKey resultsWith the use of TO, departments and physicians will be able to evaluate and compare their clinical outcomes with their peers throughout the entire country. Reporting the composite measure of TO shows added value with regard to points of interest for the total clinical pathway. The composition of TO adds most value when chosen indi-cators do not overlap and add discriminative value, as is depicted in figure 3. With this model, a representable
benchmark can be compiled for meaningful comparison between medical centres to monitor improvement over the years. Pinpointing underperforming segments of clinical care in comparison to their peers is among the possibilities.
To the same extent, it is possible as well to identify ‘best in class’ departments who might serve as an example for horizontal improvement. TO scores can be cross-refer-enced against produced volume in order to analyse the influence of volume per hospital on the score in terms of clinical outcomes. In this study, we show that available and existing registration data for declaration purposes can be used for monitoring and evaluation of clinical pathways in high-prevalent treatments. While this study does not investigate a relation between volume per hospital and total score in the investigated diagnosis, these results can be integrated in future studies on volume quota per treatment.13 For improving local TO scores, the Pearson’s
Figure 5 Distribution of the scores per indicator shown in 62 hospitals for inflammatory bowel disease (IBD): (A) distribution of time scores between first consult and colonoscopy, (B) no second colonoscopy, (C) inpatient stay, (D) no ER admission after colonoscopy, (E) follow-up doctor–patient consult after colonoscopy, (F) product of all criteria, defined as Textbook Outcome. ER, emergency room.
on May 22, 2020 by guest. P
rotected by copyright.http://bm
jopen.bmj.com
/B
MJ O
pen: first published as 10.1136/bmjopen-2017-019405 on 1 M
8 Salet N, et al. BMJ Open 2018;8:e019405. doi:10.1136/bmjopen-2017-019405
Open Access
correlation coefficient can assist in determining which indicator is most dominant for defining the total TO score; for ERCP this would be focusing on reducing rein-tervention (figure 4).
limitationsWhile facing a patient population with an above average medical complexity, it is more likely to result in longer overall inpatient care and/or a higher complication rate. Comparing hospital scores as in this study assumes compa-rable medical complexity among the analysed hospitals. Future studies have to investigate to what extent medical complexity and comorbidity (Charlson score) variation will influence TO scores.14 The possibility that patients receive care for the same condition (reintervention) in a different hospital cannot be ruled out. However, in the experience of the doctors who were involved in develop-ment of the indicators, the vast majority of these rein-terventions take place in the same hospital. The current
study does not include academic centres as there is an insufficient amount of academic hospitals in the database under study. Therefore, we are unable to compare the results of these hospitals with their peers or differentiate in scores between academic centres and non-academic centres.
While this study is based on indicator scores on patient level, we emphasise that TO focuses on clinical indicators and does not take patient-related outcome measurement (PROM) or patient-related experience measurement into account. Combining short and long-term outcomes is an interesting next step; however, studies show that consistently collecting patient-re-ported outcomes (PROMs) faces barriers,15 with the main issue being the technological limits of integrating an electronic health record on a platform that collects PROMs to rapidly analyse data. Hesitant healthcare providers may even be the largest operational barrier,
Figure 6 Distribution of the scores per indicator shown in 53 hospitals for colon cancer screening: (A) distribution of doctor–patient consult before colonoscopy, (B) no CT scan indicating complications, (C) no laboratory diagnostics indicating complications, (D) no inpatient admission after colonoscopy, (E) no ER admission after colonoscopy, (F) product of all criteria, defined as Textbook Outcome. ER, emergency room.
on May 22, 2020 by guest. P
rotected by copyright.http://bm
jopen.bmj.com
/B
MJ O
pen: first published as 10.1136/bmjopen-2017-019405 on 1 M
9Salet N, et al. BMJ Open 2018;8:e019405. doi:10.1136/bmjopen-2017-019405
Open Access
with the large amount of time-consuming tasks already being part of their daily routine.15 When taking these factors into consideration, the advantages of analysing clinical indicators over PROMs are evident. The suggested combination of indicators per trajectory is shown valuable on hand, but further research is neces-sary to evaluate the impact of patient characteristics including age, gender and comorbidity. By adding indi-cators concerning case mix, an even more proficient way of insight can be provided for physicians. We would like to stress that the results do not implicate that patients who do not meet all indicators have been treated incor-rectly. Certain medical complexity can be a valid reason to divert from TO or any other guidance protocols, if doing so benefits the individual patient. TO’s potential lies in identifying and interpreting significant differ-ences on a group level, rather than advocating indica-tor-driven clinical decision-making.
Focusing on improving average score on TO will optimise patient care, and probably reduce healthcare costs.16 Cost-effectiveness of healthcare is an important debate in both the Dutch and worldwide healthcare.17 18 Unchecked expenses are to be increasing significantly in the upcoming years on the demand side due to the ageing of the population. On the supply side, new expensive medical technology and medication to treat the chron-ically ill patient, for example, with a malignancy, will be available. Although these developments are widely encouraged, it also faces economic and operational chal-lenges. The healthcare sector can aggress these challenges when using advanced data analytics as portrayed before in other sectors such as industry and aviation. The potency of improvement that can be reached by applying such a strategy of developing an integral chain of result-oriented indicators is evident.19
GeneralisabilityThe external validity of this study’s methods is well suited beyond gastroenterology when used in the Netherlands or any country with similar forms of hospital information system data available. While the availability of data varies per country, the objective of this study to use existing data to improve providing healthcare can still be pursued.
COnClusIOnThis study shows that applying TO to existing data provides valuable insight into variance of daily clinical practice on a large scale, without additional time-consuming registra-tion. This method of TO based on hospital information system data can be applied to many clinical trajectories for monitoring and improving the clinical pathway and outcome for patients.
Author affiliations1VU University Medical Center Amsterdam, Amsterdam, The Netherlands2LOGEX, Amsterdam, The Netherlands3Department of Gastroenterology and Hepatology, Diakonessenhuis Utrecht, Utrecht, The Netherlands
4Department of Gastroenterology and Hepatology, Reinier de Graaf Hospital, Delft, The Netherlands5Institute of Health Policy Management and Evaluation, University of Toronto, Toronto, Ontario, Canada6Department of Gastroenterology and Hepatology, Erasmus MC, University Medical Center Rotterdam, Rotterdam, The Netherlands
Contributors NS and RHB collected the data. NS, RHB, MV and RdM drafted the manuscript and contributed to all other quality aspects of the study. BH was involved in the data analyses. PJdJ and VE performed critical revision of the manuscript. All authors read and approved the final manuscript.
Funding This research received no specific grant from any funding agency in the public, commercial or not-for-profit sectors.
Competing interests RHB has currently and NS had previously a relevant connection to LOGEX (Amsterdam, The Netherlands) as employees. LOGEX offers healthcare analytics to medical specialists. MV, RdM, PJdJ, BH and VE have no relevant connection to LOGEX.
Patient consent Not required.
ethics approval No ethical approval was required in this study due to patient anonymity in the database.
Provenance and peer review Not commissioned; externally peer reviewed.
data sharing statement The study brought together existing data obtained upon request and subject to license restrictions from a number of different sources. Due to the (commercially, politically, ethically) sensitive nature of the research, no source consented their data being retained or shared.
Open Access This is an Open Access article distributed in accordance with the Creative Commons Attribution Non Commercial (CC BY-NC 4.0) license, which permits others to distribute, remix, adapt, build upon this work non-commercially, and license their derivative works on different terms, provided the original work is properly cited and the use is non-commercial. See: http:// creativecommons. org/ licenses/ by- nc/ 4. 0/
reFerenCes 1. Raghupathi W, Raghupathi V. Big data analytics in healthcare:
promise and potential. Health Inf Sci Syst 2014;2:3. 2. Porter ME. What is value in health care? N Engl J Med
2010;363:2477–81. 3. Donabedian A. The quality of care. How can it be assessed? JAMA
1997;260:1743–8. 4. Mainz J. Defining and classifying clinical indicators for quality
improvement. Int J Qual Health Care 2003;15:523–30. 5. Kaplan RS, Porter ME. How to solve the cost crisis in health care.
Harv Bus Rev 2011;89:46-52, 54, 56-61 passim. 6. Kolfschoten NE, Kievit J, Gooiker GA, et al. Focusing on desired
outcomes of care after colon cancer resections; hospital variations in 'textbook outcome'. Eur J Surg Oncol 2013;39:156–63.
7. Marang-van de Mheen PJ, Dijs-Elsinga J, Otten W, et al. The relative importance of quality of care information when choosing a hospital for surgical treatment: a hospital choice experiment. Med Decis Making 2011;31:816–27.
8. Busweiler LA, Schouwenburg MG, van Berge Henegouwen MI, et al. Textbook outcome as a composite measure in oesophagogastric cancer surgery. Br J Surg 2017;104:742–50.
9. Karthaus EG, Lijftogt N, Busweiler LAD, et al. Textbook outcome: a composite measure for quality of elective aneurysm surgery. Ann Surg 2017;266:898–904.
10. von Elm E, Altman DG, Egger M, et al. The strengthening the reporting of observational studies in epidemiology (STROBE) statement: Guidelines for reporting observational studies. Int J Surg 2014;12:1495–9.
11. Eindhoven DC, van Staveren LN, van Erkelens JA, et al. Nationwide claims data validated for quality assessments in acute myocardial infarction in the Netherlands. Neth Heart J 2018;26:13–20.
12. DIS open data. http:// www. opendisdata. nl/ (accessed 29 Oct 2017). 13. Varadarajulu S, Kilgore ML, Wilcox CM, et al. Relationship among
hospital ERCP volume, length of stay, and technical outcomes. Gastrointest Endosc 2006;64:338–47.
on May 22, 2020 by guest. P
rotected by copyright.http://bm
jopen.bmj.com
/B
MJ O
pen: first published as 10.1136/bmjopen-2017-019405 on 1 M
10 Salet N, et al. BMJ Open 2018;8:e019405. doi:10.1136/bmjopen-2017-019405
Open Access
14. Charlson M, Wells MT, Ullman R, et al. The Charlson comorbidity index can be used prospectively to identify patients who will incur high future costs. PLoS One 2014;9:e112479.
15. Neil W, Wagle M. Implementing Patient-Reported Outcome Measures (PROMs). NEJM Catal 2016.
16. Lawson EH, Hall BL, Louie R, et al. Association between occurrence of a postoperative complication and readmission. Ann Surg 2013;258:10–18.
17. Eichler HG, Kong SX, Gerth WC, et al. Use of cost-effectiveness analysis in health-care resource allocation decision-making: how are cost-effectiveness thresholds expected to emerge? Value Health 2004;7:518–28.
18. Klink A, Schakel HC, Visser S, et al. The arduous quest for translating health care productivity gains into cost savings. Lessons from their evolution at economic scoring agencies in the Netherlands and the US. Health Policy 2017;121:1–8.
19. Porter ME, Larsson S, Lee TH. Standardizing patient outcomes measurement. N Engl J Med 2016;374:504–6.
20. Richards J, McDonald P. Doctor-patient communication in surgery. J R Soc Med 1985;78:922–4.
21. Zolnierek KB, Dimatteo MR. Physician communication and patient adherence to treatment: a meta-analysis. Med Care 2009;47:826–34.
22. Ramirez FC, Dennert B, Sanowski RA. Success of repeat ERCP by the same endoscopist. Gastrointest Endosc 1999;49:58–61.
23. Kumar S, Sherman S, Hawes RH, et al. Success and yield of second attempt ERCP. Gastrointest Endosc 1995;41:445–7.
24. Choudari CP, Sherman S, Fogel EL, et al. Success of ERCP at a referral center after a previously unsuccessful attempt. Gastrointest Endosc 2000;52:478–83.
25. Grines CL, Marsalese DL, Brodie B, et al. Safety and cost-effectiveness of early discharge after primary angioplasty in low risk patients with acute myocardial infarction. PAMI-II Investigators. Primary Angioplasty in Myocardial Infarction. J Am Coll Cardiol 1998;31:967–72.
26. Pannu HK, Fishman EK. Complications of endoscopic retrograde cholangiopancreatography: spectrum of abnormalities demonstrated with CT. Radiographics 2001;21:1441–53.
27. Joynt KE, Jha AK. Thirty-day readmissions--truth and consequences. N Engl J Med 2012;366:1366–9.
28. Ha JF, Longnecker N. Doctor-patient communication: a review. Ochsner J 2010;10:38–43.
29. Falagas ME, Akrivos PD, Alexiou VG, et al. Patients' perception of quality of pre-operative informed consent in athens, Greece: a pilot study. PLoS One 2009;4:e8073.
30. Stoop EM, de Haan MC, de Wijkerslooth TR, et al. Participation and yield of colonoscopy versus non-cathartic CT colonography in population-based screening for colorectal cancer: a randomised controlled trial. Lancet Oncol 2012;13:55–64.
31. Póvoa P, Almeida E, Moreira P, et al. C-reactive protein as an indicator of sepsis. Intensive Care Med 1998;24:1052–6.
32. Wilson AP, Gibbons C, Reeves BC, et al. Surgical wound infection as a performance indicator: agreement of common definitions of wound infection in 4773 patients. BMJ 2004;329:720.
33. Stock C, Ihle P, Sieg A, et al. Adverse events requiring hospitalization within 30 days after outpatient screening and nonscreening colonoscopies. Gastrointest Endosc 2013;77:419–29.
34. Helderman M, Kraemer YL, Dyer J, et al. Reducing unnecessary admissions related to 1-day stays: a collaborative effort. Prof Case Manag 2008;13:318–30.
35. Zubarik R, Fleischer DE, Mastropietro C, et al. Prospective analysis of complications 30 days after outpatient colonoscopy. Gastrointest Endosc 1999;50:322–8.
36. Paterson WG, Depew WT, Paré P, et al. Canadian consensus on medically acceptable wait times for digestive health care. Can J Gastroenterol 2006;20:411–23.
37. Forbes JA, Wilkerson J, Chambless L, et al. Safety and cost effectiveness of early discharge following microscopic trans-sphenoidal resection of pituitary lesions. Surg Neurol Int 2011;2:66.
38. Jong V, Nicolaas S. Optima Grafische Communicatie. Understanding outstanding - quality assurance in colonoscopy. [s.n.]. 2012.
on May 22, 2020 by guest. P
rotected by copyright.http://bm
jopen.bmj.com
/B
MJ O
pen: first published as 10.1136/bmjopen-2017-019405 on 1 M