25
CONCEPTS OF BIOLOGY Chapter 2 CHEMISTRY OF LIFE PowerPoint Image Slideshow
| Date post: | 15-Aug-2015 |
| Category: |
Documents |
| Upload: | lumen-learning |
| View: | 206 times |
| Download: | 0 times |

CONCEPTS OF BIOLOGY
Chapter 2 CHEMISTRY OF LIFE PowerPoint Image Slideshow

FIGURE 2.1
Foods such as bread, fruit, and cheese are rich sources of biological macromolecules.
(credit: modification of work by Bengt Nyman)

FIGURE 2.2
Atoms are made up of protons and neutrons located within the nucleus, and electrons
surrounding the nucleus.

FIGURE 2.3
Arranged in columns and rows based on the characteristics of the elements, the
periodic table provides key information about the elements and how they might interact
with each other to form molecules. Most periodic tables provide a key or legend to the
information they contain.

FIGURE 2.4
The age of remains that contain carbon and are less than about 50,000 years old, such
as this pygmy mammoth, can be determined using carbon dating. (credit: Bill Faulkner/
NPS)

FIGURE 2.5
Elements tend to fill their outermost shells with electrons. To do this, they can either
donate or accept electrons from other elements.

FIGURE 2.6
The water molecule (left) depicts a polar bond with a slightly positive charge on the
hydrogen atoms and a slightly negative charge on the oxygen. Examples of nonpolar
bonds include methane (middle) and oxygen (right).

FIGURE 2.7
Hydrogen bonds form between slightly positive (δ+) and slightly negative (δ–) charges
of polar covalent molecules, such as water.

FIGURE 2.8
As this macroscopic image of oil and water show, oil is a nonpolar compound and,
hence, will not dissolve in water. Oil and water do not mix. (credit: Gautam Dogra)

FIGURE 2.9
(a) The lattice structure of ice makes it less dense than the freely flowing molecules of
liquid water. Ice’s lower density enables it to (b) float on water. (credit a: modification of
work by Jane Whitney; credit b: modification of work by Carlos Ponte)

FIGURE 2.10
When table salt (NaCl) is mixed in water, spheres of hydration form around the ions.
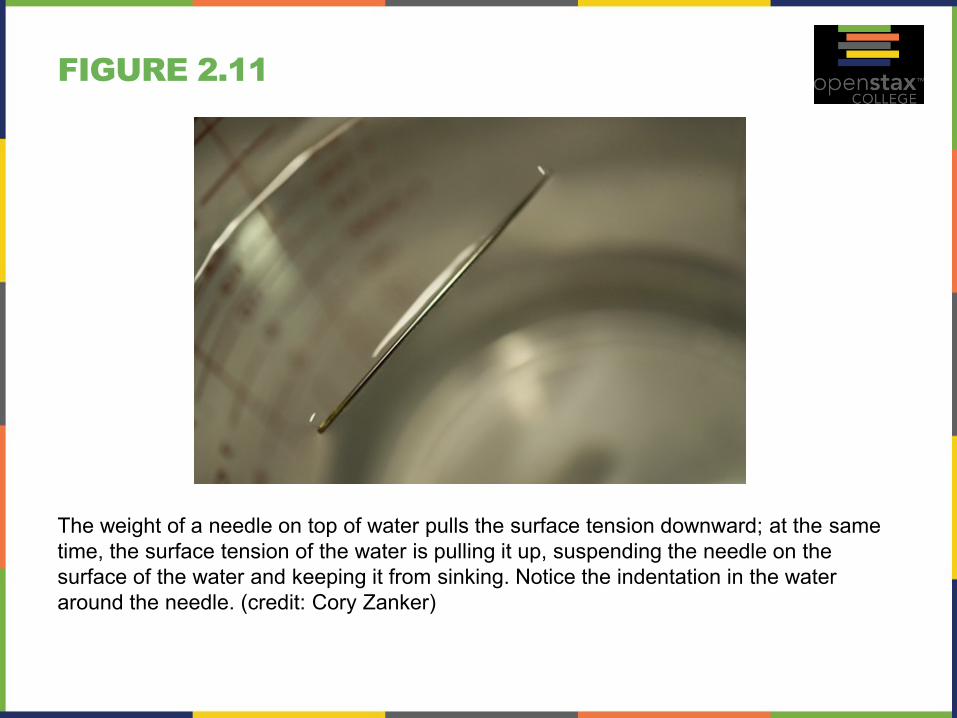
FIGURE 2.11
The weight of a needle on top of water pulls the surface tension downward; at the same
time, the surface tension of the water is pulling it up, suspending the needle on the
surface of the water and keeping it from sinking. Notice the indentation in the water
around the needle. (credit: Cory Zanker)
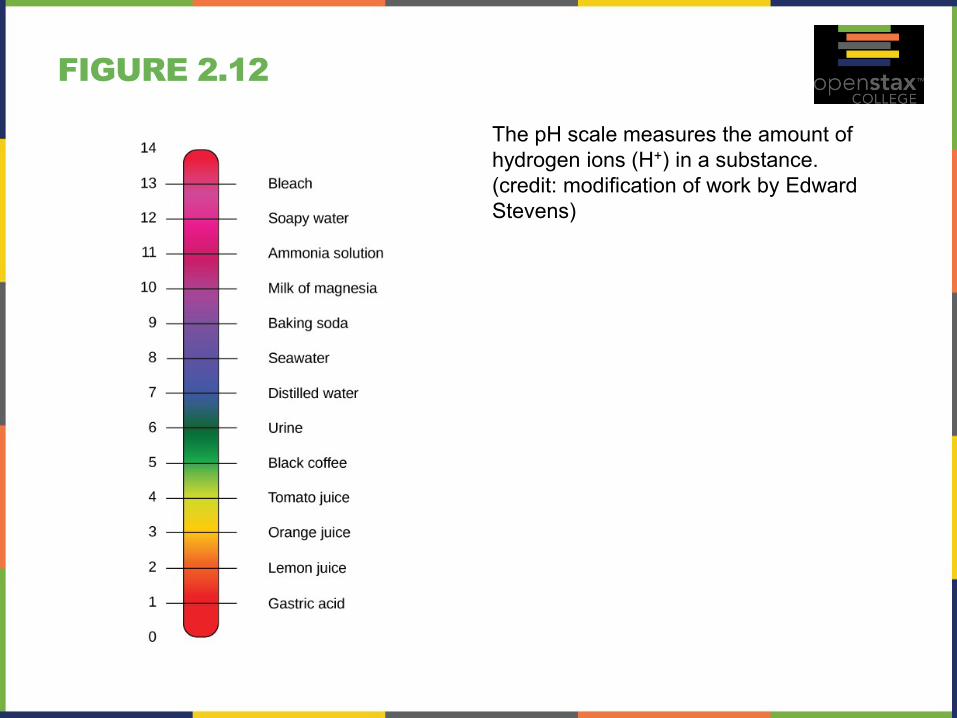
FIGURE 2.12
The pH scale measures the amount of
hydrogen ions (H+) in a substance.
(credit: modification of work by Edward
Stevens)

FIGURE 2.13
Carbon can form four covalent bonds to create an organic molecule. The simplest
carbon molecule is methane (CH4), depicted here.
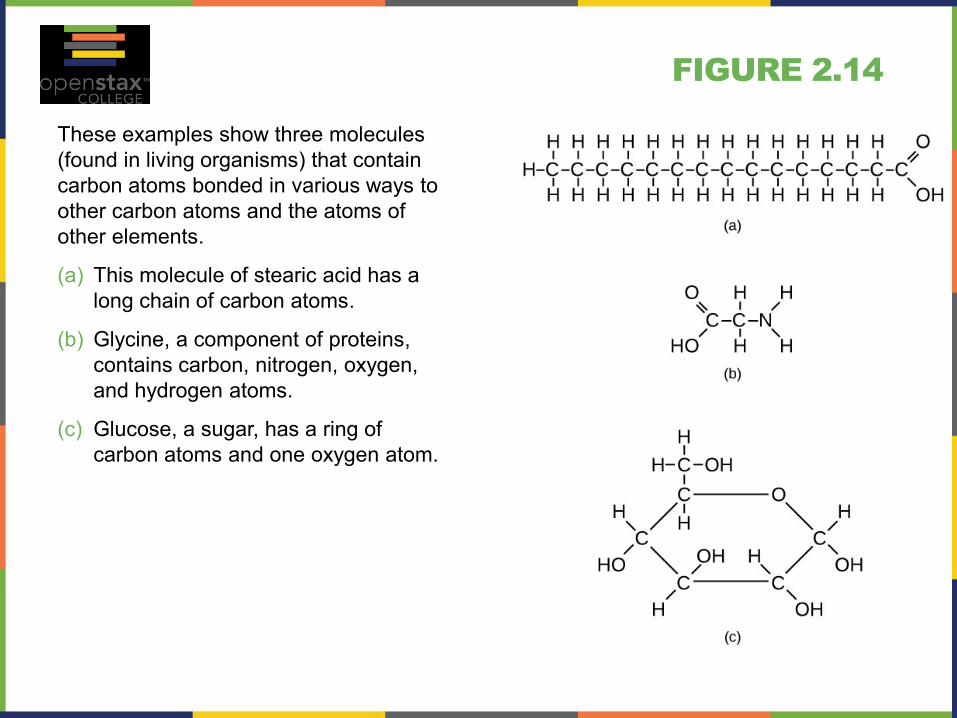
FIGURE 2.14
These examples show three molecules
(found in living organisms) that contain
carbon atoms bonded in various ways to
other carbon atoms and the atoms of
other elements.
(a) This molecule of stearic acid has a
long chain of carbon atoms.
(b) Glycine, a component of proteins,
contains carbon, nitrogen, oxygen,
and hydrogen atoms.
(c) Glucose, a sugar, has a ring of
carbon atoms and one oxygen atom.

FIGURE 2.15
Glucose, galactose, and fructose are isomeric monosaccharides, meaning that they
have the same chemical formula but slightly different structures.

FIGURE 2.16
Although their structures and functions differ, all polysaccharide carbohydrates are
made up of monosaccharides and have the chemical formula (CH2O)n.

FIGURE 2.17
Hydrophobic lipids in the fur of aquatic mammals, such as this river otter, protect them
from the elements. (credit: Ken Bosma)
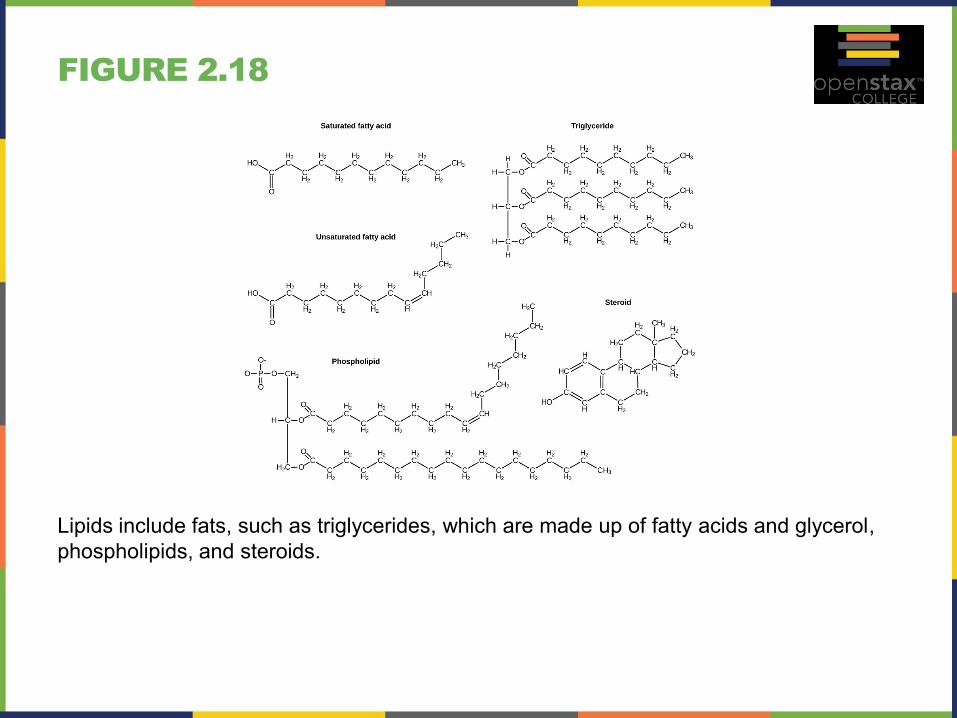
FIGURE 2.18
Lipids include fats, such as triglycerides, which are made up of fatty acids and glycerol,
phospholipids, and steroids.

FIGURE 2.19
During the hydrogenation process, the orientation around the double bonds is changed,
making a trans-fat from a cis-fat. This changes the chemical properties of the molecule.
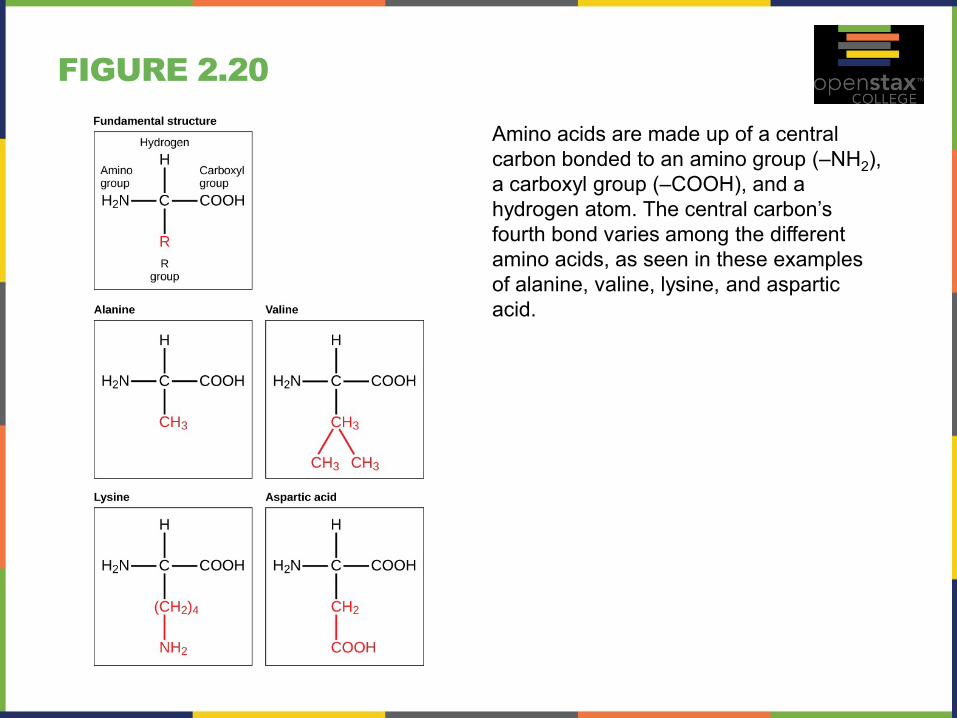
FIGURE 2.20
Amino acids are made up of a central
carbon bonded to an amino group (–NH2),
a carboxyl group (–COOH), and a
hydrogen atom. The central carbon’s
fourth bond varies among the different
amino acids, as seen in these examples
of alanine, valine, lysine, and aspartic
acid.

FIGURE 2.21
The four levels of protein structure can
be observed in these illustrations. (credit:
modification of work by National Human
Genome Research Institute)
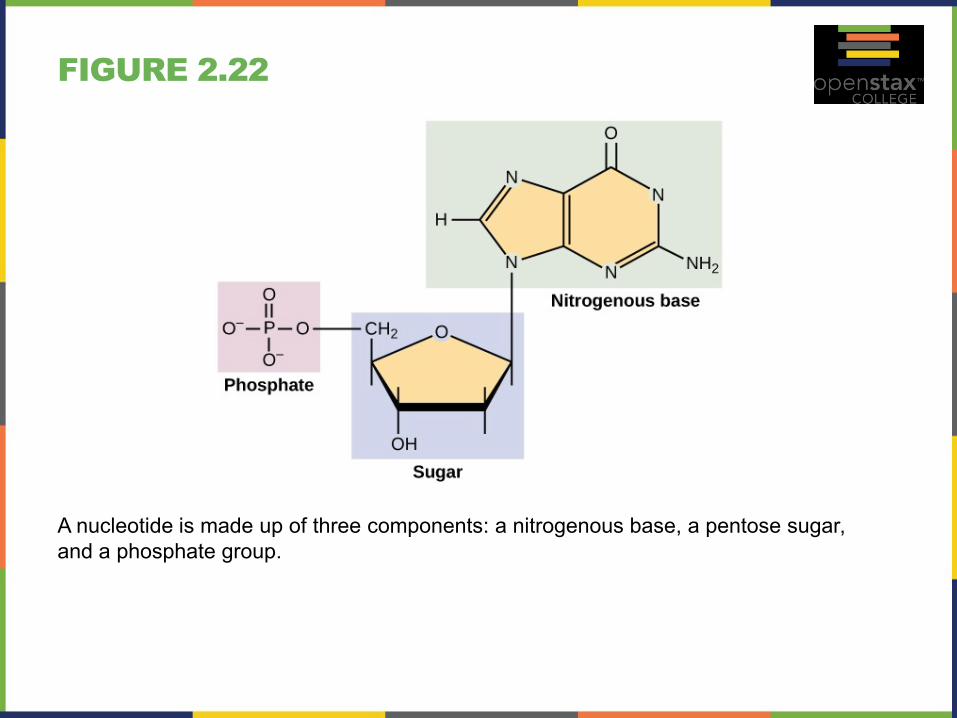
FIGURE 2.22
A nucleotide is made up of three components: a nitrogenous base, a pentose sugar,
and a phosphate group.

FIGURE 2.23
The double-helix model shows DNA as two parallel strands of intertwining molecules.
(credit: Jerome Walker, Dennis Myts)

This PowerPoint file is copyright 2011-2013, Rice University. All
Rights Reserved.


