43
Operational & Financial Metrics Operational & Financial Metrics Used in the Wireless Industry Used in the Wireless Industry A Panel Presentation A Panel Presentation
| Date post: | 14-Feb-2018 |
| Category: |
Documents |
| Upload: | truongngoc |
| View: | 213 times |
| Download: | 0 times |

Operational & Financial Metrics Operational & Financial Metrics Used in the Wireless IndustryUsed in the Wireless Industry
A Panel PresentationA Panel Presentation
Panelist:Panelist:Bruce Hoehne, CPABruce Hoehne, CPA
Partner at Kiesling Associates, LLPPartner at Kiesling Associates, LLPThe CPA’s perspectiveThe CPA’s perspective
Ann MillerAnn MillerAccounting Manager at Sierra CellularAccounting Manager at Sierra CellularThe Carriers perspectiveThe Carriers perspective
Scott Scott SodenSodenManaging Partner at Managing Partner at AlpinaAlpina Capital, LLCCapital, LLCThe Venture Capital perspectiveThe Venture Capital perspective
Robert WestRobert WestSenior Vice President/Division Manager at Senior Vice President/Division Manager at CoBankCoBankThe Bankers PerspectiveThe Bankers Perspective

BenchmarkingBenchmarking
By Bruce HoehneBy Bruce Hoehne
The CPA’s Perspective

BenchmarkingBenchmarking
The process of studying and comparing how The process of studying and comparing how other organizations perform similar processes other organizations perform similar processes and activities.and activities.
The CPA’s Perspective

Benchmarking hopefully leads the Benchmarking hopefully leads the CPA to…CPA to…
An understanding of the entityAn understanding of the entityAn understanding of the reasons behind financial An understanding of the reasons behind financial performanceperformanceAn identification of areas for audit focusAn identification of areas for audit focus
The CPA’s Perspective

Kiesling’s Dozen Key WirelessKiesling’s Dozen Key WirelessFinancial IndicatorsFinancial Indicators
Operating ResultsOperating ResultsAverage Revenue Per User (ARPU)Average Revenue Per User (ARPU)Average Revenue Per User w/o Roaming (ARPU)Average Revenue Per User w/o Roaming (ARPU)ChurnChurnRevenue Per EmployeeRevenue Per EmployeeEBITDA Margin (EM)EBITDA Margin (EM)Times Interest Earned (TIER)Times Interest Earned (TIER)Operating Margin (OM)Operating Margin (OM)
The CPA’s Perspective
Kiesling’s Dozen Key WirelessKiesling’s Dozen Key WirelessFinancial Indicators (cont.)Financial Indicators (cont.)
Financial PositionFinancial PositionQuick RatioQuick RatioCurrent RatioCurrent RatioDebt Service Coverage Ratio (DSC)Debt Service Coverage Ratio (DSC)Equity to Total Assets Equity to Total Assets –– Equity %Equity %Return on Equity (ROE)Return on Equity (ROE)
The CPA’s Perspective

Kiesling’s Dozen Key WirelessKiesling’s Dozen Key WirelessFinancial IndicatorsFinancial Indicators
Average Revenue Per User (ARPU)Average Revenue Per User (ARPU)ARPU = Revenue from ServicesARPU = Revenue from Services
# of customers with service# of customers with service2006 RCA Survey ARPU per Month is $58.612006 RCA Survey ARPU per Month is $58.61
Average Revenue Per User w/o Roaming (ARPU)Average Revenue Per User w/o Roaming (ARPU)2006 RCA Survey ARPU w/o roaming is $39.582006 RCA Survey ARPU w/o roaming is $39.58
The CPA’s Perspective
Kiesling’s Dozen Key WirelessKiesling’s Dozen Key WirelessFinancial IndicatorsFinancial Indicators
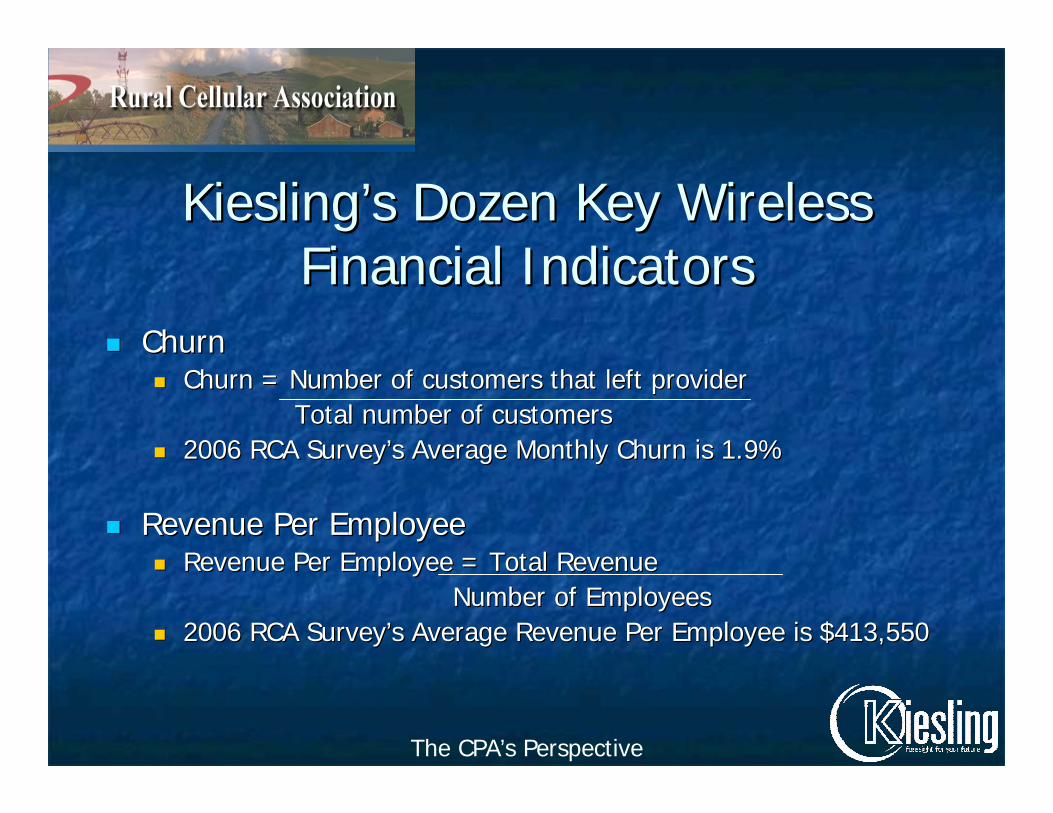
ChurnChurnChurn = Number of customers that left provider Churn = Number of customers that left provider
Total number of customersTotal number of customers2006 RCA Survey’s Average Monthly Churn is 1.9%2006 RCA Survey’s Average Monthly Churn is 1.9%
Revenue Per EmployeeRevenue Per EmployeeRevenue Per Employee = Total RevenueRevenue Per Employee = Total Revenue
Number of EmployeesNumber of Employees2006 RCA Survey’s Average Revenue Per Employee is $413,5502006 RCA Survey’s Average Revenue Per Employee is $413,550
The CPA’s Perspective

Kiesling’s Dozen Key WirelessKiesling’s Dozen Key WirelessFinancial IndicatorsFinancial Indicators
Definition: EBITDA Definition: EBITDA –– Earnings before Interest, Earnings before Interest, Taxes, Depreciation, and AmortizationTaxes, Depreciation, and Amortization
EBITDA Margin (EM)EBITDA Margin (EM)EM = EBITDAEM = EBITDA
Operating RevenuesOperating Revenues2006 RCA Survey EBITDA Margin is 29%2006 RCA Survey EBITDA Margin is 29%
The CPA’s Perspective

Kiesling’s Dozen Key WirelessKiesling’s Dozen Key WirelessFinancial IndicatorsFinancial Indicators
Times Interest Earned Ratio (TIER)Times Interest Earned Ratio (TIER)TIER = Interest ExpenseTIER = Interest Expense
(Net Income + Interest Expense)(Net Income + Interest Expense)Minimum is 1.25 to 1.50Minimum is 1.25 to 1.502006 RCA Survey Median TIER is 4.72006 RCA Survey Median TIER is 4.72006 RCA Survey Average TIER is 12.72006 RCA Survey Average TIER is 12.7
Operating Margin (OM)Operating Margin (OM)OM = Operating IncomeOM = Operating Income
Operating RevenuesOperating Revenues2006 RCA Survey OM is 17%2006 RCA Survey OM is 17%
The CPA’s Perspective

Kiesling’s Dozen Key WirelessKiesling’s Dozen Key WirelessFinancial IndicatorsFinancial Indicators
Quick RatioQuick RatioQuick Ratio = (Current Assets Quick Ratio = (Current Assets –– Inventories)Inventories)
Current LiabilitiesCurrent Liabilities2006 RCA Survey Quick Ratio is 1.252006 RCA Survey Quick Ratio is 1.25
Current RatioCurrent RatioCurrent Ratio = Current AssetsCurrent Ratio = Current Assets
Current LiabilitiesCurrent Liabilities2006 RCA Survey Current Ratio is 1.582006 RCA Survey Current Ratio is 1.58
The CPA’s Perspective

Kiesling’s Dozen Key WirelessKiesling’s Dozen Key WirelessFinancial IndicatorsFinancial Indicators
Debt Service Coverage Ratio (DSC)Debt Service Coverage Ratio (DSC)DSC = EBITDA DSC = EBITDA
Principal + Interest on DebtPrincipal + Interest on DebtMinimum is 1.50 to 2.00Minimum is 1.50 to 2.002006 RCA Survey Median DSC is 3.12006 RCA Survey Median DSC is 3.12006 RCA Survey Average DSC is 3.52006 RCA Survey Average DSC is 3.5
The CPA’s Perspective
Kiesling’s Dozen Key WirelessKiesling’s Dozen Key WirelessFinancial IndicatorsFinancial Indicators
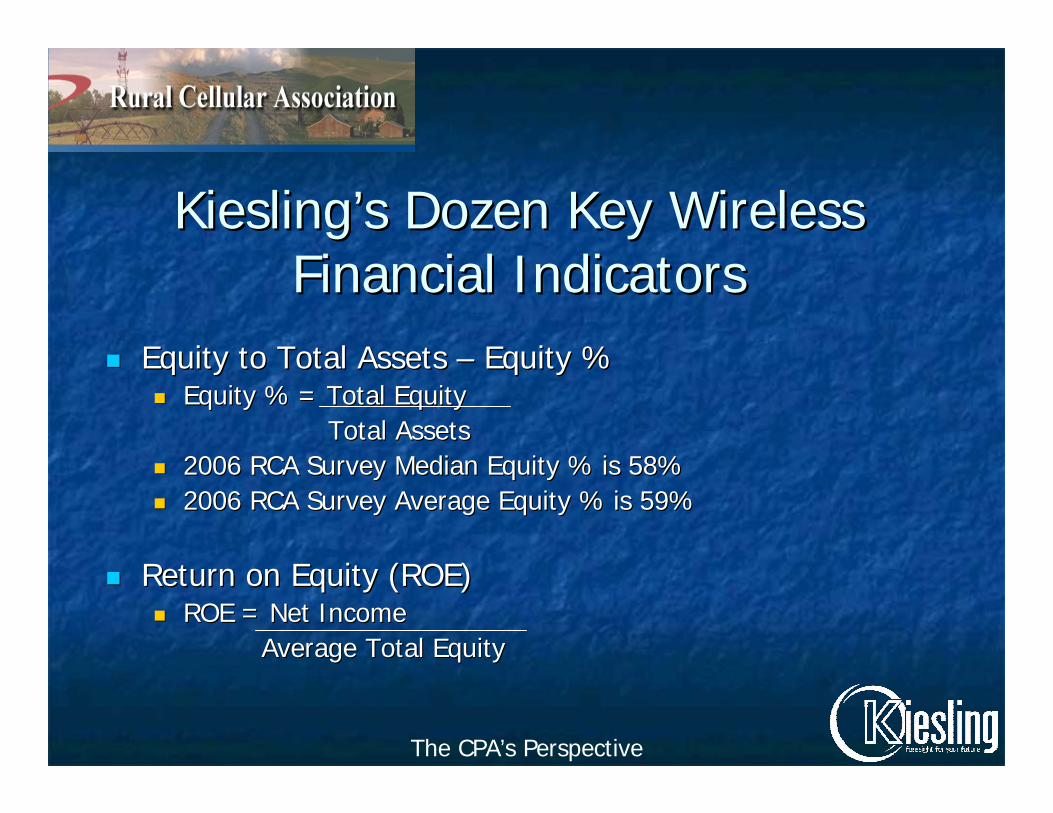
Equity to Total Assets Equity to Total Assets –– Equity %Equity %Equity % = Total EquityEquity % = Total Equity
Total AssetsTotal Assets2006 RCA Survey Median Equity % is 58%2006 RCA Survey Median Equity % is 58%2006 RCA Survey Average Equity % is 59%2006 RCA Survey Average Equity % is 59%
Return on Equity (ROE)Return on Equity (ROE)ROE = Net IncomeROE = Net Income
Average Total EquityAverage Total Equity
The CPA’s Perspective
SummarySummary
Utilize benchmarks to:Utilize benchmarks to:Better understand financial statementsBetter understand financial statementsMeasure the financial performance of your Measure the financial performance of your organizationorganizationGrow and improve your organizations performanceGrow and improve your organizations performance
The CPA’s Perspective

Wireless Financial MetricsWireless Financial Metrics
By Anne MillerBy Anne Miller
The Carriers Perspective

Profitability Measures from the Profitability Measures from the Income StatementIncome Statement
Percent of Return on Net RevenuesPercent of Return on Net RevenuesNet Profit divided by net RevenuesNet Profit divided by net Revenues
Monthly Ratio of Gross Profit to RevenuesMonthly Ratio of Gross Profit to RevenuesGross Profit divided by Gross RevenuesGross Profit divided by Gross Revenues
Operating Margin to Net RevenuesOperating Margin to Net RevenuesOperating Margin divided by Net RevenuesOperating Margin divided by Net Revenues
The Carriers Perspective

Profitability Measures from the Profitability Measures from the Balance SheetBalance Sheet
Percentage of Return on AssetsPercentage of Return on AssetsNet Profit divided by Total AssetsNet Profit divided by Total Assets
Percentage of Return on Total Capital EmployedPercentage of Return on Total Capital EmployedNet Profit divided by (Debt + Equity)Net Profit divided by (Debt + Equity)
Economic Value AddedEconomic Value AddedAnnual After Tax Net Operating Profit minus it’s Cost Annual After Tax Net Operating Profit minus it’s Cost of Capitalof Capital
The Carriers Perspective
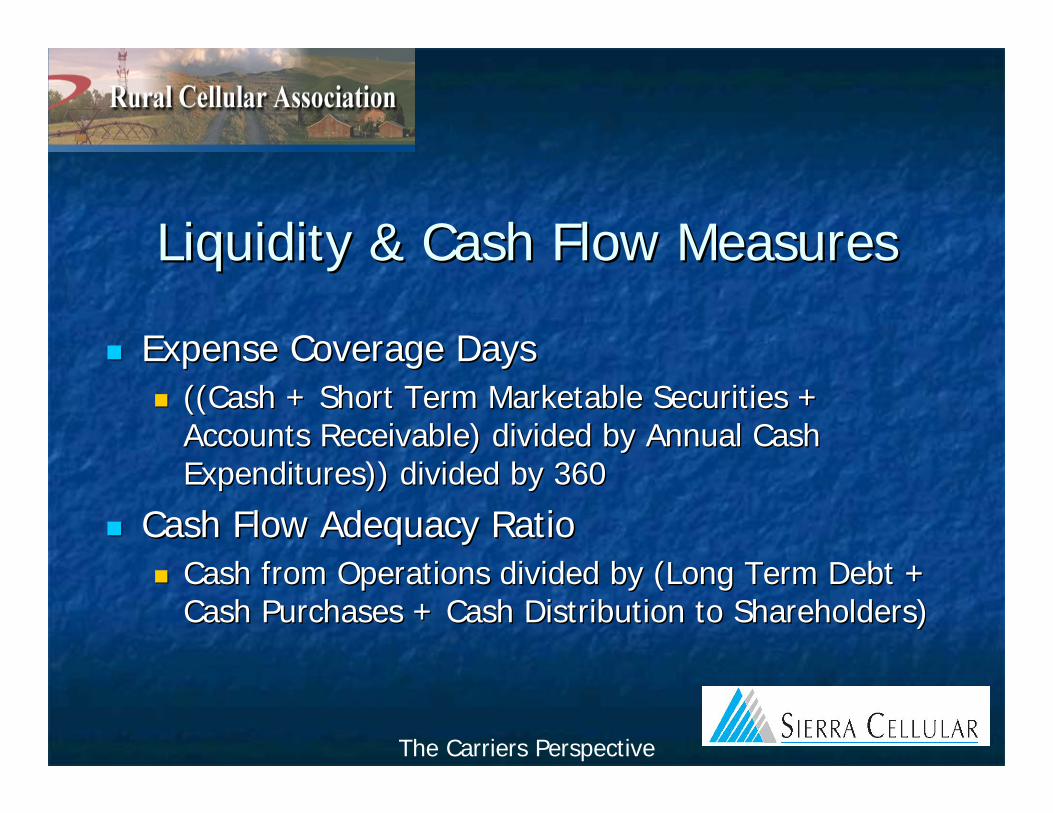
Liquidity & Cash Flow MeasuresLiquidity & Cash Flow Measures
Expense Coverage DaysExpense Coverage Days((Cash + Short Term Marketable Securities + ((Cash + Short Term Marketable Securities + Accounts Receivable) divided by Annual Cash Accounts Receivable) divided by Annual Cash Expenditures)) divided by 360Expenditures)) divided by 360
Cash Flow Adequacy RatioCash Flow Adequacy RatioCash from Operations divided by (Long Term Debt + Cash from Operations divided by (Long Term Debt + Cash Purchases + Cash Distribution to Shareholders)Cash Purchases + Cash Distribution to Shareholders)
The Carriers Perspective

Subscriber Growth MeasurementsSubscriber Growth MeasurementsCPGA [Cost per Gross Add]CPGA [Cost per Gross Add]
(Monthly Expense for Equipment Subsidy + Agent Commissions (Monthly Expense for Equipment Subsidy + Agent Commissions + Advertising + Direct Payroll Cost + Retail Store Expense) + Advertising + Direct Payroll Cost + Retail Store Expense) divided by Monthly Gross Adds.divided by Monthly Gross Adds.
Subscriber GrowthSubscriber GrowthNet Adds divided by Beginning SubscribersNet Adds divided by Beginning Subscribers
ChurnChurnCancellations divided by Average SubscribersCancellations divided by Average Subscribers
ARPU [Average Revenue per Unit]ARPU [Average Revenue per Unit](Access & Airtime Revenue) divided by Average Subscribers(Access & Airtime Revenue) divided by Average Subscribers
The Carriers Perspective

Value Metrics and Key Value Metrics and Key Indicators From a Financial Indicators From a Financial
Advisor/ Venture PerspectiveAdvisor/ Venture Perspective
By Scott By Scott SodenSoden
Alpina Capital, LLCAlpina Capital, LLCInvestment banking services for rural market Investment banking services for rural market communications providerscommunications providersProvides services in financial advisory, merger and Provides services in financial advisory, merger and acquisitions, and private placementsacquisitions, and private placementsThe partners of the firm have completed over 100 The partners of the firm have completed over 100 transactions with an aggregate value in excess of transactions with an aggregate value in excess of $1.0 billion$1.0 billionExpertise ranges from small, single market Expertise ranges from small, single market transactions, to large complextransactions, to large complex--market engagementsmarket engagements
The Venture Capital Perspective

Metric OverviewMetric Overview
Future Discounted Cash FlowsFuture Discounted Cash FlowsEBITDAEBITDARevenueRevenueSubscribersSubscribersPop’sPop’sComparable SalesComparable SalesPublic Company Trading ValuesPublic Company Trading ValuesFree Cash FlowsFree Cash Flows
The Venture Capital Perspective

Standard Theories of Valuation on Standard Theories of Valuation on Which Metrics are BasedWhich Metrics are Based
Income ApproachIncome ApproachMarket ApproachMarket ApproachReplacement ValueReplacement Value
The Venture Capital Perspective
Future Discounted Cash FlowsFuture Discounted Cash Flows
Basis of income approachBasis of income approachThe foundation for value estimateThe foundation for value estimateEstimated for three, five, and ten yearsEstimated for three, five, and ten yearsGenerally includes a terminal value based on Generally includes a terminal value based on EBITDAEBITDAMust apply a discount rateMust apply a discount rateThe problem is it is never correctThe problem is it is never correct
The Venture Capital Perspective

EBITDAEBITDAEarnings before interest, taxes, depreciation, and Earnings before interest, taxes, depreciation, and amortizationamortizationEBITDA has nothing and everything to do with EBITDA has nothing and everything to do with ValuationValuationEqualizes for comparisonsEqualizes for comparisonsThe ‘cornerstone’ for valuationThe ‘cornerstone’ for valuationDiscussed in multiples times EBITDADiscussed in multiples times EBITDA
The Venture Capital Perspective
RevenueRevenue
Basic premise assumes if revenue is ‘x’ then Basic premise assumes if revenue is ‘x’ then EBITDA or free cash flow is ‘y’EBITDA or free cash flow is ‘y’Based on percentages and industry standardsBased on percentages and industry standardsReliability is lowReliability is low
The Venture Capital Perspective

SubscribersSubscribers
The most over used by analystsThe most over used by analystsEasy metric to utilizeEasy metric to utilizeThe information is usually availableThe information is usually availableAgain, assumes if ‘x’ subscribers then ‘y’ EBITDA Again, assumes if ‘x’ subscribers then ‘y’ EBITDA or free cash flowor free cash flow
The Venture Capital Perspective

Pop’sPop’s
Again, if ‘x’ pop’s then ‘y’ EBITDA or free cash Again, if ‘x’ pop’s then ‘y’ EBITDA or free cash flowflowA last resort metricA last resort metricUtilized when nothing else is available or other Utilized when nothing else is available or other metrics are inconsistentmetrics are inconsistent
The Venture Capital Perspective

Comparable SalesComparable Sales
Based on market approach of valuationBased on market approach of valuationCompares transaction values of similar Compares transaction values of similar propertiespropertiesHistorical transactionsHistorical transactionsIf historical transactions are available method If historical transactions are available method has high reliabilityhas high reliability
The Venture Capital Perspective
Public Company Trading ValuesPublic Company Trading Values
Has very little to do with private transaction Has very little to do with private transaction valuesvaluesExcellent for comparing metricsExcellent for comparing metricsUsed as a basis since information is availableUsed as a basis since information is availableGenerally, provides a ‘ceiling’ for transaction Generally, provides a ‘ceiling’ for transaction valuesvalues
The Venture Capital Perspective
Free Cash FlowFree Cash Flow
Comes and goes in importance with analystsComes and goes in importance with analystsPopular when things are ’bad’ and unpopular Popular when things are ’bad’ and unpopular when things are ‘good’when things are ‘good’One of the major items that affected values in One of the major items that affected values in the early 2000’sthe early 2000’sWe currently have forgotten the pastWe currently have forgotten the past
The Venture Capital Perspective

SummarySummary
Future cash flows are the foundation of Future cash flows are the foundation of valuationvaluationEBITDA is the cornerstone of valuationEBITDA is the cornerstone of valuationOther metrics reflect comparable standard value Other metrics reflect comparable standard value indicatorsindicatorsPublic trading values reflect constant theoretical Public trading values reflect constant theoretical valuevalue
The Venture Capital Perspective

The Lender’s Perspective The Lender’s Perspective
By Rob WestBy Rob West
The Bankers Perspective

CoBank’s Communications PortfolioCoBank’s Communications Portfolio
Total Portfolio: 206 CustomersTotal Portfolio: 206 CustomersCommitments: $3.2 BillionCommitments: $3.2 BillionOutstandings: $2.4 BillionOutstandings: $2.4 Billion
179 Wireline Customers179 Wireline CustomersCommitments: $2.8 BillionCommitments: $2.8 BillionOutstandings: $2.1 BillionOutstandings: $2.1 Billion
27 Wireless Customers27 Wireless CustomersCommitments: $437 MillionCommitments: $437 MillionOutstandings: $321 MillionOutstandings: $321 Million Data as of 6/30/07Data as of 6/30/07
The Bankers Perspective
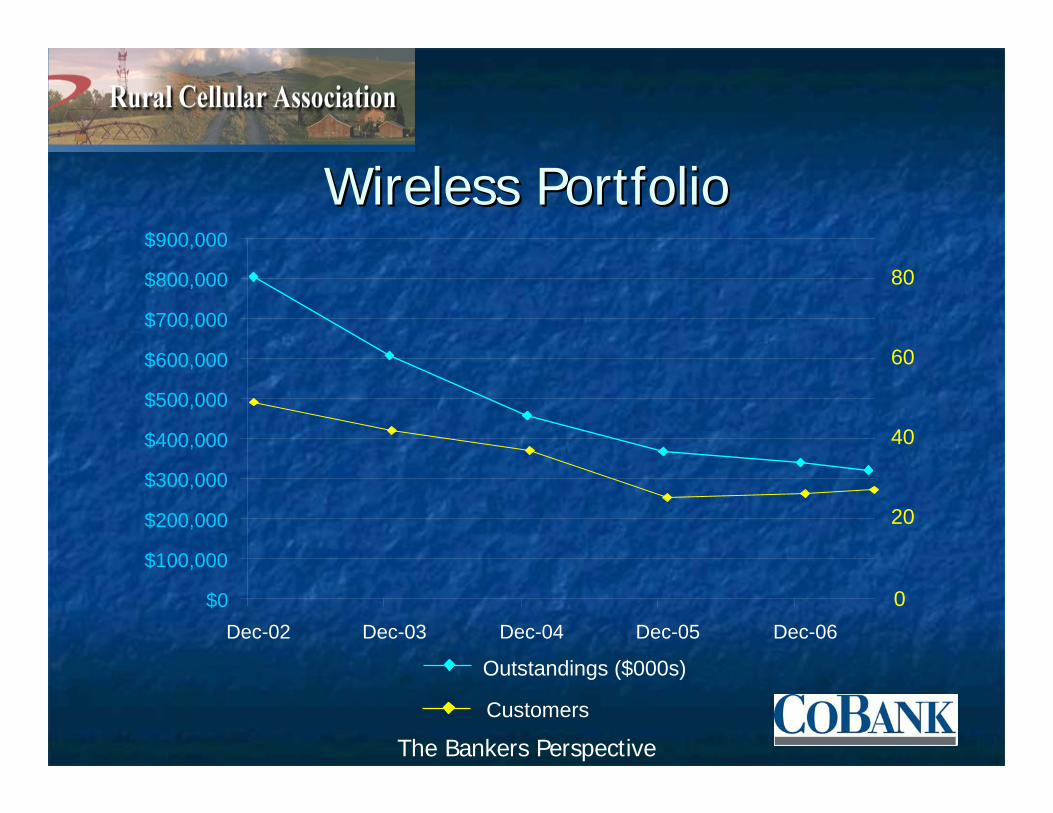
Wireless PortfolioWireless Portfolio
$0
$100,000
$200,000
$300,000
$400,000
$500,000
$600,000
$700,000
$800,000
$900,000
Dec-02 Dec-03 Dec-04 Dec-05 Dec-060
20
40
60
80
Outstandings ($000s)
Customers
The Bankers Perspective
TrendsTrends95% recent wireless transactions from existing 95% recent wireless transactions from existing customerscustomers
UpgradesUpgradesTower BuildsTower BuildsAuction ParticipationAuction ParticipationSmall AcquisitionsSmall Acquisitions
Opportunities in niche playsOpportunities in niche plays
The Bankers Perspective
Successful NichesSuccessful NichesATNATN
Provides services in U.S., Guyana, U.S. Virgin Islands & Provides services in U.S., Guyana, U.S. Virgin Islands & BermudaBermuda
Bug Tussel WirelessBug Tussel WirelessProvides roam only wireless services for national carriers Provides roam only wireless services for national carriers utilizing GSM technology in rural WI & MIutilizing GSM technology in rural WI & MI
Key to Success: Complimentary services and/or Key to Success: Complimentary services and/or strong relationship with large carriersstrong relationship with large carriers
The Bankers Perspective
ChallengesChallengesMaturation of wireless penetrationMaturation of wireless penetrationFewer opportunities in rural wirelessFewer opportunities in rural wireless
Size & ScopeSize & Scope
ETC UncertaintyETC UncertaintyReduction in roaming ratesReduction in roaming rates
The Bankers Perspective
OpportunitiesOpportunities
Auctions/Bandwidth (700 mhz, LMDS, AWS, Auctions/Bandwidth (700 mhz, LMDS, AWS, WISPs)WISPs)Crossroads Wireless/SprintCrossroads Wireless/SprintTT--MobileMobileMinimal AcquisitionsMinimal Acquisitions
The Bankers Perspective

Lending PerametersLending Perameters
Tenors up to 10 yearsTenors up to 10 years4.5 4.5 –– 6.5x Leverage6.5x LeverageLeverage decreases for higher dependencies on Leverage decreases for higher dependencies on roamingroamingETC/USF payments may be discountedETC/USF payments may be discounted
The Bankers Perspective

Questions/Comments for the PanelistQuestions/Comments for the Panelist

Thank YouThank YouBruce Hoehne, CPABruce Hoehne, CPA
Partner at Kiesling Associates, LLPPartner at Kiesling Associates, [email protected]@kiesling.com, 608, 608--664664--91109110
Ann MillerAnn MillerAccounting Manager at Sierra CellularAccounting Manager at Sierra [email protected]@stcg.net
Scott Scott SodenSodenManaging Partner at Managing Partner at AlpinaAlpina Capital, LLCCapital, [email protected]@alpinacapital.com, 303, 303--242242--57585758
Robert WestRobert WestSenior Vice President/Division Manager at Senior Vice President/Division Manager at [email protected]@cobank.com, 303, 303--740740--40304030


