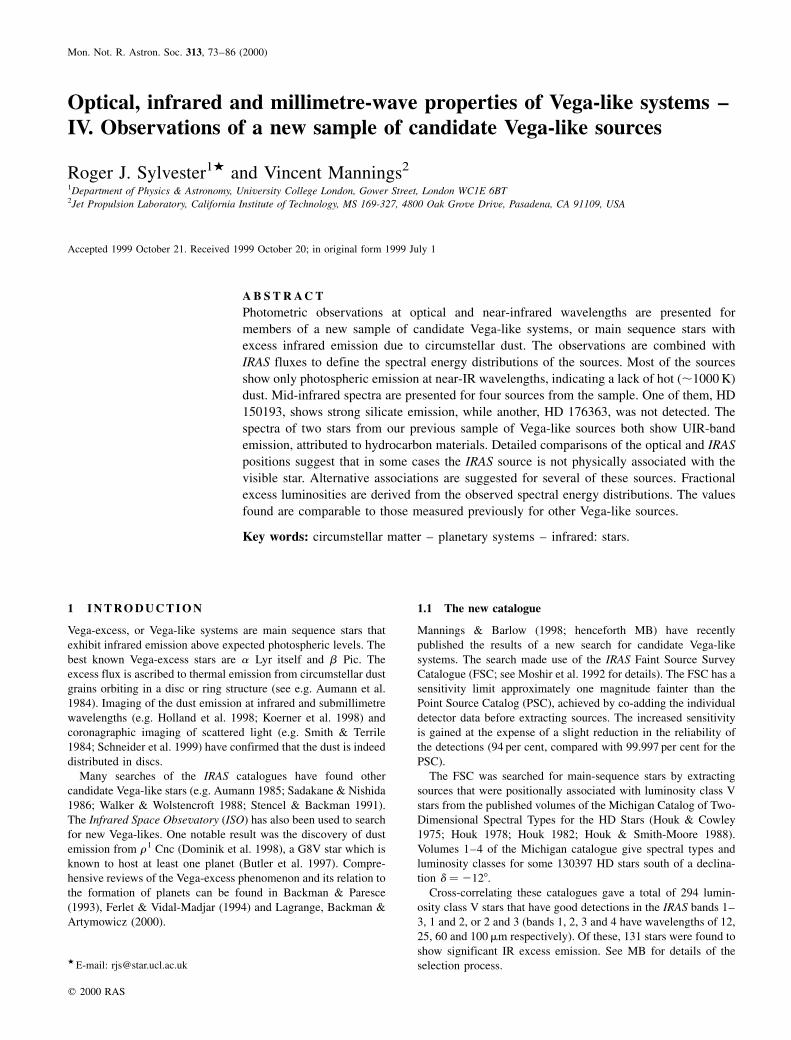
Mon. Not. R. Astron. Soc. 313, 73–86 (2000) Optical, infrared and millimetre-wave properties of Vega-like systems – IV. Observations of a new sample of candidate Vega-like sources Roger J. Sylvester 1w and Vincent Mannings 2 1 Department of Physics & Astronomy, University College London, Gower Street, London WC1E 6BT 2 Jet Propulsion Laboratory, California Institute of Technology, MS 169-327, 4800 Oak Grove Drive, Pasadena, CA 91109, USA Accepted 1999 October 21. Received 1999 October 20; in original form 1999 July 1 ABSTRACT Photometric observations at optical and near-infrared wavelengths are presented for members of a new sample of candidate Vega-like systems, or main sequence stars with excess infrared emission due to circumstellar dust. The observations are combined with IRAS fluxes to define the spectral energy distributions of the sources. Most of the sources show only photospheric emission at near-IR wavelengths, indicating a lack of hot (,1000 K) dust. Mid-infrared spectra are presented for four sources from the sample. One of them, HD 150193, shows strong silicate emission, while another, HD 176363, was not detected. The spectra of two stars from our previous sample of Vega-like sources both show UIR-band emission, attributed to hydrocarbon materials. Detailed comparisons of the optical and IRAS positions suggest that in some cases the IRAS source is not physically associated with the visible star. Alternative associations are suggested for several of these sources. Fractional excess luminosities are derived from the observed spectral energy distributions. The values found are comparable to those measured previously for other Vega-like sources. Key words: circumstellar matter – planetary systems – infrared: stars. 1 INTRODUCTION Vega-excess, or Vega-like systems are main sequence stars that exhibit infrared emission above expected photospheric levels. The best known Vega-excess stars are a Lyr itself and b Pic. The excess flux is ascribed to thermal emission from circumstellar dust grains orbiting in a disc or ring structure (see e.g. Aumann et al. 1984). Imaging of the dust emission at infrared and submillimetre wavelengths (e.g. Holland et al. 1998; Koerner et al. 1998) and coronagraphic imaging of scattered light (e.g. Smith & Terrile 1984; Schneider et al. 1999) have confirmed that the dust is indeed distributed in discs. Many searches of the IRAS catalogues have found other candidate Vega-like stars (e.g. Aumann 1985; Sadakane & Nishida 1986; Walker & Wolstencroft 1988; Stencel & Backman 1991). The Infrared Space Obsevatory (ISO) has also been used to search for new Vega-likes. One notable result was the discovery of dust emission from r 1 Cnc (Dominik et al. 1998), a G8V star which is known to host at least one planet (Butler et al. 1997). Compre- hensive reviews of the Vega-excess phenomenon and its relation to the formation of planets can be found in Backman & Paresce (1993), Ferlet & Vidal-Madjar (1994) and Lagrange, Backman & Artymowicz (2000). 1.1 The new catalogue Mannings & Barlow (1998; henceforth MB) have recently published the results of a new search for candidate Vega-like systems. The search made use of the IRAS Faint Source Survey Catalogue (FSC; see Moshir et al. 1992 for details). The FSC has a sensitivity limit approximately one magnitude fainter than the Point Source Catalog (PSC), achieved by co-adding the individual detector data before extracting sources. The increased sensitivity is gained at the expense of a slight reduction in the reliability of the detections (94 per cent, compared with 99.997 per cent for the PSC). The FSC was searched for main-sequence stars by extracting sources that were positionally associated with luminosity class V stars from the published volumes of the Michigan Catalog of Two- Dimensional Spectral Types for the HD Stars (Houk & Cowley 1975; Houk 1978; Houk 1982; Houk & Smith-Moore 1988). Volumes 1–4 of the Michigan catalogue give spectral types and luminosity classes for some 130397 HD stars south of a declina- tion d 2128. Cross-correlating these catalogues gave a total of 294 lumin- osity class V stars that have good detections in the IRAS bands 1– 3, 1 and 2, or 2 and 3 (bands 1, 2, 3 and 4 have wavelengths of 12, 25, 60 and 100 mm respectively). Of these, 131 stars were found to show significant IR excess emission. See MB for details of the selection process. q 2000 RAS w E-mail: [email protected]
Transcript
Mon. Not. R. Astron. Soc. 313, 73±86 (2000)
Optical, infrared and millimetre-wave properties of Vega-like systems ±IV. Observations of a new sample of candidate Vega-like sources
Roger J. Sylvester1w and Vincent Mannings2
1Department of Physics & Astronomy, University College London, Gower Street, London WC1E 6BT2Jet Propulsion Laboratory, California Institute of Technology, MS 169-327, 4800 Oak Grove Drive, Pasadena, CA 91109, USA
Accepted 1999 October 21. Received 1999 October 20; in original form 1999 July 1
A B S T R A C T
Photometric observations at optical and near-infrared wavelengths are presented for
members of a new sample of candidate Vega-like systems, or main sequence stars with
excess infrared emission due to circumstellar dust. The observations are combined with
IRAS fluxes to define the spectral energy distributions of the sources. Most of the sources
show only photospheric emission at near-IR wavelengths, indicating a lack of hot (,1000 K)
dust. Mid-infrared spectra are presented for four sources from the sample. One of them, HD
150193, shows strong silicate emission, while another, HD 176363, was not detected. The
spectra of two stars from our previous sample of Vega-like sources both show UIR-band
emission, attributed to hydrocarbon materials. Detailed comparisons of the optical and IRAS
positions suggest that in some cases the IRAS source is not physically associated with the
visible star. Alternative associations are suggested for several of these sources. Fractional
excess luminosities are derived from the observed spectral energy distributions. The values
found are comparable to those measured previously for other Vega-like sources.
Key words: circumstellar matter ± planetary systems ± infrared: stars.
1 I N T R O D U C T I O N
Vega-excess, or Vega-like systems are main sequence stars that
exhibit infrared emission above expected photospheric levels. The
best known Vega-excess stars are a Lyr itself and b Pic. The
excess flux is ascribed to thermal emission from circumstellar dust
grains orbiting in a disc or ring structure (see e.g. Aumann et al.
1984). Imaging of the dust emission at infrared and submillimetre
wavelengths (e.g. Holland et al. 1998; Koerner et al. 1998) and
coronagraphic imaging of scattered light (e.g. Smith & Terrile
1984; Schneider et al. 1999) have confirmed that the dust is indeed
distributed in discs.
Many searches of the IRAS catalogues have found other
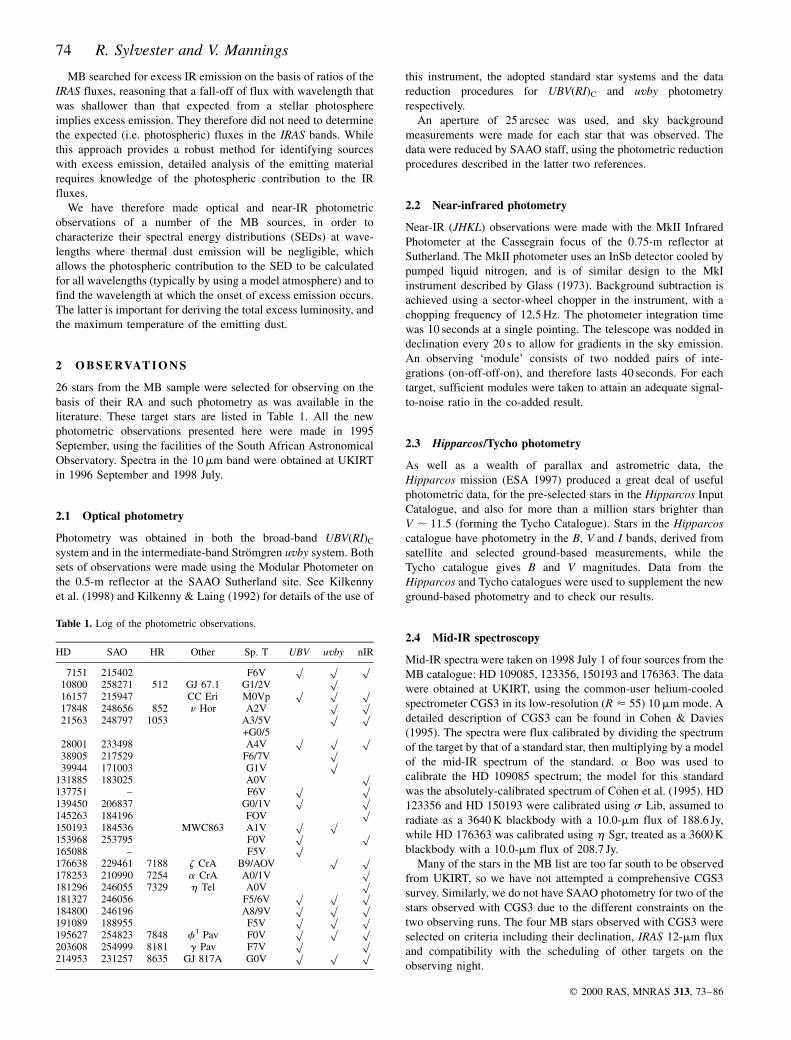
References for observations in the literature: (1) Johnson 1966, (2) Hipparcos and Tycho Catalogues, (3) Engels et al. 1981, (4) Paper I, (5) Hauck& Mermilliod 1998, (6) Hillenbrand et al. 1992.
Properties of Vega-like systems 77
law. The fluxes for stars with E�B 2 V� . 0:04 were dereddened
using a Galactic reddening curve based on the fits of Seaton
(1979) and Howarth (1983). The apparent negative reddenings
observed towards some of our targets were presumed not to have a
physical origin, but to result from errors in the observed colours,
the spectral types and/or in interpolating the intrinsic colours to a
particular spectral subtype. Effective temperatures were derived
from the uvby photometry using the grids of Moon & Dworetsky
(1985). These temperatures were then converted into spectral
classes using the Gray & Corbally (1994) calibration, allowing us
to independently check the Michigan classifications for our
sources. Good agreement was found between the Michigan and
uvby classes, with discrepancies of less than one spectral subtype
for most of our sources. For two of the three sources in Table 6
which have negative E�B 2 V� values, the uvby spectral type (F3V
for HD 7151, G0V for HD 39944) is slightly earlier than the
Michigan type. Adopting these new spectral types would give
small positive reddenings for both stars.
The SEDs are presented in Figs 1 and 2, along with normalized
Kurucz (1991) model atmospheres with temperatures appropriate
for the spectral types of the stars. HD 21563 has a composite
spectral type of A3=5� G0=5 (see Table 1). The optical SED is
consistent with a 6000 K model atmosphere (i.e. spectral type
G0V) and no reddening. The SED presented in Fig. 1 shows the
6000-K atmosphere and the observed fluxes with no dereddening
applied. If, however, the A-type component dominates the optical
emission (as would be expected if both components are main-
sequence stars and lie at the same distance), then a reddening of
E�B 2 V� < 0:35 should be adopted.
The relative strength of the mid-IR dust emission was measured
in terms of F12;FSC=F12;p; the ratio of the IRAS 12-mm flux to the
predicted photospheric flux, derived from the normalized model
atmospheres. It is of interest to compare the SEDs obtained for the
MB catalogue with those derived in Paper 1, in order to see if the
two sets of objects have similar disc and stellar properties. All six
of the Paper 1 stars with (F12;FSC=F12;p� > 20 show clear excess
emission at H, K and L. In the new sample, there are ten stars with
similarly large F12;FSC=F12;p values. We have near-IR photometry
for seven of these stars, and only one of them, HD 150193, shows
strong near-IR excess like the Paper 1 stars (HD 145263 appears
to show a small excess at L, but the error on this measurement is
rather large).
There does, therefore, appear to be a significant difference
between the dust emission properties of the two groups of stars.
The apparent sudden onset of dust emission, from being negligible
at L, to more than an order of magnitude greater than the
photosphere at 12mm, is very remarkable (but see below).
3.3 Positional associations
The strong excess in the IRAS bands for stars with no near-IR
excess made it worthwhile to re-examine some of the associations
between IRAS sources and HD stars proposed by MB.
We searched the Tycho astrometric results to obtain accurate
optical co-ordinates for our stars and computed the separation
between the optical and IRAS FSC positions. The results are given
in Table 6. The proper motions of the sources in the ,8-year
interval between the IRAS and Hipparcos missions were taken into
account when determining the separations. The ratio F12;FSC=F12;pis plotted against these separations in Fig. 3. Inspection of Fig. 3
reveals that most of the sources with substantial 12-mm excesses
have large separations (*20 arcsec) between the IRAS and optical
positions. By contrast, for most of the stars with F12;FSC=F12;p , 1;i.e. where the IRAS flux is dominated by photospheric emission,
the optical and IRAS sources coincide to within 10 arcsec. If the IR
flux from all our sources was truly circumstellar emission, one
would expect that the typical separation for stars with large
excesses would be the same as for stars with small excesses. The
major axis of the FSC positional uncertainty ellipse is typically
10±20 arcsec for our sources, consistent with the separations of
the low-excess sources, but smaller than those of the high-excess
sources. It therefore appears that the MB associations between the
optical and IRAS sources for source separations *20 arcsec are
questionable.
Searching the Tycho catalogue showed that the IRAS FSC
source associated by MB with HD 7151 lies nearer to the M2 star
CPD-43 142. Fitting a 2500-K blackbody to the Tycho V
magnitude of this star gave good agreement to the IRAS data.
We therefore conclude that CPD-43 142, not HD 7151, is the true
IR source. In all other cases, the Tycho data showed no star nearer
to the IRAS position than the HD star listed by MB.
We investigated further by conducting searches of the HST
Guide Star Catalog and USNO PMM astrometric catalogue,
centred on the IRAS FSC positions. These catalogues are based on
Schmidt photographic surveys, and have a fainter limiting
magnitude than Tycho. We also searched the SIMBAD database
and the Digital Sky Survey images to check for other possible
associations. In eleven cases (see Table 7), other sources were
found which lay closer to the IRAS position than did the HD stars
associated by MB. For six of these, the alternative association
seems more plausible than the MB star; this was typically because
the alternative candidate lay within a few arcseconds of the IRAS
q 2000 RAS, MNRAS 313, 73±86
Table 6. Derived quantities. Tabulated are the reddening E�B 2 V�,the ratio of the IRAS 12-mm flux to the expected photospheric flux,the fractional excess luminosity and the separation (in arcsec)between the IRAS and optical positions. Values in parenthesesindicate stars for which the association between the IRAS and HDobjects is questionable.
position and was likely to be bright in the IR. For the remaining
five objects, it is more difficult to determine whether the
alternative optical source is the true counterpart of the IRAS
source: ESO 488241 and GSC08401200331 are not very close to
the IRAS position, while GSC09039200816 is faint but not red
(B < 11:1; R < 11:4), and so is likely to be even fainter than HD
153968 at 12mm. USNO 0450202210000 and 0600217362689
are very faint (R < 18 and 17 respectively) and are also not too
close to the IRAS position.
In the other 16 cases, the MB star was the most likely optical
counterpart to the IRAS source. These objects are generally the
sources with low 12-mm excess fluxes and small separations
between the IRAS and optical positions.
Several of the `alternative' associations are cool stars: CPD-43
142 has spectral type M2, IK Lup is an M0 T Tauri star, V2090
Sgr is a Mira variable, and GSC07839200442 and GSC08401200331 have approximate B 2 R colours (from the USNO
catalogue) of 3.7 and 1.9 respectively. IRAS 1802724455 was
found by te Lintel Hekkert et al. (1991) to show double-peaked
OH maser emission at 1612 MHz, and so is presumably an
optically-faint OH/IR star. Two of the other potential counterparts
are galaxies: NGC 1574 and ESO 488241.
q 2000 RAS, MNRAS 313, 73±86
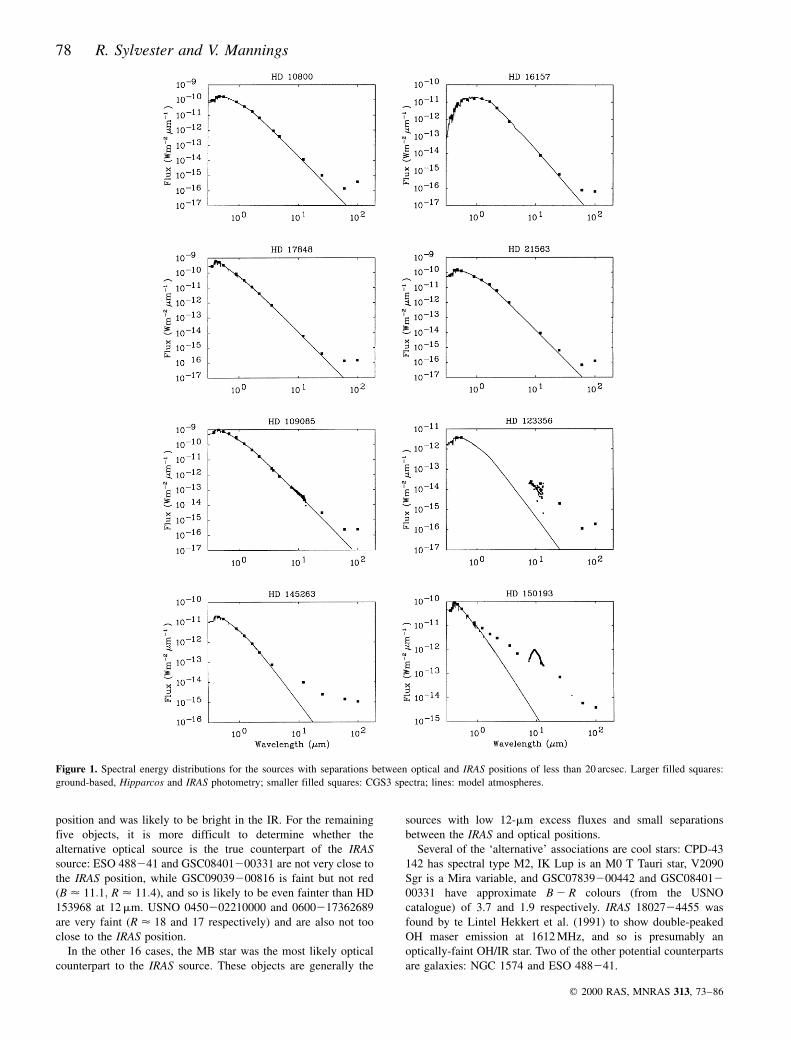
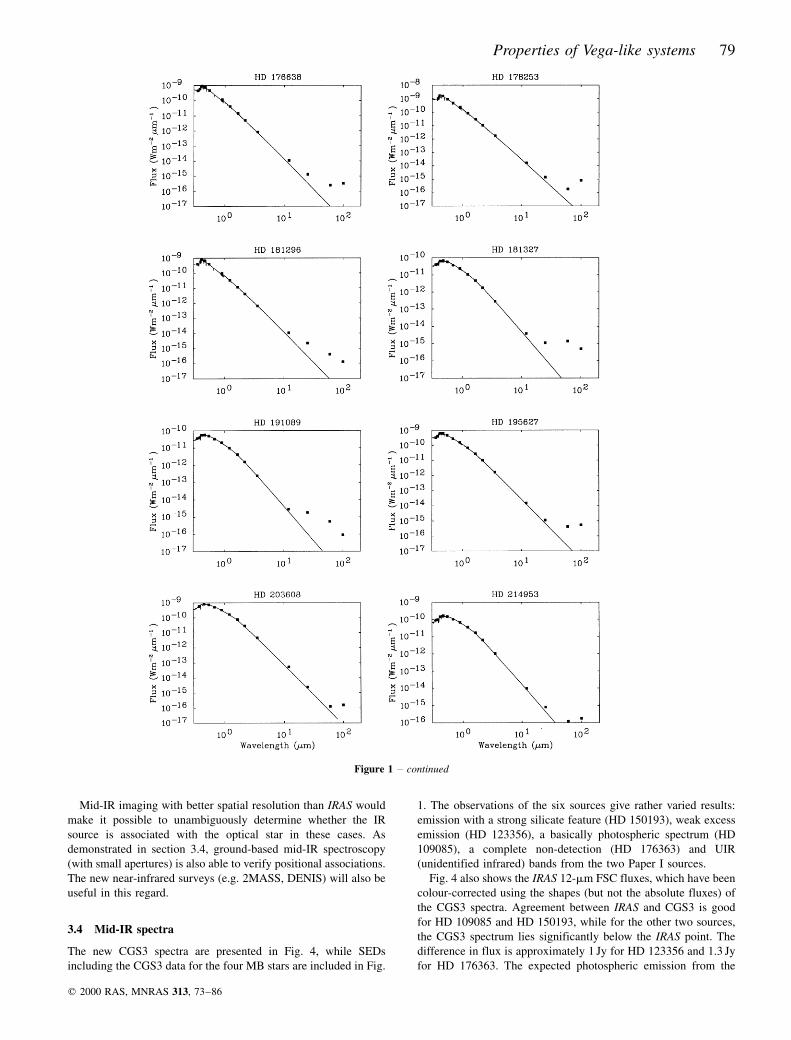
Figure 1. Spectral energy distributions for the sources with separations between optical and IRAS positions of less than 20 arcsec. Larger filled squares:
ground-based, Hipparcos and IRAS photometry; smaller filled squares: CGS3 spectra; lines: model atmospheres.
Properties of Vega-like systems 79
Mid-IR imaging with better spatial resolution than IRAS would
make it possible to unambiguously determine whether the IR
source is associated with the optical star in these cases. As
demonstrated in section 3.4, ground-based mid-IR spectroscopy
(with small apertures) is also able to verify positional associations.
The new near-infrared surveys (e.g. 2MASS, DENIS) will also be
useful in this regard.
3.4 Mid-IR spectra
The new CGS3 spectra are presented in Fig. 4, while SEDs
including the CGS3 data for the four MB stars are included in Fig.
1. The observations of the six sources give rather varied results:
emission with a strong silicate feature (HD 150193), weak excess
emission (HD 123356), a basically photospheric spectrum (HD
109085), a complete non-detection (HD 176363) and UIR
(unidentified infrared) bands from the two Paper I sources.
Fig. 4 also shows the IRAS 12-mm FSC fluxes, which have been
colour-corrected using the shapes (but not the absolute fluxes) of
the CGS3 spectra. Agreement between IRAS and CGS3 is good
for HD 109085 and HD 150193, while for the other two sources,
the CGS3 spectrum lies significantly below the IRAS point. The
difference in flux is approximately 1 Jy for HD 123356 and 1.3 Jy
for HD 176363. The expected photospheric emission from the
q 2000 RAS, MNRAS 313, 73±86
Figure 1 ± continued
80 R. Sylvester and V. Mannings
stars, derived from fitting Kurucz model atmospheres to the
optical photometry, is also plotted in Fig. 4
Only in the case of the optically bright, nearby star HD 109085
(V � 4:3; 18 pc) is the photosphere bright enough in the IR to be
detected by CGS3 with the modest integration times that we used.
In fact, we find that 75±90 per cent of the observed flux over the
whole observed wavelength range can be attributed to photo-
spheric emission. The excess spectrum, after subtracting the
model atmosphere, is approximately constant at Fl <1:2 � 10214 Wm22mm21 W shortwards of 11mm, then tends
towards zero for the remainder of the spectrum. The CGS3
spectrum and the IRAS photometry are consistent with weak
excess emission arising from material at temperatures of a few
hundred K. Such emission would give a fractional excess
luminosity LIR=Lp of approximately 4 � 1024.
It is clear that although our observed flux for HD 123356 lies
significantly below the IRAS measurement, we still detect
substantial excess emission from this source. The ratio of observed
to photospheric flux at 10.0mm is approximately 27. The IRAS
12-mm flux was measured with a beam substantially larger than
the 5.5-arcsec aperture employed with CGS3, so it is possible that
the IR emission is extended, and roughly half of the total flux
q 2000 RAS, MNRAS 313, 73±86
Figure 2. Spectral energy distributions for the sources where the optical and IRAS positions are separated by more than 20 arcsec. Filled squares: ground-
based, Hipparcos and IRAS photometry; small open squares: 3-s upper limits derived from CGS3 data (see text); lines: model atmospheres.
Properties of Vega-like systems 81
arises from outside the CGS3 beam. HD 123356 is listed in the
Washington double star catalogue as having a companion
separated by 2.5 arcsec, and some 2.2 mag fainter in V. Pointing
at the primary star would therefore put the secondary close to the
edge of the 5.5-arcsec diameter beam of CGS3. If a substantial
portion of the IR emission arises from the secondary star, CGS3
might not have detected all of the flux. The spectrum shows a
continuum decreasing with wavelength, and no evidence of
silicate or SiC in emission or absorption, or of the UIR bands. The
steep increase to longer wavelengths beyond 13mm is probably
spurious, due to imperfect cancellation of atmospheric absorption.
The spectrum of HD 150193 shows a very strong silicate
emission feature, peaking at 9.3mm, somewhat short of the
canonical peak wavelength of 9.7mm. This feature rises above
strong excess continuum emission (see Fig. 1). Even at 7.5mm,
where the silicate feature is weak and the photospheric emission is
relatively strong, the observed flux is some 65 times stronger than
the expected continuum flux. As well as appearing in the MB
catalogue, HD 150193 is classed as a Herbig Ae star by
Finkenzeller & Mundt (1984). Inspection of its SED shows it to
have a much stronger excess than most of the other stars in the
present sample. In fact, both the 10-mm spectrum and the SED are
similar to those of HD 144432 (SAO 184124; Paper 1), another
star which has been listed as a Vega-like source and as a Herbig
Ae/Be star.
Some substructure is visible in the spectrum, appearing as
inflections or weak emission bands at 8.2 and 11.3mm superposed
on the silicate feature. Peaks at the latter wavelength can be due to
either crystalline silicates or the hydrocarbon carriers of the UIR
bands. Both UIR and crystalline silicate bands have been observed
in Herbig Ae/Be stars, for example in the ISO SWS spectrum of
HD 100546 (Malfait et al. 1998). No other UIR bands appear to be
present in the HD 150193 spectrum, and the 3.3-mm UIR band is
not seen around this source (Brooke, Tokunaga & Strom 1993), so
the observed 11.2-mm emission feature is more likely to be due to
crystalline silicates than to UIR bands. Finding candidates for the
possible 8.2-mm feature is more problematic. The standard suite
of UIR bands has peaks at 7.7 and 8.7mm, neither of which match
closely with the observed peak. Likewise, crystalline silicates do
not show features near the observed wavelength (see e.g. Koike,
Shibai & Tuchiyama 1993).
Hanner, Brooke & Tokunaga (1995) have also obtained a 10-
mm spectrum of HD 150193, and discussed the possible presence
of an 11.2-mm feature, which we can now confirm to be real.
Their spectrum also shows a dip near 9.8mm, but they were
unable to determine its reality, due to the significant telluric ozone
absorption in that wavelength region. Our spectrum shows no such
q 2000 RAS, MNRAS 313, 73±86
Figure 2 ± continued
Figure 3. Ratio of observed to stellar 12-mm flux plotted against the
separation between the the IRAS and optical positions.
Table 7. Details of the MB stars for which other possibleassociations for the IRAS sources were found. Upper group:Sources where the `alternative' association is more plausible thanthe HD star; lower group: sources with ambiguous data. See textfor details. Columns headed `sep' are the separation in arcsecbetween the IRAS FSC position and the HD star or other object.
FSC MB Association Other AssociationSource HD sep Source sep
The bands are seen in the spectra of Herbig Ae/Be stars, and in a
few T Tauri stars (Hanner, Brooke & Tokunaga 1995, 1998). Natta
& KruÈgel (1995) have modelled emission from PAHs around
young stars, and find that although late-type stars (such as T Tauri
stars and HD 34700) are predicted to emit in the UIR bands, the
features are not usually observed because they are swamped by
strong continuum emission from the star or disc.
HD 34282 and HD 142666, another Paper 1 star, both show
photometric variations indicative of variable obscuration by
circumstellar dust in an edge-on disc (Bogaert & Waelkens
1991; Meeus, Waelkens & Malfait 1998). As noted by Sylvester et
al. (1997), the distances to HD 34282 derived from the Hipparcos
parallax �163�67237 pc� and from the dereddened photometry (547 pc)
are inconsistent; this could be explained by the presence of an
additional 2.6 mag of (grey) extinction in the disc. According to
Meeus et al. HD 144432 is likely to be oriented nearly pole-on to
us. The CGS3 spectra of these three sources are significantly
q 2000 RAS, MNRAS 313, 73±86
Figure 4. CGS3 spectra of four sources from the MB catalogue. Filled circles with errorbars: CGS3 spectra; large filled squares: 12-mm IRAS fluxes; dashed
lines: predicted photospheric spectra.
Properties of Vega-like systems 83
different (see Fig. 4 and Paper 1): HD 144432 shows a very strong
silicate feature, while HD 142666 shows UIR bands and a weaker
silicate feature and HD 34282 appears to show only the UIR
bands. It is tempting to see this range of features as a sequence of
increasing suppression of the silicate feature with inclination
angle, and hence optical depth along the line of sight; however,
detailed optically-thick modelling of a large sample of Vega-like
and Herbig Ae/Be stars is required to disentangle the effects of
disc physical properties (grain composition, temperature structure
etc) and optical depth on the observed spectra.
3.5 Hertzsprung±Russell diagram
The Hipparcos parallax measurements allow us to determine the
distance and hence the luminosity of a number of our sources (see
Table 8). To do this we derived the bolometric flux density
(corrected for IS/CS extinction) by integrating under the Kurucz
model atmospheres which had been normalized to the dereddened
photometry. The luminosity can then simply be obtained by
multiplying by 4pd2 where d is the distance. This is very similar
to the method used by van den Ancker et al (1997) for their work
on Herbig Ae/Be stars. The wavelength coverage of the Kurucz
model atmospheres obviously does not extend to infinity, but the
portion of the stellar SED beyond the longest wavelength included
in the models (typically 80mm) makes a negligible contribution to
the luminosity (,1026 of the total).
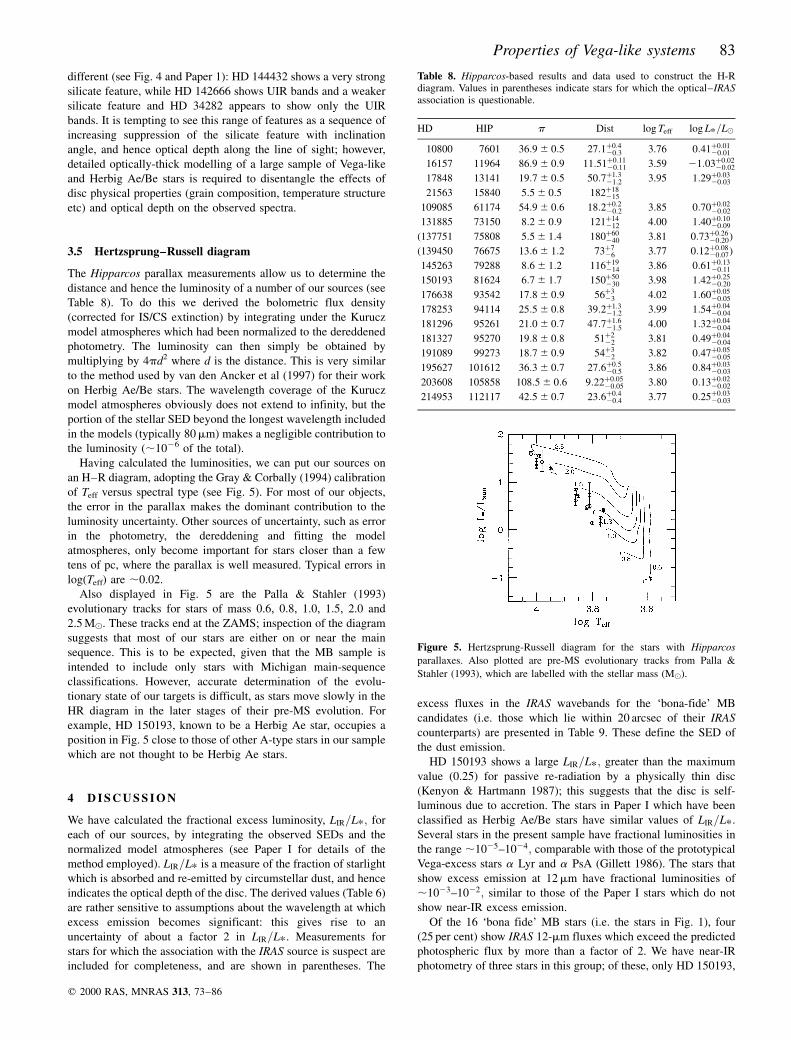
Having calculated the luminosities, we can put our sources on
an H±R diagram, adopting the Gray & Corbally (1994) calibration
of Teff versus spectral type (see Fig. 5). For most of our objects,
the error in the parallax makes the dominant contribution to the
luminosity uncertainty. Other sources of uncertainty, such as error
in the photometry, the dereddening and fitting the model
atmospheres, only become important for stars closer than a few
tens of pc, where the parallax is well measured. Typical errors in
log(Teff) are ,0.02.
Also displayed in Fig. 5 are the Palla & Stahler (1993)
evolutionary tracks for stars of mass 0.6, 0.8, 1.0, 1.5, 2.0 and
2.5 M(. These tracks end at the ZAMS; inspection of the diagram
suggests that most of our stars are either on or near the main
sequence. This is to be expected, given that the MB sample is
intended to include only stars with Michigan main-sequence
classifications. However, accurate determination of the evolu-
tionary state of our targets is difficult, as stars move slowly in the
HR diagram in the later stages of their pre-MS evolution. For
example, HD 150193, known to be a Herbig Ae star, occupies a
position in Fig. 5 close to those of other A-type stars in our sample
which are not thought to be Herbig Ae stars.
4 D I S C U S S I O N
We have calculated the fractional excess luminosity, LIR=Lp; for
each of our sources, by integrating the observed SEDs and the
normalized model atmospheres (see Paper I for details of the
method employed). LIR=Lp is a measure of the fraction of starlight
which is absorbed and re-emitted by circumstellar dust, and hence
indicates the optical depth of the disc. The derived values (Table 6)
are rather sensitive to assumptions about the wavelength at which
excess emission becomes significant: this gives rise to an
uncertainty of about a factor 2 in LIR=Lp. Measurements for
stars for which the association with the IRAS source is suspect are
included for completeness, and are shown in parentheses. The
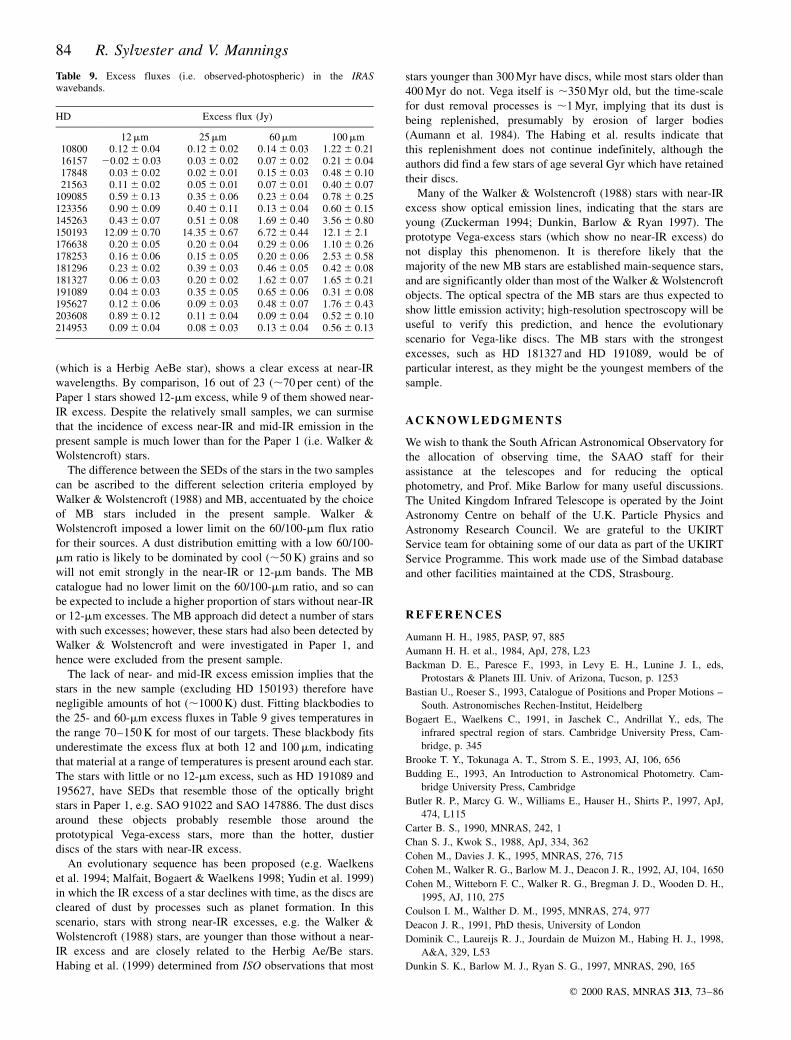
excess fluxes in the IRAS wavebands for the `bona-fide' MB
candidates (i.e. those which lie within 20 arcsec of their IRAS
counterparts) are presented in Table 9. These define the SED of
the dust emission.
HD 150193 shows a large LIR=Lp; greater than the maximum
value (0.25) for passive re-radiation by a physically thin disc
(Kenyon & Hartmann 1987); this suggests that the disc is self-
luminous due to accretion. The stars in Paper I which have been
classified as Herbig Ae/Be stars have similar values of LIR=Lp.
Several stars in the present sample have fractional luminosities in
the range ,1025±1024; comparable with those of the prototypical
Vega-excess stars a Lyr and a PsA (Gillett 1986). The stars that
show excess emission at 12mm have fractional luminosities of
,1023±1022; similar to those of the Paper I stars which do not
show near-IR excess emission.
Of the 16 `bona fide' MB stars (i.e. the stars in Fig. 1), four
(25 per cent) show IRAS 12-mm fluxes which exceed the predicted
photospheric flux by more than a factor of 2. We have near-IR
photometry of three stars in this group; of these, only HD 150193,
q 2000 RAS, MNRAS 313, 73±86
Table 8. Hipparcos-based results and data used to construct the H-Rdiagram. Values in parentheses indicate stars for which the optical±IRASassociation is questionable.
Engels D., Sherwood W. A., Wamsteker W., Schultz G. V., 1981, A&AS,
45, 5
ESA 1997, The Hipparcos and Tycho Catalogues, ESA SP-1200
Ferlet R., Vidal-Madjar A., 1994, Circumstellar Dust Disks and Planet
Formation. Editions FrontieÁres, Gif sur Yvette
Finkenzeller U., Mundt R., 1984, A&AS, 55, 109
Gillett F. C., Israel F. P., 1986, Light on Dark Matter. Reidel, Dordrecht,
p. 61
Glass I. S., 1973, MNRAS, 164, 155
Gray R. O., Corbally C. J., 1994, AJ, 107, 742
Greaves J. S., Mannings V., Holland W. S., 2000, Icarus, in press
Habing H. J. et al., 1999, Nat, 401, 456
Hanner M. S., Brooke T. Y., Tokunaga A. T., 1995, ApJ, 438, 250
Hanner M. S., Brooke T. Y., Tokunaga A. T., 1998, ApJ, 502, 871
Hauck B., Mermilliod M., 1998, A&AS, 129, 431
Hillenbrand L. A., Strom S. E., Vrba F. J., Keene J., 1992, ApJ, 397, 613
Holland W. S. et al., 1998, Nat, 392, 788
Houk N., 1978, Michigan Catalogue of Two-Dimensional Spectral Types
for the HD Stars, Vol. 2. Univ. Michigan, Ann Arbor
Houk N., 1982, Michigan Catalogue of Two-Dimensional Spectral Types
for the HD Stars, Vol. 3. Univ. Michigan, Ann Arbor
Houk N., Cowley A. P., 1975, Michigan Catalogue of Two-Dimensional
Spectral Types for the HD Stars, Vol. 1. Univ. Michigan, Ann Arbor
Houk N., Smith-Moore M., 1988, Michigan Catalogue of Two-Dimen-
sional Spectral Types for the HD Stars, Vol. 4. Univ. Michigan, Ann
Arbor
Howarth I. D., 1983, MNRAS, 203, 301
Johnson H. L., Iriarte B., Mitchell R. I., Wisniewskj W. Z., 1966, Commun.
Lunar Planetary Lab., 4, 99
Kenyon S. J., Hartmann L., 1987, ApJ, 323, 714
Kholopov P. N. et al., 1998, Combined General Catalogue of Variable
Stars. Nauka, Moscow
Kilkenny D., Laing J. D., 1992, MNRAS, 255, 308
Kilkenny D., van Wyk F., Roberts G., Marang F., Cooper D., 1998,
MNRAS, 294, 93
Koerner D. W., Ressler M. F., Werner M. W., Backman D. F., 1998, ApJ,
503, L83
Koike C., Shibai H., Tuchiyama A., 1993, MNRAS, 264, 654
Kukarkin B. V. et al., 1982, New catalog of Suspected Variable Stars.
Nauka, Moscow
Kurucz R. L., 1991, in Davis Philip A. G., Upgren A. R., Janes K. A., eds,
Precision Photometry: Astrophysics of the Galaxy. L. Davis Press,
Schenectady, p. 27
Lagrange A.-M., Backman D. A., Artymowicz P., 2000, in Mannings V.,
Boss A. P., Russell S. S., eds, Protostars and Planets IV. Univ. of
Arizona Press, Tuscon, in press
Lamla F., 1982, in Schaifers K., Voigt H. H., eds, Landolt-BoÈrnstein,
Numerical Data and Functional Relationships in Sci and Technology,
Group VI, Astronomy, Astrophysics and Space Research, Vol. 2b.
Springer-Verlag, Berlin, p. 35
Malfait K., Bogaert E., Waelkens C., 1998, A&A, 331, 211
Malfait K., Waelkens C., Waters L. B. F. M., Vandenbussche B., Huygens
E., de Graauw M. S., 1998, A&A, 332, L25
Mannings V., Barlow M. J., 1998, ApJ, 497, 330 (MB)
Mannings V., Sargent A. I., 2000, ApJ, in press
Meeus G., Waelkens C., Malfait K., 1998, A&A, 329, 131
Moon T. T., Dworetsky M. M., 1985, MNRAS, 217, 305
Moshir M. et al., 1992, Explanatory Supplement to the IRAS Faint Source
Survey, Version 2, JPL D-10015 8/92. JPL, Pasadena
Natta A., KruÈgel E., 1995, A&A, 302, 849
Palla F., Stahler S. W., 1993, ApJ, 418, 414
Sadakane K., Nishida M., 1986, PASP, 98, 689
Schmidt-Kaler Th., 1982, in Schaifers K., Voigt H. H., eds, Landolt-
BoÈrnstein, Numerical Data and Functional Relationships in Sci and
Technology, Group VI, Astronomy, Astrophysics and Space Research,
Vol. 2b. Springer-Verlag, Berlin, p. 14
Schneider G. et al., 1999, ApJ, 513, 127
Seaton M. J., 1979, MNRAS, 187, 73P
Smith B. A., Terrile R. J., 1984, Sci, 226, 1421
Stencel R. E., Backman D. E., 1991, ApJ, 75, 905
Stephenson C. B., 1973, Publ. Warner & Swasey Obs., 1d, 1
Sylvester R. J., Skinner C. J., 1996, MNRAS, 283, 457
Sylvester R. J., Barlow M. J., Skinner C. J., Mannings V., 1996, MNRAS,
279, 915 (Paper 1)
Sylvester R. J., Skinner C. J., Barlow M. J., 1997, MNRAS, 289, 831
te Lintel Hekkert P., Caswell J. L., Habing H. J., Haynes R. F., Norris R. P.,
1991, A&AS, 90, 327
Tsikoudi V., 1988, AJ, 95, 1797
Urban S. E., Corbin T. E., Wycoff G. L., Martin J. C., Jackson E. S.,
Zacharias M. I., Hall D. M., 1998, AJ, 115, 1212
van den Ancker M. E., The P. S., Tjin A Djie H., Catala C., de Winter D.,
Blondel P. F. C., Waters L. B. F. M., 1997, A&A, 324, L33
Waelkens C., Bogaert E., Waters l.B.F.M., 1994, in The P. S., Perez M. R.,
van den Heuvel E. P. J., eds, ASP Conf. Ser. Vol. 62, The Nature and
Evolutionary Status of Herbig Ae/Be Stars. Astron. Soc. Pac., San
Francisco, p. 405
Walker H., Wolstencroft R. D., 1988, PASP, 100, 1509
Whitelock P. A., Menzies J. W., Catchpole R. M., Feast M. W., Marang F.,
1991, MNRAS, 250, 638
Whitelock P., Menzies J., Feast M., Catchpole R., Marang F., Carter B.,
1995, MNRAS 276, 219
Yudin R. V., Clarke D., Smith R. A., 1999, A&A, 345, 547
Zuckerman B., Ferlet R., Vidal-Madjar A., 1994, Circumstellar Dust Disks
and Planet Formation. Editions FrontieÁres, Gif-sur-Yvette, p. 131
A P P E N D I X A : C O M PA R I S O N O F O P T I C A L
A N D I R A S P O S I T I O N S F O R T H E M B S TA R S
As discussed in Section 3.3, the separation between the positions
of the optical star and the IRAS source can be a useful criterion for
assessing the reality of the associations proposed by MB. In Table
A1, we present the separations for all of the MB candidates which
had not been identified in previous surveys (i.e. the stars in Table 2
of MB). As for the separations in Table A1, we use the Tycho
optical positions, and include proper motions back to the epoch of
the IRAS observations. A few alternative associations, obtained
from searches of the SIMBAD database and the Tycho catalogue
are listed, along with the separations from the IRAS positions.
Relevant data from Table 7 are repeated here.
HD 71397 is not listed in the SAO or PPM (Positions and
Proper Motions; Bastian & Roeser 1993) catalogues. The position
in the HD catalogue (given with low precision) lies within 6 arcsec
of that listed for the IRAS source, which has been associated with
the carbon star CCCS 1174 (Stephenson 1973; Chan & Kwok
1988). The Tycho catalogue and the Astrographic Catalogue
(AC2000; Urban et al. 1998) both list two stars within 2 arcmin of
the HD position. The nearest (TYC 6002±616±1, separation � 6
arcsec) is at the position of the IRAS source. Tycho photometry for
this star gives B 2 V � 2:3; consistent with a carbon star, but very
red for a star classified as F8 (HD) or F3V (Michigan). The next-
nearest star to the HD position, TYC 6002±735±1, has a much
larger separation (72 arcsec), and a B 2 V colour of 0.51, much
closer to the intrinsic colours of F stars. The V magnitudes of the
two Tycho stars are similar (9.7 and 10.0 respectively) and close to
that listed in the HD catalogue (9.9). There is no star
corresponding to TYC 6002±735±1 in the SAO or PPM
catalogues. The original (BD) co-ordinates of BD-16 2450 agree
with those of this star to within 17 arcsec. Confusingly, the HD
catalogue associates BD-16 2450 with HD 71397. It appears that
although the HD position for HD 71397 is that of TYC 6002±
616±1, the HD and Michigan spectra were obtained for TYC
6002±735±1. We conclude that HD 71397 (whichever of the two
q 2000 RAS, MNRAS 313, 73±86
86 R. Sylvester and V. Mannings
stars the identifier refers to) is not a Vega-like star, since the IRAS
emission is clearly associated with the carbon star.
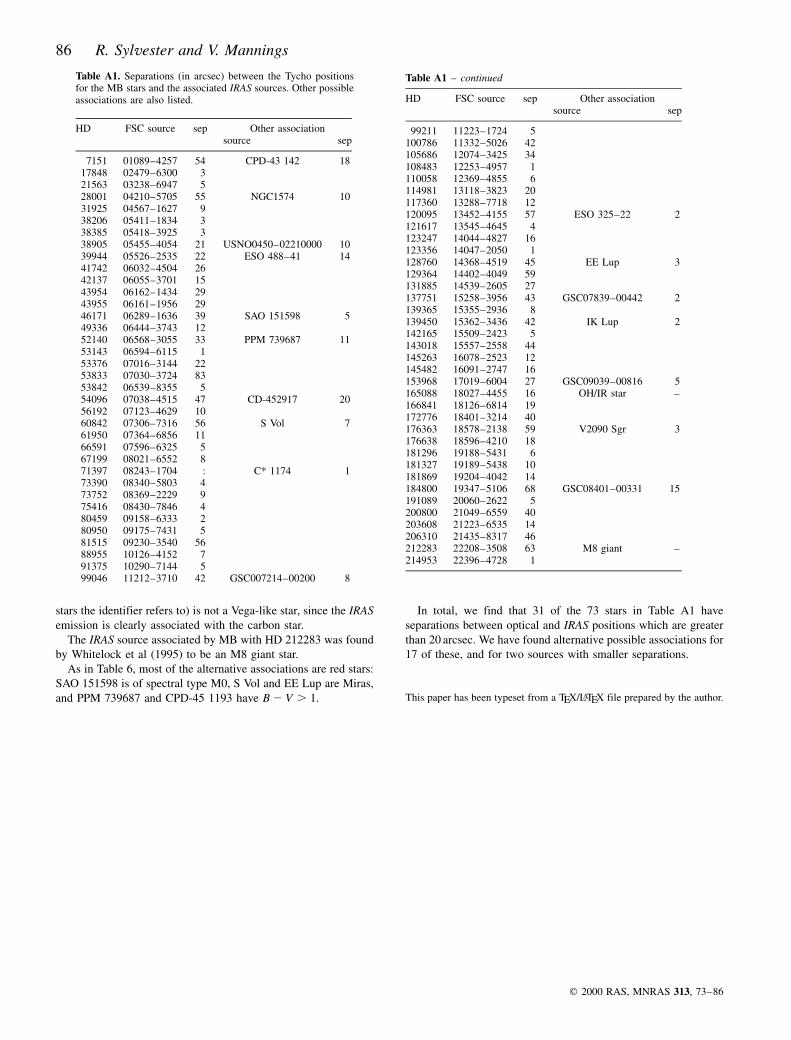
The IRAS source associated by MB with HD 212283 was found
by Whitelock et al (1995) to be an M8 giant star.
As in Table 6, most of the alternative associations are red stars:
SAO 151598 is of spectral type M0, S Vol and EE Lup are Miras,
and PPM 739687 and CPD-45 1193 have B 2 V . 1.
In total, we find that 31 of the 73 stars in Table A1 have
separations between optical and IRAS positions which are greater
than 20 arcsec. We have found alternative possible associations for
17 of these, and for two sources with smaller separations.
This paper has been typeset from a TEX/LATEX file prepared by the author.
q 2000 RAS, MNRAS 313, 73±86
Table A1. Separations (in arcsec) between the Tycho positionsfor the MB stars and the associated IRAS sources. Other possibleassociations are also listed.