HAL Id: hal-00809421 https://hal.archives-ouvertes.fr/hal-00809421v1 Submitted on 9 Apr 2013 (v1), last revised 9 Apr 2013 (v2) HAL is a multi-disciplinary open access archive for the deposit and dissemination of sci- entific research documents, whether they are pub- lished or not. The documents may come from teaching and research institutions in France or abroad, or from public or private research centers. L’archive ouverte pluridisciplinaire HAL, est destinée au dépôt et à la diffusion de documents scientifiques de niveau recherche, publiés ou non, émanant des établissements d’enseignement et de recherche français ou étrangers, des laboratoires publics ou privés. Optical microscopy and spectroscopy of analyte-sensitive functionalized gold nanoparticles in microfluidic systems Martinus H. V. Werts, Vincent Raimbault, Matthieu Loumaigne, Laurent Griscom, Olivier Français, Julien R. G. Navarro, Anne Débarre, Bruno Le Pioufle To cite this version: Martinus H. V. Werts, Vincent Raimbault, Matthieu Loumaigne, Laurent Griscom, Olivier Français, et al.. Optical microscopy and spectroscopy of analyte-sensitive functionalized gold nanoparticles in microfluidic systems. Proc. SPIE 2013, 8595, 85950W, Feb 2013, United States. 8595, pp.85950W, 2013, <10.1117/12.2001608>. <hal-00809421v1>
Transcript
HAL Id: hal-00809421https://hal.archives-ouvertes.fr/hal-00809421v1
Submitted on 9 Apr 2013 (v1), last revised 9 Apr 2013 (v2)
HAL is a multi-disciplinary open accessarchive for the deposit and dissemination of sci-entific research documents, whether they are pub-lished or not. The documents may come fromteaching and research institutions in France orabroad, or from public or private research centers.
L’archive ouverte pluridisciplinaire HAL, estdestinée au dépôt et à la diffusion de documentsscientifiques de niveau recherche, publiés ou non,émanant des établissements d’enseignement et derecherche français ou étrangers, des laboratoirespublics ou privés.
Optical microscopy and spectroscopy of analyte-sensitivefunctionalized gold nanoparticles in microfluidic systems
Martinus H. V. Werts, Vincent Raimbault, Matthieu Loumaigne, LaurentGriscom, Olivier Français, Julien R. G. Navarro, Anne Débarre, Bruno Le
Pioufle
To cite this version:Martinus H. V. Werts, Vincent Raimbault, Matthieu Loumaigne, Laurent Griscom, Olivier Français,et al.. Optical microscopy and spectroscopy of analyte-sensitive functionalized gold nanoparticles inmicrofluidic systems. Proc. SPIE 2013, 8595, 85950W, Feb 2013, United States. 8595, pp.85950W,2013, <10.1117/12.2001608>. <hal-00809421v1>
M.H.V. Werts et al., Proc. SPIE 2013, 8595, 85950W 1
Optical microscopy and spectroscopy of analyte-sensitive functionalized gold nanoparticles in microfluidic systems
Martinus H. V. Werts*a, Vincent Raimbaultb, Matthieu Loumaignea, Laurent Griscoma,Olivier Françaisa, Julien R. G. Navarroa, Anne Débarrec, Bruno Le Piouflea
aSATIE (UMR8029), Ecole Normale Supérieure de Cachan-Bretagne, CNRS, Campus de Ker Lann, F-35170 Bruz, France; bIMS (UMR5218), Université de Bordeaux, CNRS, 351 cours de la
The use of microfluidic devices for the handling and analysis of suspensions of colloidal gold particles is presented. The plasmonic particles are detected via their resonant light scattering (RLS) in a simple and versatile LED-based dark field illumination geometry. RLS enables both microscopic imaging and microspectroscopy. The measurement of the diffusion coefficient of nanoparticles in this type of devices is demonstrated. Nanoparticles are separated from small (free ligand) molecules in a continuous flow process. Reversible aggregation of functionalized particles is detected in microflow by means of RLS, which opens perspectives for the development of microfluidic bioplasmonic detection schemes.
The combination of microfluidic technology with optically responsive functionalized nanoparticles offers interesting perspectives. Microfluidic technology1 can lead to faster, lower-cost chemical and biomedical analysis2, and useful tools for cell biology3. For these applications, sensitive detection of analytes within the small microfluidic volumes is required, and functionalized nanoparticles combined with optical and spectroscopic detection methods can supply this sensitivity.
Microfluidic technology offers excellent control4 over the transport, dosage and mixing5 of fluid solutions, as well as management of heat dissipation. This is useful for synthetic chemistry6, as well as in the synthesis7,8 and functionalization of nanoparticles. In continuous flow microfluidics, where flows are laminar, control over mixing has been amply demonstrated in the form of chemical concentration gradient generators9, which allows for the parallelized screening of a host of different chemical compositions.
Microfluidic devices can also be used to measure diffusion coefficients 10–12, and we recently developed a particularly robust and simple method for this purpose, which we applied to small molecules and gold nanoparticles using transmitted light detection in a transparent elastomer-based device, giving access to the measurement of the diffusion coefficients of nonfluorescent species13. Microfluidic methods thus offer an alternative to techniques such as fluorescence correlation spectroscopy14 for studying molecular diffusion. Measurement of diffusion coefficients is of particular interest for the characterization of ligand-coated functionalized colloidal particles, for example, for identification of ligand desorption15,16 or measurement of the evolution of the hydrodynamic radius of particle assemblies.
M.H.V. Werts et al., Proc. SPIE 2013, 8595, 85950W 2
Optical spectroscopic detection with sufficient sensitivity for microfluidic applications may be achieved using functionalized nanoparticles. Inorganic colloidal nanoparticles can roughly be divided into nonconducting, semiconducting and conducting particles. Each of these groups has its own chemistry in terms of synthesis and surface functionalization. Each group of particles also has its particular optical properties. Nonconducting particles generally need dopants to display luminescence17–19. Semiconductor nanoparticles act as luminescent "quantum dots", with strongly size-dependent photophysics20. Conducting particles, in particular those of silver and gold, show a very strong optical response related to their plasmonic resonances21. For such gold and silver particles the optical cross sections can exceed their physical cross sections by a factor of 8. These 'plasmonic' nanostructures then act as antennae for electromagnetic waves of optical frequencies, and may enhance the brightness of nearby fluorescent molecules. However, for isolated fluorophore-nanoparticle assemblies in solution, quenching of the fluorescence as a result of dominating non radiative energy transfer from the fluorophore to the nanoparticle is often observed22,23.
With molecular fluorescence of nearby fluorescent labels being quenched, and plasmonic nanoparticles themselves displaying exceedingly weak intrinsic luminescence24, photoluminescent detection of noble metal nanoparticles is highly challenging. Instead, resonant light scattering (RLS) has been suggested and demonstrated25–27 to offer an alternative way of detecting particles with great sensitivity. It was RLS by metal nanoparticles that enabled Zsigmondy at the dawn of the 20th century to study the behavior of individual colloidal particles using his ultramicroscope28,29.
In a certain sense, the work we present here is the microfluidic implementation of ultramicroscopy (Figure 1). However, the detection and spectroscopic characterization of individual nano-objects is not the main goal. We will illustrate the transition from the detection of ensemble-averaged RLS signals from colloidal suspensions to the identification of individual objects, but will show that also the ensemble-RLS signals can be a useful vehicle for optically transducing (bio)chemical interactions. We recently developed spectroscopic methodology30 for the quantitative measurement of (ensemble) RLS spectra and efficiencies on suspensions of colloidal metal particles contained in standard spectroscopic cuvettes.
Figure 1. Schematic representation of a transparent (PDMS-on-glass) microfluidic device with LEDs for dark field illumination. The LED light is coupled into the PDMS which then acts as a light guide. Scattered light, as well as fluorescence are observed through the glass substrate using a microscope objective.
Here we extend our use of RLS to the detection of particles inside microfluidic devices, and demonstrate certain applications of microfluidic phenomena for the detection and handling of metal nanoparticles. RLS, like fluorescence, is a dark-field technique, and needs dark-field illumination. Such illumination is achieved here by using the (transparent elastomer-based) microfluidic devices themselves as light guides, making use of the fact that any light ray that enters the device from the sides will undergo total reflection should it reach the top (elastomer) or bottom (glass) of the device 30. The only light entering the microscope objective will be light scattered or emitted by objects inside the channel. The light sources are LEDs of various wavelengths (Figure 1). This yields compact devices that are easily fabricated, of interest for exploratory work on microfluidic processing and measurement of colloidal suspensions. Moreover, these devices can be used on any standard microscope, without the need for special dark-field optics that may not be compatible with microfluidic devices which are usually very thick objects.
M.H.V. Werts et al., Proc. SPIE 2013, 8595, 85950W 3
In the following we will give some examples of the detection and spectroscopy of gold nanoparticles in microfluidic systems using plasmonic light scattering. In particular we will demonstrate the microfluidic measurement of diffusion coefficients using RLS for detection, the separation of RLS-active particles from small fluorescent molecules, and the analyte-induced aggregation of gold nanoparticles leading to a readily detected change in RLS response. Such an analyte-induced modulation of the optical response may be employed in miniaturized biophotonic detection schemes.
2. MATERIALS AND METHODS
2.1 Microfluidic device fabrication and operation
The microfluidic device is made using a classic "soft" lithography process. Typically, a 100µm thick SU-8 layer (Microchem SU-8 3050) is spin-coated on top of a 4" silicon wafer according to the process given by the resin manufacturer. A Suss-MicroTec MJB4 mask aligner is used for the photolithography step. Poly(dimethylsiloxane) (PDMS Sylgard 184 - Dow Corning) is the material of choice for the microfluidic chip. A 10:1 mix of PDMS and its curing agent is degassed and then poured on top of the SU-8 mold in a Petri dish. The Petri dish containing the mold and the PDMS is once again degassed, and pre-cured for an hour at 65°C before the PDMS is peeled off the mold. Microfluidic chips are then cut, and inlets/outlets are punched. Microscope slides (Thermo Scientific, 90° ground edges - dimensions 26mm x 76mm x 1mm) are treated using an UV-ozone cleaner (Jelight Model 42) for 20 minutes, while the PDMS chips are treated 30 seconds. PDMS chips are then bonded on top of the treated microscope slides, and the complete assembly is cured for 12 hours at 65°C. Alternatively, a low-pressure air plasma (Harrick Plasma Cleaner PDC-002) can be used for microscope slide cleaning (30 minutes) and plasma bonding of the PDMS to the substrate microscopic glass slide (70 seconds). Microfluidic systems were operated with Aladdin syringe pumps (WPI Europe, Hertfordshire, UK) and 250µL...1000µL glass precision syringes (SGE Europe, Milton Keynes, UK). The fluids were supplied to the devices using ETFE Tefzel tubing (Upchurch Scientific, Oak Harbor, WA, USA) containing in-line filters (2 µm pore diameter, Upchurch Scientific).
2.2 Dark field illumination
LEDs (1.8 mm or 3 mm diameter, typical operation current 20 mA, Winger Electronics GmbH, Germany and Nichia, Japan) of the desired wavelengths were mounted in a 5x2 insulation-displacement connector (IDC) on a 10-wire ribbon cable. The connector was positioned in such a way that allowed the LED to illuminate the side of the PDMS device. It was reversibly bound to the substrate of the microfluidic device using adhesive polymer (UHU "Patafix", Germany). Each LED could be individually switched via a MOSFET (2N7000) controlled by the digital outputs of an Arduino microcontroller board (http://www.arduino.cc). LED power was supplied by 4 rechargeable 1.2V batteries (NiMH). Suitable resistor values were chosen to have LED currents of approximately 20 mA. The Arduino board communicated with the MicroManager software31 via a dedicated plug-in. This allows for recording of sequences of images using different sets of LEDs for illumination for each image frame.
2.3 Microscopy and microspectroscopy
The microchannels were observed on an Olympus IX71 inverted microscope, using low and moderate magnification objectives (2x, 4x, 10x, N.A. = 0.06, 0.1 and 0.3 respectively). Images were taken using a monochrome CCD camera (Thorlabs DCU223M) Thorlabs, using the LEDs as dark field illumination sources. Most image acquisition and experiment control was done via MicroManager31 software, which runs on top of ImageJ32. Additional image processing routines were implemented in Python (with the Scipy and Numpy libraries, through the Enthought Python Distribution 7.2, Enthought, Inc., Austin TX, USA). Microspectroscopic measurements of the RLS by nanoparticles in microfluidic channels were obtained by injecting light from the microscope into a fiber-coupled OceanOptics QE65000 thermoelectrically cooled backthinned CCD spectrometer (details below).
2.4 Gold nanoparticles
In this work only gold nanospheres are used, but the methods can evidently be applied to particles of different shape and composition, as long as these have a sufficiently strong RLS response. Commercially available suspensions of 50nm, 80nm and 150 diameter gold nanospheres (BBInternational, Cardiff, Wales, UK) were used as received, or diluted using double-distilled water. The particles will be referred to as AuBBI-50nm, AuBBI-80nm and AuBBI-150nm. Nanosphere concentrations were checked by UV-visible spectroscopy using extinction coefficients obtained from the specified particle diameters through known relations based on Mie theory30.
M.H.V. Werts et al., Proc. SPIE 2013, 8595, 85950W 4
Acid-sensitive thioctic acid-functionalised gold nanospheres (AuTA) were used as a model system for analyte-induced modulation of the plasmonic RLS response. These particles were obtained by functionalizing 20nm diameter gold nanospheres with thioctic acid, as described previously30. The nanospheres were synthesised using the Turkevich-Frens citrate method33. The diameter of the gold nanospheres was determined by TEM to be 20 ± 2 nm.
3. DARK-FIELD DETECTION OF RESONANT LIGHT SCATTERING IN MICROFLUIDIC DEVICES
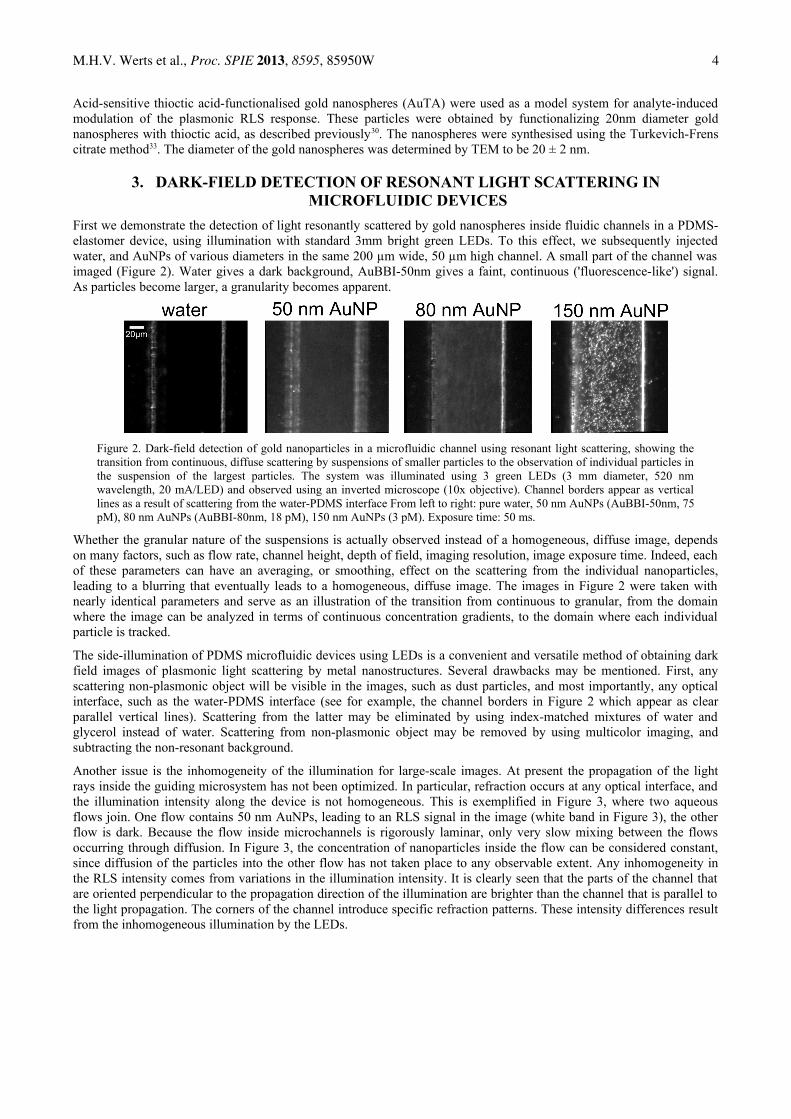
First we demonstrate the detection of light resonantly scattered by gold nanospheres inside fluidic channels in a PDMS-elastomer device, using illumination with standard 3mm bright green LEDs. To this effect, we subsequently injected water, and AuNPs of various diameters in the same 200 µm wide, 50 µm high channel. A small part of the channel was imaged (Figure 2). Water gives a dark background, AuBBI-50nm gives a faint, continuous ('fluorescence-like') signal. As particles become larger, a granularity becomes apparent.
Figure 2. Dark-field detection of gold nanoparticles in a microfluidic channel using resonant light scattering, showing the transition from continuous, diffuse scattering by suspensions of smaller particles to the observation of individual particles in the suspension of the largest particles. The system was illuminated using 3 green LEDs (3 mm diameter, 520 nm wavelength, 20 mA/LED) and observed using an inverted microscope (10x objective). Channel borders appear as vertical lines as a result of scattering from the water-PDMS interface From left to right: pure water, 50 nm AuNPs (AuBBI-50nm, 75 pM), 80 nm AuNPs (AuBBI-80nm, 18 pM), 150 nm AuNPs (3 pM). Exposure time: 50 ms.
Whether the granular nature of the suspensions is actually observed instead of a homogeneous, diffuse image, depends on many factors, such as flow rate, channel height, depth of field, imaging resolution, image exposure time. Indeed, each of these parameters can have an averaging, or smoothing, effect on the scattering from the individual nanoparticles, leading to a blurring that eventually leads to a homogeneous, diffuse image. The images in Figure 2 were taken with nearly identical parameters and serve as an illustration of the transition from continuous to granular, from the domain where the image can be analyzed in terms of continuous concentration gradients, to the domain where each individual particle is tracked.
The side-illumination of PDMS microfluidic devices using LEDs is a convenient and versatile method of obtaining dark field images of plasmonic light scattering by metal nanostructures. Several drawbacks may be mentioned. First, any scattering non-plasmonic object will be visible in the images, such as dust particles, and most importantly, any optical interface, such as the water-PDMS interface (see for example, the channel borders in Figure 2 which appear as clear parallel vertical lines). Scattering from the latter may be eliminated by using index-matched mixtures of water and glycerol instead of water. Scattering from non-plasmonic object may be removed by using multicolor imaging, and subtracting the non-resonant background.
Another issue is the inhomogeneity of the illumination for large-scale images. At present the propagation of the light rays inside the guiding microsystem has not been optimized. In particular, refraction occurs at any optical interface, and the illumination intensity along the device is not homogeneous. This is exemplified in Figure 3, where two aqueous flows join. One flow contains 50 nm AuNPs, leading to an RLS signal in the image (white band in Figure 3), the other flow is dark. Because the flow inside microchannels is rigorously laminar, only very slow mixing between the flows occurring through diffusion. In Figure 3, the concentration of nanoparticles inside the flow can be considered constant, since diffusion of the particles into the other flow has not taken place to any observable extent. Any inhomogeneity in the RLS intensity comes from variations in the illumination intensity. It is clearly seen that the parts of the channel that are oriented perpendicular to the propagation direction of the illumination are brighter than the channel that is parallel to the light propagation. The corners of the channel introduce specific refraction patterns. These intensity differences result from the inhomogeneous illumination by the LEDs.
M.H.V. Werts et al., Proc. SPIE 2013, 8595, 85950W 5
Figure 3. RLS image of a fluidic T-junction (green LED illumination), where flows of water (white arrow) and a suspension of AuBBI-50nm (black arrow) join. The exposure time was 10 seconds. A background image of a channel containing only water was subtracted. For clarity, the boundaries of the fluidic channels are indicated using dashed lines. Flow rate was 1µl min-1 at each input. The LEDs for illumination are situated at the right from the image.
The homogeneity of the dark-field illumination may be improved, for example by integrating waveguides or optical fibers into the microsystem, bringing the light directly into the observation area. However, the LED-based illumination described here is very simple to implement, brings light everywhere in the microsystem and often yields acceptable (analyzable) dark-field images enabling the rapid prototyping of nanoparticle-based microfluidic detection schemes.
4. MEASUREMENT OF DIFFUSION OF NANOPARTICLES IN MICROCHANNELS USING RLS
Mixing between two parallel laminar flows in a microfluidic channel is well known to occur only through diffusion, and is very slow (as exemplified by the absence of mixing between the two flows in Figure 3). Microfluidics offers thus the possibility to study diffusion of molecules10 and other nano-objects.We recently measured the diffusion of 13 nm gold nanospheres in a microfluidic device called the Péclet-O-Matic13 (which is basically an H-filter34). The particle concentrations were measured and imaged using transmitted light microscopy, requiring relatively high concentrations of particles. Here we demonstrate for the first time the use of RLS in imaging concentration profiles of plasmonic nanoparticles, and the microfluidic determination of their diffusion coefficient. In straight parts of a microchannel trajectory, homogeneous illumination can be obtained. Moreover, as was shown previously30, RLS intensity is proportional to the nanoparticle concentration in the very low concentration range used. Under these conditions, RLS affords reliable concentration profiles.
In the Péclet-O-Matic, the adjacent flows are allowed to interact while flowing through a very long channel (54 mm). With suitable flow rates, this give the nanoparticle enough time to diffuse. While keeping the interaction length constant (i.e. always imaging the same part of the channel), the interaction time for diffusion is varied by changing the flow rates. Figure 4 illustrates the case for AuBBI-50nm particles. Given sufficient time, the particles diffuse laterally in the channel.
Figure 4. Diffusion of 50 nm gold nanospheres in a 200 µm wide, 100 µm high Péclet-O-Matic interaction microchannel (green LED dark field illumination). The two left-most images were taken at 52mm channel length, at total flow rates of 6 µl min-1 (left) and 0.4 µl min-1. (middle), corresponding to interaction times of 10.3 s and 156 s, respectively. Right: experimental intensity profile (2 µl min-1, solid line), and theoretical profile with D = 9 x 10-12 m2 s-1 (dashed line).
M.H.V. Werts et al., Proc. SPIE 2013, 8595, 85950W 6
Analysis using a pertinent solution of the diffusion equation13 yields a diffusion coefficient of 9 x 10-12 m2 s-1, which corresponds to a hydrodynamic radius of 24 nm (water, 293K), in line with the specified nanoparticle diameter. This demonstrates how the combination of RLS and microfluidics enable the measurement of the diffusion properties of colloidal plasmonic objects.
5. PÉCLET-O-WASH: MICROFLUIDIC ANALYSIS AND PURIFICATION OF NANOPARTICLE SUSPENSIONS
Differences in diffusion coefficients can be used to separate colloidal particles (large objects) from small molecules 34. In the domain of functionalised colloidal particles this may be exploited for the separation of functionalised particles and any free ligands, either to analytical or preparative means. Centrifugation is often a very efficient means of separating colloidal nanoparticles from any excess of molecular reagents, but microfluidic separation offers mild conditions for samples that are difficult to centrifugate. Moreover, microfluidics enables purification in a continuous flow process. For these reasons we investigated a serial extraction device using four stages, turning our interest to see how diffusion-based separation would scale in practice when cascading several H-filters. In the ideal, limiting case, half of all small molecules will be removed from the suspension, at each stage, with no loss of nanoparticles.
The device architecture (dubbed 'Péclet-O-Wash') is shown in Figure 5. Two inputs are used, with one input being the solution to be purified ('solution input') and the second one being the solvent used for extracting the free molecules ('washing input'). At each stage, the flows are brought together at a T-junction, allowed to interact, with objects and molecules diffusing from the initial solution to the washing flow. At the end of each stage, another T-junction separates the flow into two parts: the waste output flow which contains mainly small molecules, and the solution output flow in which the fraction of nanoparticles has risen. The latter flow (the enriched particle solution) is re-injected into a new stage, and so on.
Figure 5. Left: Fluidic circuit of the 4-stage Péclet-O-Wash device. Right: combined RLS and photoluminescence spectra (excitation 460 nm LED) of 100x diluted samples of AuBBI-80nm/fluorescein mixtures (10-4M aqueous NaOH), at the input (before purification) and the output of the Péclet-O-Wash (after purification). The (weak) water background has been subtracted. The 460 nm peak corresponds to resonant light scattering by the gold nanoparticles, the 510 nm photoluminescence corresponds to fluorescein fluorescence.
Each H-filter stage is fed by a T-junction, and the key aspect of this architecture is to obtain identical flow rates at each T-junction input. The same condition applies to the T-junction outputs. In order to get the same contact time between the solution and the washing solvent, the four diffusion channels are designed with identical geometries. As we want identical flow rates at all T-junction inputs and outputs, we can easily express the desired flow rates in each channel. Once the flow rates are determined, the hydrodynamic resistance of each channel is calculated. Using the electric circuit analogy35, the hydrodynamic resistance can be expressed as an electrical resistance. The equivalent electric circuit is resolved using Kirchoff's laws, and the electrical resistances are converted to hydrodynamic resistances using the Hagen-Poiseuille law. These calculated values of hydrodynamic resistances are achieved by varying the length and/or width of the corresponding microchannels. In order to attain equilibrated flows for this system, the volumetric flow rate of the washing solvent has to be four times the flow rate of the suspension to be purified.
M.H.V. Werts et al., Proc. SPIE 2013, 8595, 85950W 7
The Péclet-O-Wash device was tested by injecting a mixture of fluorescein (10-5 M) and AuBBI-80nm nanoparticles (2 x 10-11 M) in slightly basic water. Fluorescein was used as a model small molecule that can easily be detected, and that does not interact with AuBBI-80nm, making it an idealised free ligand. By illuminating the device alternatively with blue LEDs (fluorescein excitation) and yellow LEDs (RLS detection of particles, without excitation of the fluorescein), dark-field images of the device could be made (Olympus U-MWB filter cube, λpass > 515 nm), confirming proper operation and equilibrated flows throughout the system, as well as the effective transfer of fluorescein from the sample to the waste channel.
The right of Figure 5 displays combined RLS+fluorescence spectra of diluted samples (1 cm cuvette) of the initial injected mixture, and the purified product under blue LED excitation. The relative particle concentration is deduced from the intensity of the scattered light from the 460 nm LED. The fluorescein concentration is obtained from the intensity of the typical 510 nm emission band which is nicely separated from the scattered light. The spectra confirm efficient removal of small fluorescein molecules, with a small (yet significant) loss of gold nanoparticles. In the ideal case, 100% of particles should be present in the purified suspension, and only a fraction 2-4 (i.e. 6.3%) of the initial fluorescein should remain. The actual values are 68% remaining particles and 10% remaining fluorescein, indicating that we have less product at the output, with less relative purity, than ideally expected.
Each of the four purification stages produces a separate waste output. A single output exists for the purified particle suspension. Spectroscopic analysis of each of the outputs of a steadily operating device enables us to draw up a mass balance for the process (Table 1). Interestingly, the first two stages display excellent performance. Most of the nanoparticles are lost in the last two stages. Several reasons for imperfect operation may exist. First, the purified output of each stage will show a slightly inhomogeneous particle concentration profile which will enter the next stage. This may be solved by integrating a homogenisation zone between stages, although this will make the device more bulky and complex. Secondly, small instabilities in flow rates caused either by the mechanical syringe pumps might compromise ideal operation, especially in the later stages. This may be alleviated by using pressure-controlled flow instead of volumetric control.
Table 1. Mass balance (percentages of initial concentrations) of the different stages of the purification process inside the 4-stage Péclet-O-matic. Data obtained by analyzing the solutions produced by the device at each output using RLS/fluorescence measurement in diluted solution (Figure 4, right top), and integrating the corresponding bands in the spectra. The values for the NP-enriched phase in the intermediate stages (1, 2, 3) were inferred from the values found for the waste output and mass conservation.
Input Stage 1 Stage 2 Stage 3 Stage 4 Overall
NP-enriched phase AuNP 100 98 92 83 68 68
fluorescein 100 59 35 19 10 10
Waste output AuNP 2 6 9 15 32
fluorescein 41 24 16 9 90
6. REVERSIBLE AGGREGATION OF ACID-SENSITIVE GOLD NANOPARTICLES IN A MICROCHANNEL STUDIED USING RLS IMAGING AND MICROSPECTROSCOPY
Sensing schemes based on the (bio)analyte-induced assembly of metal nanoparticles are currently receiving considerable attention, with assembly based on DNA strands36,37, biotin-avidin38, antibody-antigen39, cation chelation40, hydrogen bonding41,42 etc. We recently demonstrated the reversible modulation of the RLS response of thioctic-acid capped gold nanoparticles30 (AuTA) as a model system for analyte-induced assembly of plasmonic nanoparticles (Figure 6). At high pH, the carboxylic acid groups on the surface are ionized and the particles are isolated in suspension. In acidic media, where the carboxylic acid are protonated and therefore electrically neutral, the particles aggregate. This aggregation, which leads to a radical change in the plasmonic light scattering response, is reversible.
M.H.V. Werts et al., Proc. SPIE 2013, 8595, 85950W 8
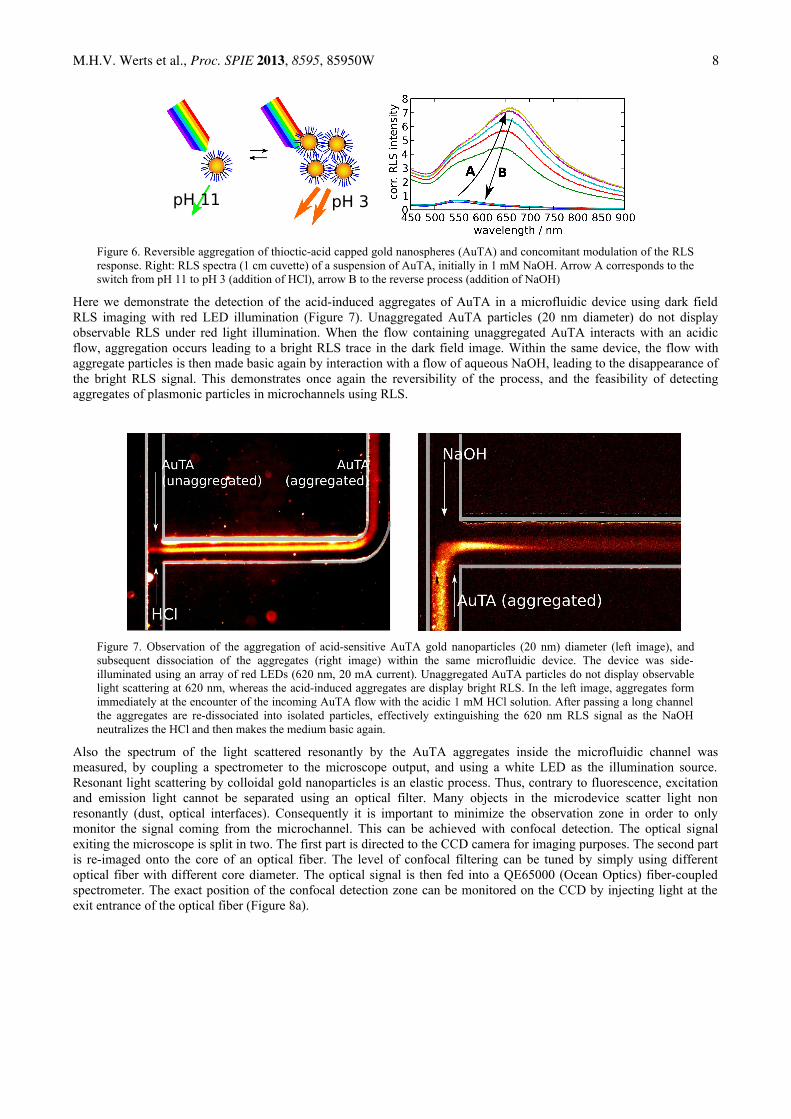
Figure 6. Reversible aggregation of thioctic-acid capped gold nanospheres (AuTA) and concomitant modulation of the RLS response. Right: RLS spectra (1 cm cuvette) of a suspension of AuTA, initially in 1 mM NaOH. Arrow A corresponds to the switch from pH 11 to pH 3 (addition of HCl), arrow B to the reverse process (addition of NaOH)
Here we demonstrate the detection of the acid-induced aggregates of AuTA in a microfluidic device using dark field RLS imaging with red LED illumination (Figure 7). Unaggregated AuTA particles (20 nm diameter) do not display observable RLS under red light illumination. When the flow containing unaggregated AuTA interacts with an acidic flow, aggregation occurs leading to a bright RLS trace in the dark field image. Within the same device, the flow with aggregate particles is then made basic again by interaction with a flow of aqueous NaOH, leading to the disappearance of the bright RLS signal. This demonstrates once again the reversibility of the process, and the feasibility of detecting aggregates of plasmonic particles in microchannels using RLS.
Figure 7. Observation of the aggregation of acid-sensitive AuTA gold nanoparticles (20 nm) diameter (left image), and subsequent dissociation of the aggregates (right image) within the same microfluidic device. The device was side-illuminated using an array of red LEDs (620 nm, 20 mA current). Unaggregated AuTA particles do not display observable light scattering at 620 nm, whereas the acid-induced aggregates are display bright RLS. In the left image, aggregates form immediately at the encounter of the incoming AuTA flow with the acidic 1 mM HCl solution. After passing a long channel the aggregates are re-dissociated into isolated particles, effectively extinguishing the 620 nm RLS signal as the NaOH neutralizes the HCl and then makes the medium basic again.
Also the spectrum of the light scattered resonantly by the AuTA aggregates inside the microfluidic channel was measured, by coupling a spectrometer to the microscope output, and using a white LED as the illumination source. Resonant light scattering by colloidal gold nanoparticles is an elastic process. Thus, contrary to fluorescence, excitation and emission light cannot be separated using an optical filter. Many objects in the microdevice scatter light non resonantly (dust, optical interfaces). Consequently it is important to minimize the observation zone in order to only monitor the signal coming from the microchannel. This can be achieved with confocal detection. The optical signal exiting the microscope is split in two. The first part is directed to the CCD camera for imaging purposes. The second part is re-imaged onto the core of an optical fiber. The level of confocal filtering can be tuned by simply using different optical fiber with different core diameter. The optical signal is then fed into a QE65000 (Ocean Optics) fiber-coupled spectrometer. The exact position of the confocal detection zone can be monitored on the CCD by injecting light at the exit entrance of the optical fiber (Figure 8a).
pH 11 pH 3
M.H.V. Werts et al., Proc. SPIE 2013, 8595, 85950W 9
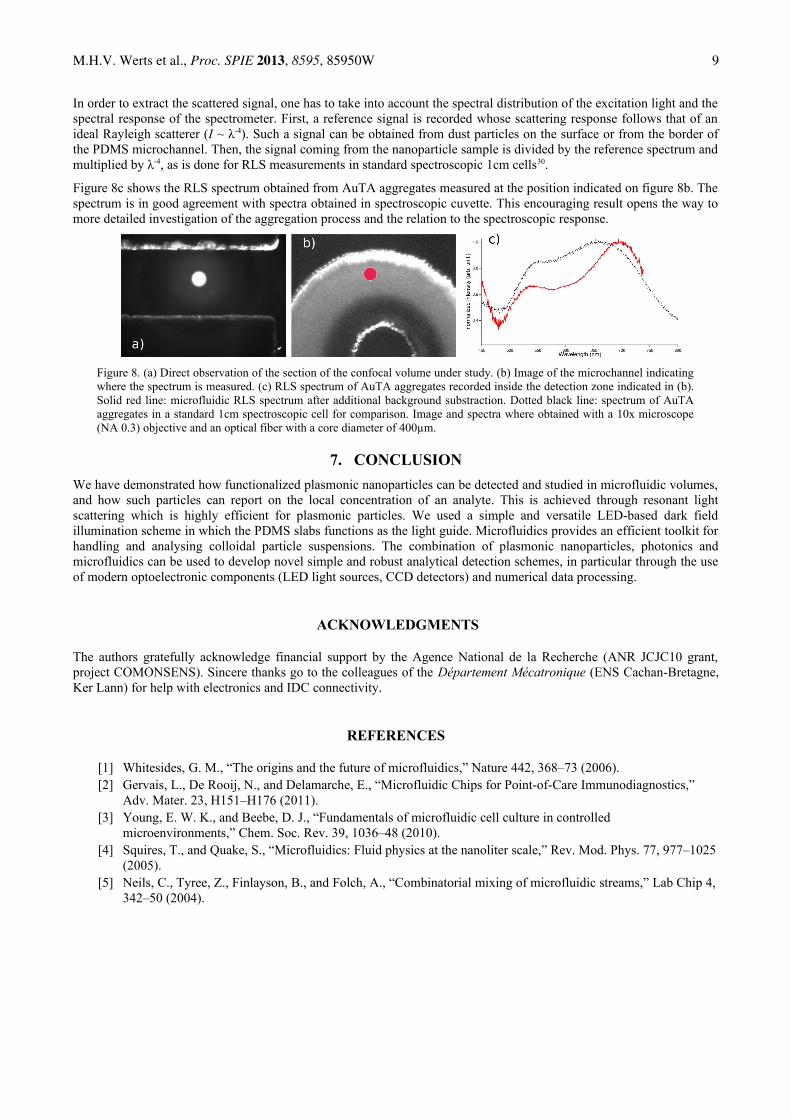
In order to extract the scattered signal, one has to take into account the spectral distribution of the excitation light and the spectral response of the spectrometer. First, a reference signal is recorded whose scattering response follows that of an ideal Rayleigh scatterer (I ~ λ-4). Such a signal can be obtained from dust particles on the surface or from the border of the PDMS microchannel. Then, the signal coming from the nanoparticle sample is divided by the reference spectrum and multiplied by λ-4, as is done for RLS measurements in standard spectroscopic 1cm cells30.
Figure 8c shows the RLS spectrum obtained from AuTA aggregates measured at the position indicated on figure 8b. The spectrum is in good agreement with spectra obtained in spectroscopic cuvette. This encouraging result opens the way to more detailed investigation of the aggregation process and the relation to the spectroscopic response.
Figure 8. (a) Direct observation of the section of the confocal volume under study. (b) Image of the microchannel indicating where the spectrum is measured. (c) RLS spectrum of AuTA aggregates recorded inside the detection zone indicated in (b). Solid red line: microfluidic RLS spectrum after additional background substraction. Dotted black line: spectrum of AuTA aggregates in a standard 1cm spectroscopic cell for comparison. Image and spectra where obtained with a 10x microscope (NA 0.3) objective and an optical fiber with a core diameter of 400µm.
7. CONCLUSION
We have demonstrated how functionalized plasmonic nanoparticles can be detected and studied in microfluidic volumes, and how such particles can report on the local concentration of an analyte. This is achieved through resonant light scattering which is highly efficient for plasmonic particles. We used a simple and versatile LED-based dark field illumination scheme in which the PDMS slabs functions as the light guide. Microfluidics provides an efficient toolkit for handling and analysing colloidal particle suspensions. The combination of plasmonic nanoparticles, photonics and microfluidics can be used to develop novel simple and robust analytical detection schemes, in particular through the use of modern optoelectronic components (LED light sources, CCD detectors) and numerical data processing.
ACKNOWLEDGMENTS
The authors gratefully acknowledge financial support by the Agence National de la Recherche (ANR JCJC10 grant, project COMONSENS). Sincere thanks go to the colleagues of the Département Mécatronique (ENS Cachan-Bretagne, Ker Lann) for help with electronics and IDC connectivity.
REFERENCES
[1] Whitesides, G. M., “The origins and the future of microfluidics,” Nature 442, 368–73 (2006).[2] Gervais, L., De Rooij, N., and Delamarche, E., “Microfluidic Chips for Point-of-Care Immunodiagnostics,”
Adv. Mater. 23, H151–H176 (2011).[3] Young, E. W. K., and Beebe, D. J., “Fundamentals of microfluidic cell culture in controlled
microenvironments,” Chem. Soc. Rev. 39, 1036–48 (2010).[4] Squires, T., and Quake, S., “Microfluidics: Fluid physics at the nanoliter scale,” Rev. Mod. Phys. 77, 977–1025
(2005).[5] Neils, C., Tyree, Z., Finlayson, B., and Folch, A., “Combinatorial mixing of microfluidic streams,” Lab Chip 4,
342–50 (2004).
M.H.V. Werts et al., Proc. SPIE 2013, 8595, 85950W 10
[6] Jähnisch, K., Hessel, V., Löwe, H., and Baerns, M., “Chemistry in microstructured reactors,” Angew. Chem. Int. Ed. 43, 406–46 (2004).
[7] Hung, L., and Lee, A. P., “Microfluidic devices for the synthesis of nanoparticles and biomaterials,” J. Med. Biol. Eng. 27, 1–6 (2007).
[8] Boleininger, J., Kurz, A., Reuss, V., and Sönnichsen, C., “Microfluidic continuous flow synthesis of rod-shaped gold and silver nanocrystals,” Phys. Chem. Chem. Phys. 8, 3824 (2006).
[9] Cooksey, G. A., Sip, C. G., and Folch, A., “A multi-purpose microfluidic perfusion system with combinatorial choice of inputs, mixtures, gradient patterns, and flow rates,” Lab Chip 9, 417–426 (2008).
[10] Kamholz, A., Schilling, E., and Yager, P., “Optical measurement of transverse molecular diffusion in a microchannel,” Biophys. J. 80, 1967–1972 (2001).
[11] Pappaert, K., Biesemans, J., Clicq, D., Vankrunkelsven, S., and Desmet, G., “Measurements of diffusion coefficients in 1-D micro- and nanochannels using shear-driven flows,” Lab Chip 5, 1104–1110 (2005).
[12] Estevez-Torres, A., Gosse, C., Le Saux, T., Allemand, J., Croquette, V., Berthoumieux, H., Lemarchand, A., and Jullien, L., “Fourier analysis to measure diffusion coefficients and resolve mixtures on a continuous electrophoresis chip,” Anal. Chem. 79, 8222–8231 (2007).
[13] Werts, M. H. V., Raimbault, V., Texier-Picard, R., Poizat, R., Français, O., Griscom, L., and Navarro, J. R. G., “Quantitative full-colour transmitted light microscopy and dyes for concentration mapping and measurement of diffusion coefficients in microfluidic architectures,” Lab Chip 12, 808–820 (2012).
[14] Rigler, R., Mets, U., Widengren, J., and Kask, P., “Fluorescence correlation spectroscopy with high count rate and low background: analysis of translational diffusion,” Eur. Biophys. J. 22, 169–175 (1993).
[15] Navarro, J. R. G., Plugge, M., Loumaigne, M., Sanchez-Gonzalez, A., Mennucci, B., Débarre, A., Brouwer, A. M., and Werts, M. H. V, “Probing the interactions between disulfide-based ligands and gold nanoparticles using a functionalised fluorescent perylene-monoimide dye.,” Photochem. Photobiol. Sci. 9, 1042–54 (2010).
[16] Loumaigne, M., Praho, R., Nutarelli, D., Werts, M. H. V, and Débarre, A., “Fluorescence correlation spectroscopy reveals strong fluorescence quenching of FITC adducts on PEGylated gold nanoparticles in water and the presence of fluorescent aggregates of desorbed thiolate ligands.,” Phys. Chem. Chem. Phys. 12, 11004–14 (2010).
[17] Bae, S. W., Tan, W., and Hong, J.-I., “Fluorescent dye-doped silica nanoparticles: new tools for bioapplications.,” Chem. Comm. 48, 2270–82 (2012).
[18] Beverloo, H. B., Van Schadewijk, A., Van Gelderen-Boele, S., and Tanke, H. J., “Inorganic phosphors as new luminescent labels for immunocytochemistry and time-resolved microscopy.,” Cytometry 11, 784–92 (1990).
[19] Wang, F., and Liu, X., “Recent advances in the chemistry of lanthanide-doped upconversion nanocrystals.,” Chem. Soc. Rev. 38, 976–89 (2009).
[20] Bruchez, M., Moronne, M., Gin, P., Weiss, S., and Alivisatos, A. P., “Semiconductor nanocrystals as fluorescent biological labels,” Science 281, 2013 (1998).
[21] Hayashi, S., and Okamoto, T., “Plasmonics: visit the past to know the future,” J. Phys. D: Appl. Phys. 45, 433001 (2012).
[22] Schneider, G., Decher, G., Nerambourg, N., Praho, R., Werts, M. H. V, and Blanchard-Desce, M., “Distance-dependent fluorescence quenching on gold nanoparticles ensheathed with layer-by-layer assembled polyelectrolytes.,” Nano Lett. 6, 530–6 (2006).
[23] Nerambourg, N., Werts, M. H. V, Charlot, M., and Blanchard-Desce, M., “Quenching of molecular fluorescence on the surface of monolayer-protected gold nanoparticles investigated using place exchange equilibria.,” Langmuir 23, 5563–70 (2007).
[24] Tcherniak, A., Dominguez-Medina, S., Chang, W.-S., Swanglap, P., Slaughter, L. S., Landes, C. F., and Link, S., “One-Photon Plasmon Luminescence and Its Application to Correlation Spectroscopy as a Probe for Rotational and Translational Dynamics of Gold Nanorods,” J. Phys. Chem. C 115, 15938–15949 (2011).
[25] Yguerabide, J., and Yguerabide, E. E., “Light-scattering submicroscopic particles as highly fluorescent analogs and their use as tracer labels in clinical and biological applications. II. Experimental characterization,” Anal. Biochem. 262, 157–176 (1998).
[26] Yguerabide, J., and Yguerabide, E. E., “Light-scattering submicroscopic particles as highly fluorescent analogs and their use as tracer labels in clinical and biological applications. I. Theory,” Anal. Biochem. 262, 137–156 (1998).
M.H.V. Werts et al., Proc. SPIE 2013, 8595, 85950W 11
[27] Schultz, D. A., “Plasmon resonant particles for biological detection,” Curr. Opin. Biotechnol. 14, 13–22 (2003).[28] Mappes, T., Jahr, N., Csaki, A., Vogler, N., Popp, J., and Fritzsche, W., “The invention of immersion
Ultramicroscopy in 1912 - The birth of nanotechnology?,” Angew. Chem. Int. Ed. 51, 11208–11212 (2012).[29] Zsigmondy, R. A., “Properties of colloids,” Nobel lecture (1926).[30] Navarro, J. R. G., and Werts, M. H. V, “Resonant light scattering spectroscopy of gold, silver and gold-silver
alloy nanoparticles and optical detection in microfluidic channels.,” Analyst 138, 583–592 (2013).[31] Edelstein, A., Amodaj, N., Hoover, K., Vale, R., and Stuurman, N., “Computer control of microscopes using
µManager.,” Curr. Protocols Mol. Biol. 14, 20.1–20.17 (2010).[32] Schneider, C. A., Rasband, W. S., and Eliceiri, K. W., “NIH Image to ImageJ: 25 years of image analysis,”
Nature Methods 9, 671–675 (2012).[33] Frens, G., “Controlled nucleation for the regulation of the particle size in monodisperse gold suspensions,”
Nature (1973).[34] Weigl, B. H., and Yager, P., “Microfluidic Diffusion-Based Separation and Detection,” Science 283, 346–347
(1999).[35] Oh, K. W., Lee, K., Ahn, B., and Furlani, E. P., “Design of pressure-driven microfluidic networks using electric
circuit analogy.,” Lab Chip 12, 515–45 (2012).[36] Elghanian, R., Storhoff, J. J., Mucic, R. C., Letsinger, R. L., and Mirkin, C. A., “Selective Colorimetric
Detection of Polynucleotides Based on the Distance-Dependent Optical Properties of Gold Nanoparticles,” Science 277, 1078–1081 (1997).
[37] Bidault, S., Abajo, F. J. G. De, and Polman, A., “Plasmon-based nanolenses assembled on a well-defined DNA template.,” J. Am. Chem. Soc. 130, 2750–1 (2008).
[38] Aslan, K., Luhrs, C. C., and Pérez-Luna, V. H., “Controlled and Reversible Aggregation of Biotinylated Gold Nanoparticles with Streptavidin,” J. Phys. Chem. B 108, 15631–15639 (2004).
[39] Englebienne, P., “Use of colloidal gold surface plasmon resonance peak shift to infer affinity constants from the interactions between protein antigens and antibodies specific for single or multiple epitopes.,” Analyst 123, 1599–1603 (1998).
[40] Kalluri, J. R., Arbneshi, T., Khan, S. A., Neely, A., Candice, P., Varisli, B., Washington, M., McAfee, S., Robinson, B., et al., “Use of gold nanoparticles in a simple colorimetric and ultrasensitive dynamic light scattering assay: selective detection of arsenic in groundwater.,” Angew. Chem. Int. Ed. 48, 9668–71 (2009).
[41] Ai, K., Liu, Y., and Lu, L., “Hydrogen-bonding recognition-induced color change of gold nanoparticles for visual detection of melamine in raw milk and infant formula.,” J. Am. Chem. Soc. 131, 9496–7 (2009).
[42] Han, C., and Li, H., “Visual detection of melamine in infant formula at 0.1 ppm level based on silver nanoparticles.,” Analyst 135, 583–8 (2010).