Optical properties of sea water in the infrared*Lary W. Pinkley and Dudley Williams
Kansas State University, Manhattan, Kansas 66506(Received 11 December 1975)
We have made quantitative measurements of the ratio of the infrared spectral reflectance of standard seawater at near-normal incidence to the corresponding spectral reflectance of pure water at 27°C. The infraredspectral reflectance of standard sea water was determined from the measured ratio and the known opticalconstants for pure water. The real n(v) and the imaginary k(v) parts of the complex index of refraction ofstandard sea water were then determined by Kramer-Kronig methods. The results obtained for the standardsea water are compared with previous results obtained for pure water and with previous studies of sea water.
In view of the fact that three-quarters of the earth'ssurface is covered by sea water, the optical propertiesof sea water have an important bearing on the earth'sradiative heat balance; because the emission spectrumof the earth is largely in the intermediate infrared, aknowledge of the optical constants of sea water in thisspectral region is of special importance. Detailedknowledge of these constants is also of importance toremote sensing of the earth's atmospheric and surfacefeatures from satellites and to infrared signal trans-mission through the atmosphere near the surface of thesea, where droplets of sea water are an importantaerosol component of the atmosphere.
The present infrared study of sea water is a part of aresearch program dealing with the infrared propertiesof water, in which we have used quantitative measure-ments of absorption' and reflections to determine thereal n and imaginary k parts of the complex index of re-fraction N=n +ik. In a critical summary3 of earlierwork, we compare the n and k values obtained by Kra-mors-Kronig (XI() analyses of separate reflection andabsorption measurements with the values of these con-stants based on a combination of absorption and reflec-
554 J. Opt. Soc. Am., Vol. 66, No. 6, June 1976
tion measurements. In general, KK analysis of reflec-tion measurements provided excellent values of n andyielded good values of k in spectral regions of strongabsorption. In the present study we have determinedthe reflectance R at near-normal incidence and haveemployed KK analysis to obtain n and k for sea water inthe infrared.
In earlier studies we have investigated the influenceof temperature 4 and various inorganic solutes5 on theinfrared reflectance of water; the results have a bear-ing on the spectrum of sea water, which, apart fromits particulate and biologic components, is merely adilute solution of certain salts. Hobson and Williams6
have compared the spectral reflectance of sea waterfrom various geographical locations with the reflectionof pure water and with the reflection of the solutions ofsalts known to be present in sea water; the presence ofthe SOj- ion produces readily observable effects in seawater. Querry and his associates 7 have also studiedthe reflection spectra of sea water from varioussources and have made a detailed investigation of theinfluence of NaCl on the spectrum of water.
water varies with geographic location, various varie-ties of standard sea water (SSW) have been devised andused in laboratory studies. In the present investiga-tion we have employed SSW prepared from the completeprescription of Lyman and Fleming, 8 which provides anextremely close approximation to clean ocean water.Friedman9 has made a detailed study of SSW in whichhe measured spectral reflectance at large angles ofincidence and, in certain spectral regions, made com-parisons of the spectral transmittance of SSW and purewater. The SSW employed by Friedman included onlyMgCl 2 - 6H20, NaCl, MgSO4 - 7H20, and CaCl2 , whichare the major components of the Lyman-Fleming pre-scription; the concentration of minor components is sosmall that their contributions to the observable spec-trum of sea water is probably completely negligible. Inthe course of his work, Friedman also employed solu-tions having 0. 5 the normal solute concentration (SSW-0.5), along with multiples 1.5 (SSW-1. 5) and 2 (SSW-2)of the normal concentration; the use of these solutionsfacilitated estimates of the effects of salinity on thespectral properties of sea water.
In the present study we made a careful comparisonof the spectral reflectances of SSW and SSW-2 with thatof pure water at near-normal incidence in the spectralrange 350-6700 cm-'. The results are shown in Fig. 1in which we plot the measured ratios R(v)ssw/R(v)w andR(V)SSW 21R(V)W as a function of wave number in therange 400-5200 cm-'. The length of the uncertaintybars shown at selected wave numbers on the SSW curvealso apply to the SSW-2 curve. In most spectral re-gions the uncertainty in the ratio plotted in Fig. 1amounts to approximately ± 0.01 but becomes larger inregions of low spectral reflectance near 3700 and 900cm'1 and in regions where spectral reflectance changesrapidly with frequency. The results shown in Fig. 1indicate that the spectral reflectance of sea water isgreater than that of pure water in most of the infraredregion but is significantly lower in the vicinity of 800cm'.
r,3
.88,2 4.4 3.6 2.8 2.0 1.2WAVE NUMBER (cm-)
Ru0 04 -
*5.2 4.4 3.6 2.8 2.0 1.2 0.4WAVE NUMBER (cmr) x103
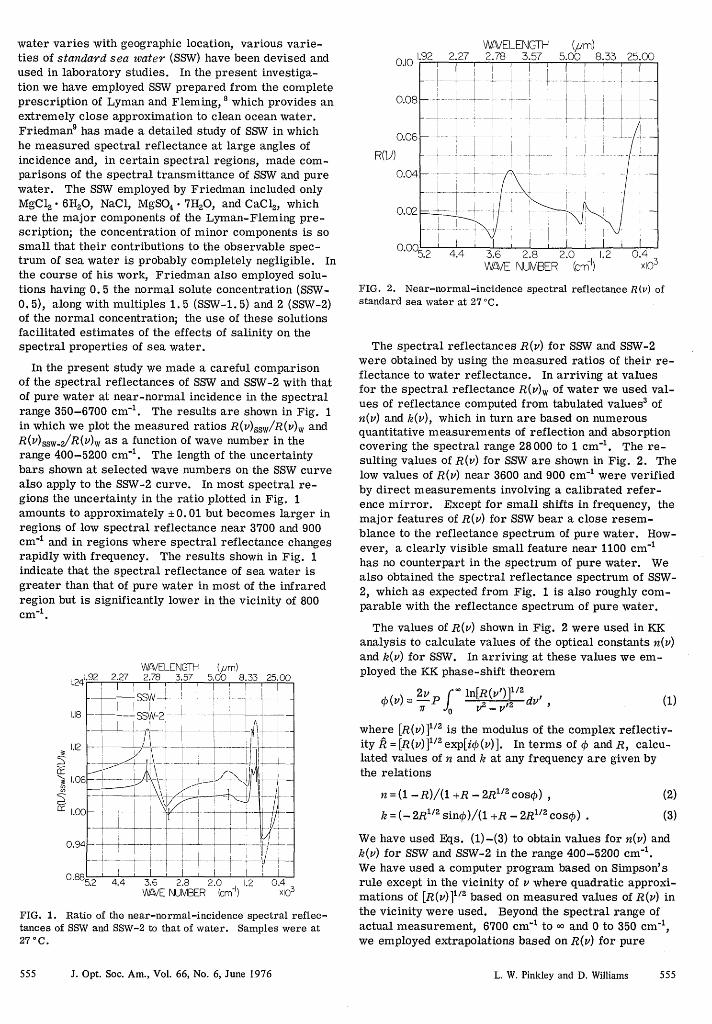
FIG. 2. Near-normal-incidence spectral reflectance R(v) ofstandard sea water at 27IC.
The spectral reflectances R(v) for SSW and SSW-2were obtained by using the measured ratios of their re-flectance to water reflectance. In arriving at valuesfor the spectral reflectance R(v)w of water we used val-ues of reflectance computed from tabulated values3 ofn(v) and k(v), which in turn are based on numerousquantitative measurements of reflection and absorptioncovering the spectral range 28000 to 1 cm-. The re-sulting values of R(v) for SSW are shown in Fig. 2. Thelow values of R(v) near 3600 and 900 cm-' were verifiedby direct measurements involving a calibrated refer-ence mirror. Except for small shifts in frequency, themajor features of R(v) for SSW bear a close resem-blance to the reflectance spectrum of pure water. How-ever, a clearly visible small feature near 1100 cm'1has no counterpart in the spectrum of pure water. Wealso obtained the spectral reflectance spectrum of SSW-2, which as expected from Fig. 1 is also roughly com-parable with the reflectance spectrum of pure water.
The values of R(v) shown in Fig. 2 were used in KKanalysis to calculate values of the optical constants n(v)and k(v) for SSW. In arriving at these values we em-ployed the KK phase-shift theorem
I 7 2 12 dv'7T J0 , 1-i'2 dv
(1)
where [R(v)]1/2 is the modulus of the complex reflectiv-ity A = [R(v)]1 2 exp[i4)(v)]. In terms of 4) and R, calcu-lated values of n and k at any frequency are given bythe relations
n =(1 - R)/(1 +R - 2R"/2 coso),
k = (- 2R"/2 sino)/(1 +R - 2R"/2 cosO) .
0.4X10
3
FIG. 1. Ratio of the near-normal-incidence spectral reflec-tances of SSW and SSW-2 to that of water. Samples were at27°C.
555 J. Opt. Soc. Am., Vol. 66, No. 6, June 1976
(2)
(3)
We have used Eqs. (1)-(3) to obtain values for n(v) andk(v) for SSW and SSW-2 in the range 400-5200 cm- .We have used a computer program based on Simpson'srule except in the vicinity of v where quadratic approxi-mations of [R(v)]"12 based on measured values of R(v) inthe vicinity were used. Beyond the spectral range ofactual measurement, 6700 cm-' to -o and 0 to 350 cm-',we employed extrapolations based on R(v) for pure
L. W. Pinkley and D. Williams 555
7 n1.92
1.8
1.61
n(V)
1.4
1.21
2.27
W,5 .2.5;.2 4.4
WAVELENGTH (A/m)2.78 3.57 5.00 8.33 25.00
3.6 2.8 2.0 1.2 0.4WAVE NUMBER (cm") xi03
FIG. 3. Refractive index n(v) of standard sea water at 27 -C.
water, 3"0 which is known in the range 1 to 28 000 cm'.
The values of n(v) for SSW are plotted as a function ofwave number in Fig. 3. As in the case of R(v), thegeneral features of the n(v) curve strongly resemblethose of the corresponding curve for pure water. Inmost spectral regions n(v) for SSW is slightly largerthan the corresponding value for water. There areslight shifts in the major dispersion features near 3400and 600 cm'1 with respect to the corresponding featuresfor pure water. The small inflection near 1100 cm-' iseasily noted in Fig. 3. In general, the uncertainties inthe values of n(v) amount to approximately ± 0.005.
The values of the absorption index k(v) for SSW areplotted as a function of wave number in Fig. 4. Themajor absorption band near 3400 cm-' is attributed tothe V3 and v1 fundamentals of the water molecule alongwith some contribution from the overtone 2V2; the posi-tion and shape of this major band are strongly influ-enced by temperature changes 4 and by the nature andconcentration of solutes5 that modify the molecular sur-roundings of the water molecule. In SSW the band isshifted to slightly higher frequencies from its positionin pure water. The sharp absorption band near 1650cm-' is due to the v2 fundamental of the water molecule;although slightly altered in shape, its frequency in SSWis the same as in pure water. The major absorptionband near 600 cm-' is associated with the librational orhindered rotational motion of the water molecule in thefield of its neighbors; as in the case of the 3400 cm-'band, the position of the librational band VL is depen-dent on water temperature 4 and on the nature and con-centration of solutes.5 In SSW it is shifted from its po-sition in pure water to slightly lower frequencies.
The readily observable small absorption band near1100 cm-' can be attributed to the V3 fundamental of theSO4- ion."1 Comparison of the spectrum of SSW-2 withSSW reveals that absorption near 1100 cm-1 increaseswith increasing salt concentration. There are severalsmall variations in k(v) in the 1200-1500 cm-' regionbut are not measurably different in the spectra ofSSW-2.
- IW
556 J. Opt. Soc. Am., Vol. 66, No. 6, June 1976
I I I I
I I I I I. -1
In view of the direct dependence of the value of k(v)on sinp(v) in (3), the absolute values of k(v) in regionsof low absorption are strongly influenced by uncertain-ties in P(v) as determined by KK phase shift analysis(1). We have found that k(v) values based on KK analy-sis are highly unreliable for k(v) ' 0. 03 but become in-creasingly reliable with increasing values of k(v). Thek(v) values in Fig. 4 are virtually meaningless in thespectral ranges 3700-5200 cm-' and 2900-1700 cm'1; inthese regions absorption measurements are needed.
Because the spectrum of SSW so closely resemblesthe spectrum of pure water, Friedman has proposedthat its optical properties can best be provided by theuse of small corrections to the values of n(v) and k(v)that have been established for pure water. In view ofthe fact that we have measured the ratio of the reflec-tance of SSW and SSW-2 to pure water, we have adoptedthis procedure since the small corrections will remainapplicable in good approximation when more exact val-ues of the optical constants of water become available.In arriving at values of the small corrections we havecompared our own values of the optical constants3 ofpure water with those obtained for SSW and SSW-2 inthe present study.
The curve shown in Fig. 5 gives the difference be-tween n(v) for SSW and n(v) for pure water. In mostspectral regions n(v) for SSW is greater than that ofwater. The two major exceptions to this statement areassociated with the minima near 3550 and 650 cm- ,which are associated with changes in the frequency andcontours of the major band near 3400 cm-' and the li-brational band near 600 cm-', respectively. The cor-responding curve for SSW-2 is shown in Fig. 6; thegeneral features are similar to those for SSW exceptfor larger differences between SSW-2 and water overmuch of the spectral range. Since the values of n(v) forthe solutions are based on the properties of water, thelength of the uncertainty bars are closely related tothose shown in Fig. 1. The influence of the SOZ- ab-sorption band near 1100 cm-' is clearly discernable inFigs. 5 and 6.
WAVELENGTH (Aum)1.92 2.27 2.78 3.57 5.00 8.33 25.000.5 I-1 v Il: 1 1 A 1 1 1
0.4
0.3
k(U}) X -'0.2 - - -
0.1 - - -
IX ,L 4X
05.2 4.4 3.6 2.8 2.0 1.2 0.4WAVE NUMBER (cm') x10
FIG. 4. Absorption index k(v) of standard sea water at 27 'C.
L. W. Pinkley and D. Williams 556
0.00
CO1l -
-0.02
00 I l I5.2 4.4 3.6 2.8 2.0 1.2 0.4WAVE NUMBER (cm-l) x103
FIG. 5. Difference between the refractive index n(v) for SSWand that of pure water.
The dashed curves shown in Figs. 5 and 6 representFriedman's proposed corrections to the n(v) for waterthat would give values of n(v) for SSW and SSW-2. Thepresent results are in close agreement with those ofFriedman between 3000 and 1500 cm-1; our slightlylarger values in the 5000-3800 cm-1 region may be dueto the fact that Friedman's values are based on the n(v)values of Pontier and Dechambenoy12 that differ fromour values in this region. Friedman's corrections donot include those associated with changes in the 3400cm-1 water band produced by the solutes.
In view of our criticism of the absolute values of k(v)based on KK analysis (1) and (3) in regions where k(v)is small, it would appear that the present study wouldprovide little basis for establishing corrections of k(v)for water to give corresponding values of k(v) for SSW.Closer examination of the actual computation of ¢p(v)from (1) indicates that it is possible to provide signifi-cant corrections. In arriving at ¢(v) from (1), we ob-
FIG. 6. Difference between the refractive index n(v) fordouble-concentration standard sea water (SSW-2) and that ofpure water.
6 0.00 t A
-0.01 t-A -
-0.02 -i 4* 3.6 2.8 2.0 1.2 0.4
WAVE NUMBER (cm-') X103
FIG. 7. Difference between the absorption index W(v) of SSWand that of pure water.
tain a value of p(v) that is the sum of 4(v)HFE based onhigh-frequency extrapolation, 4(v)M based on measuredvalues of R(v), and (P(V)LFE based on low-frequency ex-trapolation. In spectral regions where ¢5(v) is small,its value given by (1) is strongly influenced by the ex-trapolations; this fact accounts for the large uncertain-ties in the absolute values of k(v) in regions of low ab-sorption. In spectral regions where P is large, themagnitudes of P(V)HFE and P(v)LFE are small as com-pared with that of 0(v)m.
However, if we employ identical extrapolations forwater and for SSW, we can obtain significant differencesk(v)ssw - k(v)w even though the calculated values ofthese separate absorption indices may be unreliable.In establishing these corrections, we note that 4(v)ssw- O(V)W = [O(V)HFE +¢(P()M +O(V)LFE]SSW - [¢(P)HFE +O(V)M
+O(V)LFE]W =P(V)M-ssw - P(V)M-w provided identical high-frequency and low-frequency extrapolations are em-ployed.
In Figs. 7 and 8 we show the results of values ofk(z)ssw -k(')w and k(V)ssW-22-k(v)w, respectively. In ar-riving at the values shown in these figures we used ex-trapolations based on R(v)ssw =R(v)w for v >8000 cm-'and v < 350 cm-. On the basis of uncertainties ± 0.01R(v) in measured values of the spectral reflectance ofSSW, we estimate that the uncertainties in the differ-ences in absorption indices plotted in Figs. 7 and 8amount to less than ± 0.002 over most of the spectralrange between 4000 and 400 cm". For v >4000 cm-',the calculated differences in absorption indices are in-fluenced by the way in which the measured reflectancecurves for sea water are merged with the values ofR(v)w used in the high-frequency extrapolation.
Over most of the spectral region 4000-400 cm-1 thedifferences between k(v) values for SSW-1 and SSW-2and the values of k(v) for water are small and the dif-ference amounts to less than ±0.002. Differenceslarger than this occur in the 3400 cm'1 region and in-
557 J. Opt. Soc. Am., Vol. 66, No. 6, June 1976 L. W. Pinkley and D. Williams 557
0.03
0.02
0.01 I
( 0.00
-Y -0.01
-0.02[
-0.03
WAVELENGTH (Vum)2.78 3.57 5.00 8.33
3.6 2.8 2.0WAVE NUMBER
25.00
1.2 0.4(cm 1) xIO3
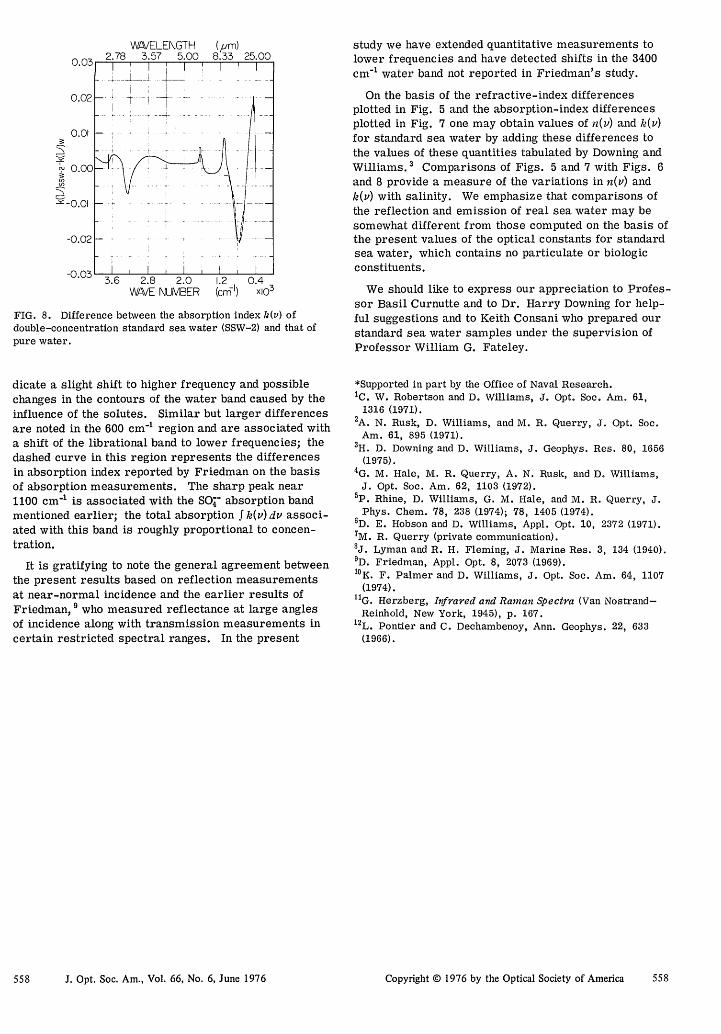
FIG. 8. Difference between the absorption index k(v) ofdouble-concentration standard sea water (SSW-2) and that ofpure water.
dicate a slight shift to higher frequency and possiblechanges in the contours of the water band caused by theinfluence of the solutes. Similar but larger differencesare noted in the 600 cm-' region and are associated witha shift of the librational band to lower frequencies; thedashed curve in this region represents the differencesin absorption index reported by Friedman on the basisof absorption measurements. The sharp peak near1100 cm-' is associated with the SOj- absorption bandmentioned earlier; the total absorption f k(v) dv associ-ated with this band is roughly proportional to concen-tration.
It is gratifying to note the general agreement betweenthe present results based on reflection measurementsat near-normal incidence and the earlier results ofFriedman, 9 who measured reflectance at large anglesof incidence along with transmission measurements incertain restricted spectral ranges. In the present
4- -8
I VIoH
Copyright ( 1976 by the Optical Society of America 558
. . . .study we have extended quantitative measurements tolower frequencies and have detected shifts in the 3400cm'1 water band not reported in Friedman's study.
On the basis of the refractive-index differencesplotted in Fig. 5 and the absorption-index differencesplotted in Fig. 7 one may obtain values of n(v) and k(v)for standard sea water by adding these differences tothe values of these quantities tabulated by Downing andWilliams. 3 Comparisons of Figs. 5 and 7 with Figs. 6and 8 provide a measure of the variations in n(v) andk(v) with salinity. We emphasize that comparisons ofthe reflection and emission of real sea water may besomewhat different from those computed on the basis ofthe present values of the optical constants for standardsea water, which contains no particulate or biologicconstituents.
We should like to express our appreciation to Profes-sor Basil Curnutte and to Dr. Harry Downing for help-ful suggestions and to Keith Consani who prepared ourstandard sea water samples under the supervision ofProfessor William G. Fateley.
*Supported in part by the Office of Naval Research.'C. W. Robertson and D. Williams, J. Opt. Soc. Am. 61,
1316 (1971).2A. N. Rusk, D. Williams, and M. R. Querry, J. Opt. Soc.
Am. 61, 895 (1971).3H. D. Downing and D. Williams, J. Geophys. Res. 80, 1656
(1975).4G. M. Hale, M. R. Querry, A. N. Rusk, and D. Williams,
J. Opt. Soc. Am. 62, 1103 (1972).5p. Rhine, D. Williams, G. M. Hale, and M. R. Querry, J.
Phys. Chem. 78, 238 (1974); 78, 1405 (1974).6D. E. Hobson and D. Williams, Appl. Opt. 10, 2372 (1971).7M. R. Querry (private communication).8J. Lyman and R. H. Fleming, J. Marine Res. 3, 134 (1940).9D. Friedman, Appl. Opt. 8, 2073 (1969).'OK. F. Palmer and D. Williams, J. Opt. Soc. Am. 64, 1107
(1974)."G. Herzberg, Infrared and Raman Spectra (Van Nostrand-
Reinhold, New York, 1945), p. 167.12L. Pontier and C. Dechambenoy, Ann. Geophys. 22, 633