14
Optical Receiver Sensitivity Rainer Schwemmer, LHCb Electronics Meeting Dec. 2014
| Date post: | 23-Dec-2015 |
| Category: |
Documents |
| Upload: | claribel-patterson |
| View: | 220 times |
| Download: | 1 times |

Optical Receiver Sensitivity
Rainer Schwemmer, LHCb Electronics Meeting Dec. 2014

Goal
• Determine the spread of sensitivity of different MINIPod receivers– For the Detector DAQ direction
• Sample of 20 x12 receivers from Marseille – 240 receivers in total – ~ 2-3% of planned installation
2

Methodology
• Unfortunately no x12 tester for sensitivity measurements available
• The receivers need to go onto the new AMC40 prototypes limited time frame
• Fixed transmitter with stable optical power output, change receivers and try to map resulting BER to sensitivity
3

Methodology
4
1.00E-11
1.00E-09
1.00E-07
1.00E-05
1.00E-03
1.00E-01
Channel 1
Channel 2Optical Receive Power
BE
R
• Assumptions:– Curve for different receivers has same shape but is moved to the left
or to the right depending on sensitivity– Transmitter output power is stable between on/off cycles

Methodology
5
1.00E-11
1.00E-09
1.00E-07
1.00E-05
1.00E-03
1.00E-01
Channel 1
Channel 2Optical Receive Power
BE
R
• Inject optical signal at fixed power• Measure BER of different receivers at this power
Fixed Optical Powerat receiver input
Measured BER spread
Sens.difference

Methodology
6
1.00E-11
1.00E-09
1.00E-07
1.00E-05
1.00E-03
1.00E-01
Channel 1
Channel 2Optical Receive Power
BE
R
• If the two curves have the same shape then the two triangles are identical
• Use the BER difference measured on a reference receiver to get the power/sensitivity value of the device under test
Fixed Optical Powerat receiver input
Measured BER spread
Sens.difference

Setup
• One x12 Transmitter of one prototype AMC40 as source– Attenuated to intensity which actually produces errors
• Swap out receivers on the board and measure BER
7
Source Receiver
AMC40 FrontplateConnectors
Attenuator
Prizm Connector Prizm Connector

Setup
• One x12 Transmitter of one prototype AMC40 as source– Attenuated to intensity which actually produces errors
• Swap out receivers on the board and measure BER• Have to power cycle the board for swapping out
receivers though
8
Source
Receiver 1AMC40 Frontplate
Connectors
Attenuator
Prizm Connector Prizm Connector
Receiver 2

Setup
9
Receiver
Transmitter
Attenuator
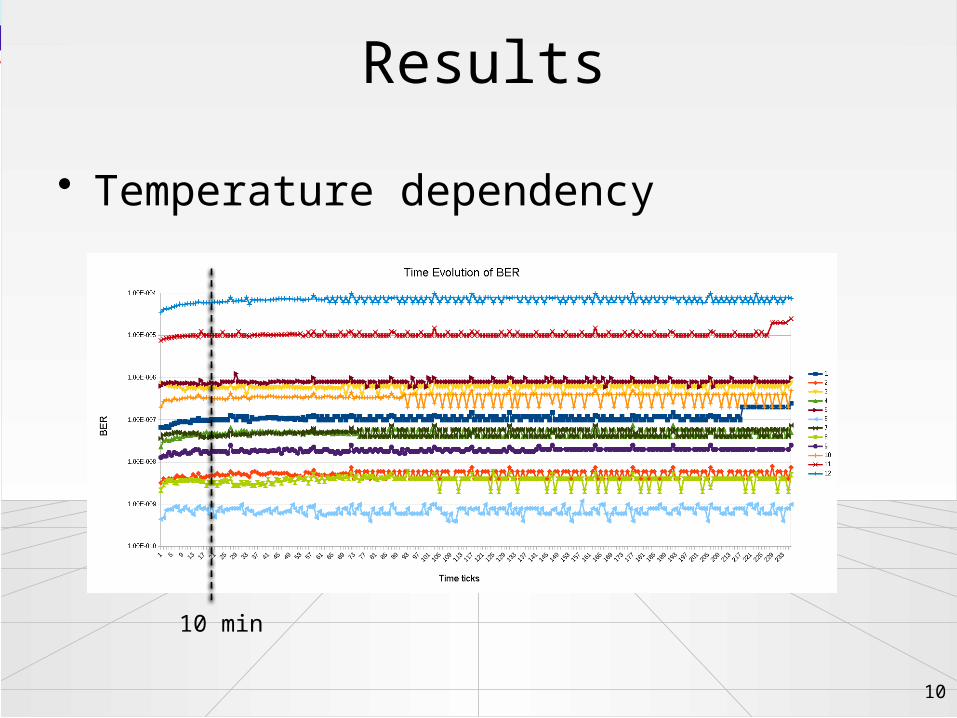
Results
• Temperature dependency
10
10 min

Results
• Bit error rate vs Channel ID• Individual channels form clusters
– Injected optical power is different on different channels– Attenuator is not same on every channel
11

Results
• Every now and then: put the same receiver back into the socket• Variation is quite large• Prism connector seems to have quite a large spread on re-connects
12

Results
• After conversion of BER into optical power• Distribution is centered around average• No absolute values yet, because we have not measured absolute value of
optical output power13

Conclusions
• Spread of sensitivity is quite large (+- 1 dB)• A large portion of it is probably due to losses
in connector rather than receiver• Need to do calibration of transmitter to get
absolute sensitivity values (2-3 days of measurements in optics lab)
14


