Graduate eses and Dissertations Iowa State University Capstones, eses and Dissertations 2013 Optimal design of a gas transmission network: A case study of the Turkish natural gas pipeline network system Ersin Fatih Gunes Iowa State University Follow this and additional works at: hps://lib.dr.iastate.edu/etd Part of the Oil, Gas, and Energy Commons is esis is brought to you for free and open access by the Iowa State University Capstones, eses and Dissertations at Iowa State University Digital Repository. It has been accepted for inclusion in Graduate eses and Dissertations by an authorized administrator of Iowa State University Digital Repository. For more information, please contact [email protected]. Recommended Citation Gunes, Ersin Fatih, "Optimal design of a gas transmission network: A case study of the Turkish natural gas pipeline network system" (2013). Graduate eses and Dissertations. 13294. hps://lib.dr.iastate.edu/etd/13294
Transcript
Graduate Theses and Dissertations Iowa State University Capstones, Theses andDissertations
2013
Optimal design of a gas transmission network: Acase study of the Turkish natural gas pipelinenetwork systemErsin Fatih GunesIowa State University
Follow this and additional works at: https://lib.dr.iastate.edu/etd
Part of the Oil, Gas, and Energy Commons
This Thesis is brought to you for free and open access by the Iowa State University Capstones, Theses and Dissertations at Iowa State University DigitalRepository. It has been accepted for inclusion in Graduate Theses and Dissertations by an authorized administrator of Iowa State University DigitalRepository. For more information, please contact [email protected].
Recommended CitationGunes, Ersin Fatih, "Optimal design of a gas transmission network: A case study of the Turkish natural gas pipeline network system"(2013). Graduate Theses and Dissertations. 13294.https://lib.dr.iastate.edu/etd/13294
APPENDIX B: Current Map of Natural Gas Transmission System in Turkey ........ 88
APPENDIX C: Final Optimal Network of Natural Gas Transmission System in Turkey (Model 1) .................................................................................................. 89 APPENDIX C: Final Optimal Network of Natural Gas Transmission System in Turkey (Model 2) .................................................................................................. 90
vi
LIST OF FIGURES
Figure 1 Natural gas production/consumption by region in billion cubic meters (Statistical Review of BP about World Energy 2011) .............................. 2
Figure 2 World`s primary energy consumption and consumption projection (million tons of equivalent oil - Mtep) (Source: EMRA) .......................... 3 Figure 3 Natural gas consumption by end use in Turkey in 2011 (Source: Bloomberg) ................................................................................. 6 Figure 4 Generation of electricty by fuel (billion kilowatt-hours) (Source: EIA) ... 7 Figure 5 Natural gas consumption by end use in 2011 (Source: EIA) .................... 7 Figure 6 A pipeline schematic ................................................................................. 13 Figure 7 Natural gas prices in selected countries worldwide in 2011 ..................... 14
Figure 9 Compressor station (Source: BOTAS) ...................................................... 20
Figure 10 Map of natural gas distribution activities (Source: EMRA Annual Report, 2011 ...................................................... 23 Figure 11 Pipeline configuration on a map (Source: BOTAS Annual Report, 2011) ................................................... 25 Figure 12 Natural gas and crude oil pipeline system of BOTAS (Source: Annual Report, 2010) ................................................................ 26 Figure 13 Capital and operating cost of compressors (Source: Edgar et al., 1978) .. 29
Figure 14 Example of pipeline configuration with three branches (Source: Edgar et al., 1978) ....................................................................... 31 Figure 15 Transmission line ...................................................................................... 50 Figure 16 Initial and final optimal gas transmission system (Russia_West) ............ 61 Figure 17 Initial and final optimal gas transmission system (Iran) ........................... 63
vii
Figure 18 Initial and final optimal gas transmission system of Russian Federation (Blue Stream) ............................................................................................ 65 Figure 19 Initial and final optimal gas transmission system of Azerbaijan .............. 66
Figure 20 Initial and final optimal gas transmission system (Nigeria &Algeria) ...... 67 Figure 21 Optimal design of Russia west entrance point (model 2) ......................... 69
Figure 22 Optimal design of Iran entrance point (model 2) ...................................... 71
Figure 23 Optimal design of Blue Stream entrance point (model 2) ........................ 73
Figure 24 Optimal design of Azerbaijan entrance point (model 2) ........................... 74
Figure 25 Optimal design of Nigeria & Algeria entrance point (model 2) ............... 75
Figure 26 Number of cities provided with natural gas supply (Source: EMRA Sector Report, 2011) ...................................................... 80
viii
LIST OF TABLES
Table 1 World`s primary energy consumption on energy resources basis and consumption projection (million tons of equivalent oil - Mtep) ............... 2
Table 2 Primary energy consumption figures and shares by countries (BP Statistical Review of World Energy 2011) ........................................ 4 Table 3 Energy consumption forecast according to energy resources (%) (Source: Salvarli, 2006) ............................................................................. 4 Table 4 Natural gas purchase contracts and ongoing transmission and distribution lines in Turkey (Source: Botas, http://www.botas.gov.tr/index.asp) ........ 22 Table 5 Natural gas imports between 2005-2011 (million 𝑠𝑚3, million standard cubic meter) (Source: EMRA, 2011) ...... 24 Table 6 Parameter values for model 2 (Tabkhi et al. 2009) ................................... 39 Table 7 Cost values for Turkish natural gas pipeline system ................................. 45 Table 8 Length of the branches .............................................................................. 48 Table 9 Compressor stations and entrance points (Source: Botas) ........................ 48
Table 11 Demirciler(Gebze) - Blacksea Eregli Natural Gas Main Transmission Line ............................................................................................................ 51 Table 12 Seckoy(Bursa) - Canakkale natural gas main transmission line ............... 51
Table 13 Karacabey-Bornova (Izmir) natural gas main transmission line ............... 51
Table 14 Bozuyuk-Usak natural gas main transmission line ................................... 51
Table 15 Konya-Izmir natural gas main transmission line ....................................... 52
Table 16 Sivas-Mersin natural gas main transmission line ...................................... 52
Table 18 Entrance point: Black Sea Samsun ............................................................ 54
Table 19 Entrance point (Nigeria & Algeria): Marmara Ereglisi (Tekirdag) .......... 54
Table 20 Optimal values related to operating variables of Russia- West ............... 62 Table 21 Optimal values related to operating variables of Iran ............................... 64 Table 22 Optimal values related to operating variables of Russia (Blue Stream) ... 65 Table 23 Optimal values related to operating variables of Azerbaijan .................... 66 Table 24 Optimal values related to operating variables of Nigeria & Algeria ......... 67 Table 25 Results for Russia west network ............................................................... 69 Table 26 Results for Iran entrance network ............................................................. 72 Table 27 Results for Russia Blue Stream entrance point ......................................... 73 Table 28 Results for Azerbaijan entrance point ....................................................... 74 Table 29 Results for Nigeria & Algeria entrance point ............................................ 75 Table 30 Detailed costs of optimal and current designed network .......................... 76
Table 31 Ongoing transmission and distribution lines in Turkey (Source: Botas, http://www.botas.gov.tr/index.asp) ........................................................... 81
x
ACKNOWLEDGEMENTS
I would like to present and express my meaningful thanks to those valuable
people who guided and helped me with several aspects of writing this thesis. I wish to
express my sincere appreciation to Dr. Sarah Ryan who is my committee chair, for her
continuous support and guidance throughout my research and for her constructive
criticism during the preparation of this thesis. I also would like to give a special thanks
to my committee members, Dr. Jo Min and Dr. Suzuki Yoshinori for their guidance and
support throughout the course of this research.
I gratefully acknowledge the scholarship provided by the Turkish Petroleum
Pipeline Corporation (BOTAS) for their financial assistance. Without their support, my
participation in the graduate program would not have been possible.
In addition, I would also like to thank my close friends, the department faculty
and staff for making my time at Iowa State University a wonderful experience. Finally, I
am deeply indebted to my parents for their encouragement and moral support.
xi
ABSTRACT
Turkey is located between Europe, which has increasing demand for natural gas
and the geographies of Middle East, Asia and Russia, which have rich and strong natural
gas supply. Because of the geographical location, Turkey has strategic importance
according to energy sources. To supply this demand, a pipeline network configuration
with the optimal and efficient lengths, pressures, diameters and number of compressor
stations is extremely needed. Because, Turkey has a currently working and constructed
network topology, obtaining an optimal configuration of the pipelines, including an
optimal number of compressor stations with optimal locations, is the focus of this study.
Identifying a network design with lowest costs is important because of the high
maintenance and set-up costs. The quantity of compressor stations, the pipeline
segments` lengths, the diameter sizes and pressures at compressor stations, are
considered to be decision variables in this study. Two existing optimization models were
selected and applied to the case study of Turkey. Because of the fixed cost of
investment, both models are formulated as mixed integer nonlinear programs, which
require branch and bound combined with the nonlinear programming solution methods.
The differences between these two models are related to some factors that can affect the
network system of natural gas such as wall thickness, material balance compressor
isentropic head and amount of gas to be delivered. The results obtained by these two
techniques are compared with each other and with the current system. Major differences
between results are costs, pressures and flow rates. These solution techniques are able to
find a solution with minimum cost for each model both of which are less than the current
cost of the system while satisfying all the constraints on diameter, length, flow rate and
pressure. These results give the big picture of an ideal configuration for the future state
network for the country of Turkey.
1
CHAPTER 1
INTRODUCTION
1.1. Motivation
Natural gas has powerful importance according to its economic and
environmental benefits. It is one of a major source of electricity among energy sources
of coal, nuclear and petroleum. The importance of natural gas is that when it burns, it
releases cleaner energy than dirty coal and other polluting energy resources. Also, if
natural gas is used widely in the world, pollution that causes global warming during the
combustion will be less and our world will be much more livable. Positive
environmental effects and several possible applications of natural gas will make this
energy source increasingly important to meet demand of energy in many countries in the
world.
Since 1995, the consumption and production of natural gas throughout world has
been steadily growing from nearly 1600 billion cubic meters to closely 3200 billion
cubic meters in 2011 as we can see from Fig. 1, which is given as information by the
Statistical Review of BP about World Energy (June 2011).
Moreover, it is estimated that natural gas consumption rate will continue to grow
geometrically to nearly 4.33 trillion cubic meters in 2035, with an average growth rate of
about 1.6% per year (International Energy Outlook 2011, EIA). Production of natural
gas increased by 7.3% in 2011 in the world, the largest increase since 1984 (EIA).
Growth of natural gas production stayed above average in all locations while the record
of Russia was the largest production increment. With production of natural gas,
consumption rate also increased by 7.4%, which is also higher than the average growth
in all parts of the world, except the Middle East (EIA).
2
Figure 1. Natural gas production/consumption by region in billion cubic meters
(Statistical Review of World Energy by BP, 2011)
An important part of energy demand is being supplied by natural gas, coal and oil
currently. By considering this factor, International Energy Agency (IEA) projected that
these resources will be used to supply the demand within a period from 2009 to 2035.
Table 1. World`s primary energy consumption on energy resources basis and
consumption projection (million tons of equivalent oil - Mtep)
(Source: IEA WEO 2010 New Policies Scenario)
*Annual average rate of increase
Use of energy is becoming more important according to environmental reasons.
3
Because of environmental reasons and usage ease of natural gas demand will be
increasing position in future until 2035 according to estimation of EMRA, 2011. The
primary consumption of the world for energy resources and the projection of
consumption within the period of 2009-2035 are shown in Table 1.
Figure 2. World`s primary energy consumption and consumption projection (million
tons of equivalent oil - Mtep) (Source: Energy Market Regulatory Authority (EMRA))
As we can see from table 2, the USA, China, India, Russia and Japan are taking the
front places according to consumption of energy in the world, while Turkey is taking
19th place in same table.
A review of the consumption of primary-energy by sectors points out that the sector
of electricity generation has the fastest increase (EIA). It is estimated that the
consumption of energy will be around 57% until 2030 for electric generation (EIA,
2011). Although a decrease in the usage of energy for transportation has been seen in
OECD countries, industrial usage of energy follows a stationary progress, while in non-
OECD countries and in rapidly developing countries; the industry sector induces an
increase of the energy consumption (EIA).
4
Table 2. Primary energy consumption figures and shares by countries (BP Statistical Review of World Energy 2011)
Table 3. Energy consumption forecast in Turkey according to energy resources (%)
(Source: Salvarli, 2006)
Resource/Years 1990 1995 2000 2010 2020
Coal 31.1 27.2 26.6 30.6 39.5
Petroleum 45.6 46.5 42 28.9 24.3
Natural Gas 5.9 10.1 18.8 27.2 22.8
Nuclear --- --- --- 2.9 5.8
Water 3.7 4.8 4.1 4.2 2.8
Other 13.7 11.4 8.5 6.2 4.8
5
Table 3 shows the energy consumption in Turkey data before and forecast after
2010. According to this projection, natural gas consumption`s share will be 22.8% in
2020. This proportion will be very close to consumption of coal and petroleum in future.
1.2. Natural Gas Usage by Sectors
The long-term demand for natural gas is affected by several factors according to
the supply and logistic chain parts, which start from production and transmission
systems and end with distribution, marketing and customers (naturalgas.org). To
examine natural gas demand most beneficially and effectively, we need to consider
demands with its sectors that are using energy resources especially using natural gas as
energy sources. The three most important sectors are: demand of residential &
commercial, industrial and electric generation demand.
Residential & commercial: Residential energy demand is expected to increase
4-5.5% between 2009 and 2035 according to the Energy Information Administration
(EIA). The residential sector is responsible for 18% of all consumption in the world
(EIA)(see figure 5).
It is believed that residential heating applications probably will be the most
crucial and effective future driver for natural gas demand in the residential sector. Thus
research focuses on the design of a natural gas network especially for meeting Turkey`s
demand of natural gas, mostly for heating applications and industrial usage more
efficiently and effectively. In Turkey, approximately 78% of natural gas consumption is
made by the residential and industrial applications (see figure 3) (EMRA, 2011).
6
Figure 3. Natural gas consumption by end use in Turkey in 2011 (Source: Bloomberg)
Industrial: As residential and commercial sector, industrial sector`s energy
demand is also expected to increase at an average rate of 1.1% through 2035 by EIA.
The commercial sector consumes 12% of its energy from natural gas and will
continue to do so through 2035. The EIA points out that industrial energy demand will
increase at a rate of 0.9% per year until 2035. Industrial demand is responsible for 30%
amount of natural gas demand (EIA) (see figure 5).
Industrial usage of natural gas is also motivation for this case study of Turkey to
meet the energy demand and to increase the efficiency of industry.
Electric generation: It is estimated by EIA that the demand of electricity will be
increasing by an average rate of 1% per year until 2035.
Natural gas-!red electric generation measured 25% of all generation in 2011
while it is predicted to be 30% of all generation in 2040 by EIA (see figure 4). The
increasing demand for electricity combined with the predicted increase in the proportion
of generation from natural gas shown in figure 4 imply that the demand for natural gas
from the energy sector will be higher in future that it is today.
!"#$ %#$
%#$
&'#$
&'#$
()**+,-./0$ 1,/234),5/5.)2$ 657+,$
8+3.9+25./0$ :29;35,./0$
7
Figure 4. Generation of electricity by fuel (trillion kilowatt-hours per year) (Source:
EIA)
Figure 5. Natural gas consumption by end use in the world in 2012 (Source: EIA)
To summarize; the residential use of natural gas usage is measured at18%, the
commercial usage accounts for 12%, usage by industry is measured at 30%, the electric
power production is responsible for 39% and the other usages are measured at 1% in the
world in 2012 by AER as shown in Figure 5 (AER, 2012).
&'#$
&<#$
!"#$
!%#$ !#$
=0+-5,.-$>+2+,/5.)2$ :29;35,./0$
8+3.9+25./0$ ()**+,-./0$
657+,$
8
The largest sector for consumption seems to be industrial sector for natural gas
through 2035 whose expected proportion is 40% (International Energy Outlook 2011).
The second largest consumption for natural gas is made by the electric power generation
in 2012. Namely, natural gas is still protecting its importance for industrial and
electricity sectors` source of energy.
The process of getting the natural gas out of the ground consists of seven stages,
which are exploration, extraction, production, transportation, storage, distribution and
marketing. Also, these stages are a part of supply chain and logistic processes. The well-
known website (http://naturalgas.org) about natural gas defines these stages briefly as
following:
Exploration; is how natural gas is found and how companies decide where to drill wells
for it.
Extraction; is about the drilling process and it searches the answer of how natural gas is
took out from its underground reservoirs to the surface.
Production; is a process of bringing out the natural gas from the underground.
Transport; is transportation of natural gas from the processing plant to local distribution
companies across a pipeline network.
Storage; is responsible for the storage of natural gas.
Distribution; is a stage of delivering natural gas from the major pipelines to the end
users.
Marketing; includes the buying/selling activity from the natural gas marketers.
1.3. Problem Statement
Considering an energy company (Botas, Turkish Petroleum Pipeline
Corporation), which is one of the two biggest companies in the energy sector,
strategically crucial for Turkey and focusing on especially natural gas; the most
important factor is minimizing cost of operation, cost of maintenance, cost of pipeline
and cost of compressor or maximizing profit with current business aspect. Also,
considering these cost related factors, the best way to increase profit or decrease cost is
9
to find the relevant problem and solution methods, then to apply these solution
techniques to solve the problem that affects the system more than other factors. As the
Turkish natural gas pipeline network system has already been designed and its topology
chosen, we choose to optimize the remaining aspects of design of the Turkish gas
transmission network.
In a natural gas pipeline system, there are several factors existing to succeed in
delivering natural gas to end-users. These factors are the diameter of the pipeline
segments, lengths of the pipelines, suction and discharge pressures, flow rates, and
number of compressor stations. If we change any of these factors, we will get different
costs and profits according to current design of network. Considering our case problem,
its challenges and issues, we decided to apply suitable models that were created by
Edgar et al. (1978) and Tabkhi et al. (2009) to the Turkish natural gas pipeline network
system. The advantage of these models is that they can only be applied to gas pipeline
systems like Turkish natural gas network system, which are already designed. After
considering this case problem about Turkey and these cost related issues, we will seek
the optimal values of the main decision variables which are compressor station quantity,
length of pipes, diameter sizes, pressures, flow rates, and the resulting cost for our
current natural gas pipeline network system.
The minimum total cost of operation per year including capital, operating and
maintenance costs are targeted to be the criterion for the optimal configuration of the
natural gas pipeline network for Turkey.
1.4. Literature Review
There are many types of optimization techniques and models related to natural gas
systems especially related to natural pipeline network systems in literature. These
optimization models and techniques can be applied separately in production and
transportation of natural gas and also in the natural gas market.
10
Babu et al. (2005) presented a model similar to the optimization model of our study
to design the optimal gas transmission network. However, the difference between our
model and their model is that they used the differential evolution (DE) (evolutionary
computation technique) that is also able to find the optimal diameter measure, lengths,
pressures and number of compressors. To solve the real-valued function, differential
evolution method can be one of the best genetic algorithms.
Adeyanju and Oyekunle presented an optimization procedure of natural gas
transmission network by using the Reduced Gradient algorithm, which is a mathematical
optimization technique, like we used in our case of Turkey. By guiding this optimization
technique, they determine the optimum economical conditions for transporting natural
gas with pipelines and compressor stations. Finally, they applied the same model to
Excravos Lagos pipeline network system. Their model is very similar to our model and
they got the main idea from our first source model, which is constructed by Edgar et al.
(1978).
Other excellent references on network modeling and network optimization of gas
transmission solution algorithms including Rothfarb et al., (1970), Edgar et al. (2001),
Edgar et al. (1978), and Babu et al. (2008).
De Wolf and Smeers (2000) proposed a linear programming model to get the optimal
dimensioning of natural gas pipelines as the least gas purchase problem. This problem
has the nonlinear constraints with the linear approximation. The authors used the
simplex algorithm to solve the problem. According to the authors and their model, the
performance of the model highly depends on the initial points.
To the best of our knowledge and literature review, so far, a very few studies have
been done and applied on Turkish natural gas market and its pipeline network design.
Although the limitations of the literature studies about Turkish natural gas pipeline
system, except some IEA and OECD studies, is a considerable challenge for us, the best,
effective and beneficial solution techniques is combined for applying them to current
11
Turkish natural gas network system.
In this thesis, we will consider the application to the gas transmission network
problem of the global optimization techniques. One of these techniques has been well
established by Edgar et al. (1978) and Edgar et al. (2001), and the other one is created by
Tabkhi et al. (2009).
1.5. Thesis organization
In this study and thesis, our goal is providing a big picture of the Turkish natural gas
system and is pointing out to problems for designing of pipeline networks of the natural
gas.
This thesis is organized and presented through eight chapters. Chapter 1,
Introduction, describes the motivation behind this work along with the objectives and
organization. It also presents the theoretical review highlighting work relevant to the
topic explored and researched in this work. Chapter 2 gives specific information about
the natural gas pipeline network and relevant information for Turkey. Chapter 3 gives a
description of the gas pipeline with its model, which is created by Edgar et al. (1978),
methodology, and its mathematical formulation with cost-related functions and
constraints, and two solution models to solve the minimum cost problem for network
design. Moreover, it also presents a solution strategy for the mathematical formulation
and analytical framework of a case of Turkey. Using some relevant results, this chapter
also discusses how changes in some of the network parameters would affect the solution
of the mathematical problem. Chapter 4 has the same information as chapter 3 about
natural gas optimization but the technique and model are different than chapter 3. This
model whose creator is Tabkhi et al. (2009) has more effective variables comparing to
chapter 3 model. Chapter 5 provides the fundamental definitions and assumptions
necessary to formulate and implement a network design and optimization model of the
case of the Turkish natural gas pipeline network system. Also it has basic design
parameter values for model 2. Chapter 6 presents numerical results related to the
12
optimization models and to the use of different metrics and aspects to evaluate the whole
network with optimal values. Also presented in this chapter are the main results and
conclusions of a data gathering effort to evaluate the effects of new optimal network
design for Turkish natural gas network system. Chapter 7 provides the comparison
between two different optimization models and their results. Chapter 8 includes;
suggestions, discussion concluding remarks and directions for future work. This chapter
also introduces different and effective suggestions that can be obtained from the results
of the minimum cost optimization network problem.
13
CHAPTER 2
NATURAL GAS PIPELINE SYSTEM
2.1. Pipeline Components
Several parts of equipment compose the pipeline networks. These parts are
mainly pipes, compressor stations, metering stations, valves and control stations.
Adeyanju and Oyekunle explain the main elements of a pipeline system as following and
the pipeline schematic is shown as Figure 6.
Figure 6. A pipeline schematic (Source: Adeyanju and Oyekunle)
A. Pipes: Consist of strong carbon steel material, to meet the Petroleum Standards.
They are covered with a specialized coating to prevent corrosion when paced
under ground. Also, their measure is generally between 6 inches to 48 inches in
diameter.
B. Compressor & pump stations: For liquid pipelines generally pumps are used
while compressors are used for gas pipelines.
C. Partial delivery station: Also called intermediate station. It provides the
transportation of natural gas for delivering the products.
D. Block valve station: are using for protecting the pipelines.
14
E. Regulator station: For regulation of the pressures. It also is a special type of
valve station.
F. Final delivery station: Also called outlet station or terminal. It helps to distribute
products to customers.
United Kingdom 303.300
Canada 160.100
United States 207.400
Russia 108.900
Belgium 354.900
Romania 255.200
Spain 390.400
Kazakhstan 74.400
Turkey 407.300
Figure 7. Natural gas prices in selected countries worldwide as of 2010 and 2011 (in
U.S. dollars per 𝟏𝟎𝟕 kilocalories) (Source: Knoema, 2011)
Turkey is taking a place between all the countries in the world with its expensive
energy prices according to natural gas, petroleum and gasoline prices. For petroleum and
gasoline prices Turkey has the first row while for natural gas Turkey is one of the most
expensive countries in the world (see figure 7). Generally, for cost of pipeline and
compressor stations and maintenance of these factors, a lot of capital is needed for
natural gas. These costs will be more expensive in Turkey according to cost of
15
construction and energy prices, because a huge amount of natural gas (in percentage) is
purchased from other neighbor countries around Turkey. Therefore in order to minimize
cost, natural gas transportation processes optimization is necessary for the Turkish
natural gas pipeline network system.
2.2. Network Properties and Classification
According to current development in energy infrastructure, natural gas is the
most popular energy source with nuclear energy among other energy resources. End
users can differentiate the use of gas according to their needs such as in their home or in
the industry. For obtaining this gas resource, natural gas is transported over the long
distance by having complex tasks from the wellheads as a raw material to be received by
the residential or businesses users (as a clean and efficient source of energy, i.e., as we
know it). Corresponding to different transitional stages of natural gas these tasks can be
classified into two primary groups (Rios-Mercado and Borraz-Sanchez, 2012):
(a) Exploration, drilling, extraction, production and long-term storage of natural
gas
(b) Gathering, short-term storage, transportation and distribution of natural gas
In the Turkish natural gas pipeline network system, transitional stages like group
(b) have long and complex pipelines and various diameters to meet the complexity of the
network and transportation system.
2.3. Transportation of Natural Gas via Pipelines
Since our case is especially related to transmission of natural gas pipeline
systems, we will give brief information about the transportation of natural gas in this
section. An extensive and well-established transportation system is required from
production stage to consumption stage for efficient and effective movement of natural
gas. A complex network of pipelines is combined and designed for the natural gas to
16
transport it quickly, efficiently and effectively from its origin to the last places where the
natural gas demand is high.
Natural gas transportation has higher importance for oil and gas industry; so, this
transportation should be done efficiently. To transport natural gas, the economic,
effective and safe way is to use pipelines.
In the use of natural gas, the most important difficulty is transportation and
storage because of the construction during the long distances, large diameters of
pipelines and complex infrastructure of the natural gas system. So, in this thesis we
focus on especially on the transmission system of natural gas pipeline network. Because
if we get optimal, effective and efficient network design including the optimal diameters,
pressures, lengths and compressor stations, we can get more efficient future according to
energy resources usage rate.
Transportation is also important for the market to meet the demand. By help of
pipeline segments, all the points, places and areas can get natural gas to meet their
demand. To get an important part in a most competitive market, optimal designed natural
gas pipeline network should be obtained in a current global energy market.
To develop well-constructed transportation systems, sufficient capital and
investment cost is needed. Pipeline system and compressor stations have the majority of
cost for the natural gas transportation. Pipeline lengths and diameter sizes are affecting
the cost of pipelines. Also, the pressure factor affects the cost of compressor station
(Adeyanju and Oyekunle).
Therefore, to obtain the optimal cost function for the natural gas transmission,
which is either minimizing cost or maximizing profit, the appropriate balance between
pipeline cost of gas pipeline and compressor cost should be acquired. The cost function
is very complex for this aspect. To make it easy to manage and to get more efficient
system, optimization of the pipeline network is necessary.
17
2.4. Natural Gas Transportation Via Pipelines
To transport or move something solid, liquid or gas, the well established
transportation system should be set up for perfect supplying, importing and exporting
factors. The natural gas transportation is the most important activity to move gas from
one point to another. Several types of transportation can be used to transport gas in
natural gas industry, but the most effective, economical and efficient way to do this
transportation is in pipelines with their complex networks.
Currently, offshore and onshore systems are using pipelines, even though there
are differences in terms of security, terrorist attacks and construction prices. For building
pipeline network systems under the sea or over the sea is very costly and technically
complex. Because of this, generally the companies that are working on pipeline systems
are setting the onshore systems in an area where the demand of gas is high to decrease
the cost of construction. For example, according to Gazprom which is a well-known
company and the most powerful company in Europe for natural gas industry, the costs of
construction of the onshore pipeline system on Russian and German territory is around 6
billion euro (Dempsey, 2007), the 1220 km long (41 in) Nord Stream pipelines is
expected to cost around 8.8 billion euro (Nord Stream, 2008).
To analyze the Turkish natural gas pipeline network system, we need to consider
the following points. In current aspect, the location, natural gas pipeline system
construction and operation are generally managed and controlled by federal and state
regulations in Turkey. The Turkish Petroleum Pipeline Corporation (BOTAS) is the
governmental and only company for the natural gas industry in Turkey, although in
several countries, including USA, Canada, and Brazil, pipeline systems are fully
privatized. In these scenarios, fuel cost minimization is the most important factor to give
a priority for cost-related optimization techniques. For example, in European countries
like Turkey, the compressor stations are located in transmission lines and they are
usually run at their maximum capacity for long time periods. So, the placement of
compressor stations should have the priority to minimize cost or maximize profit.
18
Otherwise, moving the compressor stations location from one location to another can be
costly and will not be efficient. To prevent this cost-related problem, the transmission
The total length of five different branches constrained to be 579 miles, 504 miles,
510 miles, 474 miles and 495 miles, in sequence. On each pipeline segment, 5 miles is
placed as a lower bound. In Russia-West network CS1, CS2, CS3 and CS4 that have red
color in figure 16.a, are currently in process while CS5 to CS11 are assigned as extra
compressor stations for this network.
Figure 16.b. Optimal configuration of Russian Federation (westward) with optimal
pipeline lengths (in mile) shown on arcs
After optimization of this system, we got only one compressor that is enough for this
part to supply and arrange the pressure points with the optimal diameters and flow rates.
Also, we obtained one compressor work and our first 3 lengths are the same and we can
put our new compressor whichever these 3 points we want. See Figure 16 a&b.
62
Table 20. Optimal values related to operating variables for (Russia- West)
Pipeline
Segment
Discharge
(𝒑𝒅) (psi)
Suction (𝒑𝒔)
(psi)
Pipe diameter
(𝑫𝒋) (in.)
Length (𝑳𝒋)
(mile)
Flow rate (𝑸𝒋)
(s𝒎𝟑/h)
S1 90.00 82.00 12.901 140.000 2500000.000
S2 82.000 70.335 12.274 140.000 2487500.000
S3 70.335 56.302 12.274 140.000 2487500.000
S4 56.302 40.000 6.228 128.343 400000.000
S5 40.000 35.000 6.228 30.657 400000.000
S6 56.302 47.862 10.320 39.000 2087500.000
S7 47.862 41.488 7.955 28.709 978257.158
S8 41.488 37.000 6.000 11.291 578257.158
S9 37.000 35.000 6.090 5.000 578257.158
S10 41.488 41.000 6.737 5.000 400000.000
S11 41.000 37.721 6.000 17.291 400000.000
S12 47.862 41.900 6.079 5.000 1109242.842
S13 41.900 39.000 6.000 5.000 709242.842
S14 39.000 35.866 6.000 5.000 709242.842
S15 41.900 41.000 6.000 5.000 400000.000
S16 41.000 35.957 6.000 26.000 400000.000
Compressor Station Compression Ratio Capital Cost ($/year)
C1 1.000 44450
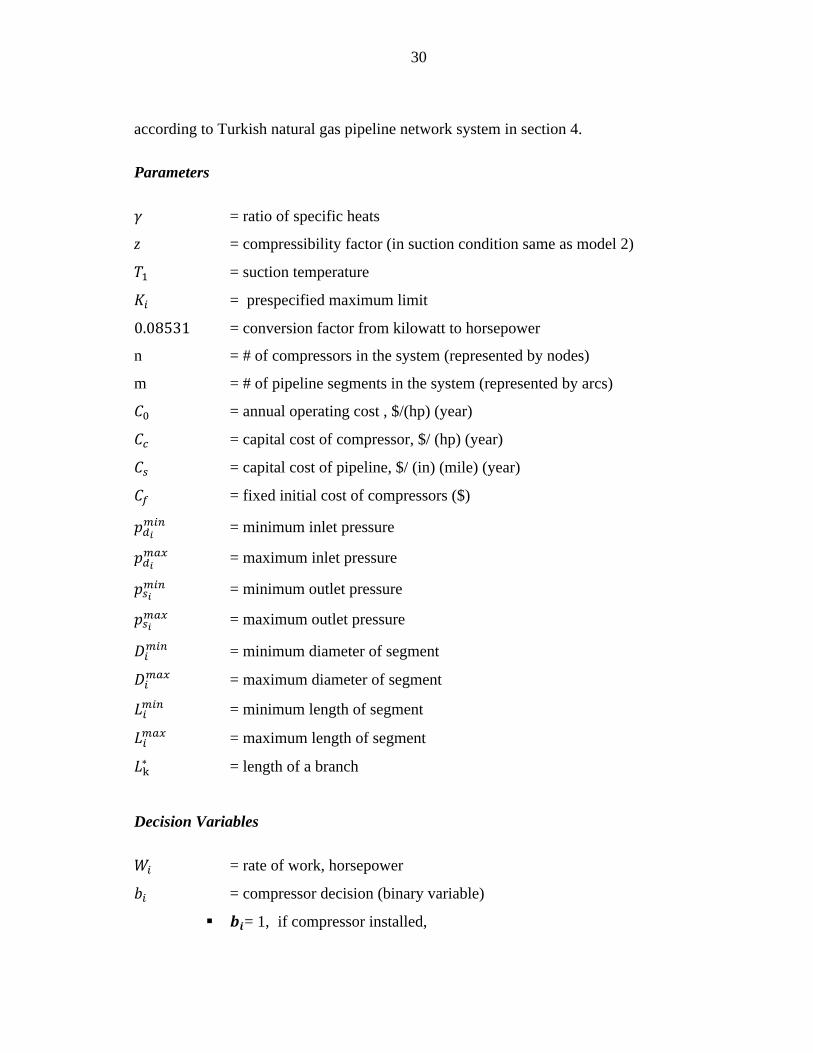
The second following constraints and information are given to explain the
specificities of the entrance point of Iran and its pipeline network system. Fixed input
pressure is 50 psi with a flow rate of 2500000 s𝑚!/h, and four different output pressures
in pipeline segments 5,8,11,13 were set at 40 psi, 40 psi, 36 psi, 37 psi, respectively on
the pipeline network of Iran.
The total length of four different branches on network of Iran entrance points
constrained to be 690 miles, 1202 miles, 887 miles, and 823 miles, in sequence. On each
pipeline segment, 70 miles is placed as a lower bound. See Figure 17.
63
Figure 17. a&b. Initial and final optimal gas transmission system (Iran)
In Iran network CS1and CS2 that have red color in figure 17, are currently in
process while CS3 to CS9 are assigned as extra compressor stations for this network.
64
Table 21. Optimal values related to operating variables for Iran
Pipeline
Segment
Discharge
(𝒑𝒅) (psi)
Suction (𝒑𝒔) (psi)
Pipe diameter
(𝑫𝒋) (in.)
Length (𝑳𝒋)
(mile)
Flow rate (𝑸𝒋)
(s𝒎𝟑/h)
S1 56.115 50.000 16.000 208.125 2500000.000
S2 50.000 44.923 16.000 154.568 2500000.000
S3 44.923 40.649 16.000 117.307 2500000.000
S4 40.649 40.000 16.000 273.000 619715.866
S5 40.000 39.832 16.000 70.000 619715.866
S6 40.649 40.070 19.198 70.000 1880284.134
S7 40.070 40.000 16.000 70.000 400000.000
S8 40.000 39.930 16.000 70.000 400000.000
S9 40.070 37.286 16.000 197.000 1480284.134
S10 37.286 36.000 16.000 385.000 700460.697
S11 36.000 35.761 16.000 70.000 700460.697
S12 37.286 37.000 16.000 70.000 779823.436
S13 37.000 39.000 16.000 70.000 779823.436
Compressor Station Compression Ratio Capital Cost ($/year)
C1 1.000 44450
The third following constraints and information are given to explain the
specificities of the entrance point of Russia (Blue Stream) and its pipeline network
system. Fixed input pressure is 53 psi with a flow rate of 1350000 s𝑚!/h, and output
pressure was set at 53 psi. The total length of branch constrained to be 302 miles. We
placed a lower bound of 60 miles on each pipeline segment in this network. See Figure
18.
In Russia-Blue Stream network CS2 that has red color in figure 18, is currently in
process while CS1 and CS3 are assigned as extra compressor (blue color) stations for
this network.
65
Figure 18. Initial and final optimal gas transmission system of Russian Federation (Blue
Stream)
Table 22. Optimal values related to operating variables for Russia (Blue Stream)
Pipeline
Segment
Discharge
(𝒑𝒅) (psi)
Suction (𝒑𝒔)
(psi)
Pipe diameter
(𝑫𝒋) (in.)
Length (𝑳𝒋)
(mile)
Flow rate (𝑸𝒋)
(s𝒎𝟑/h)
S1 53.000 52.999 48.000 60.000 1350000.000
S2 52.999 52.997 48.000 60.000 1343250.000
S3 52.997 52.996 48.000 60.000 1336533.750
S4 53.003 53.000 48.000 122.000 1329851.081
Compressor Station Compression Ratio Capital Cost ($/year)
C1 1.000 44450
C2 1.000 44450
C3 1.000 44450
The fourth following constraints and information are given to explain the
specificities of the entrance point of Azerbaijan and its pipeline network system.
In Azerbaijan network CS1 that has red color in figure 19, is currently in process
while CS2 is assigned as extra compressor (blue color) stations for this network.
66
Figure 19. Initial and final optimal gas transmission system of Azerbaijan
Fixed input pressure is 55 psi with a flow rate of 1100000 s𝑚!/h, and output pressure
was set at 55 psi. The total length of branch constrained to be 119 miles. We have 3
compressor stations, which can be assigned as optimal each, but one of them, which is
third one, has the highest rate of work with 8134.584 according to equation (1). So, it is
the best way to place new compressor to this point on the network because of work of
the compressor to get the more optimal result. On each pipeline segment, 39 miles is
placed as a lower bound. See Figure 19.
Table 23. Optimal values related to operating variables for Azerbaijan
Pipeline
Segment
Discharge
(𝒑𝒅) (psi)
Suction (𝒑𝒔)
(psi)
Pipe diameter
(𝑫𝒋) (in.)
Length (𝑳𝒋) (mile)
Flow rate (𝑸𝒋)
(s𝒎𝟑/h)
S1 55.026 55.000 24.000 41.000 1100000.000
S2 55.007 55.003 34.540 39.000 1094500.000
S3 55.003 55.000 34.540 39.000 1094500.000
Compressor Station Compression Ratio Capital Cost ($/year)
C1 1.000 44450
67
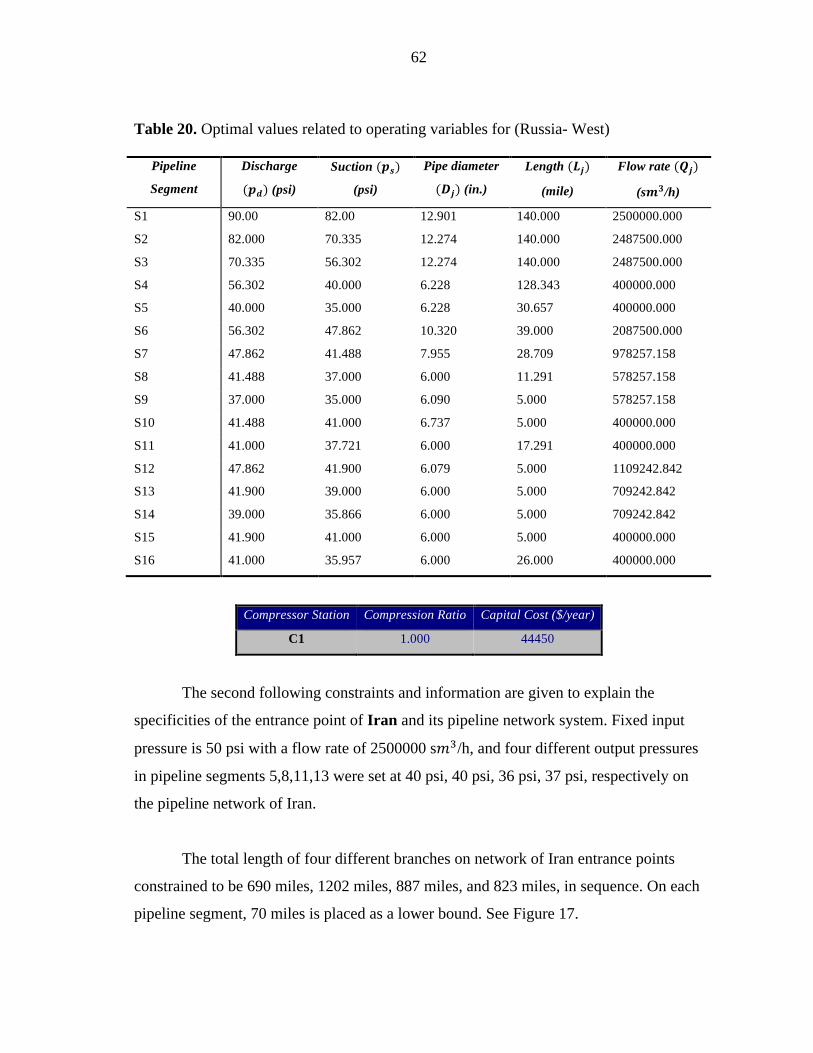
Lastly, the fifth following constraints and information are given to explain the
specificities of the entrance point of Nigeria & Algeria and its pipeline network system.
In this network there is no compressor stations currently being used while CS1 and CS2
are assigned as extra compressor (blue color) stations for this network.
Figure 20. Initial and final optimal gas transmission system (Nigeria &Algeria)
We have one compressor station, which can be assigned as optimal, has the work of
6214.486 according to equation (1). So, it is the better way to place new compressor to
this point (point one, see figure 20) on the network because of this work of compressor.
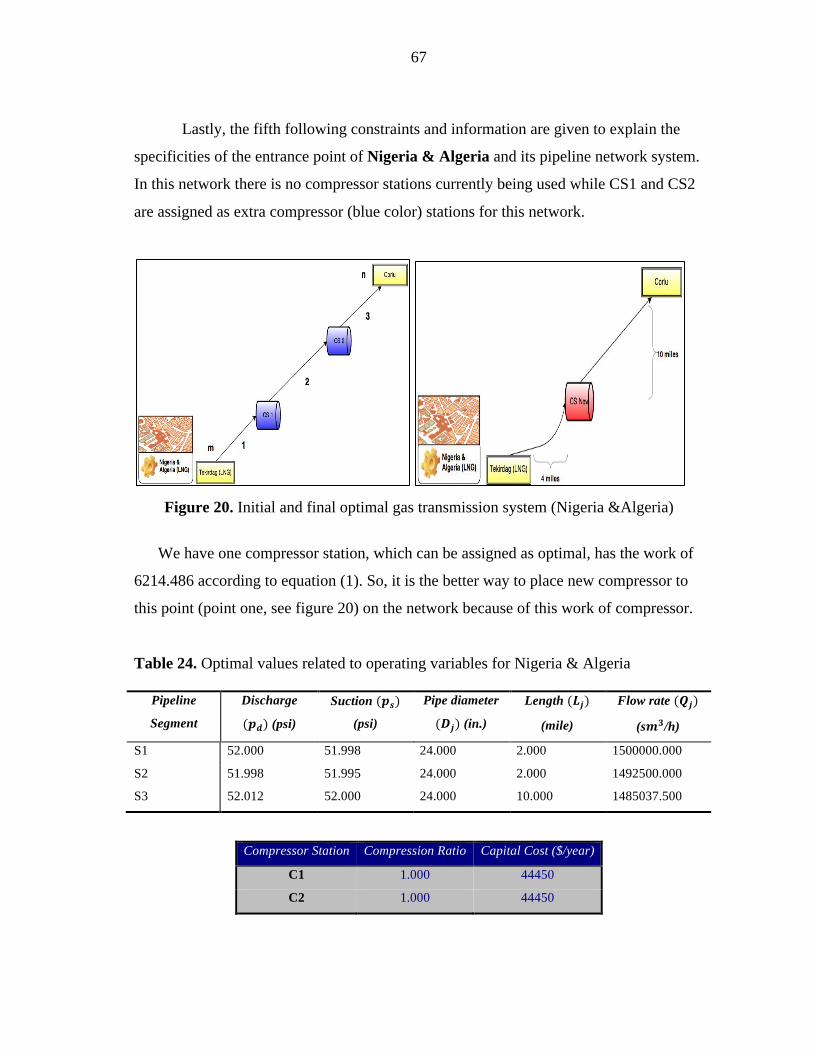
Table 24. Optimal values related to operating variables for Nigeria & Algeria
Pipeline
Segment
Discharge
(𝒑𝒅) (psi)
Suction (𝒑𝒔)
(psi)
Pipe diameter
(𝑫𝒋) (in.)
Length (𝑳𝒋)
(mile)
Flow rate (𝑸𝒋)
(s𝒎𝟑/h)
S1 52.000 51.998 24.000 2.000 1500000.000
S2 51.998 51.995 24.000 2.000 1492500.000
S3 52.012 52.000 24.000 10.000 1485037.500
Compressor Station Compression Ratio Capital Cost ($/year)
C1 1.000 44450
C2 1.000 44450
68
Fixed input pressure is 52 psi with a flow rate of 1500000 s𝑚!/h, and output pressure
was set at 52 psi. The total length of branch constrained to be 14 miles. 2 miles was
assigned on each pipeline segment as lower bound. See Figure 20. We have two
compressor stations, which can be assigned as optimal. But, one of them, which is first
one, has the highest rate of work with 21821.901 according to equation (1). So, it is the
appropriate way to place new compressor to second point (see figure 20) on the network
because of this work of compressor to get the more optimal result.
The problems that we mentioned and considered for Turkish natural gas pipeline
network system above, are solved by using the nonlinear optimization algorithm with the
branch and bound technique. After the solution procedure, the obtained optimal network
with the optimal variables are shown in Appendix C.
6.2. Results of Model 2
According to the study of “ Total Cost Minimization of a High-Pressure Natural
Gas Network”, made by Tabkhi et al. (2009), we selected GAMS environment to solve
our mixed integer linear programming (MINLP) problem. The solvers of CONOPT and
DICOPT are chosen as solution method for this model.
We applied this optimization technique to the same network from Turkish natural
gas pipeline system to compare the results with Edgar et al. (2009) optimization model.
We still have five different entrance points. Current compressor stations are assigned to
optimization problem to figure out and check whether they are enough or extra for
current system according to diameter size, pipe length, operation cost, maintenance cost,
compressor cost, flow rate and pressures. Also in this model length of the pipeline
segments are fixed. Current map of natural gas pipeline system with current compressor
stations are shown in section 6.1. We will give the results for new model in this section
with the optimal natural gas networks.
69
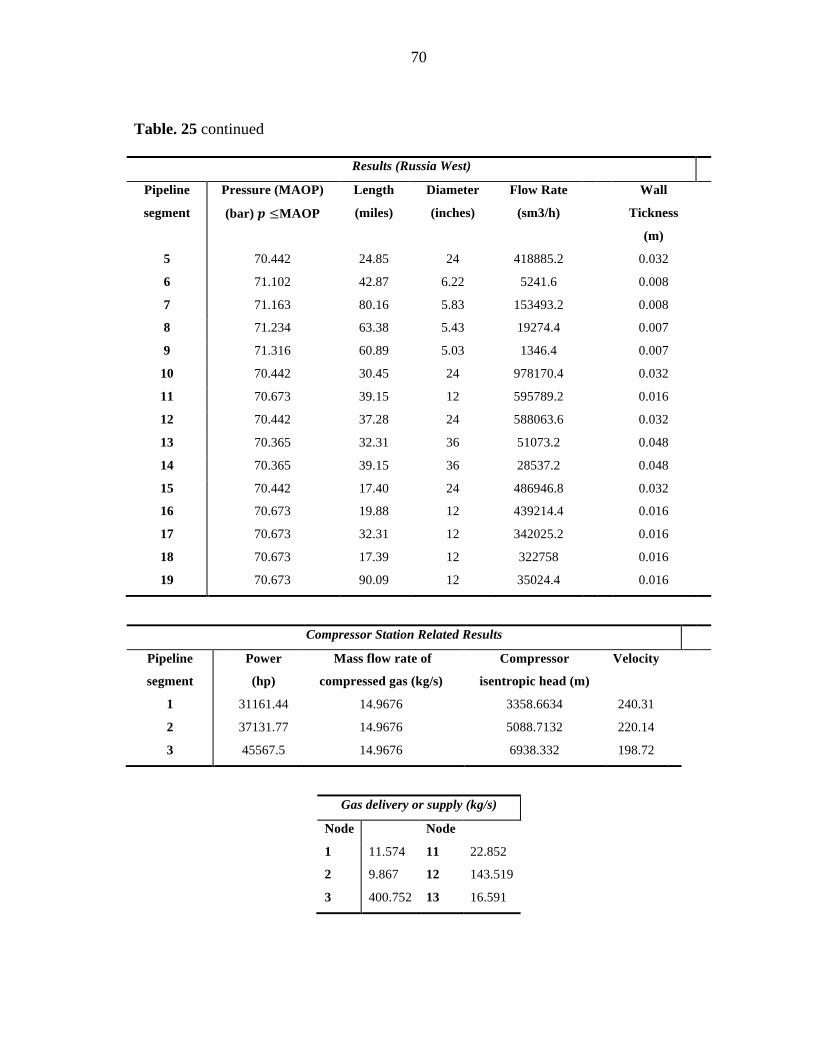
According to Tabkhi et al. (2009) optimization technique, we did some changes
on the pipeline segments. Because in this model, we should consider the cities` gas
demands to get the appropriate value for flow rates. So, we now have 19 pipeline
segments in this model for Russia west network. Also we assigned the current four
compressor stations to check the optimality of this network. Results for Russia west
network are shown in table 25.
Figure 21. Optimal design of Russia West Entrance Point (model 2) Table 25. Results for Russia West Network
Results (Russia West)
Pipeline
segment
Pressure (MAOP)
(bar) ! !MAOP
Length
(miles)
Diameter
(inches)
Flow Rate
(sm3/h)
Wall
Tickness
(m)
1 70.641 111.2 12.9 1022544 0.017
2 70.663 138.6 12.28 1028682 0.016
3 70.663 82.02 12.28 1261645.2 0.016
4 70.558 57.16 15.98 508212 0.021
70
Table. 25 continued
Results (Russia West)
Pipeline
segment
Pressure (MAOP)
(bar) 𝒑 ≤MAOP
Length
(miles)
Diameter
(inches)
Flow Rate
(sm3/h)
Wall
Tickness
(m)
5 70.442 24.85 24 418885.2 0.032
6 71.102 42.87 6.22 5241.6 0.008
7 71.163 80.16 5.83 153493.2 0.008
8 71.234 63.38 5.43 19274.4 0.007
9 71.316 60.89 5.03 1346.4 0.007
10 70.442 30.45 24 978170.4 0.032
11 70.673 39.15 12 595789.2 0.016
12 70.442 37.28 24 588063.6 0.032
13 70.365 32.31 36 51073.2 0.048
14 70.365 39.15 36 28537.2 0.048
15 70.442 17.40 24 486946.8 0.032
16 70.673 19.88 12 439214.4 0.016
17 70.673 32.31 12 342025.2 0.016
18 70.673 17.39 12 322758 0.016
19 70.673 90.09 12 35024.4 0.016
Compressor Station Related Results
Pipeline
segment
Power
(hp)
Mass flow rate of
compressed gas (kg/s)
Compressor
isentropic head (m)
Velocity
1 31161.44 14.9676 3358.6634 240.31
2 37131.77 14.9676 5088.7132 220.14
3 45567.5 14.9676 6938.332 198.72
Gas delivery or supply (kg/s)
Node Node
1 11.574 11 22.852
2 9.867 12 143.519
3 400.752 13 16.591
71
Table. 25 continued Gas delivery or supply (kg/s)
Node Node
4 6.128 14 9.902
5 47.309 15 77.778
6 10.026 16 6.597
7 5.046 17 33.594
8 5.451 18 38.946
9 4.832 19 115.741
10 5.906 20 14.285
After optimization of this network, three of four compressor stations are obtained
as optimal for current system. Figure 21 shows the optimal design of this network.
We have 13 pipeline arc segments including compressor arcs in this model for
Iran network. We assigned the current two compressor stations to check the optimality
of this network. Results for Iran network are shown in table 26.
Figure 22. Optimal design of Iran Entrance Point (model 2)
After optimization of this network, two compressor stations are obtained as
optimal for current system. Figure 22 shows the optimal design of this network.
72
Table 26. Results for Iran Entrance Network
Results (Iran)
Pipeline
segment
Pressure (MAOP)
(bar) 𝒑 ≤MAOP
Length
(miles)
Diameter
(inches)
Flow Rate
(sm3/h)
Wall
Tickness
(m)
1 70.327 74.56 47.99 1242115.2 0.063
2 70.327 119.93 47.99 1151906.4 0.063
3 70.327 117.44 47.99 1104818.4 0.063
4 70.327 160.31 47.99 1221487.2 0.063
5 70.350 103.77 40 135360 0.053
6 70.350 113.09 40 120981.6 0.053
7 70.350 133.60 40 37231.2 0.053
8 70.327 155.34 47.99 1001548.8 0.063
9 70.350 158.45 40 463039.2 0.053
10 70.350 100.66 40 202618.8 0.053
11 70.350 165.91 40 260420.4 0.053
12 70.350 249.8 40 425314.8 0.053
13 70.327 62.14 47.99 470696.4 0.063
Compressor Station Related Results
Pipeline
segment
Power
(hp)
Mass flow rate of
compressed gas (kg/s)
Compressor isentropic
head (m)
Velocity
1 42096.46 22.82 1796.2315 206.75
2 52464.516 22.82 2239.9785 185.20
Gas delivery or supply (kg/s)
Node Node
1 3.443 8 48.698
2 15.972 9 36.892
3 22.512 10 57.870
4 6.308 11 1.852
5 18.055 12 12.066
6 22.049 13 115.741
7 52.083 14 143.692
73
Figure 23. Optimal design of Blue Stream Entrance Point (model 2)
We have 2 pipeline arc segments including compressor arcs and three nodes
(cities) in this model for Russia-Blue Stream network. We assigned one compressor
station to check the optimality of this network. Results for Blue Stream network are
shown in table 27.
Table 27. Results for Russia Blue Stream Entrance Point
Results (Russia Blue Stream)
Pipeline
segment
Pressure (MAOP)
(bar) 𝒑 ≤MAOP
Length
(miles)
Diameter
(inches)
Flow Rate
(sm3/h)
Wall
Tickness
(m)
1 70.327 180.2 47.99 635418 0.063
2 70.327 121.8 47.99 709696.8 0.063
Compressor Station Related Results
Pipeline
segment
Power
(hp)
Mass flow rate of
compressed gas (kg/s)
Compressor isentropic
head (m)
Velocity
1 43173.784 141.782 228.381 204.16
Gas delivery or supply (kg/s)
Node
1 36.168
2 15.535
3 141.782
After optimization of this network, one compressor station is obtained as optimal
for current system. Figure 23 shows the optimal design of this network.
74
We have one pipeline segment including compressor arc and two nodes (cities)
in this model for Azerbaijan entrance point network. We assigned one compressor
station to check the optimality of this network. Results for Azerbaijan network are
shown in table 28.
Figure 24. Optimal design of Azerbaijan Entrance Point (model 2)
Table 28. Results for Azerbaijan Entrance Point
Results (Azerbaijan)
Pipeline
segment
Pressure (MAOP)
(bar) 𝒑 ≤MAOP
Length
(miles)
Diameter
(inches)
Flow Rate
(sm3/h)
Wall
Tickness
(m)
1 70.442 118.99 24.02 81039.6
0.032
Compressor Station Related Results
Pipeline
segment
Power
(hp)
Mass flow rate of
compressed gas (kg/s)
Compressor isentropic
head (m)
Velocity
1 18829.885 6.192 2280.752 309.14
Gas delivery or supply (kg/s)
Node
1 22.511
2 3.096
After optimization of this network, one compressor station is obtained as optimal
for current system. Figure 24 shows the optimal design of this network.
75
We have one pipeline segment including compressor arc and two nodes (cities)
in this model for Nigeria &Algeria entrance point network. We assigned one compressor
station to check the optimality of this network. Results for Nigeria &Algeria network are
shown in table 29.
Figure 25. Optimal design of Nigeria & Algeria Entrance Point (model 2) Table 29. Results for Nigeria &Algeria Entrance Point
Results (Nigeria &Algeria) Pipeline segment
Pressure (MAOP) (bar) 𝒑 ≤MAOP
Length (miles)
Diameter (inches)
Flow Rate (sm3/h)
Wall Tickness
(m)
1 70.442 14 24 28648.8
0.032
Compressor Station Related Results
Pipeline segment
Power (hp)
Mass flow rate of compressed gas (kg/s)
Compressor isentropic head (m)
Velocity
1 1835.140 49.336 27.898 990.24
Gas delivery or supply (kg/s)
Node
1 7.958
2 24.668
After optimization of this network, one compressor station is obtained as optimal
for current system. Figure 25 shows the optimal design of this network.
Finally, after the solution procedure for model 2, the obtained optimal network
with the optimal design parameters is shown in Appendix D.
76
CHAPTER 7
COMPARISON OF TWO MODELS
After the optimization of the first model (from Edgar et al. 1978), we found that
the optimal gas transmission network with all the constraints with a single network were
obtained for the case of Turkey as can be seen in section 6.1. Our objective function`s
optimum value is obtained as 11,937,740 dollar /year by using this model while
objective function`s first value was 20,485,390 dollars/year which is estimated based on
BOTAS costs. It can be seen that this model helped us to save approximately $8.5
million. We also obtained five compressor stations as optimal for Turkey from the 32
possible compressor stations in the first state of our model. Appendix C reflects the final
state of Turkish natural gas pipeline network according to first model results.
Also, after the optimization of the second model (from Tabkhi et al. 2009), we
found the optimal gas transmission network with all the constraints with a single
network for the case of Turkey, which can be seen in chapter 6.2. Our objective
function`s optimum value is obtained as 18,733,680 dollar /year by using this model
while objective function`s first value was 20,485,390 dollars/year which is estimated
based on BOTAS costs. We also obtained eight compressor stations as optimal for
Turkey. Appendix D reflects the final state of Turkish natural gas pipeline network
according to second model results.
Table 30. Detailed costs of optimal and current designed networks & Comparison
Model 1 Costs of
Networks
Model 2 Costs
of Networks
Networks Current Costs of
Networks
$7,066,330 $7,038,900 Russia West $14,237,346.05
$2,815,900 $7,212,100 Iran $4,211,639.7
$400,790 $1,231,700 Azerbaijan $614,561.7
$1,451,900 $3,130,600 Russia BS $1,307,842.55
$202,820 $120,380 Nigeria & Algeria $113,642
$11,937,740 $18,733,680 TOTAL $20,485,390
77
Detailed cost of all entrance points with their pipeline segments are shown on
table 30.
Comparison according to diameter sizes:
According to two models that we have done, second optimization model provides
us more appropriate and efficient results comparing them to first model. Also it is close
to current actual values of Turkish natural gas network system. It considers more
realistic values for diameters to make the natural gas system optimal for the minimal
operating costs.
Comparison according to pipeline lengths:
In first model we fixed the segments` length and the optimization procedure gave
us an optimal pipeline segment lengths according to other dependent values, while the
second model fixed the pipeline segment lengths according to real life and current
lengths of pipeline segments.
Comparison according to pressure values:
We assigned compressor stations on all the pipeline segments to examine the
optimal compressor station number and optimal place to put CSs. Comparing this
method to second model, it seems first model could give more appropriate value to
arrange the pressure values on the segments. In second model, we have maximum
allowable operating pressure (MAOP) to set the pressures on the arcs. But it only gives
the maximum value for the pressures while Edgar`s model is giving the exact value for
pressures.
Comparison according to flow rates:
Second model is considering the demands for the cities namely nodes on natural
gas pipeline network to arrange the flow rates, however first model is not considering
these demand values for the optimality. So, second model gives more optimal and
78
accurate results to get the optimal flow rates according to optimization model from
Tabkhi et al. (2009).
As a summary, model 2 has better results according to current system values and
decision variables of lengths, diameter sizes, number of compressor stations and flow
rates comparing them to model 1 results, even though pressure values of model 2 gave
the small and general picture for future instead of giving detailed pressure values as in
model 1 results.
79
CHAPTER 8
CONCLUSION
In the Turkish natural gas pipeline network system there are five entrance points and
five different networks. Also, these networks have eight compressor stations that are still
in process. After applying these optimization methods, we got 5 compressor stations
from model 1 compared with 8 compressor stations in the current network. We can use
these extra compressor stations from model 1 method for the new network systems in
future. Also, we don`t have compressor station for the network of Nigeria & Algeria
(LNG) at current network system; so we can move one of these extra compressor to this
optimal network as shown in figure 27 according to model 1.
For the model 2, we got eight compressor stations for whole system. Currently there
are 4 compressor stations in Russia-west network. But after optimization procedure we
got three CSs for this entrance network. As we mentioned above, we don`t have CS in
Nigeria & Algeria network. So, we also can use this extra compressor station for this
network, because optimization model gives us a CS for this network. Even though we
still have eight compressor stations for whole network, our total cost is less than current
cost. As a result of this explanation, we can state that model 2 can also be used in future
for new network systems and for now to analyze the current system for better and
optimal progress.
Turkey, namely Turkish Petroleum Pipeline Corporation (BOTAS) is now working
on some new agreements to supply natural gas to Turkey with the new countries that are
rich and supply high quality natural gas. So, to save money and to decrease the
operation, maintenance and capital cost of natural gas system, we can suggest the
company to relocate these extra compressors on new networks instead of setting up the
new compressors.
80
BOTAS was supplying gas to 62 cities in 2011 according to EMRA`s report (see
figure 26). Now, the company supplies natural gas to 71 cities with their small towns and
villages out of 81 cities in 2012 in Turkey. There are 10 cities left, including Agri, Igdir,
Mugla, Artvin, Tunceli, Bingol, Mus, Bitlis, Mardin, and Sirnak. So, the results of this
optimization about Turkish natural gas pipeline network give us a chance to suggest the
company to invest money more in these new cities rather than investing in current
expensive network. Because company can get more efficient natural gas transportation
and distribution infrastructure by reducing the cost-related factors from current system.
Then, they can design the new networks or re-design the small networks that are still
under construction, according to these results and optimal information about their natural
gas network system.
Figure 26. Number of cities provided with natural gas supply (Source: EMRA Sector
Report, 2011)
Also, after getting the optimal variables such as suction and discharge pressures,
diameters, lengths, flow rates, number of compressor stations and new segments, the
company can supply enough natural gas as energy resource to meet customer demand in
Turkey with decreased cost compared with the current system.
81
Moreover, according to these optimization results we can suggest that the new and
optimal lengths, diameters and discharge and suction pressures can help the company to
reduce and minimize the cost of operating compressors and pipelines. In model two,
according to more realistic values of diameters and pipeline segment lengths, we can get
more efficient information for current and future network design of natural gas system.
Table 31. Ongoing transmission and distribution lines in Turkey (Source: Botas,
http://www.botas.gov.tr/index.asp)
Current Agreements Supply (billion
𝑚!/year)
Signature
Date
Duration
(year)
Completion
Date
Algeria (LNG) 4 1988 20 2008
Nigeria (LNG) 1.2 1995 22 2017
Iran 10 1996 25 2021
Russian Fed. (Blue
Stream)
16 1997 25 2022
Russian Fed. (West) 8 1998 23 2021
Turkmenistan 16 1999 30 2029
Azerbaijan 6.6 2001 15 2016
Table 31 shows the ongoing transmission and distribution lines in Turkey. Many of
them are still in process and Turkish Petroleum Pipeline Corporation, the state company
in Turkey for natural gas, is working on these networks. We applied our model to
company`s current pipeline network. But after completion of these networks, the system
will be more complex and it will be very hard to control and manage. So, to prevent this
complexity, the company could use our optimization model to optimize their new
networks. This information about the optimal design of the current natural gas pipeline
82
system can improve the future state of network system with the minimum cost and
optimal values of the decision variables.
Furthermore, the studies to construct Erzincan Compressor Station and a natural gas
underground storage facility at Tuz Golu (Salt Lake) Basin are proceeding and it is the
most current project in Turkey for the natural gas supply. Internationally initiated transit
pipelines and interconnection projects with neighboring countries are underway. So,
company can relocate these extra compressors to these new networks and they can save
money, time and effort after optimizing their network system. Also, optimal diameters,
lengths, pressures at its optimal flow rates can give the idea to construct the new natural
gas pipeline systems in Turkey.
In conclusion, we believed that these optimization techniques, which we have used
to optimize the Turkish natural gas network system, give us effective and efficient
results to forecast and construct the future configuration of the natural gas network more
accurately with savings of money, time and effort.
83
REFERENCES
Adeyanju and Oyekunle. Optimization of Natural Gas Transportation in Pipeline, Department of Chemical Engineering, University of Lagos, Nigeria. Retrieved February, 2013 from: http://www.unilag.edu.ng/opendoc.php?sno=16333&doctype=pdf.
Babu B.V. Rakesh A., Pallavi G. and Syed J.H., (2005c), “Optimal Design of Gas
Transmission Network Using Differential Evolution, Journal of Multidisciplinary Modeling in Materials and Structures 1, 315-328.
Bloomberg, 2013. Gasoline prices in selected countries worldwide as of January 18,
2013 (in U.S. dollars per gallon), Worldwide - selected regions; Bloomberg; AIRINC; Europe's Energy Portal; IMF; EIA; CIA; January 3 to 18, 2013.
BP Energy Outlook Projection to 2030. January, 2012. BP Statistical Review of World Energy (June 2011), Natural Gas. De Wolf D, Smeers Y, (2000). The Gas Transmission Problem Solved by An Extension
of The Simplex Algorithm. Management Science Vol: 46 No: 11 pp:1454–1465. Dempsey J. (2007), Gazprom plans to re-route controversial European pipeline. The
New York Times, International Herald Tribune, 23 August 2007. Retrieved August 23, 2007 from: http://www.iht.com/articles/2007/08/23/news/pipeline.php?page=1.
Edgar TF, Himmelblau DM, Bickel TC (1978) Optimal Design of Gas Transmission
Networks. Society of Petroleum Engineers Journal, Volume: 18, No: 2. Edgar TF, Himmelblau DM, s. Lasdon, (January 12, 2001). Optimization of Chemical
Processes. McGraw-Hill, Science/Engineering/Math: 2nd Edition, New York. Edgar, Himmelblau and Lasdon (1978), Small model of GAMS for “Optimal Design of
a Gas Transmission Network” retrieved February 2013 from: http://www.gams.com/modlib/libhtml/gasnet.htm.
EIA, Natural Gas Consumption by End Use, retrieved from April 2013 from:
http://www.eia.gov/dnav/ng/ng_cons_sum_dcu_nus_a.htm. EIA, 2011, Natural Gas Production/Consumption by region, International Energy
Outlook.
84
EIA, February, 2013, Country Analysis of Turkey. Retrieved March 2013 from: http://www.eia.gov/countries/cab.cfm?fips=TU.
Energy Information Administration, (January, 2000), The national energy modeling
system: an overview, natural gas transmission and distribution module, ftp://ftp.eia.doe.gov/modeldoc/m0622000.pdf.
Energy Information Administration, Turkey, retrieved February 2013 from: http://www.eia.gov/countries/cab.cfm?fips=TU. Energy Market Regulatory Authority (EMRA) (2011), Natural Gas Market, Sector
Report. Energy Market Regulatory Authority (EMRA) (2012), Natural Gas Market Statistics,
Retrieved March, 2013 from: http://epdk.com.tr. Energy Market Regulatory Authority (EMRA), Natural Gas Market Sector Report, 2011 Engineeringtoolbox, Ratios of specific heat information. Retrieved March 2013 from:
http://www.engineeringtoolbox.com/specific-heat-ratio-d_608.html. GAMS Development Corporation, General Algebraic Modeling System: from: http://
www.gams.com. GPSA, “Gas Processor Suppliers Association”, Engineering Data Book, 1972. Harrison M. R., Shires T. M., Wessels J. K. and Cowgill R. M. (1997). Methane
emissions from the natural gas industry. Technical Report EPA/600/SR–96/080, U.S. Environmental Protection Agency, Center for Environmental Research Information National Risk Management Research Laboratory, Research Triangle Park, NC, 1997.
International Energy Agency (Edition: 2010, 2011, 2012), Natural Gas Information.
International Energy Outlook, 2011. US Energy Information Administration. Knoema, 2011. Natural gas prices in selected countries worlwide. Retrieved May, 2013
from: http://knoema.com/cdgnkmb#Canada
Kurz R., 2007. Considerations on compressor station layout. Pipeline & Gas Journal, 234(9): 22–26.
Naturalgas.org, Stages of Natural Gas Processing retrieved February & March 2013,
from: http://www.naturalgas.org.
85
Naturalgas.org, The Process of Getting Natural Gas, retrieved March 2013 from: http://www.naturalgas.org/naturalgas/naturalgas.asp.
Nord Stream. The new gas supply route to Europe. Electronic Newsletter, 01 September
retrieved February 2013 from: http://botas.gov.tr. Turkish Petroleum Pipeline Corporation (BOTAS), Natural Gas Purchase Contracts.
Retrieved March 2013 from: http://www.botas.gov.tr/index.asp. Turkish Petroleum Pipeline Corporation (BOTAS), Turkish Natural Gas Network
Information, retrieved November 2012 from: http://www.botas.gov.tr/index.asp.
86
U.S. Energy Information Administration, Projections in the Annual Energy Outlook 2013. Early Release Overview,
U.S. Energy Information Administration, 2012, Annual Energy Outlook. U.S. Environmental Protection Agency. Greenhouse gas emissions reporting from the
petroleum and natural gas industry. Technical report, U.S. Environmental Protection Agency, Climate Change Division, Washington, DC, 2010.
Zheng Q. P., Rebennack S., Iliadis N. A. and Pardalos P. M., (2010). Optimization
Models in the Natural Gas Market, Handbook of Power Systems I, Energy Systems published by Springer Berlin Heidelberg. Edited by Panos M. Pardalos, Steffen Rebennack, Mario V. F. Pereira, Niko A. Iliadis, pp 121-148.
87
APPENDIX A
ACRONYMS
AER American Economic Review
Bcf One billion cubic feet
BOTAS Turkish Petroleum Pipeline Corporation
BP British Petroleum
CO2 Carbon dioxide
DOE U.S. Department of Energy
EIA Energy Information Administration
EIA Energy Information Agency
EMRA T.R. Energy Market Regulatory Authority
EPA U.S. Environmental Protection Agency
GIS Geographic Information System
GWh Gigawatt-hour (one thousand megawatt-hours)
IEA International Energy Agency
MENR Ministry of Natural Resources
Mtep Millions tons of equivalent oil
NG Natural Gas
OECD The Organization for Economic Co-operation and Development
SEEP South East European Pipeline
TANAP Trans Anatolian Pipeline
TPAO Turkish Petroleum Corporation
USSR Union of Soviet Socialist Republics
APPENDIX B
Current Map of Natural Gas Transmission System in Turkey
88
APPENDIX C
Final Optimal Network of Natural Gas Transmission System in Turkey (Model 1)
89
APPENDIX D
Final Optimal Network of Natural Gas Transmission System in Turkey (Model 2)