20
OPTIMAL SIZING OF DISTRIBUTED GENERATIONS IN MICROGRID SYSTEM School of Electrical engineering, Wuhan University Prof. DENG Changhong Team:(HE Jun, XU Qiushi, LIU Cuilin, PAN Hua)

OPTIMALSIZINGOFDISTRIBUTEDGENERATIONSINMICROGRIDSYSTEM �
SchoolofElectricalengineering,WuhanUniversity
Prof.DENGChanghong
Team:(HEJun,XUQiushi,LIUCuilin,PANHua)
IntroducGon � 0�
TheOpGmalsizingmodelofDistributedGeneraGoninMicro‐gridsystem �
1�
conclusion � 4�
SimulaGonexample � 3�
Method:ProbabilisGcMethod � 2�
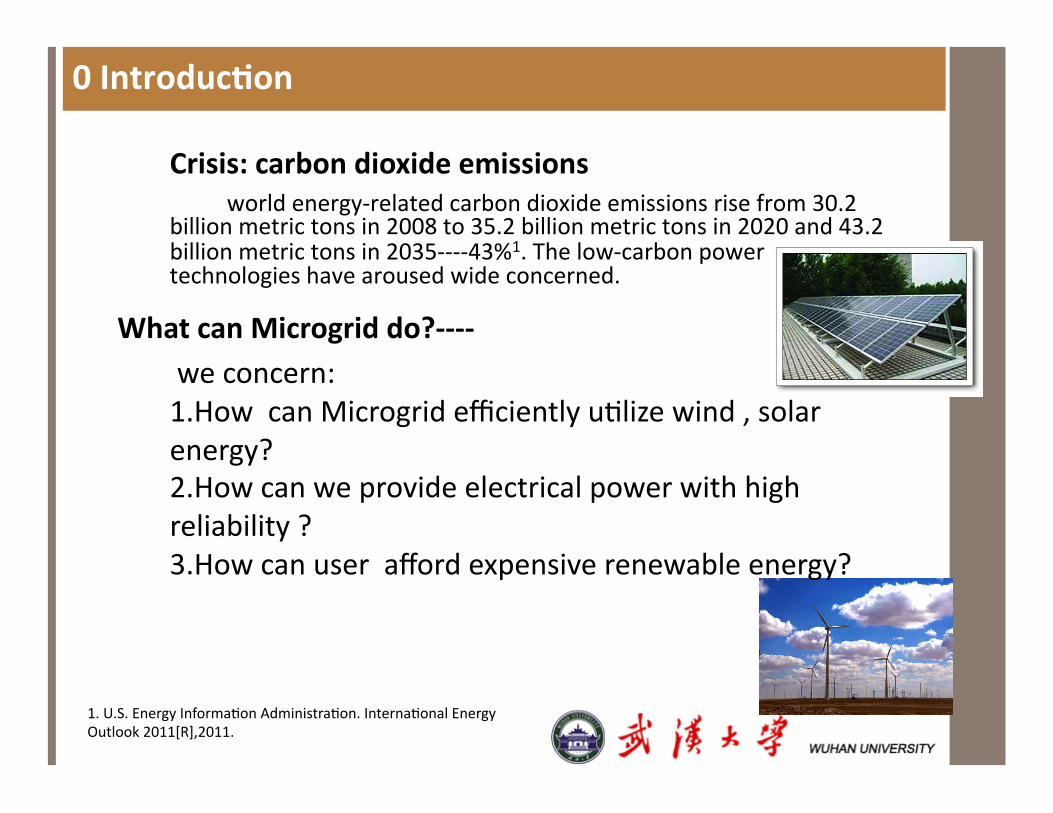
0IntroducBon�
worldenergy‐relatedcarbondioxideemissionsrisefrom30.2billionmetrictonsin2008to35.2billionmetrictonsin2020and43.2billionmetrictonsin2035‐‐‐‐43%1.Thelow‐carbonpowertechnologieshavearousedwideconcerned.
Crisis:carbondioxideemissions�
1.U.S.EnergyInformaGonAdministraGon.InternaGonalEnergyOutlook2011[R],2011.�
WhatcanMicrogriddo?‐‐‐‐�weconcern:1.HowcanMicrogridefficientlyuGlizewind,solarenergy?2.Howcanweprovideelectricalpowerwithhighreliability?3.Howcanuseraffordexpensiverenewableenergy?
1TheOpBmalsizingmodelofDistributedGeneraBoninMicro‐gridsystem�
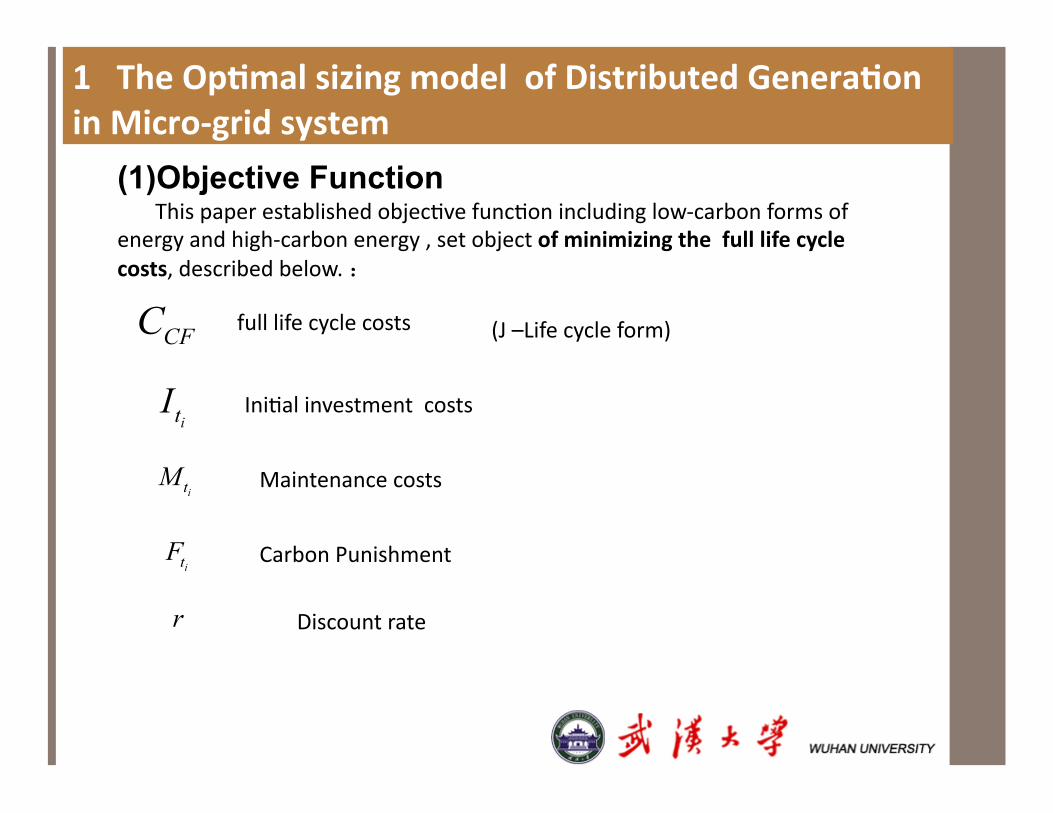
(1)Objective Function ThispaperestablishedobjecGvefuncGonincludinglow‐carbonformsofenergyandhigh‐carbonenergy,setobjectofminimizingthefulllifecyclecosts,describedbelow.:�
fulllifecyclecosts�
Maintenancecosts�
IniGalinvestmentcosts�
Discountrate�
CarbonPunishment �
(J–Lifecycleform)�
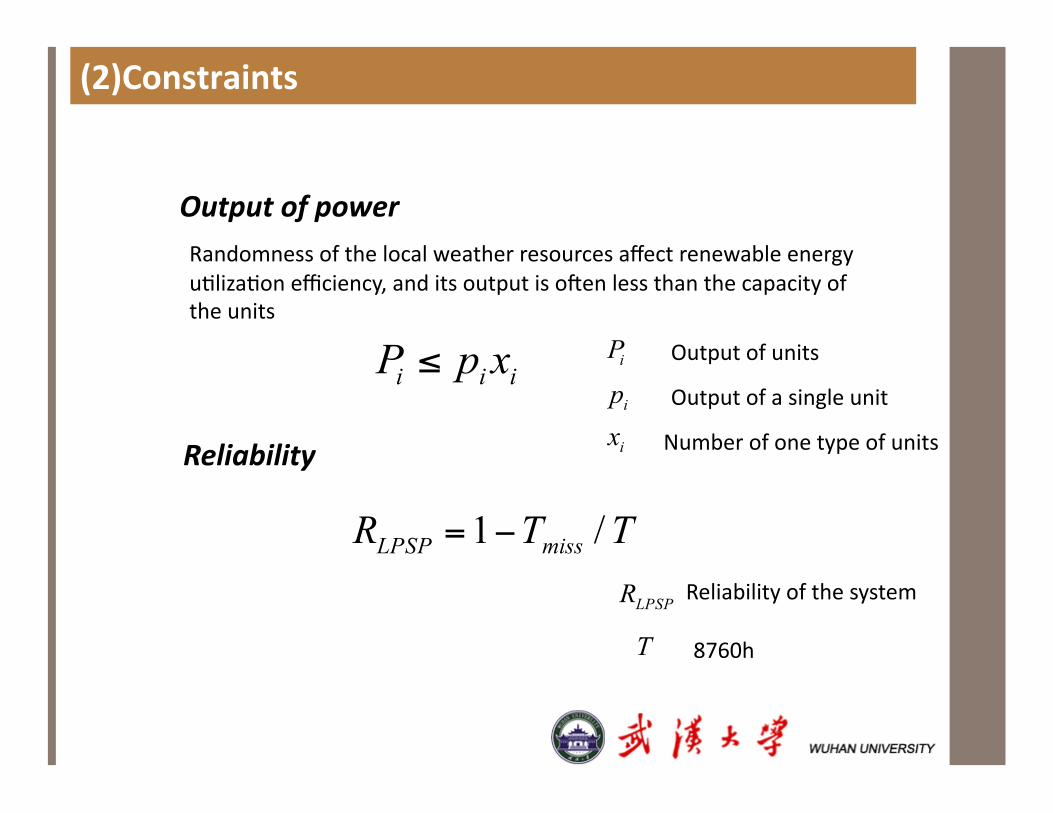
(2)Constraints�
Outputofpower �RandomnessofthelocalweatherresourcesaffectrenewableenergyuGlizaGonefficiency,anditsoutputisodenlessthanthecapacityoftheunits �
Reliability�
Outputofunits �
Outputofasingleunit �
Numberofonetypeofunits �
Reliabilityofthesystem
8760h�
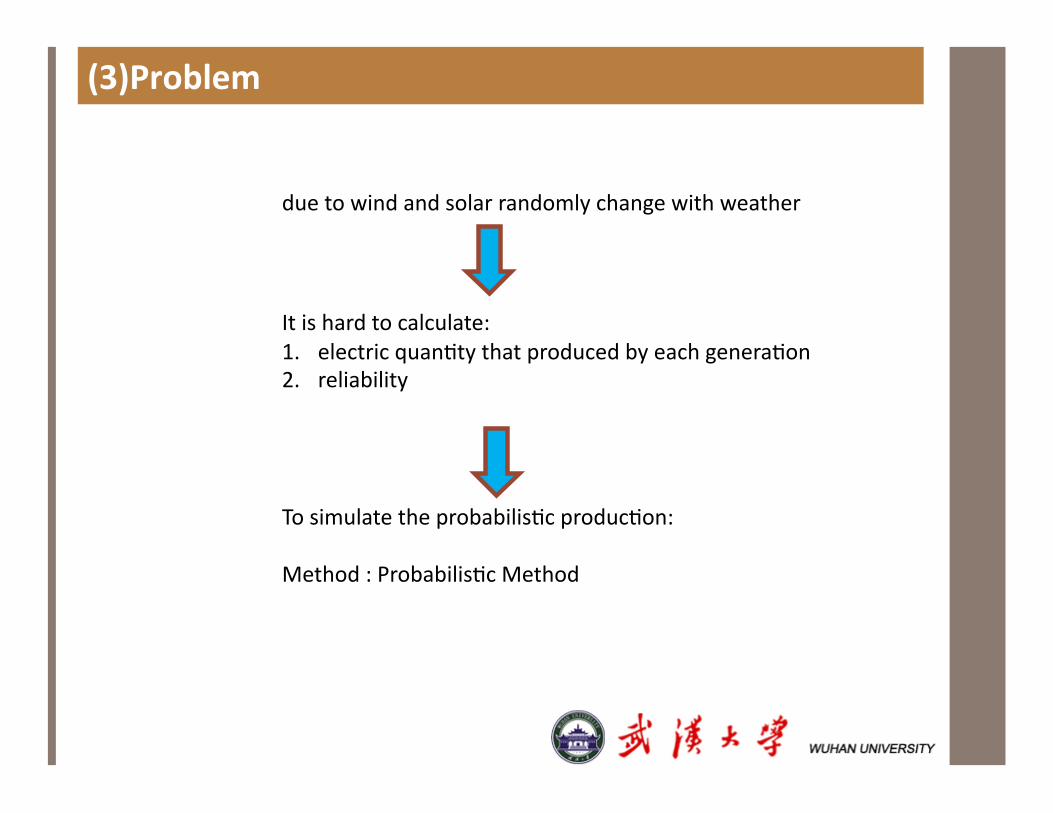
(3)Problem�
duetowindandsolarrandomlychangewithweather �
Itishardtocalculate:1. electricquanGtythatproducedbyeachgeneraGon2. reliability
TosimulatetheprobabilisGcproducGon:
Method:ProbabilisGcMethod
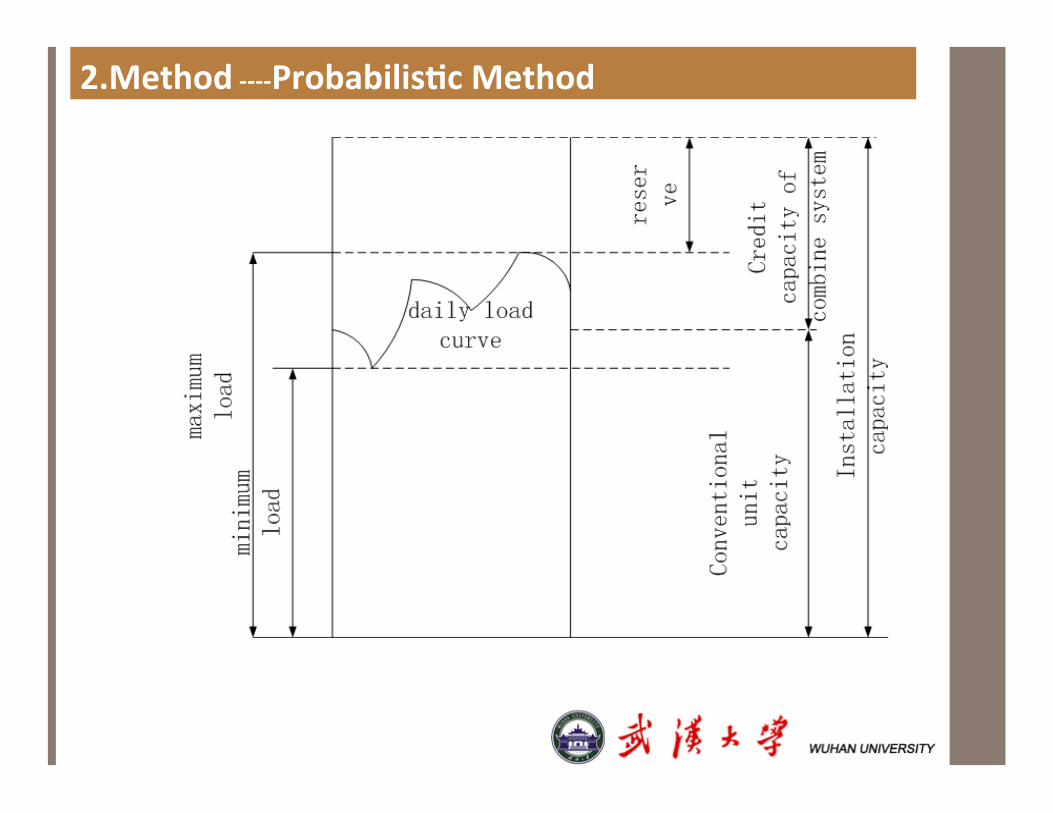
2.Method‐‐‐‐ProbabilisBcMethod�
2.Method‐‐‐‐ProbabilisBcMethod
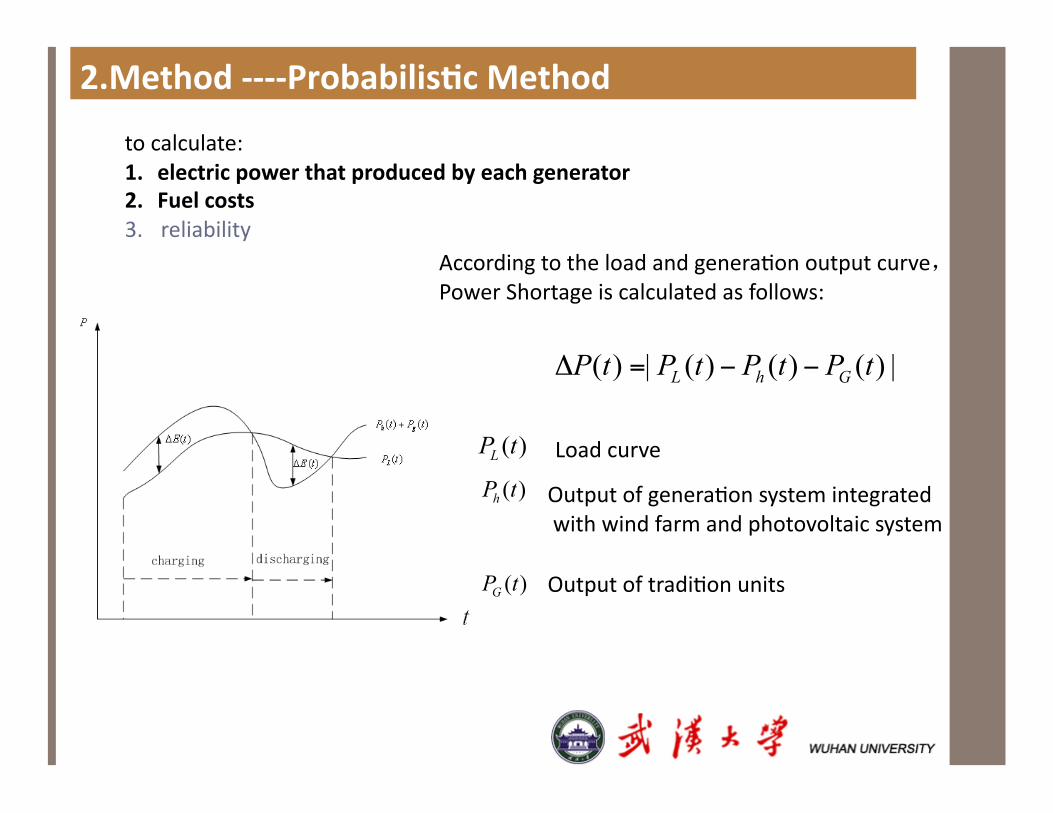
AccordingtotheloadandgeneraGonoutputcurve,PowerShortageiscalculatedasfollows:�
Loadcurve�
OutputofgeneraGonsystemintegratedwithwindfarmandphotovoltaicsystem�
OutputoftradiGonunits �
tocalculate:1. electricpowerthatproducedbyeachgenerator2. Fuelcosts3. reliability
2.Method‐‐‐‐ProbabilisBcMethod
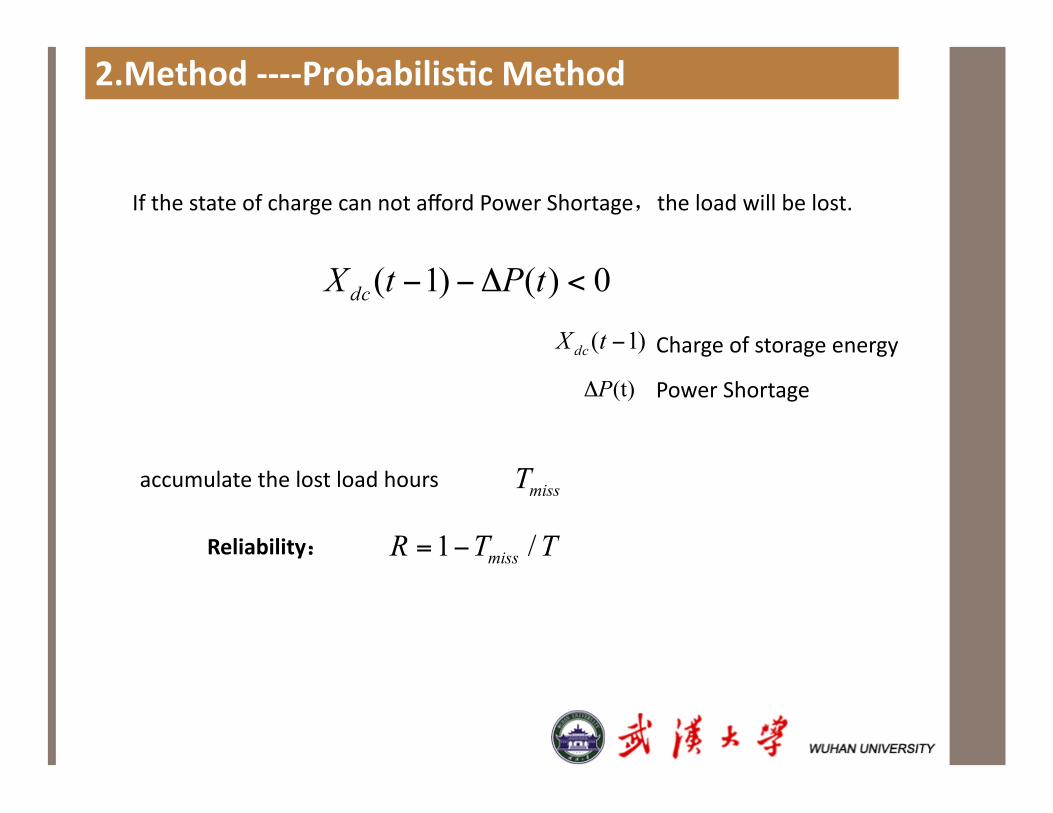
IfthestateofchargecannotaffordPowerShortage,theloadwillbelost. �
accumulatethelostloadhours�
Reliability:
Chargeofstorageenergy�
PowerShortage�
2.Method‐‐‐‐ProbabilisBcMethod
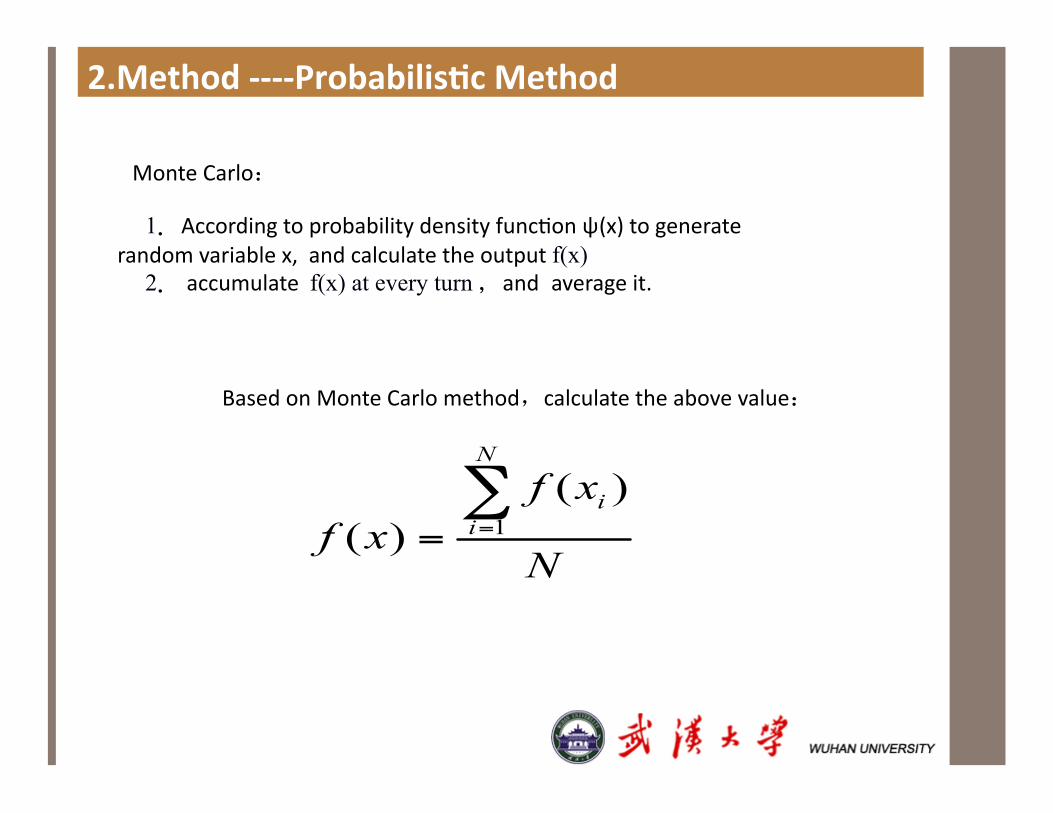
BasedonMonteCarlomethod,calculatetheabovevalue:�
MonteCarlo: �
1.AccordingtoprobabilitydensityfuncGonψ(x)togeneraterandomvariablex,andcalculatetheoutputf(x)
2.accumulatef(x) at every turn ,and averageit.�
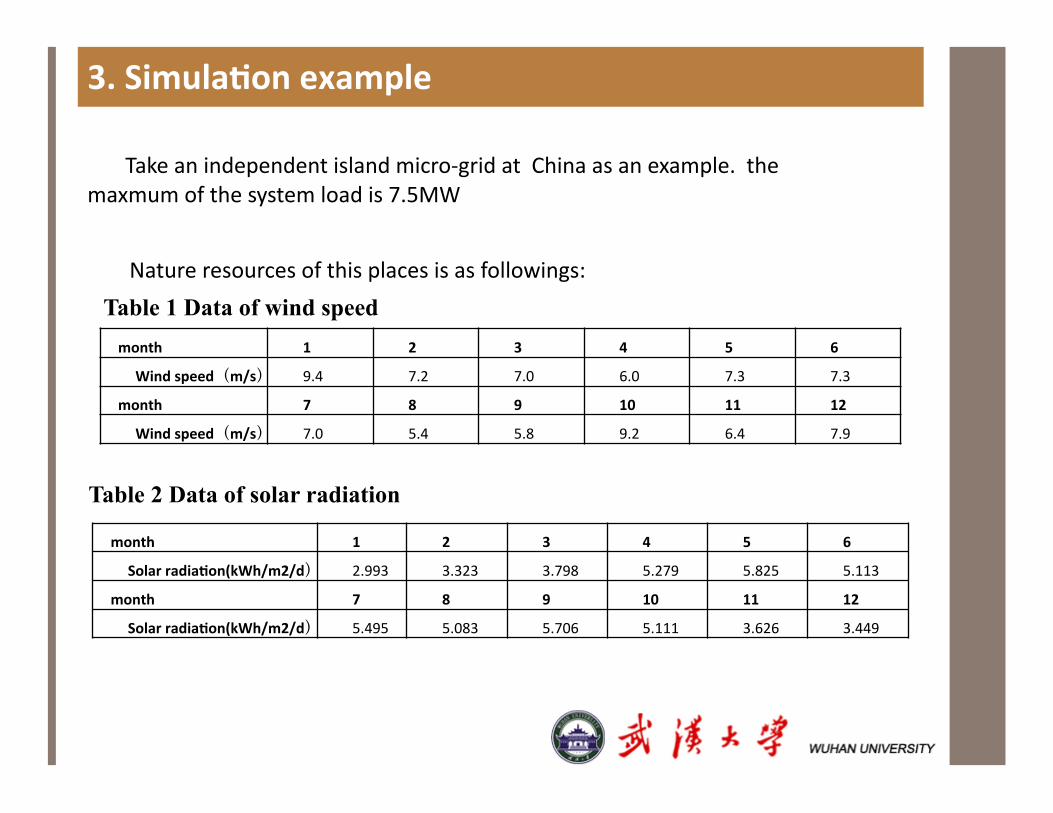
3.SimulaBonexample�
month 1 2 3 4 5 6
Windspeed(m/s) 9.4 7.2 7.0 6.0 7.3 7.3
month 7 8 9 10 11 12
Windspeed(m/s) 7.0 5.4 5.8 9.2 6.4 7.9
Table 1 Data of wind speed
month 1 2 3 4 5 6
SolarradiaBon(kWh/m2/d) 2.993 3.323 3.798 5.279 5.825 5.113
month 7 8 9 10 11 12
SolarradiaBon(kWh/m2/d) 5.495 5.083 5.706 5.111 3.626 3.449
Table 2 Data of solar radiation
Takeanindependentislandmicro‐gridatChinaasanexample.themaxmumofthesystemloadis7.5MW�
Natureresourcesofthisplacesisasfollowings:�
Case1: Limit the capacity of tradition units �
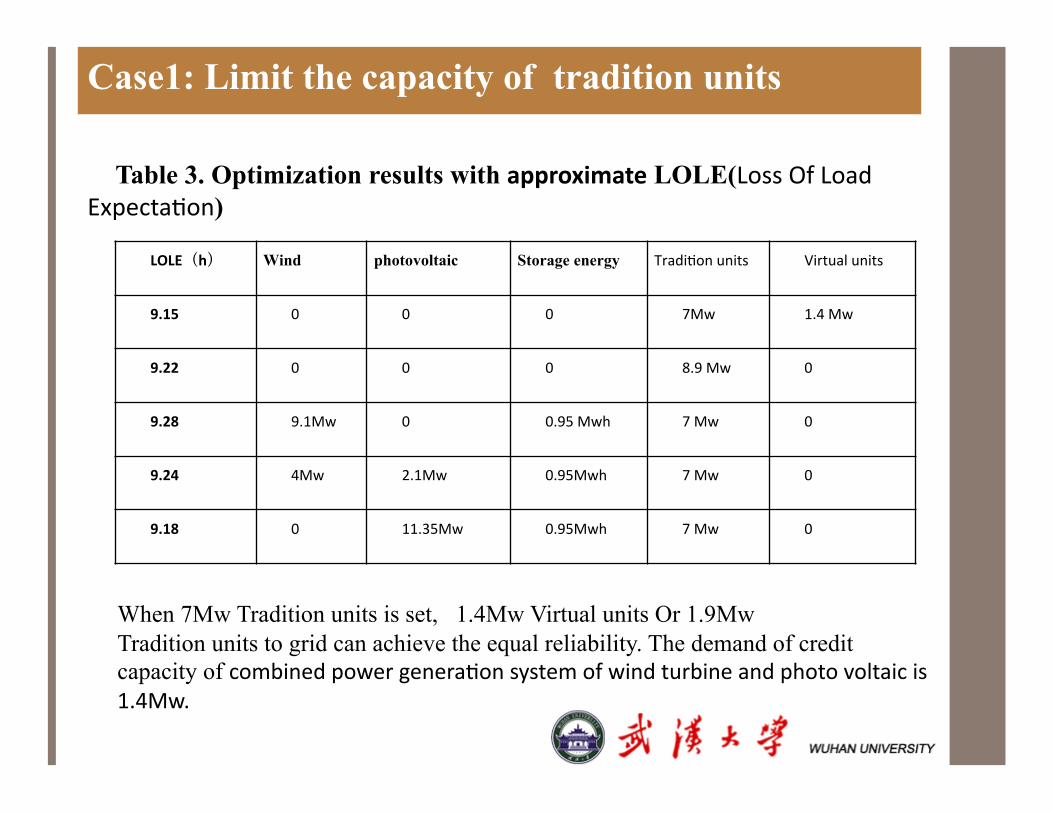
LOLE(h) Wind photovoltaic Storage energy TradiGonunits Virtualunits
9.15 0 0 0 7Mw 1.4Mw
9.22 0 0 0 8.9Mw 0
9.28 9.1Mw 0 0.95Mwh 7Mw 0
9.24 4Mw 2.1Mw 0.95Mwh 7Mw 0
9.18 0 11.35Mw 0.95Mwh 7Mw 0
Table 3. Optimization results with approximate LOLE(LossOfLoadExpectaGon)
When 7Mw Tradition units is set, 1.4Mw Virtual units Or 1.9Mw Tradition units to grid can achieve the equal reliability. The demand of credit capacity of combinedpowergeneraGonsystemofwindturbineandphotovoltaicis1.4Mw.
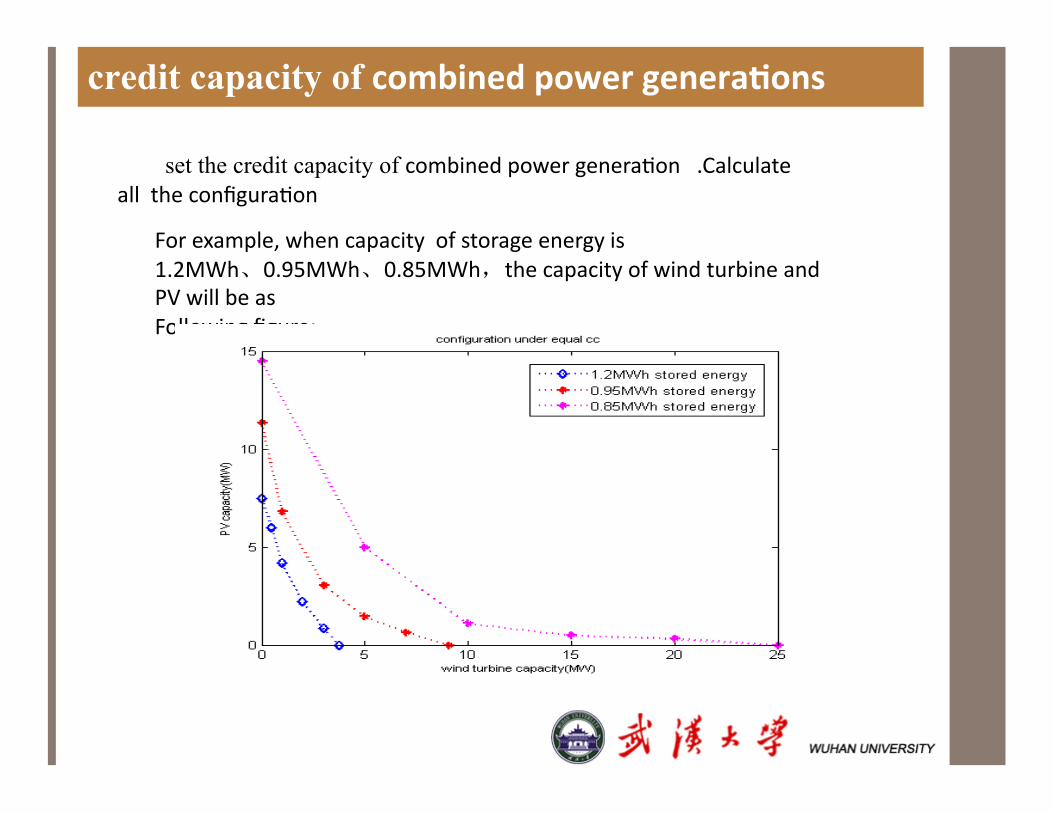
credit capacity of combinedpowergeneraBons
set the credit capacity of combinedpowergeneraGon.CalculatealltheconfiguraGon�
Forexample,whencapacityofstorageenergyis1.2MWh、0.95MWh、0.85MWh,thecapacityofwindturbineandPVwillbeasFollowingfigure:�
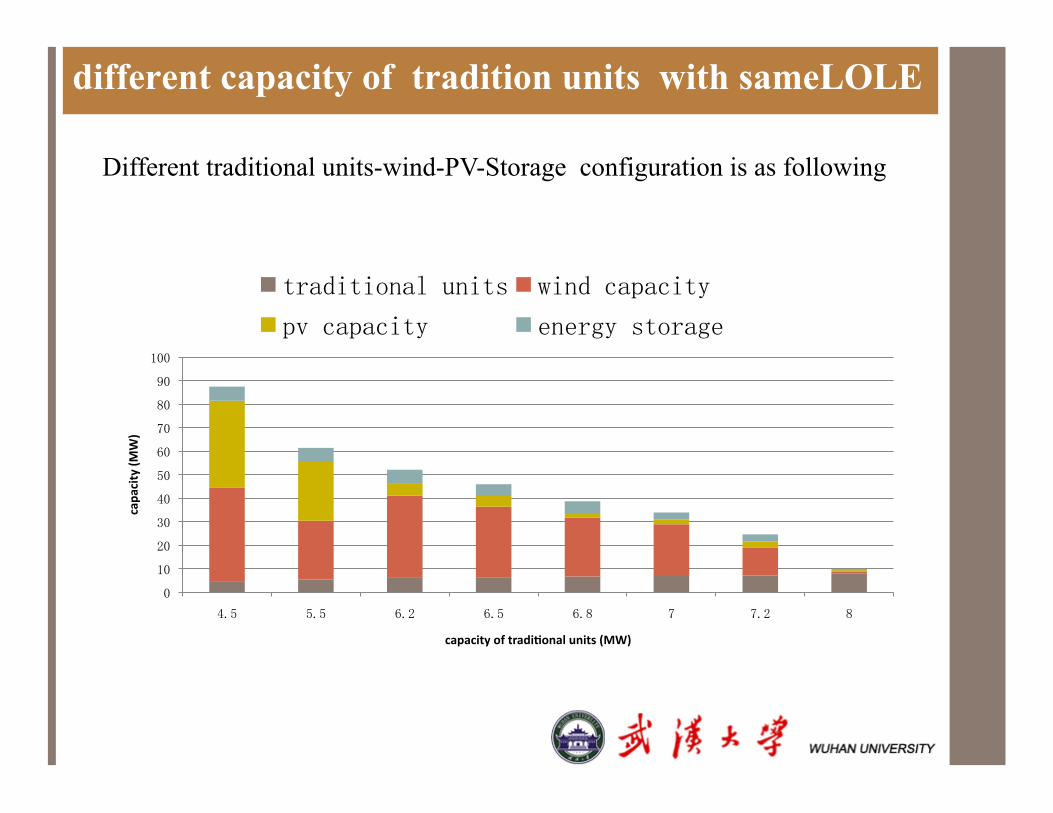
different capacity of tradition units with sameLOLE
0�
10�
20�
30�
40�
50�
60�
70�
80�
90�
100�
4.5� 5.5� 6.2� 6.5� 6.8� 7� 7.2� 8�
capa
city(M
W)�
capacityoftradiBonalunits(MW)�
traditional units� wind capacity�
pv capacity� energy storage�
Different traditional units-wind-PV-Storage configuration is as following
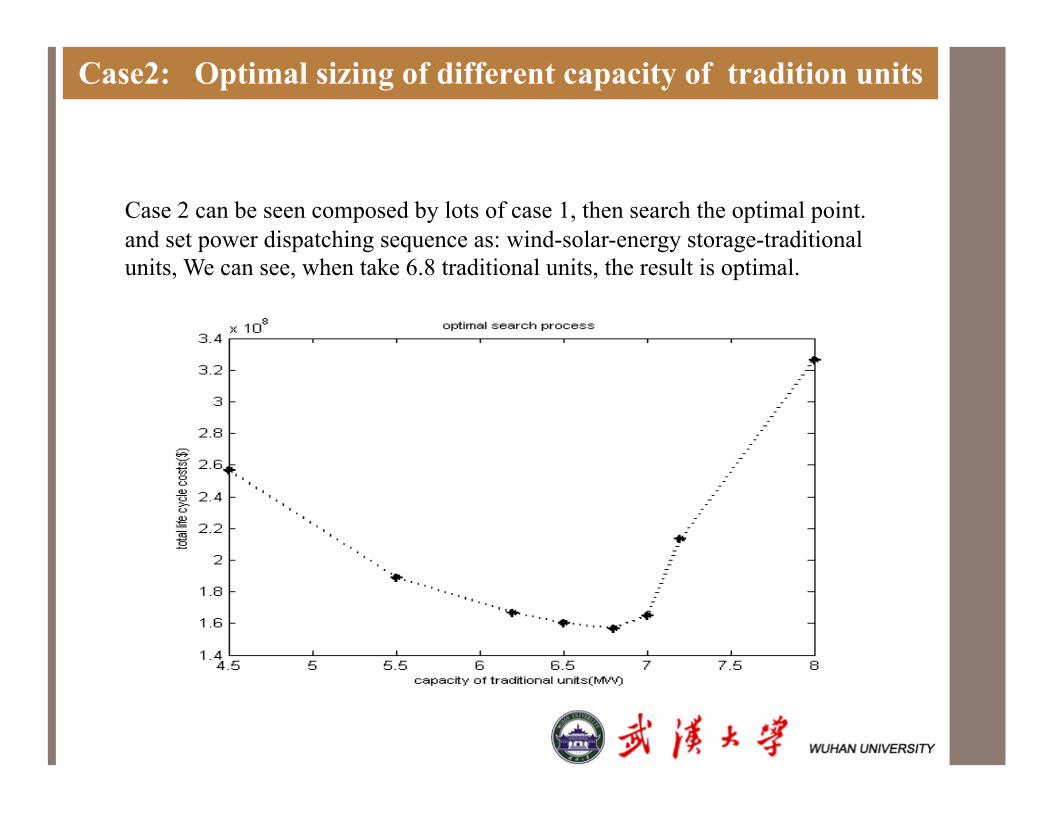
Case 2 can be seen composed by lots of case 1, then search the optimal point. and set power dispatching sequence as: wind-solar-energy storage-traditional units, We can see, when take 6.8 traditional units, the result is optimal.�
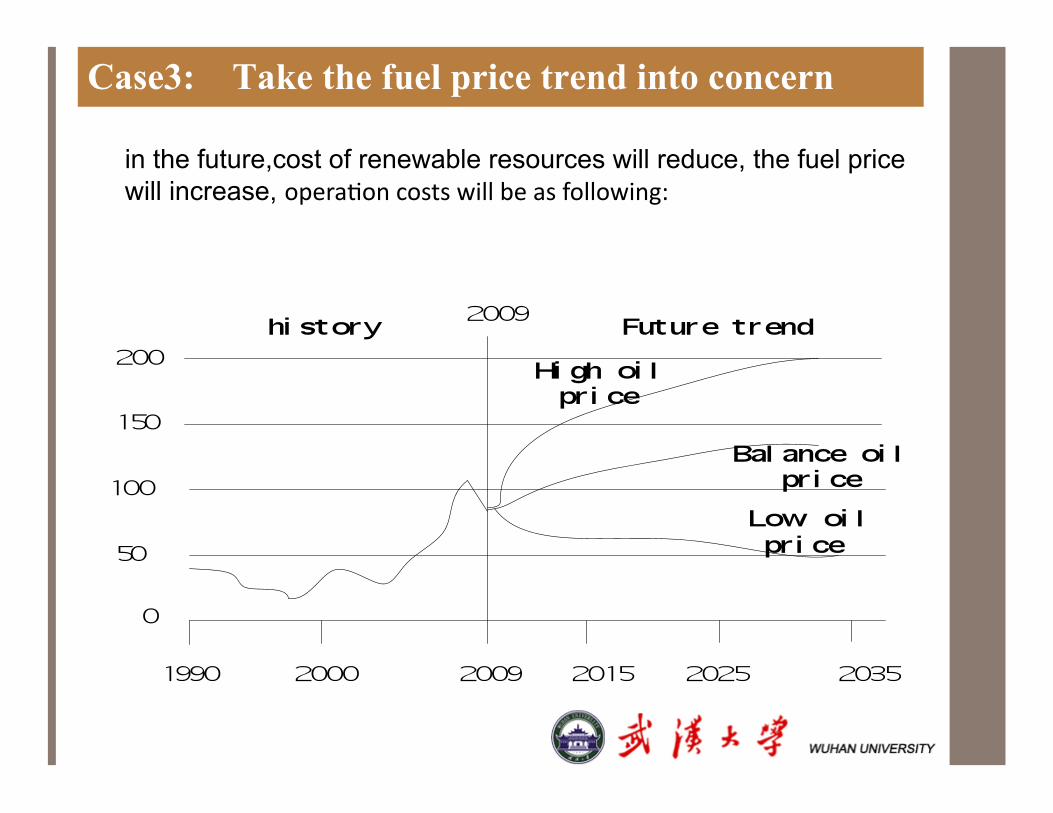
Case3: Take the fuel price trend into concern�
in the future,cost of renewable resources will reduce, the fuel price will increase, operaGoncostswillbeasfollowing:�
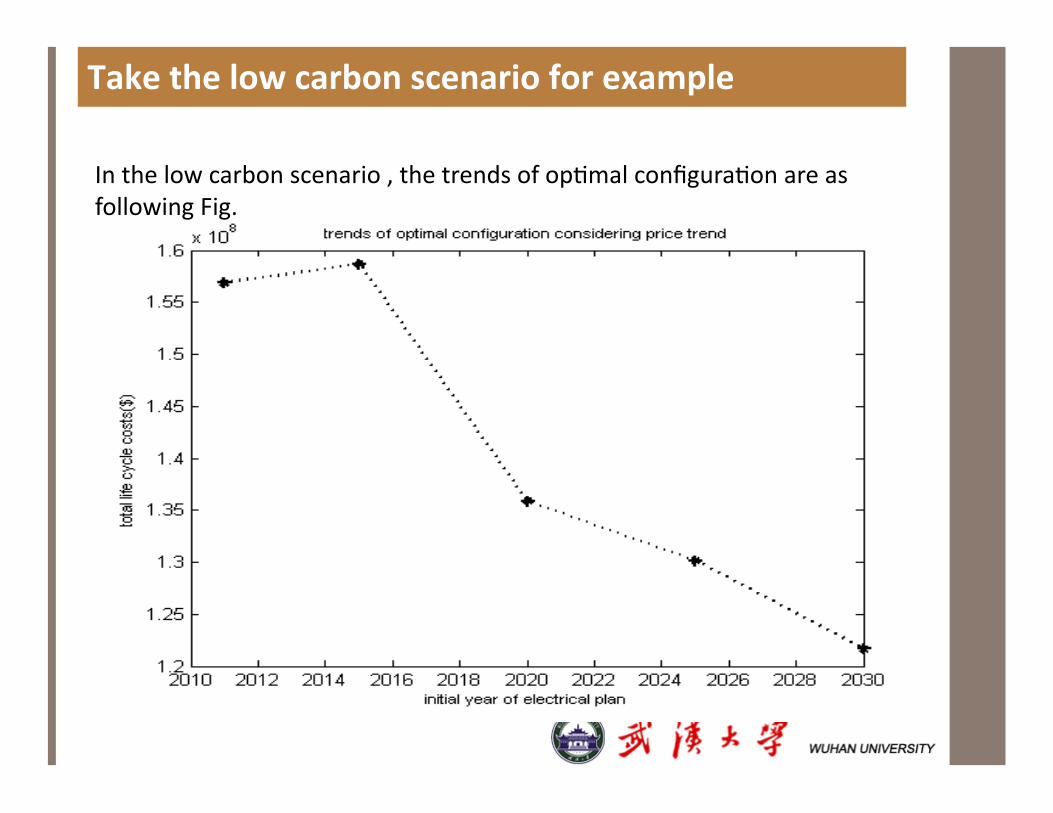
Takethelowcarbonscenarioforexample�
Inthelowcarbonscenario,thetrendsofopGmalconfiguraGonareasfollowingFig. �
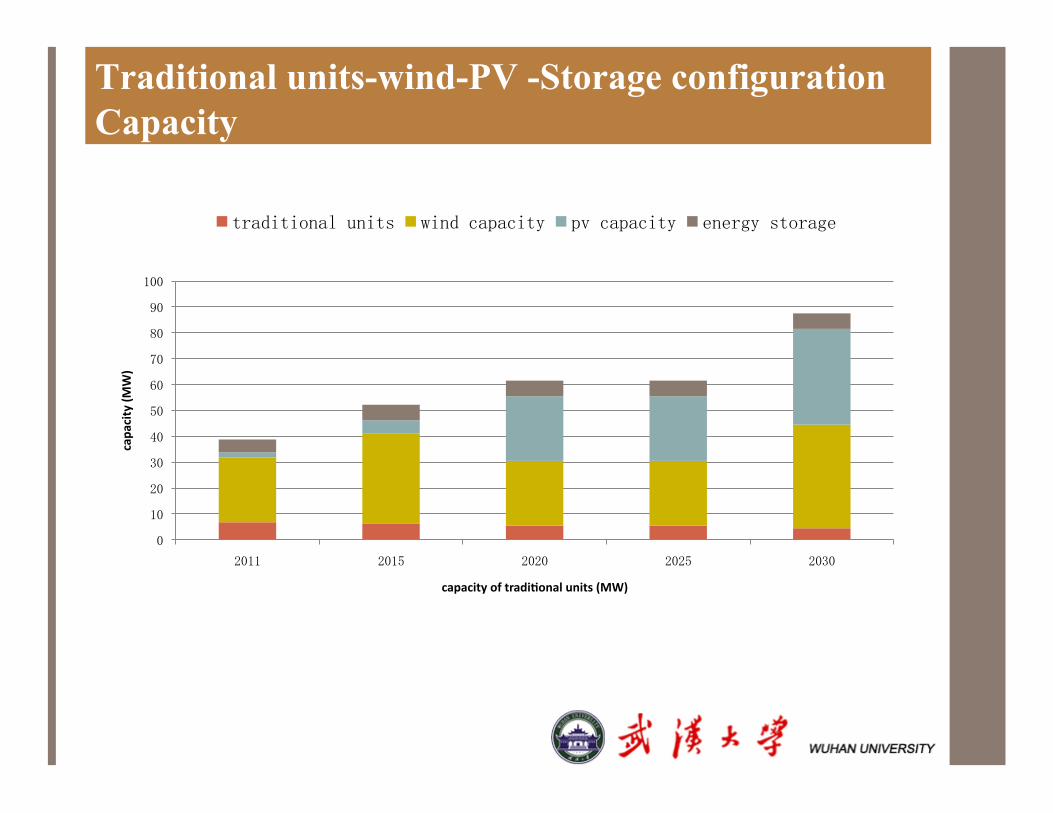
Traditional units-wind-PV -Storage configuration Capacity �
0�
10�
20�
30�
40�
50�
60�
70�
80�
90�
100�
2011� 2015� 2020� 2025� 2030�
capa
city(M
W)�
capacityoftradiBonalunits(MW)�
traditional units� wind capacity� pv capacity� energy storage�
4.conclusion�
(1).Obtainingthecrediblecapacityofwind‐solar‐banerypowersystemisveryimportant,aprobabilisGcmethodisproposed.
(2).Thismethodcouldconsidertheuncertaintyfactors,includetherandomnesschangesofunit’soutputcausedbyfluctuaGonsofwindspeedandilluminaGonintensity.
(3)ThisproposedopGmalsizingofhybridwind‐solar‐banerypowerwasselectedsothattheenGrelifecycleofthetotalinvestmentcostlowest.


![Joint Investment and Operation of Microgrid · 2015-11-09 · and microgrid operation. While in [9]–[12], only microgrid operation is studied under given microgrid facilities. However,](https://static.documents.pub/doc/80x56/5f055ca67e708231d412960b/joint-investment-and-operation-of-microgrid-2015-11-09-and-microgrid-operation.jpg)


