+ All Categories
Home > Documents > OPTIMIZATION OF HYDROTHERMODYNAMIC TECHNOLOGY FOR BLUEBERRY

OPTIMIZATION OF HYDROTHERMODYNAMIC TECHNOLOGY FOR BLUEBERRY

Date post: 03-Feb-2022
Category:
Upload: others
View: 1 times
Download: 0 times
Share this document with a friend
124
OPTIMIZATION OF HYDROTHERMODYNAMIC TECHNOLOGY FOR BLUEBERRY FOOD PROCESSING by Varvara Satanina Submitted in partial fulfilment of the requirements for the degree of Master of Science at Dalhousie University Halifax, Nova Scotia in co-operation with Nova Scotia Agricultural College Truro, Nova Scotia October 2011 © Copyright by Varvara Satanina, 2011
Transcript

OPTIMIZATION OF HYDROTHERMODYNAMIC TECHNOLOGY FOR BLUEBERRY FOOD PROCESSING

by

Varvara Satanina

Submitted in partial fulfilment of the requirements for the degree of Master of Science

at

Dalhousie University Halifax, Nova Scotia

in co-operation with

Nova Scotia Agricultural College

Truro, Nova Scotia

October 2011

© Copyright by Varvara Satanina, 2011

ii

DALHOUSIE UNIVERSITY

NOVA SCOTIA AGRICULTURAL COLLEGE

The undersigned hereby certify that they have read and recommend to the Faculty of Graduate

Studies for acceptance a thesis entitled “OPTIMIZATION OF HYDROTHERMODYNAMIC

TECHNOLOGY FOR BLUEBERRY FOOD PROCESSING” by Varvara Satanina in partial

fulfillment of the requirements for the degree of Master of Science.

Dated: October 31, 2011

Supervisor: _________________________________

Readers: _________________________________

_________________________________

_________________________________

iii

DALHOUSIEUNIVERSITY

AND

NOVA SCOTIA AGRICULTURAL COLLEGE

DATE: October 31, 2011

AUTHOR: Varvara Satanina

TITLE: OPTIMIZATION OF HYDROTHERMODYNAMIC TECHNOLOGYFOR BLUEBERRY FOOD PROCESSING

DEPARTMENT OR SCHOOL: Department of Engineering

DEGREE: MSc CONVOCATION: May YEAR: 2012

Permission is herewith granted to Dalhousie University to circulate and to have copied for non-commercial purposes, at its discretion, the above title upon the request of individuals or institutions. I understand that my thesis will be electronically available to the public. The author reserves other publication rights, and neither the thesis nor extensive extracts from it may be printed or otherwise reproduced without the author’s written permission. The author attests that permission has been obtained for the use of any copyrighted material appearing in the thesis (other than the brief excerpts requiring only proper acknowledgement in scholarly writing), and that all such use is clearly acknowledged.

_______________________________ Signature of Author

iv

TABLE OF CONTENTS

LIST OF TABLES ........................................................................................................................ vii

LIST OF FIGURES ....................................................................................................................... ix

ABSTRACT ................................................................................................................................... xi

LIST OF ABBREVIATIONS AND SYMBOLS USED .............................................................. xii

ACKNOWLEDGEMENTS ...........................................................................................................xv

1. INTRODUCTION .......................................................................................................................1

1.1 Wild Blueberry: General Information ................................................................................... 1

1.1.1 Importance of Wild Blueberry for the Regional Horticulture Economy ........................ 1

1.1.2 Wild Blueberry Nutrition Information ........................................................................... 3

1.2Wild Blueberry Compounds and Their Purported Benefits in Human Health ...................... 6

1.2.1 Role of Polyphenolic Substances in Human Health ....................................................... 7

1.2.2 Role of Anthocyanins in Human Health......................................................................... 8

1.2.3 Role of Blueberry in Human Health ............................................................................... 9

1.3 Effect of Processing and Storage on Blueberry Polyphenolics ........................................... 14

1.3.1 Effect of Processing Methods ....................................................................................... 15

1.3.2 Effect of Processing Factors ......................................................................................... 21

1.3.3 Effect of Storage ........................................................................................................... 25

1.4 Methods of Blueberry-Based Products Quality Control ..................................................... 27

1.4.1 Extraction...................................................................................................................... 28

1.4.2 Spectrophotometry........................................................................................................ 28

1.5 Statistical Methodology for Optimization Problem ............................................................ 29

1.6 Hydrothermodynamic Technology ..................................................................................... 31

GOAL AND OBJECTIVES ..........................................................................................................34

v

2. PRODUCT CHARACTERIZATION .......................................................................................35

2.1 Introduction ......................................................................................................................... 35

2.2 Materials and Methods ........................................................................................................ 35

2.2.1 Experimental Apparatus ............................................................................................... 35

2.2.2 Materials ....................................................................................................................... 36

2.2.3Analytical Methods........................................................................................................ 38

2.2.4Statistical Methods ........................................................................................................ 41

2.3 Results and Discussion ........................................................................................................ 42

2.3.1 HTDT Blueberry Purée versus Frozen Blueberry ........................................................ 42

2.3.2 HTDT versus Conventional Processing ....................................................................... 43

2.3.3 HTDT Blueberry Purée versus Some Commercial Products ....................................... 45

2.4 Conclusion and Recommendations ..................................................................................... 47

3. ANTHOCYANINS AND TANNINS CHANGES DURING STORAGE OF

BLUEBERRY PURÉE ..................................................................................................................48

3.1 Introduction ......................................................................................................................... 48

3.2 Materials and Methods ........................................................................................................ 48

3.2.1 Materials ....................................................................................................................... 48

3.2.2. Analytical Methods...................................................................................................... 48

3.2.3 Statistical Analysis ....................................................................................................... 49

3.3 Results and Discussion ........................................................................................................ 52

3.3.1 Results of Repeated Measures Analysis ....................................................................... 52

3.3.2 Results of Non-Linear Regression Analysis ................................................................. 56

3.4 Conclusion and Recommendations ..................................................................................... 64

4. PROCESS OPTIMIZATION.....................................................................................................65

4.1 Introduction ......................................................................................................................... 65

vi

4.2 Materials and Methods ........................................................................................................ 65

4.2.1 Materials ....................................................................................................................... 65

4.2.2. Analytical Methods...................................................................................................... 65

4.2.3 Statistical Analysis and Experimental Design .............................................................. 66

4.3 Results and Discussion ........................................................................................................ 70

4.3.1 Processing Factors Screening ....................................................................................... 70

4.3.2 Process Optimization .................................................................................................... 79

4.4 Conclusions and Recommendations.................................................................................... 89

5. CONCLUSION ..........................................................................................................................90

LIST OF REFERENCES ...............................................................................................................92

vii

LIST OF TABLES

Table 1.1 Wild blueberry nutrition information…………………………………………………… 3

Table 1.2 Anthocyanins retention in blueberry juice processing stages……………………....... 21

Table 2.1 Blueberry products used for comparison analysis……………………………….......... 37

Table 2.2 Results of ANOVA analysis for HTDT blueberry purée vs. frozen berries…………… 42

Table 2.3 Results of ANOVA analysis of purée produced using HTDT vs. conventional technology………………………………………………………………………………………… 43

Table 3.1 Anthocyanin concentration and tannin content during shelf-life of blueberry purée……………………………………………………………………………………………… 53

Table 3.2. Results of Akaike information criterion……………………………………………….. 54

Table 3.3 Significance of the factors for anthocyanins and tannins repeated analysis……………. 54

Table 3.4 Mean estimates and letter grouping for anthocyanins and tannins data………………... 55

Table 3.5 Starting values for anthocyanin concentration non-linear modeling…………………… 57

Table 3.6 Parameter estimates for anthocyanin degradation for cold storage and room temperature………………………………………………………………………………………… 58

Table 3.7 Incremental parameters estimates and significance of the difference for the model parameters (anthocyanin concentration)…………………………………………………………... 59

Table 3.8 Starting values of parameters in non-linear modeling of tannins changes……………... 61

Table 3.9 Parameter estimates for tannins growing kinetics……………………………………… 62

Table 3.10 Incremental parameters estimates and significance of the difference for the model parameters (tannins)……………………………………………………………………………….. 63

Table 4.1 Levels of factors for 24 factorial design………………………………………………… 66

Table 4.2 Statement of hypothesis for 4 factor unreplicated factorial design……………………. 68

Table 4.3 Results of unreplicated 24 experimental design………………………………………… 71

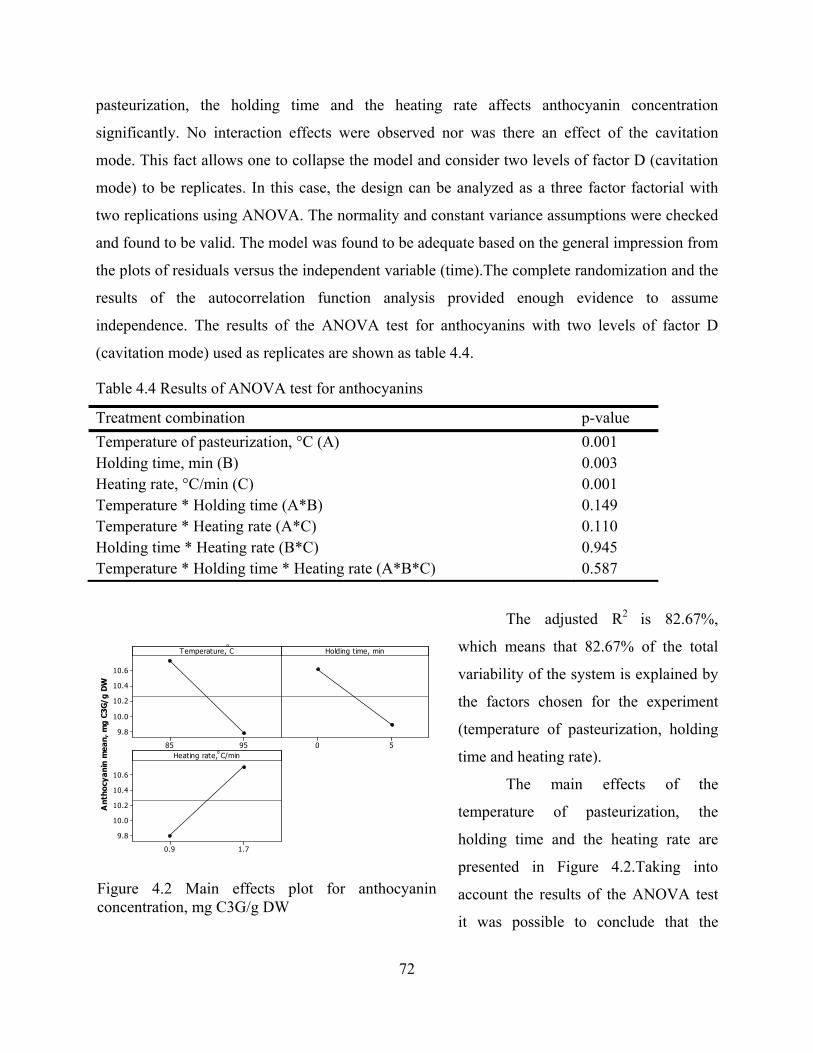
Table 4.4 Results of ANOVA test for anthocyanins……………………………………………… 72

viii

Table 4.5 Results of ANOVA test for tannins……………………………………………............ 74

Table 4.6 Results of unreplicated 24 design for microbial load………………………………….. 76

Table 4.7 Results of ANOVA test for log reduction……………………………………………… 77

Table 4.8 Process variables and response variables for CCD design……………………………. 79

Table 4.9 Regression coefficients and ANOVA results for anthocyanin concentration ……….. 80

Table 4.10 Results of canonical analysis for optimization of anthocyanin concentration………… 81

Table 4.11 Regression coefficients and ANOVA results for tannins ……. …………………….. 82

Table 4.12 Microbial load of raw material and final product for optimization experiment …… 85

Table 4.13 Regression coefficients and ANOVA results for log reduction………………........... 86

Table 4.14 Results of canonical analysis for optimization of log reduction…………………….. 87

ix

LIST OF FIGURES

Figure 1.1. Share of blueberry farm gate in total fruit and vegetables farm production…… 1

Figure 1.2 Wild blueberry dry matter………………………………………………………... 3

Figure 1.3 Polyphenolic compounds of wild blueberry……………………………………… 5

Figure 1.4. Blueberry juice processing stages………………………………………………... 20

Figure 1.5 Principles of HTD technology…………………………………………………..... 31

Figure 2.1 General view of pilot-scale HTDT food processor TEK-1……………………..... 35

Figure2.2 Particle size distribution in blueberry purée processed by HTDT vs. conventional technology……………………………………………………………………………………..

44

Figure 2.3 Anthocyanins concentration in HTDT blueberry purée and some commercial blueberry products………………………………………………………………………….....

45

Figure 2.4 Tannin content in HTDT blueberry purée and some commercial products………………………………………………………………………………………..

46

Figure 3.1 Interaction plot of anthocyanins, mgC3G/g DW versus time, days………………. 55

Figure 3.2 Interaction plot of anthocyanins, mgC3G/g FW versus time, days………………. 56

Figure 3.3 Interaction plot of tannins, % versus time, days………………………………….. 56

Figure 3.4 a) Kinetics of anthocyanin degradation (per DW, cold storage); b) Kinetics of anthocyanin degradation (per DW, room temperature); c) Kinetics of anthocyanin degradation (per FW, cold storage); d) Kinetics of anthocyanin degradation (per FW, room temperature)…………………………………………………………………………………...

58

Figure 3.5 a) Kinetics of tannins (cold storage); b) Kinetics of tannins (at room temperature)…………………………………………………………………………………...

62

Figure 4.1 Normal plot of the effects (response is anthocyanin concentration, mg C3G/g DW, α = 0.05)…………………………………………………………………………………

71

Figure 4.2 Main effects plot for anthocyanin concentration, mgC3G/g DW………………… 72

Figure 4.3 Normal plot of the effects (response is tannins, %, α = 0.05)…………………….. 73

Figure 4.4 Normal plot of the effects (response is tannins, %, α = 0.10)…………………….. 73

x

Figure 4.5 Main effects plot for tannins, %............................................................................... 74

Figure 4.6 Normal plot of the effects (response is log reduction, α = 0.05)………………….. 76

Figure 4.7 Normal plot of the effects (response is log reduction, α = 0.10)………………….. 77

Figure 4.8 a) Interaction plot for log reduction (temperature*heating rate); b) Interaction plot for log reduction (temperature*holding time)…………………........................................

78

Figure 4.9 a) Contour plot of anthocyanin concentration, mg C3G/g DW; b) Surface plot of anthocyanins, mg C3G/g DW ………………………………………………………………...

81

Figure 4.10 a) Ridge of maximum tannins; b) Contour plot of tannins, %; c) Surface plot of tannins, %…………………………………………………………………………………..

83

Figure 4.11 a) Contour plot of log reduction; b) Surface plot of log reduction……………… 87

Figure 4.12 Overlaid contour plot of anthocyanins, tannins, and log reduction …………….. 88

xi

ABSTRACT

Traditional processing technologies can negatively affect polyphenolics of blueberry

products. Optimization of hydrothermodynamic (HTD) processing has been used to minimize

blueberry-based product quality degradation.

Preliminary experiments have shown that the quality of HTD blueberry purée in terms of

anthocyanin concentration and tannin content was significantly higher than that of most

commercial blueberry products. HTD technology provided pasteurization with significantly lower

losses of anthocyanins as compared with conventional heating.

Screening of the factors has shown that holding time, temperature of pasteurization and

heating rate were significant, while cavitation mode was non-significant. Response surface

methodology was used to determine an optimal combination of temperature and time (92 to 95°C

with holding time 0.5 to 2.0 min).

Non-linear regression analysis of the shelf-life data has provided fitted models which could

be used to predict changes in anthocyanin concentration and tannins for different storage periods at

4°C and at room temperature (20 to 25°C).

xii

LIST OF ABBREVIATIONS AND SYMBOLS USED

AAFC Agriculture and Agri-Food Canada

AIC Akaike information criterion

ANCOVA Analysis of covariance

ANOVA Analysis of variance

APC Aerobic plate count

C3G Cyaniding-3-glucoside

CCD Central composite design

CD Color density

cfu Colony forming unit

cs Cold storage

CS Compound symmetry

DF Dilution factor

DW Dry weight

FB Frozen blueberry

FP Frozen blueberry purée

FW Fresh weight

GAE Gallic acid equivalent

GLM General linear model

HPLC High-performance liquid chromatography

HTD Hydrothermodynamic

HTDT Hydrothermodynamic technology

HTST High temperature short time

IQF Individual quick freezing

LDL Low density lipids

MW Molecular weight

NB New Brunswick

NID (µ, σ2) Normally and independently distributed random variables with

mean µ and variance σ2

xiii

NLS Non-linear least squares

NS Nova Scotia

NSAC Nova Scotia Agricultural College

ORAC Oxygen radical absorbance capacity

PEI Prince Edward Island

PO Peroxidase

PPO Polyphenoloxidase

RSM Response surface methodology

rt Room temperature

st dev Standard deviation

TFA Trifluoroacetic acid

UN Unstructured

USA United States of America

UV Ultra-violet

A Absorbance

a Number of factor levels

C Tannin content or anthocyanin concentration

f(xi,θ) Expectation function

i, j, k, l, m Notations for factor levels and replications

k Temperature-dependent rate constant

n Number of replications

t Storage period, days

x1, x2, x12, x2

2 Linear and quadratic components for response surface analysis

xi Vectors for non-linear regression analysis

y Response

αβ, αγ, αδ, βγ, βδ, γδ Two-way interaction effects

αβγ, αβδ, αγδ, βγδ Three-way interaction effects

αβγδ Four-way interaction effects

β0, β1, β2, β11, β22, β12 Model parameters for response surface analysis

xiv

ε Disturbance (error terms)

ζ1, ζ2 Uncoded variables for response surface analysis

η(θ) n-dimensional prediction vector in non-linear regression analysis

θ Parameter in non-linear regression analysis

µ Overall mean

σ2 Variance

τ, α, β, γ, δ Treatment effects

φ Incremental parameter in non-linear regression analysis

xv

ACKNOWLEDGEMENTS

I would like to express my deepest gratitude to the following people who inspired me and

helped me so much in my research:

Dr. Alex Martynenko for all your boundless kindness, help and support;

Dr. Peter Havard for your thoughtful supervision and professional guidance;

Dr. Willy Kalt for sharing with me priceless knowledge and experience, introducing me to the

world of blueberries and inspiring me for this study;

Dr. Tess Astatkie for the unique opportunity to obtain the deep and systematic knowledge in

applied statistics;

Dr. Valentina Kutsakova for the professional and friendly support and Dr. Marianna

Kremenevskaya for support and care;

Dr. Ali Madani for the wise guidance and useful help;

Dr. Sam Asiedu for your professional input and advising;

Dr. Bruce Rathgeber, Dr. Nancy Pitts, Dr. Glenn Stratton, Dr. Dave Barrett, Dr. Robert France,

and Dr. Derek Lynch for providing me with useful knowledge through the courses and for all

your help;

Melinda Vinqvist-Tymchuk and Tim Hughes for the professional assistance, training and support

at AACF;

Anne LeLacheur, Debbie Mellish, Kalyani Prithiviraj, and Daryl Mullen for your help and

thoughtful support in the lab work;

Doug Burris and Chris Nelson for providing the technical support;

Theresa Osborn, Jennifer Spenser, Mandi Wilson for your everyday help;

Marlene MacCallum for your help in proofreading;

Paul Dickson and Sowmya Sharma for your support, collaboration and the unforgettable time

spent on computer vision project;

All my friends at NSAC: John and Kristine, Alain, Emmanuel, Tonika, Cenwei, Khush, Weili,

Yuanyuan, Mumu, Kui, Carl, Merle, and especially Indu Parmar for all your collaboration, help

and care;

Dr. Raj Lada, Dr. Dian Patterson, Heather Hughes and Marie Law for your thoughtful guidance

and professional support in this program;

and last but not the least, my parents Olga and Alexey, and my husband Aleksandr for

encouragement, patience, belief and love.

Also I would like to thank Nova Scotia Department of Agriculture, Technology

Development Program for providing funding for this project.

1. INTR

1.1 Wild

1.1.1 Imp

A

angustifo

harvested

Atlantic

Scotia pr

Figure 1.

T

demonstr

farm frui

61.3% fo

productio

57%from

total mar

2001 to 3

value du

2

4

6

8

10

12

Farm

gat

e va

lue,

thou

sand

s of d

olla

rs

RODUCTI

d Blueberry:

portance of W

Atlantic Can

olium (togeth

d in Quebec

Provinces,

roduced 35.8

.1 Share of b

The importan

rated in Fig

it and veget

or PEI, NS a

on demonstr

m 1992 till 2

rket producti

35,288 metri

ue to wild bl

0

20000

40000

60000

80000

00000

20000

PE

ON

: General In

Wild Bluebe

nada is the

her with Ma

, and 85% o

namely Prin

8% of the wi

blueberry far

nce of wild

.1.1.The tot

table produc

and NB resp

rated a stron

2003 (Strik,

ion increased

ic tonnes in 2

lueberry pro

EI NS

nformation

rry for the R

e major pr

aine, USA).

of all wild bl

nce Edward

ild blueberrie

rm gate in to

d blueberrie

al farm gate

ction (in tho

ectively (Sta

ng growth a

2005; Strik

d almost twi

2010, which

oduction (co

NB

Province

1

Regional Hor

roducer of

. In 2010, a

lueberries pr

d Island, Ne

es harvested

otal fruit and

es for Atlan

e due to blu

ousands of d

atistics Cana

all across C

k and Yarbor

ice in the pas

h gave more

mpare 19,80

total forAtlantic

Province

rticulture Ec

wild lowb

about 15% o

roduced in C

ew Brunswi

d in Canada (

vegetables f

ntic Canada

ueberry prod

dollars) in 2

ada). In the p

Canada: tota

rough, 2005

st 10 years,

than a 2.5-f

00 thousand

rces

Blueberrgate valu

Otherhorticultcrops farvalue

conomy

bush bluebe

of lowbush

Canada were

ick, and No

(Statistics Ca

farm produc

a as a hort

duction com

010 was 48

past 20 year

al area of fa

5). In the At

from 20,221

fold increase

d dollars in 2

ry farmue

turalrm gate

erries Vacci

blueberries

e harvested i

ova Scotia. N

anada).

ction

ticultural cro

mpared tothe

.5%, 39.4%

rs, wild blue

arming incre

tlantic Provi

1 metric tonn

e in the farm

2001 and 50

inium

were

in the

Nova

op is

total

%, and

eberry

eased

inces,

nes in

m gate

0,449

2

thousand dollars in 2011) (Statistics Canada). The increase in wild blueberry production

demands new market development. Market size can be increased through the public’s awareness

of the health benefits of blueberries, and the availability of convenient blueberry-rich products

can allow consumers to regularly eat these nutritious fruit.

In spite of the high amount of blueberries produced in Atlantic Canada, there are not

many blueberry-based products on the local market. Fresh wild blueberries are available during

the short harvest season and approximately 2 weeks after the end of it. Hence, only 0.4% of wild

blueberries are consumed as fresh, and about 9% is used for production of juice (mainly), jams,

jellies and pie filling. Some bakery and confectionary products with blueberries are also

presented on the local market, such as pies, muffins, ice cream, yogurts, chocolate bars, gummy

candies (Robichaud, 2006; Villata, 1998). The majority of harvested wild blueberries (90%) are

individually quick frozen (IQF) and used mainly for export (Statistics Canada). Since 2000, the

export of blueberries has represented 84 to 100% of all Canadian production (including re-export

of some blueberries that Canada imported) (Robichaud, 2006).

Wild blueberry has a significant impact on the local horticulture economy and

demonstrated a solid growth in the past years. There is a strong demand on wild blueberries

overseas; the majority of Canadian blueberry is exported. Thus, the population of Atlantic

Canada has a great production capacity for wild blueberries but limited access to use it. At the

same time, significant changes of consumer habits and preferences towards healthier natural

products were recently reported. The number of educated consumers in Atlantic Canada, and

nationally and internationally interested in health-promoting foods, has increased significantly

(Beaudin, 2005). However, the lack of commercially available high-quality healthy food has

been specified as one of the major problems which should be resolved by producers. Locally

grown wild blueberry is an excellent candidate for health-promoting foods. Development of new

blueberry-based products will allow consumers to have more choices and different ways to

consume blueberries, and on the other hand, will provide producers with greater market size for

wild blueberries.

3

1.1.2 Wild Blueberry Nutrition Information

The nutrition information on blueberries is presented in Table 1.1. The nutrient content

on a dry matter basis is presented on Fig.1.2.Sugars are the major component of blueberries’

dissolved dry matter (65%). Lowbush blueberries contain almost equal amounts of glucose and

fructose and do not contain any sucrose (Barker et al., 1963). As with all fruits and berries,

blueberries are a good source of dietary fiber (2.4% of fresh product). Blueberries are not a very

rich source of vitamins and minerals, however fresh blueberries contain a moderately high

amount of vitamin C (9.7mg/100g FW, USDA Nutrient Database) and niacin (0.42 mg/100g

FW, USDA Nutrient Database). A high content of manganese (0.34 mg/100g FW, USDA

Nutrient Database) makes blueberries an excellent source of this mineral (Bushway et al., 1983).

Table 1.1 Wild blueberry nutrition information

Compound Content,

per 100g of FW Source

Moisture 84.65 USDA Nutrient Database

Proteins 0.74 USDA Nutrient Database

Lipids 0.42 USDA Nutrient Database

Sugars 9.96 USDA Nutrient Database

Dietary fiber 2.41 USDA Nutrient Database

Pectin 0.60 Proctor and Peng (1989)

Acids 0.51 Mazza (2005)

Vitamins/minerals 0.12 Bushway et al.(1983)

Polyphenolics 0.40 Kalt et al. (2001), Prior et al. (1998)

Other 0.29 Found by subtraction

W

polyphen

scientists

vegetable

certain d

attribute

benefits i

P

major cl

predomin

hydroxyc

1994; Ta

example,

McDona

as one o

purple, re

as substa

Pascual-T

potential

been rep

protein

lipids

fiber

pec

Figure 1

Wild (lowbus

nolic substa

s for the pa

es is recomm

iseases such

fruit and v

in human he

olyphenolic

lasses, nam

nant non-fl

cinnamate es

arusco et al.,

, p-coumaric

ld, 1996). Th

of the major

ed and blue

ances chara

Teresa and

biological a

ported by G

ctinacids

vitamins/m

.2 Wild blue

sh) blueberri

ances. Fruit

st decades f

mended by H

h as cancer a

vegetables p

ealth.

s in small f

mely flavono

lavonoid co

sters), with

2004). Othe

c, caffeic, an

he flavonoid

r sub-groups

coloration o

cterized by

Sanchez-Ba

activities is p

Gu et al. (2

minerals poly

eberry dry m

ies Vacciniu

and vegeta

for their pur

Health Cana

and cardio-va

polyphenolic

fruits specie

oids and no

ompound o

reported con

er non-flavon

nd ferulic aci

d compound

s. Anthocya

of fruit, vege

some biolo

allesta, 200

proanthocya

2002). Howe

yphenolics ot

matter

4

um angustifo

able polyph

rported heal

ada in order

ascular disea

cs to be res

es (including

on-flavonoid

of blueberr

ncentration o

noid compou

ids) and sim

s include sev

anins are we

etables and fl

ogical activi

8). Another

anidins (cond

ever, the m

ther

olium are we

henolic have

lth benefits.

r to decrease

ases (Health

sponsible fo

g blueberrie

ds (Kalt et

ries is chl

of 80 to 140

unds include

mple phenolic

veral classes

ell known a

flowers, and

ities in hum

r significant

densed tann

major amoun

sugars

ell known as

e been of

Regular in

e the risk of

h Canada, 20

or providing

es) can be d

t al., 2001)

lorogenic a

0 mg/100g (

e hydroxycin

c acids (galli

s (Fig.1.3) w

as phytopigm

they also ha

man health (

t group of

nins). Their c

nt of total p

s a rich sour

great intere

ntake of frui

f developme

009). Resear

g these pote

divided into

) (Fig.1.3).

acid (group

(Gao and M

nnamic acid

ic acid) (Kal

with anthocy

ments and c

ave been rep

(For review

flavonoids

concentratio

proanthocya

rce of

est to

t and

ent of

rchers

ential

o two

The

p of

Mazza,

ds (for

lt and

yanins

confer

ported

w see:

with

n has

anidin

5

concentrations in blueberries (330mg/100g FW) was due to the polymeric proanthocyanidins

with a degree of polymerization more than 10 (up to 290 mg/100g FW), whose biological

activity is questionable since they would be poorly absorbed (Gu et al., 2002; Crozier, 2009).

Potential health benefits of the polyphenolics including anthocyanins will be reviewed in

Section1.2.

Figure 1.3Polyphenolic compounds of wild blueberries

However, the polyphenolic substances in blueberry are very sensitive to different

processing factors. It was reported, that traditional processing and storage technologies reduced

anthocyanin concentration in blueberry-based products (Brownmiller et al., 2009; Kalt et al.,

2000; Lee et al., 2002). Researchers have identified the need for the optimization of blueberry

processing technology to prevent losses in food quality (Brownmiller et al., 2009; Kalt et al.,

2001; Queiroz et al., 2009). More information on degradation of the polyphenolic substances will

be provided in Section 1.3.

Catechines

Flavonols

Anthocyanins

Phenolic acids

Hydroxycinnamate esters

Flavonoids

Non-flavonoids

Polyphenolics

Proanthocyanidins

400 mg/100ga

Chlorogenic

acid80–40mg/100g

150–220mg/100gc

up to 300mg/100g d

a total phenolics, mg gallic acid equivalent per 100 g of FW, according to Prior et al. (1998) and Kalt et al. (2001) b chlorogenic acid concentration according to Gao and Mazza (1994) and Tarusco et al. (2004) c anthocyanin concentration, mg C3G/100g FW, according to Prior et al. (1998), Kalt et al. (2001) and Gao and Mazza (1994) c proanthocyanidin concentration according to Gu et al. (2004)

6

1.2Wild Blueberry Compounds and Their Purported Benefits in Human Health

Fruit and vegetables are the essential to proper human nutrition. Health Canada suggest

regular intake of fruit and vegetables in order to decrease risk of development certain diseases

such as some cancer and cardio-vascular diseases. There are numerous approaches to investigate

the health-related bioactivity of plants foods like blueberries and their polyphenolic compounds.

Historically blueberries were first most intensively investigated in relation to their in vitro

antioxidant activity which reflects the high redox capacity of their polyphenolics, including

anthocyanins, and is based on chemical capturing different forms of free radicals. A high

antioxidant capacity is implicated as the basis for potential positive effect of blueberries and

other plant foods, on human health. Since polyphenolics differ in their antioxidant capacity (for

review see: Rice-Evans et al., 1996; Prior and Wu, 2006; Cao et al., 1996), these simple redox

methods allow for comparisons between compounds and even food types; however these tests do

not reflect in vivo concentrations or conditions for these reactions. The next step of in vitro

studies is modeling of physiological processes in specific use of specific cells or subcellular

fractions to probe polyphenolic effects in more complex metabolic processes. These methods

provide information on biological effects of the studied compounds but do not take into account

bioavailability and hence do not insure that these reactions can take place intracellulary. In whole

cell studies more complex multi-site processes can typically be proved. The further step of

biological activity investigation is in vitro experiments with intact cells which allow one to

collect more information on more complex cellular responses.

Studies conducted with animal are called in vivo. These studies are most often conducted

using rodents. Compared to in vitro studies in vivo studies provide stronger evidence of food

phytochemical benefits since positive result infer that bioactive compounds have been

digestively absorbed in a quantity sufficient to achieve a benefit. Human clinical studies provide

the strongest evidence of a health benefit of certain photochemical. Identifying a clinical benefit

of a food or phytochemical in a free-living and genetically diverse human population suggests a

strong effect and intervention. Clinical studies are typically expensive. However, human and

animal studies are the most important part in any research on biological effects of

phytochemicals and the results of these experiments will be reflected in this review.

7

1.2.1 Role of Polyphenolic Substances in Human Health

Numerous works were devoted to the antioxidant capacity of polyphenols as bioactive

compounds in materials of plant origin. It was found that different groups of polyphenolics

demonstrate no equal antioxidant capacity (Bors et al., 1997; Burda and Oleszek, 2001; Pietta,

2000), and anthocyanins are reported to have one of the highest ability against oxidative

materials in vitro. Extensive research was carried out to study the relationship between molecular

structure and antioxidant properties of the polyphenolics. For effective radical scavenging there

were three criteria found important: the o-dihydroxy structure of B ring (provides higher stability

for the radical form and participates in electron delocalization), the 2,3 double bond in

configuration with a 4-oxo function in the C ring (is responsible for electron delocalization from

the B ring), and 3- and 5-OH groups with 4-oxo function in A and C rings (are required for

maximum radical scavenging potential (Rice-Evans et al., 1996).

The chemistry, nutritional significance, and health promotion properties of polyphenolic

compounds in berry fruit phytochemicals are widely discussed (for review see Crozier et al.,

2009; Del Rio et al., 2010; Tapiero et al., 2002; Stoclet and Schini-Kerth, 2011). Polyphenolics

were reported to be involved in certain mechanisms of brain aging protection (Galli et al., 2002).

The role of flavonoids on different aspects of the central neural system regulation and brain

activity in particular was reviewed by Jager and Saaby (2011) and Spencer (2010).Some groups

of polyphenolic substances were found to be preventive for breast cancer in an epidemiological

study in Italy (Bosettii et al., 2005). Certain flavonoids demonstrated a high activity against

cancer cell development, therefore their use as purified substances in anticancer medicine was

considered by Liu et al (2010). A review of the biological mechanisms and effects of

polyphenolic substances in cancer was done by Nichenametla et al. (2006).A five year

epidemiological study demonstrated a strong correlation between daily polyphenolics intake and

coronary heart disease (Hertog et al., 1993; Hollman et al., 1996). Activity of polyphenolics, and

flavonoids in particular, in cardio-vascular diseases were summarized by Peluso (2006).

Activity of polyphenolic substances and its potential role in human health were studied

and summarized by numerous authors (Crozier et al., 2009; Del Rio et al., 2010; Jager and

Saaby, 2011; Spencer, 2010; Nichenametla et al., 2006). Some information on the biological

activity of anthocyanins, as a group of polyphenolics, is provided in Section 1.2.2.

8

1.2.2 Role of Anthocyanins in Human Health

Anthocyanins are a major part of polyphenolic substances of wild blueberry and these

compounds contribute significantly to the antioxidant properties of this fruit (Kalt et al., 2008;

Wang et al., 2010). The anthocyanin aglycones (i.e. anthocyanidins) delphinidin and cyanidin

have the highest antioxidant activity compared to other polyphenolics. Quercetin was reported to

have the highest antioxidant capacity (Rice-Evans et al., 1996). The health-related bioactivity of

anthocyanin extracts was studied using in vitro and in vivo models. The anthocyanins rich

mixture of six edible berries including blueberries was studied for therapeutic effect

determination by Zafra-Stone and co-workers. A significant inhibition of Helicobacter pylori,

which is known to be a causative factor gastrointestinal diseases including gastric cancer, was

observed for this mixture. Marked in vivo antiangiogenic properties (in vivo model of

proliferating hemangioma) of edible berries anthocyanin extracts were also reported, which

might be useful for cancer therapy. In vivo studies using hamsters showed a great effect of

anthocyanin extracts against atherosclerosis (Zafra-Stone et al., 2007a, 2007b).In vitro results of

anti-inflammatory properties of anthocyanin-rich berry blend were supported with the results of

clinical trials (Jensen et al., 2008).

The chemistry, nutrition significance, and health promotion properties of polyphenolic

compounds and anthocyanins in particular as berry fruit compounds are widely discussed.

Anthocyanins are not involved in the mechanisms of protection directly as radical scavenging

substances but participate indirectly in many metabolic reactions which results in blocking some

pathways and hence positive effect in human health. For example, anthocyanins were reported to

demonstrate certain activity against cardiovascular diseases (Mazza, 2007) and some forms of

cancer (Nichenametla et al., 2011). Anthocyanins have demonstrated systematic activity in the

human body such as antineoplastic, anticarcenogenic, antiviral and anti-inflammatory effects,

inhibition of platelets aggregation and immune stimulation (for review see Stintzing and Carle,

2004). Antimicrobial effect of anthocyanins was reviewed by Cisowska et al. (2011). Chen and

Luo (2010) demonstrated the effectiveness of anthocyanins application for the complex therapy

of ethanol neurotoxicity.

Significant amount of works has been devoted to anticancer activity of anthocyanins (for

review see Cooke et al., 2005; Fimognari et al., 2008; Hou, 2003; Thomasset et al., 2009; Wang

and Stoner, 2008). Strong in vitro evidence supported with results of several clinical studies of

9

anthocyanins to play a role of cancer chemoprotective substances in human diet was reported by

numerous authors (Fimognari et al., 2008; Thomasset et al., 2009; Wang and Stoner,

2008).Selective absorption and distribution of anthocyanins in organs and tissues was studied

(Kalt et al., 2008; Talavera et al., 2005; Kalt et al., 2007); the ability of anthocyanins to be

absorbed by gastric walls and rich target organs was supported by the results of these research

works.

Potential biological activities of anthocyanins in human health and its bioavailability

have been well investigated in many in vitro studies and some in vivo studies including

experiments with human subjects and epidemiological studies (for review see McGhie and

Walton, 2007; Galvano et al., 2007; Kong et al., 2003; Kowalczyk et al., 2003; Prior and Wu,

2006).

1.2.3 Role of Blueberry in Human Health

Benefits of plant origin products (fruits and vegetables) in decreasing the risk of different

diseases has been demonstrated in numerous studies. The activity (as part of a complex therapy)

against several diseases, such as certain cancers, cardiovascular diseases, and neurodegenerative

diseases, has been referred to antioxidant compounds contained in these products (Schreiner and

Huyskens-Keil, 2006). Polyphenolic compounds, a group of substances with antioxidant

activities, are contained in different products of plant origin but usually attributed to berries.

Fruits and vegetables, as a source of different polyphenolic compounds, are known to be

powerful antioxidant products recommended for consuming (Stintzing and Carle, 2004; Wang et

al., 1996). Wild blueberries are reported as a product characterized by a high antioxidant

capacity. Wild blueberries have the highest ORAC (oxygen radical absorbance capacity) value

and total phenolics content among the twenty-five most commonly consumed USA fruits and

berries (Wolfe et al., 2008) and high lipophilic and hydrophilic activities among common fruits

in the US (Wu et al., 2004; Wu et al., 2006). The benefits of berry crops, blueberries in

particular, as a source of antioxidants were shown in the works of Carbone and Zafra-Stone

(Carbone et al., 2008; Zafra-Stone Shirley et al., 2007a; Zafra-Stone et al., 2007b).

Vaccinium species are known to be characterized by significant antioxidant activity due

to high content of polyphenolic substances, but these properties can vary. Researchers agree that

wild populations of Vaccinium angustifolium berries tend to have a higher antioxidant capacity

10

than cultivated ones (Vaccinium corymbosum) (Kalt et al., 2001; Kalt et al., 2008; Prior et al.,

1998; Taruscio et al., 2004). Horticultural factors such as genotype variation, geographical

variation (Häkkinen and Törrönen, 2000), weather conditions, maturity (for review see Kalt et

al., 2001), organic production vs. conventional type of growing (Wang et al., 2008) significantly

affect anthocyanin concentration of blueberries. There are contradictory information on changes

of ORAC and polyphenolic content during ripening: Kalt and co-workers found no difference in

ORAC value among five ripeness stages of highbush blueberry (Kalt et al., 2001), while Prior et

al. (1998) reported higher ORAC value as a result of increased maturity and Castrejón et al.

(2008) reported decreasing antioxidant capacity during ripening.

The antioxidant capacity of blueberries may be affected dramatically by different

processing factors. The influence of cold storage on the ORAC value was studied (Connor et al.,

2002; Kalt et al., 1999) and small changes during storage were reported. Heat treatment usually

results in a significant decrease of the ORAC value of blueberry-based products (Brownmiller et

al., 2009; Kalt et al., 2000; Schmidt et al., 2005). Antioxidant capacity of blueberry-based

products also reduces during storage (Brownmiller et al., 2008; Srivastava et al., 2007).

Intensification of antioxidant activity as a result of skin-contact fermentation of blueberry juices

was reported for Rabbiteye blueberry (Su and Chien, 2007). A more complete analysis of

processing factors, which have an influence on antioxidant properties of blueberries, is presented

in Section1.3.2 of this document.

A regular intake of berries was reported to have a health promoting effect on the human

body. A mixture of six edible berries extracts was studied for therapeutic effect determination by

Zafra-Stone and co-workers (2007a, 2007b): a significant antimicrobial effect against

Helicobacter pylori, which is known to be a causative factor for gastrointestinal diseases,

including gastric cancer, and marked in vivo antiangiogenic properties were reported. Health-

promoting properties of berry fruits including Vaccinium species, such as the improvement of

blood vessel elasticity, urinary system infections prevention and treatment as part of a complex

therapy; night vision improving was reviewed by Szajdek and Borowska (2008). The impact of

berry fruit in a complex therapy of cardio-vascular diseases was reviewed by Basu et al. (2010).

Health promoting effects of wild blueberries on the human body are of particular interest.

Numerous works were devoted to different aspects of wild blueberry consumption and their

activity in preventing certain diseases (for review see Neto et al., 2007; Kalt et al., 2007; Shi et

11

al., 2002; Smith et al., 2000; Kalt and Dufour, 1997). More specific information on the role of

blueberry supplementation in certain diseases prevention is summarized below in Sections1.2.3.1

to 1.2.3.7.

1.2.3.1 Blueberries and Cardiovascular Diseases

It has been thought that cardioprotective effect of blueberries may be partly explained by

the inhibition of oxidation of low-density lipids (LDL) by berry phenolics and the ability of

phenolics to reduce aggregation of blood platelets, which can lead to heart attack and stroke.

Oxidation of LDL by free radicals initiates and promotes atherosclerosis, as well as blood

platelets aggregation and adhesion to blood vessels resulting in thrombosis development (Hertog

et al., 1993). For example, in vitro lipophilic antioxidative capacity of blueberry was proved by

Wu and others (Wu et al., 2004; Wu et al., 2006). However the low plasma bioavailability of

polyphenolics including anthocyanins (for review see Crozier, 2009) would suggest that direct in

vivo antioxidant effects of polyphenolics on LDL are not be likely. No relationship between

polyphenolics content and anti-platelet activity of blueberry was demonstrated by Kalt and co-

workers (Kalt et al., 2007, 2008). At the same time, reduced total cholesterol in pig plasma was

found as a result of feeding with blueberry when added to a plant-rich diet (Kalt et al., 2008).

Another mechanism which prevents cardio-vascular diseases is an ability of polyphenols to

increase vasodilation by inducing relaxation of vascular smooth muscles. Blueberry polyphenolic

effects was studied in vivo and ex vivo (Kalea et al., 2006; Kalea et al., 2009a; Kalea et al.,

2009b; Norton et al., 2005). It was found that feeding blueberries for up to three months reduced

ischemic damage to the heart, in rats (Ahmet et al., 2009). Improved vasorelaxation was

observed ex vivo after blueberry feeding (Kalea et al., 2009a). Wiseman et al. (2011) reported an

anti-hypertensive effect in rats after 2 weeks of receiving a blueberry rich diet.

1.2.3.2 Blueberries and Cancer

Several reviews have been published with the conclusion that fruit and vegetables may

reduce risk of some types of cancer (Block et al., 1992; Bomser et al., 1996). Results of studies

conducted in vitro suggested berries polyphenolics (including Vaccinium species and wild

blueberries in particular) were able to inhibit processes associated with tumor development

(Schmidt et al., 2004; Seeram, 2008; Bomser et al., 1996). Schmidt and co-workers found strong

in vitro antiproliferative activity of wild blueberry extracts (Schmidt et al., 2004; Schmidt et al.,

12

2005). Wild blueberry extracts demonstrated activity against cancer cells growth in in vitro

studies by Bomser et al. (1996). Seeram and co-workers reported ability of berry bioactives to

regulate carcinogen and xenobiotic metabolizing enzymes, various growing factors,

inflammatory cytokines and signaling pathway of cancer cells proliferation and tumor

angiogenesis in vitro (Seeram et al., 2006; Seeram, 2008). The possible protective effect of

blueberries against cancer may be related to their ability to indirectly participate in some

defensive mechanisms of the human body (Dulebohn et al., 2008; Seeram et al., 2006; Seeram,

2008). However, there is a lack of in vivo evidence of anti-cancerogenic effect of blueberry.

Boateng et al. (2007) reported positive effect of blueberry extracts in colon tumor development

in rats; however, Simmen et al. (2009) reported that results of in vivo studies of colon cancer in

rats did not indicate robust effects of blueberry juice. Researchers agree that more in vivo and

clinical studies are needed to prove effect of blueberry against tumor development (Moon et al.,

2006; Neto, 2007).

1.2.3.3 Diabetes

Regular consumption of fruit and berries rich in polyphenolics is beneficial for

prevention type II diabetes (for review see Hanhineva et al., 2010). Results of clinical study by

Lankinen et al. (2011) suggested using bilberry (European wild blueberry) as a part of healthy

diet (rich in whole grains and fish) for reducing glucose concentration in blood and improving

glucose metabolism. Blueberry anthocyanins were reported as substances which decrease aldol

reductase of diabetic patients (Ghosh and Konishi, 2007; Varma, 1986).Fruit juices fermented by

Serratia vaccinii demonstrated significant anti-inflammatory, antiobesity and antidiabetic

activity in in vitro and in vivo tests with rats (Vuong et al., 2006, 2007, 2009).

1.2.3.4 Vision

The European type of blueberry (bilberry, Vaccinium myrtillus) is well known

historically used for benefits in vision and eye health. Bilberry was purported to be used in

World War I and II by British Air Force pilots to improve night vision (see Canter and Ernst,

2004). However, there is not enough evidence from clinical studies to conclude that night vision

and dark adaptation of healthy human subjects was affected significantly by bilberry

anthocyanins consumption (for review see Canter and Ernst, 2004).There is a significant lack of

13

relevant information on activity of phytochemicals of wild blueberry on human vision, especially

of human clinical placebo-controlled trials (Kalt et al., 2010).

1.2.3.5 Microbial Infections, Inflammation

The possibility of using Vaccinium berries for urinary system infection prevention was

reported by Ofek (1991). Low bush blueberry had one of the highest anti-adhesion activities

(within Vaccinium species and other fruit crops) in vitro, against E.coli which causes urinary

tract infection (Kalt et al., 2007). Wild blueberry extract showed a significant inhibition of

Helicobacter pylori growth in tests in vitro (Zafra-Stone et al., 2007). In vitro assays of anti-

inflammatory activity were conducted (Gabor, 1986; Jensen et al., 2008) and demonstrated the

participation of blueberry bioactive substances in different mechanisms of inflammatory

reduction. The ability of blueberry to reduce chronic inflammation is emerging as an important

bioactivity since chronic inflammation underlies disease, degeneration and aging. Evidence of in

vivo benefits against chronic inflammation by blueberries is significant (for review see Giacalone

et al., 2011; Chun et al., 2008). However, most of this research was carried out as in vitro

experiments. There is a significant lack of in vivo data which prevents one from making clear

statements on blueberry activity in anti-inflammatory processes in the human body.

1.2.3.6 Hepatoprotective Action

Significant and strong results of blueberry (bilberry) intake have been demonstrated in in

vivo experiment with rats infected with provoked toxic hepatitis. Bilberry purée processed using

hydrothermodynamic technology demonstrated almost complete prevention of most symptoms

of hepatic pathology (Levitsky et al, 2009).). Significant effect on liver health in rats fed with

blueberry diet was reported by Wang et al. (2010) and in hamster fed with blueberry pomace diet

by Kim et al. (2010).

1.2.3.7 Brain Activity

Deterioration of brain functions such as short-term memory loss, information retrieval,

balance and coordination is associated with aging. A blueberry rich diet was shown to reverse the

decline in brain functions induced by aging (Joseph et al., 1999). Significant positive effects

arising from blueberry supplementation diet was reported for the cognitive and motor behavior

function of rats, as well effects neuronal signal transmission and protective mechanisms

associated with brain-aging process (Joseph et al., 1999; Joseph et al., 2003; Joseph et al., 2009;

14

Shukitt-Hale et al., 2008). Studies of motor behavior, cognitive performance, learning, and

memory functions, as influenced by a blueberry rich diet for aged rats demonstrated a strong

positive effect of wild blueberry consumption on brain activity in Alzheimer disease model

(Joseph et al., 1999; Papandreou et al., 2009). In an in vivo study, protective effect of blueberry

on brain vessels decreased ischemia-induced damage of the brain hippocampus, in rats (Sweeney

et al., 2002). Clinical studies on older humans with early memory changes who consumed

blueberry juice for 12 weeks showed significant cognitive function performance improvement. It

was recommended to use blueberry supplementation as a preventive approach in Alzheimer

disease (Krikorian et al., 2010). For review see Joseph et al. (2009), Willis et al. (2009), Kalt et

al. (2007).

To sum it up, wild blueberries are a food product with one of the highest antioxidant

activity in in vitro tests. Antioxidant activity of blueberry is related to high polyphenolics

content, particularly anthocyanins. Biological activities of polyphenolics and anthocyanins in

particular were also demonstrated in in vivo experiments with both mammals and human

subjects. Hence, wild blueberries are a promising raw material for health-promoting food

products. Development of high quality blueberry-based products will allow producers to meet a

demand from health-conscious consumers and to lunch more products on the local market.

However, anthocyanins are sensitive to temperature and oxidation, so processing of blueberry

results in the destruction of this substances and thus in the decrease of antioxidant activity. For

saving antioxidant properties of blueberry-based products it is necessary to optimize blueberry

processing (Kalt et al., 2001). More details on blueberry anthocyanin degradation are presented

in Section 1.3.

1.3 Effect of Processing and Storage on Blueberry Polyphenolics

The most popular food products based on wild blueberries are clarified blueberry juices

and blueberry-based beverages. Some traditional products such as jams, jellies, and purées are

also presented on the market but not a wide variety. Also, blueberries are a very popular addition

for different bakery products like muffins and pies (Villata, 1998). Both fresh and frozen berries

can be used for pie filling. A quickly growing sector of the market of functional food includes

concentrated and powdered blueberry juices as well as different products based on wild

blueberry pure and blended extracts.

15

Processing and storage of blueberries can significantly affect their bioactive and

antioxidant properties. Thermal treatment, necessary for enzyme inactivation and product

pasteurization, results in significant degradation of anthocyanins (Brownmiller et al., 2008;

Brownmiller et al., 2009; Kalt et al., 2001; Kalt et al., 2000; Schmidt et al., 2005). Oxidation of

polyphenolics can be provoked by light (Carlsen and Stapelfeldt, 1997), oxygen (Jackman et al.,

1987), enzymes (Kader et al., 1999) and products of sugars degradation (Queiroz et al., 2009).

1.3.1 Effect of Processing Methods

The effect of processing methods such as freezing, thawing, pressing and filtration,

powdering and concentration, and pasteurization on blueberry polyphenolics was summarized

and presented in this section. Most of processing methods negatively affect polyphenolics

(anthocyanins in particular).

1.3.1.1 Freezing

Most of blueberries (95%) are frozen just after harvesting, so the largest source of various

blueberry products are frozen blueberries. There are two different methods of freezing such as

bulk freezing and individual quick freezing (IQF), and it is generally assumed that IQF retains

better the quality of fresh berries (Schmidt et al., 2005). An advantage of using IQF berries for

juice processing could be attributed to breakdown of cell walls by ice crystals, which helps in

releasing of anthocyanins and other bioactive compounds from cells (Stewart, 1996).

1.3.1.2 Thawing

Frozen wild blueberries are the main raw material for blueberry-based products. Methods

and regimes of thawing dramatically affect the amount of polyphenolic substances initially

presented in fresh blueberries (Brownmiller et al., 2008; Brownmiller et al., 2009; Stewart,

1996). During thawing, polyphenolic substances become available as a substrate for the

oxidative enzymes such as polyphenoloxidase (PPO) and peroxidase (PO) as a result of cell wall

disruption during the process of freezing. Significantly superior quality of blueberry juice

reported by Brownmiller and co-workers (Brownmiller et al., 2008) could be attributed, as

suggested by the authors, to different methods of thawing. It was found that rapid thawing using

a high-temperature (steam) treatment prevents enzymatic oxidation and results in significantly

higher retention of anthocyanins: 80% of original monomeric anthocyanin concentration

16

(Brownmiller et al., 2008) as compared to 22% (Lee et al., 2002) and 32% (Skrede et al., 2000).

These results were obtained for non-clarified juice (without filtration). For clarified juice the

difference was less obvious but still significant: 46% (Brownmiller et al., 2008) vs. less than

22% (Lee et al., 2002). It follows that all additional technological operations such as crushing,

pressing, depectinization, filtering etc. in blueberry processing results in significant losses of

polyphenols (Brownmiller et al., 2009; Lee et al., 2002; Skrede et al., 2000), because of

additional enzymatic and non-enzymatic oxidation.

1.3.1.3 Pressing and Filtration

Pressing and filtration during berry juice processing results in significant losses of

bioactive substances. Lee et al. (2002) reported the amounts of bioactive substances found in the

pomace (the pulp from a press-cake) as compared with the initial quantities found in frozen

blueberries: 15 to 20 % of polyphenolics, 41 to 55% of anthocyanins, and 10 to 15 % of

cinnamic acid. Some other studies reported contradictory results. The quantity of anthocyanins

found in the pomace by Skrede et al. (2000) was 18%. Kalt et al. (2000) reported that the

pomace by-product of juice processing had about 16% of the ORAC value of fresh wild

blueberries and was correlated with anthocyanin concentration. Similar results were shown by

Brownmiller and co-workers (2008, 2009): 15 % of anthocyanins were lost at the press-cake and

another 25% was removed as sediment at the clarification step. Most researchers agree that a

significant quantity of anthocyanins is lost in blueberry juice processing with pomace: from 15 %

(Brownmiller et al., 2008) to 55% (Lee et al., 2002). Since anthocyanins are mostly located in

skin tissues, filtration of pulp results in significant losses of antioxidant properties in the end

product (Brownmiller et al., 2009).

Lee et al. (2002) reported the following amounts of bioactive substances retained in the

juice: only 13 to 23% of anthocyanins and 36 to 39% of polyphenolics was present in the

pasteurized juice compared to the frozen fruit, and 25 to 35% of anthocyanins degraded (not

founded in the final product and a pomace). Skrede et al. (2000) reported recoveries in juice of

only 32, 35, 43 and 53% of anthocyanins, flavonols, procyanidins and chlorogenic acid

respectively. It was demonstrated that losses were mainly due to the berries’ PPO and PO

enzyme activity (Skrede et al., 2000). Brownmiller et al. (2008) reported only5% loss of

anthocyanins in non-clarified juice, and explained this high level of retention as a result of the

rapid thawing step and high-temperature enzyme inactivation.

17

Sulfur dioxide treatment with of blueberries during juice processing is sometimes used in

juice manufacturing, but the data on the effects of SO2 contradict each other. For example, Lee

and others found that using SO2in blueberry juice processing allows better enzyme inactivation

and increased anthocyanins recovery (Lee et al., 2002). However, Wrolstad (2002) reported

anthocyanins react with SO2 to form colorless products.

Treatment with pectolitic enzymes is used for pectin destruction in blueberry tissues thus

increasing the quantity of pressed juice, and it could be another reason for anthocyanin losses.

Pectolitic enzymes used for juice processing may have glycosidase contaminating activity which

deglycosylate and destabilize anthocyanins (Wightman and Wrolstad, 1996).

Wild blueberry juice is characterized by strong organoleptic properties (intensive flavor

and color) and is deemed a healthy product, but traditional technologies of juice processing

results in dramatic losses of health promoting phytochemicals in the end product. It follows that

pressing and filtration steps result in losses of bioactives: only 80% and 46% of anthocyanins

were found at non-clarified and clarified blueberry juices respectively (Brownmiller et al., 2008)

as compared with frozen berries, which is higher than that obtained by Skrede and co-workers

(32%) and Lee and co-workers (35 to 36%) for non-clarified juices (Skrede et al., 2000; Lee et

al., 2002).

1.3.1.4 Extraction, Powdering, Juice Concentration

Different methods of moisture removal are used to concentrate blueberry juice and

extracts such as drying (spray-drying, freeze-drying) and evaporation under normal pressure and

lower pressure (and, thus, lower temperature). Increasing the solids content in juice should result

in a higher concentration of bioactive substances in the end product. Concentrated or powdered

juices can be used as an ingredient for beverage mixing, and powdered extracts are used as a

compound for pharmaceuticals (more popularly for bilberry, Vaccinium myrtillus (Kalt and

Dufour, 1996). Unfortunately, these processing methods might result in markedly lower content

of antioxidants in the end product. It was found that antioxidant capacity (ORAC) of commercial

juice concentrate (65 °Brix) was only 65% as compared to fresh fruit (12 °Brix) (Kalt et al.,

2000). However, Skrede et al. (2000) and Lee et al.(2002) reported 82.0 to 98.5 % anthocyanin

recovery after low pressure evaporation step.

Powders, obtained with extraction and following drying, are characterized by relatively

high content of bioactives. Jackman and Smith (1996) reported spray-dried powders processed

18

from grape pomace can contain about 1 to 4% of anthocyanins. Sugar added as a carrier during

drying process resulted in improved anthocyanin retention. However, some contradictory results

on the usefulness of extract powdering were presented. It is known that there is a rather low level

of anthocyanins recovery using extraction (about 20%) (Srivastava et al., 2007). Drying

processes also significantly affect phenolics content: a 2-fold loss of total anthocyanins as a

result of slow cabinet drying was reported (Lohachoompol et al., 2004). Powdered and

concentrated blueberry juices used as colorants for extruded corn meal, showed noticeable

degradation of anthocyanins as a result of a high temperature (130°C) treatment. Only 26% and

10% of anthocyanins were obtained for blueberry concentrate and blueberry powder respectively

(Camire et al., 2002).

Moisture removal from blueberry juice and blueberry extracts can demonstrate good

results and allows getting a product with high antioxidant content, but only when accompanied

with reduced impact technologies such as low pressure evaporation or freeze-drying to prevent

bioactive substances destruction (Skrede et al., 2000; Lee et al., 2002).

1.3.1.5 Thermal Treatment (Pasteurization)

Pasteurization is the method of heat treatment which is commonly used for increasing the

shelf-life of blueberry products and prevents the microbial spoilage during storage. Heat

treatment negatively affects the antioxidants content and is a factor for its destruction during the

pasteurization process. From the other side, heat treatment is necessary for enzyme inactivation

since enzyme activity is responsible for polyphenolic losses in blueberry processing. More

detailed information about the effect of temperature on phenolics content is presented in

Section1.3.2.1.

The effects of pasteurization have been well studied for blueberry juice processing, but

results reported by different researchers contradict each other. First of all, Brownmiller and co-

workers reported 8% and 5 % losses for non-clarified and clarified blueberry juices as compared

with fresh berries at the pasteurization step (heating of bottled juice in a steam box till 90°C). On

the other hand, some authors reported increased anthocyanin concentration after pasteurization:

at 4 % (Skrede et al., 2000), high temperature short time (HTST) pasteurization at 90°Cfor 90

seconds, and at from 2.5% to 8% (Lee et al., 2002), HTST pasteurization at 90°Cfor 90 seconds.

However, similar effect of pasteurization on total polyphenolic content was not found; Lee et al.

19

(2002) reported insignificant changes in the polyphenolics due to pasteurization. These results

are difficult to compare because of different regimes and methods of treatment used.

Queiroz et al. (2009) reported losses of anthocyanins during handmade blueberry jam

preparation. Pasteurization of jams was carried out during cooking at temperature 102 – 105 °C.

A15 – 20 minute thermal treatment results in 70 – 80% of anthocyanins recovery, a 25 minute

treatment retained of only 40% of the berry anthocyanins. Kalt and others reported a 2-fold drop

in the ORAC level of pasteurized commercial jam as compared with fresh lowbush blueberry

fruit (Kalt et al., 2000). Howard et al. (2010) reported 79% retention of anthocyanins in

blueberry jams (made with sugar or sugar-free) cooked for 1 minute at 101 – 105°C. The ORAC

value retention was found to be 90% and 79% for jam and sugar-free jam respectively.

1.3.1.6 Blueberry Juice Processing

The main stages of blueberry juice processing are presented at Figure 1.3 (Lee et al.,

2002; Skrede et al., 2000).Table 1.2 shows that losses of anthocyanins during thawing, crushing,

depectinization and following pressing of the blueberries can reach from 5 to 54 %. Quick

thawing (using steam) allows minimal anthocyanin loss (Brownmiller et al., 2008). A significant

part of anthocyanins is removed from the final product as a pomace byproduct, so the content of

anthocyanins in the juice is only 12 to 41% of the initial content in frozen berries.

Blueberry skin and outer layer of the pulp contains a much higher amount of

anthocyanins than the pulp of blueberries (Gao and Mazza, 1994). Riihinen et al. (2008) reported

up to a 320-fold difference in anthocyanin concentration for berry skin and berry pulps in

blueberries Vaccinium angustifolium x Vaccinium corymbosum (compare 622.3 mg/100g in skin

and 1.9 mg/100g in pulp) and a 19-fold difference in bilberries Vaccinium myrtillus (compare

anthocyanin concentration 2025.6 mg/100g in skin and 104.0 mg/100g in pulp). Blueberry juice

processing involves separating skins from the final product; hence, a significant amount of

potentially beneficial human health substances, particularly anthocyanins, is removed from the

final product (juice). Processing blueberries into purée (whole blueberries with skin) allows one

to produce more blueberry-rich products with higher amounts of anthocyanins and possibly with

improved properties in some health and food applications.

20

Figure 1.4 Blueberry juice processing stages

(Lee et al., 2002; Skrede et al., 2000)

For blueberry juice processing, the best result for anthocyanins retention (72% of initial

anthocyanin concentration) was obtained for non-clarified blueberry juice processed using

intensive thawing (Brownmiller et al., 2008). The worst results (5% of initial anthocyanin

concentration) were found for clarified juice processed without blanching as an intermediate step

(Lee et al., 2002).

IQF blueberries

Thawing

Crushing

Depectinization

Pressing

Clarification

Pasteurization

Concentration

21

Table 2.2 Anthocyanins retention in blueberry juice processing stages

(Lee et al., 2002; Skrede et al., 2000; Brownmiller et al., 2008, 2009)

* - for non-clarified juice

Blueberry juice is one of the most convenient ways for customers to consume blueberries.

Unfortunately, commercial technologies of blueberry processing as shown above do not provide

high retention of anthocyanins. Since most of all polyphenolics are contained in solid material, a

significant part of them is removed from the product as a waste product (pomace). Moreover,

additional losses are caused by degradation of bioactives during process stages because of

enzymes activity, oxygen, light, temperature, etc.

1.3.2 Effect of Processing Factors

Effects of processing on anthocyanins can be attributed to the effects of different

processing factors of physical (temperature, oxygen, light), chemical (pH, sugars, pectins) and

biochemical (enzymes) nature (Francis, 1989). Some of these factors affect anthocyanin stability

negatively by increasing the rate of oxidative reactions. Other factors prevent polyphenolics from

oxidation (low pH level) and there are some factors like temperature (which was reviewed in

Section 1.3.1.5) and sugar content which can both increase or decrease degradation of

polyphenolics depending on the value of influenced factor.

Process stage Semi-product % of anthocyanins retention

Thawing Defrosted berries n/a

Crushing Blended berries n/a

Depectinization Depectinized berries n/a

Pressing

juice Pressed juice 5 – 80

press-cake Pomace 15 – 55

Clarification Clarified juice 5 – 46

Pasteurization Pasteurized juice 13 – 41 (72*)

Concentration Concentrated juice (calculated for initial berries °Brix)

13 – 31

22

1.3.2.1 Effect of Temperature

Thermal methods are commonly used for blueberry preservation. Pasteurization is

necessary for providing a prolonged shelf life of jams, juice, purée and other blueberry foods as a

technique to reduce microbial load. Also blueberries are traditionally used as a filling for pastry

baking and are therefore subjected to high temperature. But polyphenol substances, anthocyanins

in particular, are characterized by a very high sensitivity to thermal treatment and storage

temperature. From the other side, thermal treatment is necessary to inactivate enzymes which

contribute to polyphenolic oxidation and condensation (Kader et al., 2002; Kader et al., 1997;

Kader et al., 1998; Kader et al., 1999).

Different research shows a significant degradation of the polyphenolic substances and a

decrease in antioxidant properties as a result of thermal treatment. For blackberry and other berry

juices it was found that the rate of anthocyanin loss is strongly time and temperature dependent

(Cisse et al., 2009; Wang and Xu, 2007).In these studies, anthocyanin loss was reported by

authors to be explained by a first order exponential dependence; higher temperatures resulted in

higher anthocyanin loss for the same period of time.

Brownmiller and co-workers reported perfect anthocyanin retention after 3 minutes at

95°C treatment in highbush blueberries (Brownmiller et al., 2008; Brownmiller et al., 2009).

Exposure of canned blueberry jars in boiling water for 15 minutes resulted in 43%, 34% and

28% loss of anthocyanins for highbush blueberry purée, berries canned in water and berries

canned in syrup respectively. Blanching resulted in a 26% loss of the antioxidant capacity of

berries. The antioxidant capacity of purée, canned in water and canned in syrup berries decreased

by 47%, 42% and 46% respectively as compared with fresh berries (Brownmiller et al., 2008;

Brownmiller et al., 2009).

Anthocyanin loss during jam preparation was studied (Queiroz et al., 2009). Handmade

blueberry jams characterized by different sugar content were processed at 102 – 105°C during

15, 20 and 25 minutes. Higher anthocyanin loss (30 – 45%) was in the samples prepared without

sugar as compared with 64 – 76 °Brix samples (20 – 35% of anthocyanin loss) in case of 15 and

20 minute of heat treatment. Samples with high sugar content heated for 25 minutes

demonstrated a significant loss of anthocyanins (approx. 60%) compared with similar

anthocyanin concentration in no sugar samples (for 20 and 25 minute treatment) (Queiroz et al.,

2009).

23

Kalt et al. (2000) reported the effect of extraction temperature on polyphenolics content

and antioxidant activity of lowbush blueberry purée extracts as a result of extraction and during

storage. Treatment at 60 °C resulted in a much higher extraction of total phenolics, anthocyanins

and antioxidant capacity compared with 25 °C treatment but poorer retention after 2 weeks of

storage at 20°C.The authors recommend optimizing time-temperature regimes during blueberry

processing to maximize antioxidant capacity of a final product.

Health functional bioactivity of polyphenolics can be affected by processing. Studying

the antioxidant capacity (ORAC) of different commercial lowbush blueberry products (such as

purée, pie filling, canned fruit, jam, dried fruit, concentrated juice) showed significant losses

compared with fresh fruits (Kalt et al., 2000). Unfortunately, regimes of heat treatment were not

specified in this work. One of the most significant losses was observed for concentrated juice:

the ORAC value of juice concentrate (65 °Brix) was only 65% of fresh blueberries (12°Brix).

Kalt et al. (2000) reported 20% loss in the ORAC in commercial pasteurized blueberry purée

compared with fresh berries (calculated for dry weight). There were some contradictory results

from Brownmiller et al. (2008), which demonstrated that highbush blueberry purée processing

led to a 43% loss of monomeric anthocyanins and a 47% loss of antioxidant capacity.

The baking of berries as part of pastry and other dishes resulted in loss of antioxidant

properties similar to that for other types of heat treatment. Kalt et al. (2000) found about a 15%

ORAC loss for fresh baked blueberries in pies compared with fresh wild blueberries. Berries

from the pies prepared using commercial canned pie filling had only about one third of the fresh

baked fruit ORAC level. It was reported by Queiroz et al. (2009) that the anthocyanin

degradation of highbush whole blueberries cooked in stuffed fish ranged between 45 and 50%.

Schmidt and co-workers found that thermal treatment of fresh and IQF blueberries

resulted in a loss of anti-proliferative activity in in vitro anti-cancer test (Schmidt et al., 2005).

Regimes of heat treatment were not specified, however there was no significant anticancer

activity found in heat processed blueberry products (jam, juice concentrate, canned whole fruit,

and spray-dried powder).Despite some contradictory results studies agree that a significant

amount of phenolic antioxidant loss during heat treatment was observed.

24

1.3.2.2 Effect of Oxygen

Oxygen has a negative effect on the polyphenolic compounds. Kalt et al. (2000) found a

76%, 30% and 46% decrease in monomeric anthocyanins, total phenolics and the antioxidant

capacity respectively during 6 hours of intensive oxygen influence on lowbush blueberry juice.

Anthocyanins stored under vacuum or in nitrogen media had higher stability than anthocyanins

exposed to oxygen (Jackman et al., 1987). Oxygen oxidizes anthocyanins directly, and the

products of this reaction do not have antioxidant activity (Jackman et al., 1987). Also some

anthocyanins (with o-diphenolic B ring) can be oxidized by o-quinones formed as a result of the

oxidation of chlorogenic acid by PPO (Kader et al., 1997). For the prevention of polyphenolic

compound losses as a result of oxidation authors suggest using special types of packaging with a

high oxygen barrier and minimizing headspace and packaging spare volume.

1.3.2.3 Effect of Light

Visible and UV light can contribute to losses in anthocyanins. It was reported that light is

one of the major causes of anthocyanin degradation during storage of elderberry extracts and

depended on the wavelength of irradiation (Carlsen and Stapelfeldt, 1997). Shorter wavelengths

were more deteriorating, thus excluding ultraviolet light would improve the stability of

anthocyanins. Selecting proper packaging materials with a high light barrier can improve

significantly the stability of bioactive substances during shelf-life.

1.3.2.4 Effect of pH Level

Anthocyanins demonstrate higher stability at low pH (Francis, 1989). Cabrita et al.

(2000) found that after 60 days of storage at 10 °C in acidic conditions (pH levels 1 – 3) more

than 70% of the initial anthocyanins remained, while more than 90%was lost after 8 days at a pH

level of 5 – 6 at the same temperature. Additional acidification may provide stability of

anthocyanins. As the antioxidant capacity is correlated with the anthocyanin concentration,

eventually it results in maximum antioxidant activity of the final products (Kalt et al., 2000).

1.3.2.5 Effect of Sugars

It was reported (Queiroz et al., 2009) that adding sugar (64 – 76 °Brix) to blueberry jams

led to 20 to 30% loss of anthocyanins, and higher sugar content (80°Brix) resulted in50 to 60%

loss. The authors connected anthocyanins loss with sugar degradation in the Maillard reaction.

25

Other studies on blackberry anthocyanin loss during processing agree that its retention is

influenced by sugar content (Rubinskiene et al., 2005; Wang and Xu, 2007).

1.3.2.1 Effect of Enzymes

Blueberries contain enzymes such as PPO which damage polyphenolics and reduce

antioxidant activity (Skrede et al., 2000). Anthocyanins are not the main substrate for PPO, but

they degrade in the reaction with oxidation products of PPO such as hydroxycinnamate esters,

phenolic acids, flavones and flavonols (Kader et al., 1997; Kader et al., 1998; Kader et al., 1999).

Peroxidase can also lead to in anthocyanin degradation (Kader et al., 2002). In the intact fruits,

PPO and peroxidase are located in the cytoplasm, while polyphenols are located in vacuoles of

plant cells. Once tissues are disrupted during processing, it creates conditions for enzymatic

oxidation of phenolic substances (Lee et al., 2002). Glycosidases may deglycosylate and

destabilize anthocyanins but berries are not a source of this type of enzymes. Anthocyanins

glycosides (i.e. anthocyanidin glycosides) are much more stable than anthocyanidin aglycones.

Potential sources of glycosidase activity can be from moldy fruits and commercial enzyme

systems which are used for depectinization in juice processing (Wightman and Wrolstad, 1996).

Heating of berries for enzyme inactivation is necessary for retaining maximum antioxidant

capacity in the finished product and during shelf-life (Brownmiller et al., 2008). Adding sulfur

dioxide may also decrease enzyme activity (Lee et al., 2002) but SO2 can react with anthocyanins

and form colorless components (Wrolstad, 2000).

1.3.3 Effect of Storage

1.3.3.1 Fresh Blueberry Storage

Fresh wild blueberries are only available for a short period after harvesting and cold

storage. Polyphenolic content may increase during cold storage of some fruits and berries (Kalt,

2005). Increasing anthocyanin concentration was observed in underripe wild blueberries after

harvest in cold storage (Kalt and McDonald, 1996), fully blue fruit did not do so. In the study by

Kalt et al. (1999) anthocyanin concentration and ORAC did not change during 8 days of storage

at 0, 10, 20, and 30°C. Higher (Connor et al., 2002; Kalt et al., 1999) and lower (Lohachoompol

et al., 2004) anthocyanin concentration was observed during cold storage in highbush

26

blueberries. It may be conclude that short cold storage does not affect significantly the

antioxidant properties of blueberries.

1.3.3.2Frozen Blueberries Storage

Most wild blueberries (95%) are frozen just after harvesting, so the general source for

various blueberry products are frozen blueberries. Information about the changes of bioactive

substance concentration during freezing and low temperature storage is quite limited. There was

a report about the decreasing antioxidant capacity of IQF samples of blueberries compared with

fresh samples (Kalt et al., 2000) but it was not specified whether these blueberries originated

from the same composite and what the time of storage was. Lohachoompol et al. (2004) reported

the increasing anthocyanin concentration in blueberries stored for 1 and 3 months in a frozen

condition but any explanation of this finding was not suggested. The quality of IQF blueberries is

considered to be stable during all periods of storage and a lot of researchers use it as a raw

material and/or control for experiments (Brownmiller et al., 2009; Lee et al., 2002; Queiroz et

al., 2009). However, information on quality changes during storage of blueberries in frozen

conditions is limited; also there is no information on berry quality IQF vs. bulk freezing. The

kinetic of polyphenolics change and loss during low-temperature storage has not been studied.

1.3.3.3Blueberry Based Product Storage

Researchers have reported significant degradation of polyphenolics during product

storage (Gil et al., 1999; Larrauri et al., 1997; Srivastava et al., 2007) and this process is

described as time and temperature dependent. Srivastava et al. (2007) found a very high stability

of polyphenols and antioxidant activity of blueberry extracts stored in glass bottles at -20°C for

30 days. At the same time, after 30 days of storage at 35°C anthocyanins were not detected.

Brownmiller and co-workers studied the effect of storage on the polyphenol composition

of highbush blueberry juices, purée and canned berries (Brownmiller et al., 2008; Brownmiller et

al., 2009). It was reported that there were significant losses of bioactive substances after 6

months of storage at 25°C: the level of the anthocyanins retained in the products before and after

6 months of storage when compared with fresh fruit changed from 80% to 23%, from 46% to

15%, from 50% to 20%, from 72% to 29%, and from 66% to 38% for blueberry non-clarified

and clarified juices, purée, canned in sugar syrup and canned in water berries respectively. The

decrease in ORAC levels was not so dramatic and showed from a 5% to 1% loss for different

27

products after 6 months storage period. After 6 months of storage, non-clarified and clarified

blueberry juices contained only 23% and 15% of berry anthocyanins respectively (Brownmiller

et al., 2008).

The temperature during storage significantly affects polyphenols stability. It was found

that anthocyanin degradation in pasteurized blueberry jams is significantly higher at 25°C than at

4°C (Howard et al., 2010). All authors agree that temperature is a key factor of the shelf-life

quality degradation, so it’s necessary to provide a low temperature of the product to retain

polyphenolic compounds and antioxidant properties.

To sum it up, anthocyanins are very sensitive to different processing factors.

Conventional technologies result in great losses of anthocyanins and the antioxidant properties of

processed blueberry products. In order to reduce these losses and to improve the product quality,

minimization of the number of technological steps (in order to reduce oxidation), milder heat

treatment regimes, and processing whole blueberries with skin in the form of paste or purée can

be suggested. In order to insure the quality of the product, different methods of blueberry-based

product quality control can be applied (for more information see Section 1.4 of this document).

Modification of conventional technologies or applying new technologies for blueberry-based

product processing is needed to develop new high quality blueberry-based products. One of the

potential technologies for blueberry processing, namely hydrothermodynamic technology, is

discussed in Section 1.6 of this document.

1.4 Methods of Blueberry-Based Products Quality Control

For wild blueberry quality parameter determination, there is quite a variety of analytical

methods used. The attention of researcher has been focused on bioactive substance content and

the antioxidant properties of wild blueberries (Gu et al., 2002; Kalt et al., 2000; Kalt and

McDonald, 1996). Some studies were devoted to texture property determination and sensory

panel evaluation of fresh wild blueberries (Donahue and Work, 1998; Donahue et al., 1999; Silva

et al., 2005; Carbobe et al., 2008), of blueberry juices (Main et al., 2001) and of products

prepared with blueberry purée (Leheska et al., 2006). In this study, spectrophotometric method

of anthocyanin determination was used due to its relative simplicity and high accuracy.

28

1.4.1 Extraction

The extraction of phenolic compounds is a very important part of the analytical

quantification. Different solvents are used for phenolics extraction from wild blueberries as there

is no standardized method of extraction. Aqueous acetone, ethanol, methanol and their

combinations are all used by different researchers; acidified media for anthocyanins stabilizing is

provided by hydrochloric, formic and other acids. The acidified aqueous solution of methanol

(88% methanol, 12% water, 0.1% formic acid) suggested by Kalt et al. (2001) as an extraction

method, resulted in extracts with the highest anthocyanin and total phenolics concentrations and

provided the most consistent results. Careful homogenization of the blueberry samples in the

solvent media is necessary for more complete extraction (Khanal et al., 2009; Nicoue et al.,

2007; Shi et al., 2002).

1.4.2 Spectrophotometry

1.4.2.1 Measurements of Total Polyphenolics Content

The most common spectrophotometric method utilized for measuring of the total

polyphenols content is based on Folin-Ciocalteau reagent with gallic acid as a reference standard

(other phenolic acids equivalents also can be used: tannic, chlorogenic, caffeic, ferulic etc.)

(Prior et al., 2005). This method measures the quantity of phenolic groups; the number of

phenolics group per molecule varies depending on the structure therefore results of this

measurement cannot be correlated with actual molecular weight of polyphenolics (Singleton and

Rossi, 1965). Also it is a redox assay hence redox active substances (such as ascorbic acid and

some sugars) might interfere with assay and affect the results. Different phenolic reference

standards differ in their sensitivity to the assay and may affect phenol results (Prior et al.,

2005).It is generally found that total polyphenolics is positively correlated with the antioxidant

capacity and can be used for its estimation (Brownmiller et al., 2008; Connor et al., 2002; Kalt et

al., 1999; Kalt, 2005).

1.4.2.2 Measurements of Anthocyanin Concentration

The spectrophotometric pH differential method is based on the ability of the monomeric

anthocyanins to change the color depending on the pH level. In contrast, the polymeric

anthocyanins retain the color within this range of pH, so the difference in absorbance between

29

the two standard buffer solutions (pH=1 and pH=2) is due to the monomeric anthocyanins

pigments (Wrolstad, 1976; Guisti and Wrolstad, 2001). For calculations, polymerized

anthocyanin pigments (also known as derived tannins, or polymeric color) are excluded because

they do not show reversible behavior with the pH and are not bleached by metabisulfite. The

total monomeric anthocyanin concentration is calculated using the molecular weight and

extinction coefficient of standard anthocyanin (usually cyanidin-3-glucoside).There was a very

good agreement between results in a collaborative study with 11 laboratories which tests

independently 7 different products (Wrolstad et al., 2005). Anthocyanin measures obtained by

HPLC and pH differential methods showed very good agreement (Nicoue et al., 2007).

In conclusion, spectrophotometric methods for total phenolic, monomeric anthocyanins

and polymeric color can be used for easy and fast monitoring of blueberry product quality.

Reported high correlation between polyphenolic or anthocyanin concentration and the ORAC

value (see Sections 1.2 and 1.3) allows one to infer about the antioxidant properties of the

blueberry-based foods using results of the spectrophotometric analysis. Wrolstad’s pH

differential method can be used as a simple and precise analysis for blueberry products quality

quantification.

1.5 Statistical Methodology for Optimization Problem

In order to find the best levels of processing factors for optimized response some

statistical methods can be applied. First of all, it is necessary to analyze that factors can be

potentially significant. Usually the list of measurable and controllable factors can be done by an

analysis of the system. Then the chosen factors should be screened for the significance. One of

the well-known methods for factors screening is 2k factorial design. However, since 2 or 3

replications are needed for each run, the total number of runs increases dramatically with

increasing the number of analyzed factors. For example, in case of three replicates for 24

factorial designs the total number of runs is 48. Such a big number of experimental runs makes

the experiment labor intensive, time consuming and expensive.

There is an alternative method of factor screening which allows a researcher to decrease

the number of runs markedly. Unreplicated 2k factorial design is practically useful if the

significance of many factors should be investigated. Due to the lack of replication there is no

30

pure error in unreplicated design so classic ANOVA analysis is impossible. One of the

approaches to conduct ANOVA analysis, in this case, is to assume that the highest order

interaction effect is non-significant so that mean squares of this interaction effect can be used to

estimate the error. The second approach is to collapse the model. It is possible if one of the

factors (main effect and all its interaction effects) is not significant. In this case two levels of this

factor can be considered as replicates and the ANOVA analysis might be applied. Another

approach of analyzing data from unreplicated designs that doesn’t require error degrees of

freedom for ANOVA analysis is based on the normal probability plot of the estimates of the

effects (Daniel, 1959; Astatkie et al., 2006; Lenth, 1989) and can be applied by using statistical

software.

This further investigation involves determination of the optimal level for the factors

chosen through the screening process. For this purpose response surface methodology (RSM) is

commonly used. RSM enables optimization of the response, affected by several process

variables, by using a set of mathematical and statistical techniques. In the case of multiple

responses, individual optimums are not of great interest and overlapping response surfaces is

used to identify optimal processing regimes.

To investigate the kinetics of anthocyanin degradation during storage, repeated

measurements analysis should be used. Since the measurements in a shelf-life experiment are

taken on the same experimental unit over time and the consequence could not be randomized,

classic ANOVA analysis cannot be applied. Since every measure depends on the previous one,

the time trends should be taken into account. Repeated measurements analysis allows a

researcher to analyze this kind of data using developed methodology (Littell et al. 1998) and

statistical software applications.

Nonlinear regression analysis is used to analyze the data, which cannot be described by

linear models. Nonlinear modeling gives more flexibility in choosing the model and usually is

based on the theory about the mechanism of the analyzed process. For example, kinetics of

anthocyanin loss may be expressed by first-order exponential model (Wang, 2007; Kechinski et

al., 2010) so anthocyanin loss studied in this work was expected to be described by the same

model. A non-linear analysis is a complex and time consuming method but the parameters

involved in non-linear models are physically meaningful and help in understanding the nature of

the process, moreover, non-linear models can be used as predictive models which is important

for shelf-

provided

1.6 Hydr

H

used for

cavitation

illustratio

turbulenc

with dist

going thr

forces an

increase

product (

H

vegetable

grinding,

bioactive

Figure 1.

-life studies

d in Sections

rothermody

Hydrothermo

r blueberry

n to provide

on of the pri

ce and multi

turbing strea

rough the c

nd high loca

of the tempe

(www.tekma

HTDT was

es, beans) to

, mixing and

e compounds

.5 Principles

(Bates and W

2.2.3, 3.2.3

ynamic Tech

odynamic tec

processing

e quick hea

inciples of H

i-phase cavi

ams of the l

avitator (act

al pressure.

erature of th

ash.ca).

developed f

o particles 10

d volumetric

s.

s of HTD tec

Watts, 1988

and 4.2.3.

hnology

chnology (H

(Osipenko,

ating and ble

HTDT is pre

itation bubbl

liquid. Cavit

tive area). C

Energy rele

he moving fl

for the proc

0 to 1000 nm

c heating in

chnology

31

).More detai

HTDT) is a n

2009). HT

ending/grind

sented in Fi

les while go

tation bubbl

Collapsing o

eased as a r

luid and resu

cessing of d

m with mini

n an anaerob

iled informa

new technol

TDT uses th

ding of mat

g. 1.5, wher

oing through

les are unsta

of cavitation

result of bub

ults in crush

different typ

imum qualit

bic environm

ation on stati

logy that can

he physical

terials at the

re moving fl

h the obstac

able and co

n bubbles cr

bbles collap

hing and hom

pes of food

ty degradatio

ment preven

istical metho

n be success

phenomeno

e same time

luid induces

cle (i.e. cavit

ollapse right

reates local

psing leads

mogenizing o

d (fruits, be

on. Simultan

nts destructio

ods is

sfully

on of

e. An

local

tator)

after

shear

to an

of the

erries,

neous

on of

32

The potential advantages of HTD technology includes uniform volumetric heating of the

product without scorching (no contact heaters are used in the HTDT apparatus), reduced high-

temperature oxidation due to no contact with oxygen during processing, and a prolonged product

shelf-life due to pasteurization (Osipenko, 2008 and 2009).It was reported that the HTDT sealed

batch process prevents products from oxidation. Simultaneous unit operations (crushing, heating,

homogenization, and pasteurization) take place in the same tank (Osipenko, 2008) excluding

additional oxidation due to multiple processing steps.

The most detailed information on the effect of the HTDT on processed food product

quality is available for soy beans. Soybeans were processed into homogeneous paste after

soaking in water. Complete retention of vitamins and unsaturated fat acids of soybeans as a result

of HTDT processing was reported (Osipenko, 2008; www.tekmash.ca). Moreover, an increase in

some bioactive compounds content was obtained (Osipenko, 2008; www.tekmash.ca). The

following increase of nutrient content for HTDT processed soy beans as compared with raw

beans was reported: 1.3-fold, 5.0-fold, 3.3-fold, 2.7-fold, 1.5-fold, and 2.4-fold increases for

vitamins B1, B2, niacin, B6, folic acid, and carotenoids respectively (Osipenko, 2008;

www.tekmash.ca). Also, partial converting of polysaccharides to mono- and disaccharides was

reported. The improved nutrient concentration may occur due to the fine homogenization and

hence improved release of nutrients from the seed matrix.

Using HTDT technology, wild bilberries (Vaccinium myrtillus) can be processed in a

uniform suspension without removing skins and seeds (“whole fruit”, “liquid berry”) (Osipenko,

2009). The author reported complete retention of total polyphenolics and assumed the higher

bioavailability of phenolic substances due to fine product homogenization (Osipenko, 2009).

Resources available for this technology are very limited and basically includes

information from the corporate web-site (www.tekmash.ca) and patents (Osipenko, 2008 and

2009). There is an article (in Ukrainian) devoted to the hepatoprotective properties of HTDT

bilberry paste in an experiment with mice (Levitskiy, 2009). In spite of limited information, all

the above mentioned leads to a hypothesis that the use of THDT processing for blueberry might

result in a high quality product with good retention of health beneficial components.

33

Conclusions

1. Wild blueberries are a delicious food and food ingredient and an important crop in Atlantic

Canada. They are characterized by the highest polyphenolics concentration among cultivated

crops that may benefit health.

2. At the moment, the selection of commercially available wild blueberry-based food products

is very limited. Consumers are interested in getting healthier and more natural foods but

these kinds of products are absent on the market. Blueberry production in Atlantic Canada is

increasing significantly, so producers and processors are interested in new blueberry-based

product development in order to increase blueberry markets.

3. Processing of wild blueberry generally has a negative effect on polyphenolics and, by

extension, on their health promoting properties. Information on the impact of processing

factors on blueberry polyphenolic losses suggests that process optimization is warranted to

minimize polyphenolic degradation.

4. The spectrophotometric method for determination of anthocyanin concentration and tannin

content is relatively simple and precise, allowing one to infer both phenolic concentration

and antioxidant capacity of blueberry-based products. Anthocyanin concentration can be

used as a response in process optimization.

5. Effect of storage on quality degradation of blueberry products requires further research.

6. HTD technology is a promising method for blueberry processing; its effectiveness should be

further investigated.

34

GOAL AND OBJECTIVES

The goal of this research is optimization of blueberry purée processing using the HTD

technology to maximize the content of bioactive substances (anthocyanins) with respect to food

safety.

Objectives of the research:

1. Compare HTD technology and conventional blueberry processing technology. Study the

difference between HTDT blueberry purée and commercial blueberry-based products in

order to prove the efficiency of HTDT to process blueberries into a high quality pasteurized

product;

2. Study and model kinetics of quality degradation during HTDT blueberry purée storage in

order to develop shelf-life recommendations;

3. Study the effects of processing factors (temperature, time, heating rate, cavitation mode) on

food quality and safety and optimize time-temperature regimes for HTDT blueberry

processing.

2. PROD

2.1 Intro

T

other blu

technolog

obtained

THDT pr

with con

higher an

the mark

2.2 Mate

2.2.1 Exp

1 – the

5 – the

Figure 2.

E

apparatus

and hom

1

DUCT CH

oduction

This chapter

ueberry pro

gy and som

using HTD

rocessing of

ventional tec

nthocyanin c

et.

erials and M

perimental A

e tank; 2 – the

e pump; 6 – the

.1 General v

Experimental

s TEK-1 wi

mogenization

8

6

HARACTE

is devoted

ducts (froze

me commerc

D technology

f blueberries

chnology. A

concentration

Methods

Apparatus

motor; 3 – the

e thermocouple

iew of pilot-

l work on b

ith 4.5L cap

of 4.5 L of

7

5

3

ERIZATION

to the comp

en blueberri

cial blueber

y. The exper

s provides th

Also it was h

n than some

pressure gaug

e; 7 – the cavit

-scale HTDT

blueberry pr

pacity (Fig.2

f blueberry

7

4

35

N

parative ana

ies, blueberr

rry products

riment was

he superior q

hypothesized

e commercia

es; 4 – the gask

tator; 8 – the sw

T food proce

rocessing wa

2.1). Pilot-sc

purée in a b

alyses of HT

ry purée pr

s) in order

conducted t

quality of th

d that HTDT

al blueberry

ket;

witcher.

essor TEK-1

as done on

cale unit TE

batch proces

2

TDT bluebe

rocessed usi

to characte

to check the

he final prod

T blueberry p

based produ

the pilot-sc

EK-1 provid

ss. Thawed

erry purée v

ing convent

erize the pro

e hypothesis

duct as comp

purée may h

ucts presente

cale experim

ed pasteuriz

blueberries

versus

tional

oduct

s that

pared

have a

ed on

mental

zation

were

36

loaded manually into the tank (1), and the motor (2) was started using a pushbutton from the

control panel (not shown in the picture). Two pressure gauges (3) were used to keep the same

pressure on both sides of the gasket (4), between the motor parts and the moving liquid, using a

water stream though the system. Continuous movement of the liquid (blueberry purée) was

provided by the pump (5). For temperature control, the thermocouple, (6) immersed into thermo

conductive purée in the well, incorporated to the pipe was used. Heating of the liquid was

provided due to its moving through the cavitator (7) which had two possible working positions:

the valve regulator down was assigned as cavitation mode A, and the valve regulator up was

assigned as cavitation mode B. These two cavitation modes are provided by the different shape

of the cavitator which can be changed by the switcher (8). Cavitation mode A provided the

highest heating rate of the product, cavitation mode B was used for providing the highest

homogenization of the product at lower heating rates.

2.2.2 Materials

Raw materials for this study were provided by PEI Organic Fruit and Berries Ltd. (frozen

berries, harvested in September 2009). Frozen berries were stored in 10 kg plastic buckets at –

18°C before processing. Berries in buckets were thawed prior to processing during 12 to 14h at

room temperature. HTDT blueberry purée was processed in September 2009 at the Engineering

Department of the NSAC using the following regimes: temperature of pasteurization at 95°C, no

holding time; cavitation mode A up to 70°C, then changed on cavitation mode B up to 95°C,

heating rate 1.9°C/min. In order to simulate the conventional process of blueberry pasteurization,

the following technique was used: 2 kg blueberry was blended for 5 minutes, and then heated

using the same heating rate in an open contact heater (roaster) up to 95°C. In both cases the

pasteurized products were filled into 250 ml jars and the jars were sealed, then jars were left for

cooling down in upside down position self-pasteurization of the lids. Other methods of

conventional blueberry pasteurization should be applied in order to compare the effectiveness of

HTDT with state-of-the-art pasteurization techniques (such as heat exchanger or high

temperature sort time (HTST) pasteurization; however, these methods requires using a specific

equipment which was not available at NSAC.

Some commercial products covering a variety of blueberry-based products including

fresh blueberries, frozen blueberry purée, juices (clarified, non-clarified, organic, and from

concentrate), syrup and jams (blueberry spread, organic blueberry spread, and homemade jam)

37

were compared (Table 2.1). Commercial products were purchased in stores (products from

shelves); three replications for each product were used. Fresh blueberries were provided by “PEI

Organic Fruit and Berries Ltd” (harvested in September 2009). A sample of commercial frozen

blueberry purée (“Jasper Wyman and Son”) was provided by “PEI Organic Fruit and Berries

Ltd” in April 2010.

Table 2.1 Blueberry products used for comparison analysis

# Product type Sample name Sample description Producer Code

name

1

Raw

/ se

mi-

prod

uct Frozen blueberries

Fresh wild blueberries(harvested September 2009)

PEI Organic Fruit and Berries Ltd.

FB

2 Frozen blueberry purée Frozen wild blueberry purée Jasper Wyman and Son FP

3

Rea

dy to

be

cons

umed

HTDT blueberry purée Wild blueberry paste produced using HTDT technology

NSAC

HTDT

4 Van Dyk’s Wild Blueberry juice

Pasteurized clarified blueberry juice, not from concentrate

Van Dyk’s Health Juice Products Ltd.

juice1

5 Acadian Maple Wild Blueberry juice

Pasteurized non-clarified blueberry juice, not from concentrate

Acadian Maple Products Ltd. juice2

6 “Just Jus” Wild blueberry organic juice (non-clarified, not from concentrate)

Pure Source Inc. juice3

7 “Just Blueberry”R.W.Knudsen

Blueberry juice (from concentrate)

Smucker Quality Beverages Inc. juice4

8 Acadian Maple Wild blueberry syrup

Wild blueberry syrup, 52% sugars content

Acadian Maple Products Ltd. Syrup

9 Pure Labrador Wild blueberry spread

Wild blueberry spread, more than 80% sugars content

Labrador Preserves Co jam1

10 “Organics” PC Wild blueberry spread

Organic wild blueberry spread, more than 50% sugars content Loblaw’s Inc. jam2

11 Homemade blueberry jam

Homemade blueberry jam (organic blueberries, more than 60% sugar content)

Provided by PEI Organic Fruit and Berries Ltd.

jam3

38

2.2.3Analytical Methods

2.2.3.1 Measurement of Anthocyanin Concentration and Polymeric color Content (Tannins)

An approximately 15 g subsample of the product or raw material was ground in two

volumes in a cold acidified (0.1% formic acid) mixture of methanol, acetone and distilled water

(40:40:20 v/v) for 2 minutes followed by filtering the suspensions (glass fiber filter, #6) in order

to obtain extracts (Kalt et al., 2008). Extracts (50 mL) were stored at a temperature of –18°C

prior to the analysis; the storage temperature of the extracts was reached by placing them into a

freezer.

Total monomeric anthocyanin concentration and the percent contribution of polymeric

color were determined by a pH differential spectrophotometric method (Wrolstad, 1976; Guisti

and Wrolstad, 2001). This method uses the color change of monomeric anthocyanins depending

on pH. Since polymeric anthocyanins also contribute to color, bleaching analysis is to be applied,

where 20% potassium metabisulfite bleaches monomeric anthocyanins so that only polymeric

compounds are measured. This determines the percentage contribution by tannins to color.

Anthocyanin concentration was determined in three replicates and calculated using the extinction

coefficient of cyanidin-3-glucoside (26,900). Anthocyanin concentration was specified per both

dry and fresh weights of the product. The analyses were conducted at the facilities of NSAC and

AAFC (Kentville, NS).

Reagents used for the analysis:

i) The acidified solution for extraction was prepared by the mixing of acetone, methanol,

distilled water and formic acid (40:40:20:0.1 by volumes).

ii) The pH 4.5 buffer was prepared as follows: 400 ml of 1M solution of sodium acetate (136 g

of CH3COONa per 1 L of distilled water) was combined with 240 ml 1N solution of HCl

(83,0 ml of concentrated HCL per 1 L of distilled water) and 350 ml of distilled water. The

buffer was adjusted to required pH using 1N HCl or 1N NaOH, the final volume was made to

1 L.

iii) The pH 1.0 buffer was prepared as follow: 125 ml of 0.2N KCl solution (14,6 g of KCl per 1

L of distilled water) was combined with 385 ml of 0.2N HCl solution (100 ml of 1N HCl was

diluted up to 500 ml with distilled water). The buffer was adjusted to required pH using 1N

HCl.

39

iv) The metabisulfite solution must be prepared fresh daily since it becomes yellow over time

and this will contribute to absorbance reading. To prepare a 20% solution, 2 g of potassium

metabisulfite was mixed in 10 ml of 0.1% solution of trifluoroacetic acid (0.1% TFA).

Measurement of anthocyanin concentration was carried out on a microplate reader

(Spectra Max 190, Molecular devices, Menlo Park Calif., U.S.A.). The procedure and the

calculation are adopted from Guisti and Wrolstad (2001).

Procedure for anthocyanin concentration and tannin content analyses:

Anthocyanin analysis:

i) The final volume of microplate wells for anthocyanin analysis was 300 µl. Two plates were

used for analysis: samples in pH 1 buffer and samples in pH 4.5 buffer.

ii) For each analysis, two plates were filled with 290 µl of buffers first (to avoid contamination

of tips) and then 10 µl of samples were added. A multichannel pipettor with appropriate tips

was used. Each sample was analyzed in triplicate.

iii) When not being read, plates were stored in the dark.

iv) Absorbance was read at 520 and 700 nm. The absorbance readings of samples should be

between 0.1 and 1.0. Every plate was read 2 to 3 times to provide good mixing and therefore

more accurate reading.

v) “Softmax Pro” software was used for reading and collecting data, which was then exported

as a text file into Excel spreadsheet.

Polymeric color (bleaching analysis):

i) The final volume of microplate wells for polymeric color analysis was 225 µl. For each

analysis two plates were used: samples in 0.1% TFA (“unbleached”) and samples in 0.1%

TFA with metabisulfite (“bleached”). Sample dilution and layout should be the same for both

plates.

ii) “Unbleached” plates were filled with 215 µl of 0.1% TFA and “bleached” plates were filled

with 190 µl of that (TFA solution was added first to prevent tips contamination). Then 10µl

samples were added in both plates. Finally, 25µl of 20% potassium bisulfate were added to

“bleached” plates. When not being read, plates were stored in the dark.

40

iii) The absorbance was read at 405, 520 and 700 nm. The absorbance readings of samples

should be between 0.1 and 1.0. Every plate was read 2 to 3 times to provide good mixing and

therefore a more accurate reading.

iv) “Softmax Pro” software was used for reading and collecting data, which was exported as a

text file into Excel program file.

Calculations for anthocyanin concentration and tannin content analysis:

Monomeric anthocyanin concentration was calculated as follow:

AMA = (A520nm pH 1.0 – A700nm pH1.0) – (A520nm pH 4.5 – A700nm pH 4.5),

where AMA – is monomeric anthocyanins absorbance;A520nm pH 1.0, A700nm pH1.0 – is

absorbance of the sample in pH 1.0 buffer at 520 and 700 nm wavelength;A520nm pH 4.5, A700nm pH 4.5

– is absorbance of the sample in pH 4.5.0 buffer at 520 and 700 nm wavelength.

= ∙ ∙ 10 ∙ ∙ , where C is the concentration of monomeric anthocyanins, calculated as cyanidin-3-

glucoside (C3G), mg/L;ε – is extinction coefficient, ε = 26900 for C3G;l – is a pathlength,

calculated as follow: = ∙( . ). ∙ − 11.90, Vassay was 0.3 mL which gave a pathway

equal to 0.8486 cm; MW – is a molecular weight, MW = 449.2 for C3G;DF – is a dilution factor,

DF = 30.

Polymeric color (derived tannins)was calculated as follow: = ∙ 100%, where CD – is color density, calculated as CD = [(A520nm – A700nm) + (A405nm – A700nm)] ·

DF; A520nm, A700nm, and A405nm – are absorbance measurements from “unbleached” plate (without

potassium metabisulfite); DF – is a dilution factor, DF = 22.5;CDPC – is polymeric color density,

CDPC=[(A’520nm – A’700nm) + (A’405nm – A’700nm)]·DF; A’520nm , A’700nm, A’405nm are absorbance

measurements from “bleached” plate (with potassium metabisulfite); DF – is a dilution factor,

DF = 22.5.

Polymeric color content represents percentage of derived tanning in total anthocyanin

concentration. This analysis accounts only soluble tannins; insoluble fraction is removed from

the analysis as a result of filtration.

41

2.2.3.2 Particle Size Distribution

Particle size distribution analysis was provided by Agat Laboratories (Calgary, Alberta).

Analysis was done in three replications for blueberry purée pasteurized using HTDT pilot scale

machine and blueberry purée produced using conventional technology (blending followed by

open contact heating up to 95°C).A random sampling of blueberry purée (in 3 replications for

each sample) was used for the particle size analysis.

2.2.4Statistical Methods

The analysis of variance (ANOVA) was applied to analyze the obtained data using SAS

and MiniTab software.

The basic single factor ANOVA model is:

yij = µ + τi + εij,= 1, 2,… ,= 1, 2, … , (1)

Where yij is a response of ith treatment jth replication; µ is an overall mean; τi is the ith

treatment effect; εij is the experimental error, assumed to be distributed normally εij ~ NID (0, σ2);

a is the number of treatments; n is the number of replications.

The statement of hypothesis for ANOVA is:

H0: µ1 = µ2 = … = µa

Ha: at least one µis different.

For performing a ANOVA test three assumptions were checked:

i) Normality.

For the normality assumption to be valid, the error term must be normally distributed.

The normal probability plot of the residuals was generated by MiniTab while running the

ANOVA test. If NID (0, σ2) assumption of error terms is satisfied, the normal probability plot of

residuals looks like a sample from a normal distribution centered at zero. Estimation of normality

is rather subjective; generally the error terms are assumed to be normally distributed if dots on

the plot can be covered by a pen. In case the normality assumption is violated, the ANOVA F-

test is invalid. To induce normality, different types of data transformation may be applied.

ii) Constant variance.

A violation of the constant variance assumption results in inflation of mean square error,

as a result F-value is deflated and a chance to accept the null hypothesis wrongly (type II error) is

42

increased. To check this assumption, a plot of the residuals versus fitted values was used.

Constant variance was assumed in case the plot of residuals versus fits gave the impression of

horizontal band across the top and the bottom of the plot. Data transformation (e.g. log

transformation) can also be used to achieve constant variance.

iii) Independence.

Complete randomization of experiment is supposed to provide independence of collected

data. Violation of this assumption also results in a deflation of the F-value and increasing the

probability of making a type II error. For this study independence assumption was assumed to be

valid through proper randomization.

A significance level for this study was chosen α = 0.05. Results with a p-value less than

0.05 was reported as significantly different (the null hypothesis was rejected, which means that at

least one mean was different). For the multiple means comparison Tukey’s method in SAS was

used.

2.3 Results and Discussion

2.3.1 HTDT Blueberry Purée versus Frozen Blueberry

Blueberry purée processed using the HTDT pilot scale machine TEK-1 was compared

with initial raw material (frozen blueberries). Anthocyanin concentration and tannin content were

measured in order to estimate the changes resulted from blueberry pasteurization and

homogenization. Results of analysis are presented in Table 2.2. Assumptions of normality and

constant variance were met, independence of data is assumed through randomization.

Table 2.2 Results of ANOVA analysis of HTDT blueberry purée vs. frozen berries

Product

Dry weight, %

Anthocyanin concentration,

mg C3G/g Tannins, %

per dry weight per fresh weight

average std

dev

average std

dev

average std

dev

average std

dev

HTDT purée 11.26 (a) 0.37 13.98 (b) 1.18 1.57 (b) 0.09 14.97 (a) 1.73

Frozen berries 12.00 (a) 0.90 17.31 (a) 1.69 2.02 (a) 0.06 9.03 (b) 0.50

43

There was no significant difference in dry matter content which was expected since no

water was added or evaporated during the process. Anthocyanin concentration was significantly

higher in frozen blueberries as compared with THDT blueberry purée. Anthocyanin losses were

19.2% or 22.3% as calculated per dry weight and fresh weight respectively. Tannin content was

significantly higher in the HTDT blueberry purée as compared with fresh blueberries. Tannin

content increased65.8% as a result of heat treatment during HTDT blueberry processing.

2.3.2 HTDT versus Conventional Processing

Blueberry purée processed using the HTDT pilot scale machine was compared with the

purée produced using conventional technology (with the same 1.9oC/min heating rate and 95oC

pasteurization temperature). Anthocyanin concentration and tannin content results are presented

in Table 2.3.Assumptions of normality and constant variance were met, independence of data is

assumed through randomization.

Table 2.3Results of ANOVA analysis of purée produced using HTDT vs. conventional technology

Purée

Dry weight,

g/100g

Anthocyanin concentration,

mg C3G/g Tannins, %

per dry weight per fresh weight

average std

dev average

std

dev average

std

dev average

std

dev

HTDT 11.26 (b) 0.37 13.98 (a) 1.18 1.57 (a) 0.09 14.97 (b) 1.73

Conventional 16.58 (a) 0.52 7.49 (b) 0.37 1.24 (b) 0.02 18.03 (a) 0.21

Significant difference in dry weight was found for blueberry purée prepared using HTDT

and conventional technologies (11.3g/100g and 16.6g/100g respectively), likely due to water loss

from the open heater in conventional purée heating to 95°C. Anthocyanin concentration in

conventional blueberry purée was significantly lower than that in HTDT blueberry purée.

Tannins were significantly higher in blueberries processed using conventional technology.

Taking into consideration the results in Table 2.3, compared with conventional technology

HTDT of blueberry processing provides better anthocyanin retention. However, the conventional

method used (contact heating) does not reflect modern techniques of fruit purée pasteurization

(such as

pasteuriz

R

technolog

Figure 2technolog

P

product (

HTDT p

HTDT al

prepared

5.6%. In

prepared

Informat

better cru

HTDT w

0

1

2

3

4

5

6

7

0.

volu

me,

%HTST meth

zation metho

Results of the

gy is present

.2 Particle sgy

urée prepare

(Fig. 2.2). In

product cont

lso provided

using conve

n the HTDT

using con

ion provided

ushing of ra

was more c

00 1.00

HTDT blu

HTDT is H

hod); differen

od for the com

e particle siz

ted on Fig. 2

size distribu

ed using con

n convention

ained only 2

d finer crushi

entional tech

T purée, 50%

nventional t

d by the par

aw blueberri

consistent a

2.79

ueberry paste

Hydrothermod

nt results m

mparison.

ze distributio

2.2 (error bar

ution in blue

nventional te

nal purée, 75

26% particl

ing to a size

hnology, the

% of the pa

technology

ticle size dis

ies to homo

s compared

7.78 21.69particle dia

Blueber

ynamic techno

44

ight be obta

on in bluebe

rs indicate st

eberry purée

echnology c

5% of partic

es larger th

less than 0.

e amount of

articles were

this media

stribution an

ogeneous sus

d with conv

9 60.52ameter, μm

rry paste (conv

ology

ained in case

erry purée fo

tandard devi

e processed

contained lar

cles were lar

han 0.39 mm

12mm (25%

particles sm

e less than

an characte

nalysis has s

spension. Th

ventional te

168.90 471

ventional techn

e of using ot

or HTDT ver

iation).

by HTDT

rger particles

rger than 0.3

m (seeds and

% of particles

maller than 0

0.27mm, an

eristic size

shown that H

he size of th

echnology th

1.10 1314.00

nology)

ther convent

rsus convent

vs. convent

s than the H

39 mm, whil

d seed parti

s), while in p

0.12mm was

nd for the p

was 0.82

HTDT result

he particles

hat might a

0

tional

tional

tional

HTDT

le the

cles).

purée

s only

purée

mm.

ted in

after

affect

nutritiona

uniform p

2.3.3 HTD

T

blueberry

Canada).

products

Assumpt

through r

Figure 2blueberry

T

(FB, PEI

Son”). N

purée (FP

had mark

as compa

(juice 1)

FW).Ant

compared

0.00

0.50

1.00

1.50

2.00

2.50

Anth

ocya

nins

, mg

C3GE

/g

(FW

)

HTD

al and nutrac

particle size

TDT Blueberr

Triplicate sam

y products

Difference

and the H

tions of norm

randomizatio

2.3 Anthocyy products

The highest a

I Organic Fr

No significan

P) and HTD

kedly lower

ared with fro

had the hi

thocyanin co

d to raw mat

a

0

0

0

0

0

0

FB F

DT is Hydrothe

ceutical valu

of HTDT pu

ry Purée ver

mples of H

(Table 2

in anthocy

HTDT proce

mality and

on.

yanins conc

anthocyanin

ruits and Ber

nt difference

T blueberry

anthocyanin

ozen blueber

ighest antho

oncentration

terials (FB a

b b

P HTDT jui

ermodynamic t

ue of the pro

urée may be

rsus Some C

HTDT blueb

2.1) (purch

anin concen

essed bluebe

constant var

centration in

concentratio

rries Ltd.) a

e in anthocy

purée. Most

n concentrati

rries (2.08 m

ocyanin conc

in jams (jam

and FP): 0.91

c

de

ce 1 juice 2 ju

produ

echnology

45

oduct (Parada

e advantageo

Commercial P

berry purée

hased at

ntration and

erry purée a

riance were

n HTDT b

on was detec

and frozen b

yanin concen

t of the blue

on (0.19, 0.1

mg C3G/g FW

centration am

m 1, jam 2,

1, 0.37, and 0

de d

ice 3 juice 4 s

uct

a and Agulie

ous in variou

Products

was compa

local stor

d tannin co

are illustrat

met, indep

blueberry pu

cted in raw

lueberry pur

ntration was

eberry juices

19, and 0.33

W). Howeve

mong analy

and jam 3)

0.91 mg C3G

e

c

syrup jam 1 j

era, 2007). S

us application

ared with so

res, Truro,

ontent betw

ted in Figur

pendence of

urée and so

materials: fr

rée (FP, “Ja

s found for

s (juice 2, jui

mg C3G/g

er, Van Dyk’

yzed juices

was at least

G/g FW vers

d

c

jam 2 jam 3

Smaller and

ns.

ome comme

Nova Sc

ween comme

res 2.3 and

data is assu

ome comme

frozen bluebe

sper Wyman

frozen blue

ice 3 and jui

FW respecti

’s blueberry

(0.86 mg C

t two times l

sus 2.08 and

more

ercial

cotia,

ercial

d 2.4.

umed

ercial

erries

n and

eberry

ice 4)

ively)

juice

C3G/g

lower

d 1.70

mg C3G

substance

concentra

Significa

compared

Figure 2.

P

anthocya

the comm

products

storage.

A

(HTDT)

Anthocya

there wa

(FP) pro

HTDT p

blueberry

processin

storage

products

0.05.0

10.015.020.025.030.035.040.045.050.0

% T

anni

ns (p

olym

eric

colo

r)

HT

G/g FW resp

es content

ation in this

antly higher

d with studie

.4 Tannin co

olymeric co

anins was low

mercial pro

was consid

Among all r

was charac

anin concen

as no signifi

ocessed with

ilot-scale m

y purée and

ng and stora

conditions

.

e

0000000000000000000000

FB

TDT is Hydrothe

ectively. Th

were found

product (0.

concentratio

ed commerc

ontent in HTD

olor (tannin

wer in raw m

ducts and t

ered as an i

ready-to-eat

cterized by

ntration in th

cant differen

hout thermal

machine. Also

d that of th

age of comm

likely affec

decde

FP HTDT j

ermodynamic t

he lowest an

d in Acadi

04mg C3G/g

on of antho

ial blueberry

DT blueberr

n) content

materials (F

the HTDT b

ndicator of

t processed

the highest

he HTDT bl

nce (at 5%

l treatment

o, no differe

he raw mat

mercial prod

cted anthocy

cde

b

juice 1 juice 2

pro

technology

46

nthocyanin c

ian Maple

g FW) was

cyanins was

y products.

ry purée and

(Fig. 2.4)

B and FP, 8

blueberry pu

anthocyanin

blueberry

anthocyanin

lueberry pur

significance

and blueber

ence was fo

terials (FB

ducts was u

yanin conce

bcbcd

2 juice 3 juice

oduct

concentration

blueberry

50 times les

s detected in

some comm

which refl

8.9% and 9.9

urée. Highe

n oxidation a

products, t

n concentra

rée was com

e level) betw

rry purée (H

ound in the t

and FP). In

unavailable.

entration an

d

a

cd

e 4 syrup jam

n and the h

syrup (syru

ss than that

n HTDT blu

mercial produ

lects oxidat

9% respectiv

er amount o

as a result o

the HTDT

ation (1.57 m

mparable wit

ween frozen

HTDT) proc

tannin conte

nformation

The proces

nd tannin c

de

b

m 1 jam 2 j

highest polym

up): anthocy

in frozen be

ueberry pur

ucts

tion product

vely) than th

of tannins in

of processing

blueberry p

mg C3G/g

th raw mate

n blueberry p

cessed using

ent of the H

on the pre

ssing factors

content in

de

jam 3

meric

yanin

erries.

rée as

ts of

hat in

n the

g and

purée

FW).

erials:

purée

g the

HTDT

vious

s and

these

47

2.4 Conclusion and Recommendations

The results illustrate that HTDT can be used to produce pasteurized blueberry purée with

minimal loss in anthocyanin concentration. The quality of the HTDT blueberry purée (in terms

of anthocyanin concentration, tannin content, and particle size and uniformity) is higher than that

of most commercially available blueberry products. For a better understanding of the benefits of

HTDT for blueberry processing, HTDT purée was also studied in a product shelf-life study

which is presented in Chapter 3. Also results of optimization studies of HTDT blueberry

processing are presented in Chapter 4.

48

3. ANTHOCYANINS AND TANNINS CHANGES DURING STORAGE OF

BLUEBERRY PURÉE

3.1 Introduction

In Chapter 2 it was shown that anthocyanin concentration in the HTDT blueberry purée

was lower as compared with frozen blueberries, likely as a result of thermal processing.

However, significant losses of anthocyanins and increasing of tannin content usually occurs not

only as a result of processing but also during storage of blueberry based products. In this chapter,

the kinetics of anthocyanin degradation and tannin formation is explored in order to develop

recommendations of temperature regimes for storage and to determine shelf-life of the HTDT

blueberry purée.

3.2 Materials and Methods

3.2.1 Materials

Raw materials for this study were provided by PEI Organic Fruit and Berries Ltd. (frozen

berries, harvested in September 2009). Frozen berries were stored in buckets at – 18°C before

processing. The HTDT blueberry purée was processed in September 2009 at the Engineering

Department of the NSAC using the following regimes: temperature of pasteurization 95°C, no

holding time, cavitation mode A up to 70°C, then changed on cavitation mode B up to 95°C,

heating rate 1.9°C/min. Pasteurized product was filled into 250 ml jars and the jars were sealed

(self-pasteurization).Jars with blueberry purée were marked (number of batch, order of filling)

and divided into two groups. One group was stored at +4°C (cold storage facilities, Haley

Institute, NSAC; the temperature was controlled automatically). The second group was stored at

room temperature (20 to 25°C; the temperature was logged every week throughout the

experiment) in the food laboratory (Engineering Department, NSAC). Three replicates were used

in the experiment.

3.2.2. Analytical Methods

Extract preparation, measurement of anthocyanin concentration and polymeric color was

carried out as described in Section 2.2.2.1. The analysis was conducted at the facilities of the

NSAC and the Agriculture and Agri-Food Center (AAFC, Kentville, NS).

49

3.2.3 Statistical Analysis

Repeated measures analysis and non-linear regression analysis were applied for

anthocyanin concentration and tannin content of the blueberry purée stored for 18 months at two

different storage temperatures. Non-linear regression analysis was applied in order to model

anthocyanin degradation during storage and to determine whether or not different storage

temperatures differentially affected the rate of anthocyanin degradation. Repeated measures

analysis was applied to determine if the changes in anthocyanin concentration and tannin content

were significant for the HTDT purée stored for different periods of time.

3.2.3.1 Repeated Measures Analysis

Repeated measures analysis was used as a statistical method to analyze a response taken

on the same experimental unit repeatedly. Experimental design included two response variables:

anthocyanin concentration and tannin content, with storage temperature as a factor. The

advantage of repeated measures analysis is the possibility to analyze the evolution of temperature

effect on the responses over time. Hence, the trends of responses over time are taken into

account.

In the present study, state-of-the-art mixed model methodology was used(Littell et al.

1998).This is the most sophisticated and latest method to analyze repeated measures data, which

addresses directly the covariance structure and uses the MIXED procedure in the SAS system.

Mixed model methodology provides valid standard errors and efficient statistical tests.

Moreover, in contrast to GLM as the older procedure, one missing value does not lead to

rejecting the whole block of data from that experimental unit of the analysis.

There are two basic steps in the mixed model methodology. First is the identification of

the most appropriate covariance structure. Second is the analysis of time trends for treatments by

estimating and comparing means. In modeling the covariance structure, covariance within the

same experimental unit measurement is a concern, since measures on different units are

independent due to randomization. In using PROC MIXED as a repeated measures methodology,

the REPEATED statement is applied to specify the covariance structure.

There are numerous covariance structures available in the PROC MIXED procedure. In

this study the two most common covariance structures were used: Compound Symmetry (CS),

and Unstructured (UN). Covariance structures can be compared by using the goodness of fit

criteria (Akaike information criterion (AIC)) and was used for this study (Littell et al. 1998).

50

Structure with the closest to zero value should be picked. Different covariance structures result in

different standard errors of estimates calculated. The covariance structure with the best fit should

be used; otherwise standard errors calculated might not be the smallest. Also, normality and

constant variance of the error terms should be adhered to. Estimates and significance of the

factors provided by PROC MIXED procedure were manually analyzed further in order to report

letter grouping of means (significance level for letter grouping was chosen α=0.01).Validity of

assumptions (normality of error terms through normal probability plot of residuals, and constant

variance by plotting residuals versus fits) was checked.

3.2.3.2 Non-Linear Regression Analysis

Nonlinear regression analysis was used to analyze the data, which could not be described

by linear models. Nonlinear modeling gives more flexibility in choosing the model and is usually

based on the theory about the mechanism of the analyzed process. That is why the parameters

involved in non-linear models are very often physically meaningful. However, disadvantages of

nonlinear regression analysis are the complexity of the method.

A non-linear regression model for each response yi (i=1, 2, …, n) can be specified as = ( , ) + (2) Where f is an expectation function; εi is disturbance (error term), ~ (0, ). When analyzing a set of data it is considered that the vectors xi, i=1, 2, …, n are fixed and

concentrated on the dependence of the expected response of θ. Using the N-dimensional

prediction vector η(θ) with components ηi(θ)= f(xi, θ),nonlinear regression model can be written

as y = f(x, θ) + ε. The model is considered to be nonlinear if at least one of the derivatives, with

respect to the parameters θ, involves one or more parameters.

Parameters included in the non-linear model cannot be calculated exactly and directly.

Finding parameter estimates requires an iterative algorithm using the non-linear least squares

(NLS) method. The problem of finding the least square estimates can be stated geometrically as a

data vector y, an expectation function f(x, θ) and a set of design vectors x. The first step of NLS

is to find the point ̂on the expectation function which is closest to y and then, the second step is

to determine the parameter vector corresponding to the point ̂ . Both of these steps are very

complicated in the case of non-linear modeling, so an iterative method is used to determine NLS

estimates. The most commonly used algorithm for the NLS parameter estimation is the Gauss-

51

Newton method. This method involves linear approximation to improve iteratively the initial

value of parameter θ0 for θ and continues improving the estimates until there is no change

(change is less than the minimal set difference).

The non-linear model should meet the following assumptions: (i) additive noise (error

terms in the model are additive), (ii) normal distribution of error terms (can be checked by using

normal probability plot of residuals), (iii) constant variance (can be checked by plotting residuals

versus fitted values; in case of constant variance the impression of horizontal band across the top

and the bottom should occur), (iv) independence of successive error terms (can be checked by

plotting residuals versus time order), (v) adequacy of model function (by plotting residuals

versus independent variable) (Bates and Watts, 1988).

To start the iteration process, starting values of parameter estimates should be calculated

and specified. In some cases starting values can be obtained from behavior of the expectation

function in terms of parameters (graphically or analytically). In the case of transformably-linear

models (nonlinear models which can be expressed in a linear form by transforming independent

or response variables, or both) starting values can be found by running a linear regression

analysis. Combination of these two methods can also be used successfully.

According to Ratkowsky (1993), nonlinear modeling should satisfy the following

principles:

i) Parsimony (model should contain as few parameters as possible in order to follow Ockham’s

razor);

ii) Parameterization is used to find the set of parameters which has the best estimation

properties. A correlation matrix can help to see if a model might be potentially simplified and

which set of parameters has the smallest cross correlations. High correlation coefficients

show hidden dependencies since the orthogonality of derivatives cannot be induce.

Correlations above 0.98 reflect redundancy of model parameters and should be investigated

further;

iii) Range of applicability (the data set to which the model is fitted should cover the full range

for which the model applies);

iv) Stochastic specification (the error term needs to be modeled, too. In this report additive error

terms assumption was used for modeling);

v) Interpretability (parameters should be meaningful as much as possible).

52

The principles mentioned above should be taken into account when analyzing

applicability of different models for the same data set. Bates and Watts (1988) suggest that the

scientific reasons should be the first priority in preferring one model over others, and the second

reason is the best fit. If there is no evidence that one of the models describes the mechanism of

the expectation function behavior, then the model with the smallest mean square error and the

most random-looking residuals should be chosen. Minitab statistical software was useful for

graphical presentation of data obtained from the SAS output.

3.3 Results and Discussion

3.3.1 Results of Repeated Measures Analysis

Samples for the analysis were picked in random order. HTDT blueberry purée were

analyzed at day 8, 30, 58, 122, 189, 285, 376, and 546 of storage. Results of the analysis are

presented in Table 3.1.

For the repeated measures analysis holding time during pasteurization for each sample

was used as a covariate factor. In the batch process, it took approximately 50 seconds to fill

every jar, so the total holding time was different from jar to jar. Since every jar with a product

had its unique number throughout the experiment, it was possible to estimate the pasteurization

holding time of the product for each jar and use it in the analysis of covariance (ANCOVA).

53

Table 3.1 Anthocyanin concentration and tannin content during shelf-life of blueberry purée

Time, day

Anthocyanins, mg C3G/g Tannins, % Fresh weight Dry weight

Replication average Replication

average Replication

average #1 #2 #3 #1 #2 #3 #1 #2 #3

Cold storage 0 1.51 1.67 1.54 1.57 13.37 15.34 13.22 13.97 15.02 13.22 16.68 14.97 8 1.42 1.63 1.39 1.48 11.57 13.49 10.84 11.96 15.21 14.01 13.16 14.13 30 1.46 1.38 1.31 1.38 12.08 10.88 10.49 11.15 10.75 14.12 14.15 13.01 58 1.41 1.54 1.52 1.49 11.01 12.33 12.06 11.80 13.15 15.21 15.76 14.71 122 1.28 1.34 1.31 1.31 11.96 12.13 11.75 11.95 13.44 13.40 13.96 13.60 189 1.29 1.34 1.24 1.29 11.79 12.55 11.01 11.78 13.49 13.18 13.29 13.32 285 0.93 1.01 1.19 1.04 7.80 8.35 9.27 8.47 13.34 14.13 13.83 13.77 376 0.58 0.69 0.55 0.61 5.16 6.47 4.93 5.52 19.67 21.07 23.28 21.34 546 0.76 0.86 0.82 0.81 7.00 7.91 7.32 7.41 18.65 22.31 17.85 19.60

Room temperature 0 1.51 1.67 1.54 1.57 13.37 15.34 13.22 13.97 15.02 13.22 16.68 14.97 8 1.41 1.54 1.15 1.36 11.52 12.37 8.76 10.88 14.17 13.55 14.43 14.05 30 1.30 1.24 1.46 1.33 10.69 9.72 11.55 10.65 14.36 14.43 14.43 14.41 58 1.15 1.18 1.04 1.12 9.10 9.47 8.05 8.87 17.02 18.72 15.09 16.94 122 1.02 1.00 1.12 1.05 9.35 9.08 10.11 9.51 16.37 17.93 16.71 17.00 189 0.78 0.84 0.83 0.82 7.11 7.73 7.37 7.40 19.61 16.40 18.12 18.04 285 0.63 0.58 0.69 0.63 5.08 4.70 5.34 5.04 22.01 24.27 22.21 22.83 376 0.33 0.36 0.28 0.32 3.09 3.18 2.55 2.94 37.60 35.75 40.64 38.00 546 0.30 0.26 0.30 0.29 2.80 2.33 2.72 2.62 38.18 39.61 37.62 38.47

For the repeated measures analysis holding time for each sample was used as a covariate

factor. During the experiment, it took approximately 50 seconds to fill every jar, so the total

holding time was changed from jar to jar in the batch process. Since every jar with a product had

its unique number throughout the experiment, it was possible to estimate the holding time of the

product for each jar and use it in the analysis of covariance (ANCOVA).

For choosing the best covariance structure results of goodness of fit analysis using

Akaike information criterion (AIC) were compared as presented in Table 3.2. Covariance

structures were chosen based on the value of AIC (the closest to zero is preferable).

54

Table 3.2 Results of Akaike information criterion

Anthocyanins Tannins

per fresh weight per dry weight

Unstructured (UN) 15.1 188.7 225.9

Compound symmetry (CS) – 54.9 120.8 149.0

The analysis of the results presented in Table 3.2 resulted in a decision to use

unstructured covariance for the repeated analysis of anthocyanin concentration calculated per

fresh weight and compound symmetry covariate structure for the analysis of tannins and

anthocyanin concentration calculated per dry weight.

The assumption of normality was met for all response variables. The assumption of

constant variance was met for tannins and partially violated for both anthocyanins responses so

different types of transformation (square root, cubic root, reciprocal, and logarithmic) were

applied to the data in order to achieve constant variance. However, it was not possible to induce

constant variance and satisfy normality assumption. Non-transformed data was analyzed using

the PROC MIXED procedure in SAS statistical application (Table 3.3).

Table 3.3 Significance of the factors for anthocyanins and tannins repeated analysis

Effect

p-value Anthocyanins

Tannins

per fresh weight

per dry weight

Storage temperature <0.0001 <0.0001 0.0002 Storage time <0.0001 <0.0001 <0.0001 Storage temperature*Storage time <0.0001 <0.0001 0.0056 Pasteurization holding time (covariate) <0.0001 0.0045 <0.0001

Both storage temperature and storage time significantly affects the levels of anthocyanins

and tannins in the HTDT blueberry purée. Holding time used for ANCOVA was determined to

be significant, affecting anthocyanin concentration and tannin content. A significant interaction

effect of time and storage temperature was also detected; multiple means comparison procedure

was done for the interaction effect. Mean estimates with letter grouping are listed in Table 3.4.

55

Table 3.4 Mean estimates and letter grouping for anthocyanins and tannins data

Temperature regime

Time, day

Anthocyanins, mgC3G/g Tannins, %

per fresh weight per dry weight

Estimate Letter grouping

Estimate Letter grouping

Estimate Letter grouping

Cold storage 0 1.58 a 14.07 a 14.84 ef Cold storage 8 1.47 ab 11.90 ac 14.22 ef Cold storage 30 1.42 b 11.46 bc 12.55 f Cold storage 58 1.45 ab 13.08 ab 14.29 ef Cold storage 122 1.30 b 11.89 bc 13.69 f Cold storage 189 1.29 c 11.76 bc 13.35 f Cold storage 285 1.01 c 8.24 ef 14.12 f Cold storage 376 0.63 e 5.16 g 21.11 bc Cold storage 546 0.81 d 7.22 f 19.63 cd Room temperature 0 1.58 a 14.07 a 14.83 ef Room temperature 8 1.37 b 10.89 cd 14.04 f Room temperature 30 1.37 b 10.94 cd 13.97 f Room temperature 58 1.11 c 8.77 ef 17.10 de Room temperature 122 1.03 c 9.43 de 17.13 de Room temperature 189 0.81 d 7.32 f 18.17 d Room temperature 285 0.61 e 4.87 gh 23.08 b Room temperature 376 0.35 f 3.12 hi 37.73 a Room temperature 546 0.29 f 2.62 i 38.46 a

The results of the analysis are presented graphically in Figures 3.1 to 3.3.It follows that

storage time negatively affects

anthocyanin concentration. There

is a significant drop in anthocyanin

concentration after 16 months of

storage at both temperatures. Cold

storage at 4°C provided more

favorable conditions for

anthocyanin retention with no

significant difference after 2

months. However, storage up to 6

months resulted in moderate losses

in anthocyanins (18.4% as

calculated per fresh weight; 16.4% as calculated per dry weight). At the same time, storage at

6005004003002001000

16

14

12

10

8

6

4

2

storage time, days

anth

ocya

nin

conc

entr

atio

n, m

g C3

G/g

DW

cold storageroom temperature

temperature

aa

bcbc

ab

bc bc

ef

gf

cd cd

ef

de

f

gh

hi i

Figure 3.1 Interaction plot of anthocyanins, mgC3G/gDW versus time, days

56

room temperature resulted in significant losses of anthocyanins even in a short period of time. In

two months of room temperature

storage product lost 29.7% of

initial amount of anthocyanins as

calculated per fresh weight or

37.7% as calculated per dry weight.

The amount of tannins

during cold storage (4°C) did not

change significantly during 9

months of product storage. This

fact supports initial assumption that

color and taste (grainy texture) of

the product will not be significantly

affected during 9 months of cold

storage. There were no significant

changes in tannin content within

four months of storage at room

temperature; however after four

months, noticeable increase in

tannins was observed.

3.3.2 Results of Non-Linear Regression Analysis

For the non-linear regression analysis, the estimates of anthocyanin concentration and

tannin content obtained in the repeated measures analysis were used.

3.3.2.1 Anthocyanins

Kinetics of anthocyanin degradation may be expressed using first-order exponential

model (Equation3) (Wang, 2007): ( ) = ∙ (3)

6005004003002001000

1.6

1.4

1.2

1.0

0.8

0.6

0.4

0.2

storage time, days

anth

ocya

nin

conc

entr

atio

n, m

g C3

G/g

FW

cold storageroom temperature

temperature

a

abb ab

b b

c

e

d

a

bb

cc

d

e

ff

Figure 3.2 Interaction plot of anthocyanins, mgC3G/g FW versus time, days

6005004003002001000

40

35

30

25

20

15

10

storage time, days

tann

ins,

%

cold storageroom temperature

temperature

efef f ef f f f

bccd

eff f

de ded

b

aa

Figure 3.3 Interaction plot of tannins, % versus time, days

57

Where C0 is the initial anthocyanin concentration, k is the temperature-dependent rate

constant, t is time (days).

Accordingly, the following expectation function for modeling the process of anthocyanin

degradation was used: ( , ) = ∙ ∙ (4) Where the response ( , ) is anthocyanin concentration; is C0, the initial anthocyanin

concentration; is k, the temperature-dependent rate constant, x is t, time (days).

This model was used for both anthocyanin concentration calculated per fresh and dry

weight. The starting values were obtained through the interpretation of the expectation function

behavior ( ) and following the transformation of the expectation function to obtain linear

behavior ( ). Based on the analysis of the Fig.3.1 and 3.2, a starting value of = 1.6 mgC3G/g

FW and =14.5mgC3G/g DW was determined for cold storage and room temperature storage

respectively. The following transformation of the expectation function y = θ ∙ e θ ∙ (Equations

5a – 5c) was used to obtain linearity: = (− ), (5a) ( ) = − , (5b)

where ∗ = ; ∗ = − (5c)

Coefficients ∗ for anthocyanin concentration for both cold storage and room

temperature storage were obtained by the linear regression analysis in MiniTab. That allowed us

to come up with the starting values for and for both room temperature and cold storage (Table

3.5).

Table3.5 Starting values for anthocyanin concentration non-linear modeling

Cold storage Room temperature

Anthocyanins, per fresh weight 1.6 mgC3G/g FW –0.00148 1.6 mgC3G/g FW –0.00304

Anthocyanins, per dry weight 14.5mgC3G/g DW – 0.00149 14.5mgC3G/g DW –0.00321

Obtained starting values were used in the PROC NLIN procedure (SAS) (the results are

presented in Table 3.6.) The convergence criterion for both temperatures was met.

58

Table 3.6 Parameter estimates for anthocyanin degradation during HTDT purée storage

Kinetic model coefficient

Parameter of the expectation function

Parameter estimates Anthocyanins, mgC3G/g DW Anthocyanins, mgC3G/g FW

Cold storage

Room temperature

Cold storage Room

temperature C0 13.26 12.31 1.544 1.4826

k 1.46·10-3 3.14·10-3 1.51·10-3 3.33·10-3

The results are presented graphically in figures 3.4 which show measured values and

fitted lines.

6005004003002001000

14

12

10

8

6

4

2

time, days

anth

ocya

nins

, mgC

3G/g

DW

fittedobserved

y=13.26*exp(-0.00146*time)

a)

6005004003002001000

1.6

1.2

0.8

0.4

0.0

time, days

anth

ocya

nins

, mgC

3G/g

FW

fittedobserved

y=1.5441*exp(-0.00151*time)

c)

6005004003002001000

14

12

10

8

6

4

2

time, days

anth

ocya

nins

, mgC

3G/g

DW

fittedobserved

y=12.31*exp(-0.00314*time)

b)

6005004003002001000

1.6

1.4

1.2

1.0

0.8

0.6

0.4

0.2

0.0

time, days

anth

ocya

nins

, mgC

3G/g

FW

fittedobserved

y=1.4826*exp(-0.00333*time)

d)

Figure 3.4 a) Kinetics of anthocyanin degradation (per DW, cold storage); b) Kinetics of anthocyanin degradation (per DW, room temperature); c) Kinetics of anthocyanin degradation (per FW, cold storage); d) Kinetics of anthocyanindegradation (per FW, room temperature)

59

In order to find if the parameters in the two models (for anthocyanin degradation at room

temperature (rt) and during cold storage (cs)) are significantly different, the incremental

parameters method was used.

The following model was fitted using the PROC NLIN procedure in SAS: ( , , ) = ( + ) ∙ ( )∙ (6) Where x1=0 for cold storage, x2=1 for room temperature; is an incremental parameter

for due to the change in treatment (cold storage compared to room temperature); is an

incremental parameter for due to the change in treatment.

It means that coefficient for cold storage is = + = , for room

temperature is = + = + . The same relationship is used for the rate constant

coefficient: coefficient for cold storage is = + = , for room temperature is = + = + . If the null hypothesis is accepted and = 0, there is no significant

difference between and . Since the PROC NLIN procedure does not allow one to estimate

the parameters exactly and hence does not provide the results of t-test, an approximate 95%

confidence interval of parameter estimates ( and ) is used to find whether or not the

differences between the parameters in the models for two different storage regimes are

significant. If the 95% confidence interval contains 0, the difference is not significant. Results of

this analysis are presented in Table 3.7.

Table 3.7 Incremental parameters estimates and significance of the difference for the model parameters (anthocyanin concentration)

Kinetic

model

coefficient

Parameter

of the

expectation

function

Parameter estimates Approximate 95%

CI for the

incremental

parameter φ

Significance Cold

storage

Room

temperature

Anthocyanin concentration, mg C3G/g of dry weight

C0 13.26 12.31 (-3.142; 1.238) not significant

k 1.46·10-3 3.14·10-3 (0.00035; 0.00301) significant

Anthocyanin concentration, mg C3G/g of fresh weight

C0 1.544 1.4826 (-0.2307; 0.1077) not significant

k 1.51·10-3 3.33·10-3 (0.00093; 0.00272) significant

60

The difference between the rate constants ( and parameters) is significant. The

parameter estimates of and (initial anthocyanin concentration) do not differ significantly

from each other for both anthocyanin concentration calculated per dry weight and fresh weight.

The normality and constant variance assumptions were checked and found to be valid for

both models. The plots of residuals versus the independent variable (time) allowed to conclude

that the model is adequate (information is not presented in this study).

The analysis of Figures 3.4 – 3.7 and the comparison of the rate constant show that the

rate of anthocyanin loss during cold storage is less as compared with storage at room

temperature. At room temperature, the kinetic constant of anthocyanin degradation is almost

twice as high as during the cold storage (3.14·10-3vs. 1.46·10-3 for anthocyanin concentration per

DW and 3.33·10-3vs. 1.51·10-3 for anthocyanin concentration per FW respectively). Fitted

models of anthocyanin loss can be used to predict anthocyanin concentration for the particular

period of storage for any specified temperature.

3.3.2.2 Tannins

There is no background information which describes the kinetics of changes in tannin

content during the storage of blueberry based products. However, it is known that anthocyanins

are a substrate for the condensation reaction which results in tannin formation (Brownmiller,

2008). Analysis of the graphs (Fig.3.3) allows one to suggest using the logistic growth model as

a prediction function for describing kinetics of tannin formation during blueberry purée storage: ( ) = + 1 + exp(− )(7) Where C is an amount of tannins, % ; t is time, days; is an initial amount of tannins;

is the difference between the asymptote and the initial amount of tannins, is the time to half

the asymptote, is the time interval between about ¾ the asymptote and half the asymptote.

The expectation function has the following form: ( , ) = + 1 + exp(− )(8) The starting values were obtained through interpretation of the expectation function

behavior ( and ) and following transformation of the expectation function to obtain linear

behavior ( and ). Based on the analysis of Fig.3.3, starting values of = 12% were

61

determined for both cold storage and room temperature storage, while = 10% and =28%

were obtained for cold storage and room temperature storage respectively.

The following transformation of the expectation function y = + ( ) was used

to obtain linearity:

− − 1 = − − (9a) − − 1 = − (9b)

Where ∗ = − 1 ; ∗ = ; ∗ = − .

Coefficients ∗ and ∗ were obtained by the linear regression analysis in MiniTab, which

allowed us to estimate the starting values for parameters and using the ratios specified

above. Results of the calculations are presented in Table 3.8.

Table 3.8 Starting values of parameters in non-linear modeling of tannin changes

Storage regime

Starting values

obtained graphically obtained from the expectation function transformation

Cold storage 12% 10% 350 days 20 days 315 days 161 days

Room temperature 12% 28% 300 days 10 days 252 days 97 days

The obtained starting values were used in the NLIN procedure in SAS statistical software

in order to calculate parameter estimates (Table 3.9). For both temperature regimes the

convergence criterion was met.

62

Table 3.9 Parameter estimates for the increase in tannin content during HTDT purée storage

Storage regime Parameter estimates

Cold storage 13.82% 6.55% 330.6 days 15.276 days

Room temperature 15.77% 23.13% 304.9days 28.17 days

Starting values for the parameter estimates obtained by graphical analysis of data

behavior was more accurate than that from the expectation function transformation (Tables 3.8

and 3.9).

Fig.3.5a illustrates the kinetics of tannin increase in blueberry HTDT purée during cold

storage. Fig. 3.5b represents the kinetics of tannin increase in blueberry HTDT purée during

storage at room temperature.

To determine the differences between kinetics parameters for tannin development at

room temperature (rt) and cold storage (cs), the incremental parameters method was used.

The following model was used for fitting (NLIN in SAS): ( , , ) = ( + ) + ( + )1 + exp(− ( )( ) )

(10)

Figure 3.5 a) Kinetics of tannins (cold storage); b)Kinetics of tannins (at room temperature)

6005004003002001000

40

35

30

25

20

15

time, days

tann

ins,

%

fitted lineobserved values

a) 6005004003002001000

40

35

30

25

20

15

time, days

tann

ins,

%

fittedobserved

b)

63

Where x1=0 for cold storage, x2=1 for room temperature; is an increment in the

parameter due to the change in treatment (cold storage compared to room temperature); , , are increments in the parameters , , due to the change in treatment respectively.

The coefficient for cold storage is = + = and coefficient for room

temperature is = + = + . If the null hypothesis is accepted and = 0, there

is no significant difference between and . The same relationship was used for the other

parameters. Since the NLIN procedure does not allow one to estimate the parameters exactly and

hence does not provide the results of the t-test, approximate 95% confidence intervals of

parameter estimates were used to find whether or not the difference between the parameters is

significant. If the 95% confidence interval contains 0, the difference is assumed to not be

significant (results of the analysis are presented in Table 3.10).

Table 3.10 Incremental parameters estimates and significance of the difference for the model parameters (tannins)

Parameter of the expectation function

Parameter estimates Approximate 95% CI for the

incremental parameter φ

Significance Cold storage

Room temperatu

re

initial tannins 13.82% 15.77% (-0.388; 3.716) not significant

difference between asymptote and initial tannins

6.55% 23.13% (12.348; 19.004) significant

time to half asymptote 331 days 305 days (0.627; 0.983) significant

interval between ¾ and half asymptote

15 days 28 days (0.0241; 0.1963) significant

It follows that the parameter estimates of and (initial tannin content) did not

differ significantly from each other. Other parameters were found significantly different for the

two storage regimes (storage at room temperature and at 4°C). Total tannin content ( ) was

significantly higher at room temperature (6.6% versus 23.1%), and half the total tannin content

( ) was reached significantly faster (304 days versus 330 days) at room temperature storage as

compared to cold storage. The normality and constant variance assumptions were checked and

found to be valid for both temperature regimes. The general impression from plots of residuals

64

versus independent variables (time) allowed one to conclude that the model was adequate (data

not shown).The models for tannin formation can be used to predict tannin content for the

particular period of storage at room temperature or in cold storage conditions.

3.4 Conclusion and Recommendations

Cold storage at 4°C is preferable in terms of better preserve of anthocyanins and should

be recommended for the HTDT blueberry purée storage. The rate of anthocyanin degradation

and tannin formation at room temperature was twice as high as that at 4°C (Tables 3.7 and 3.10,

Fig. 3.4 – 3.9). For anthocyanin concentration, storage up to 6 months at 4°Cis equivalent to 2

months at room temperature and can be recommended as a shelf-life period for HTDT blueberry

purée. Fitted models, described in this work, can be used to predict anthocyanin concentration

and tannin content for different periods of storage at room temperature and at 4°C.For better

understanding of the HTDT processing factors effect on blueberry anthocyanins, tannins and

microbial load, optimization studies was conducted (results are presented in Chapter 4).

65

4. PROCESS OPTIMIZATION

4.1 Introduction

This chapter is devoted to the process of optimization of HTDT blueberry processing in

order to maximize anthocyanin concentration, minimize tannin content and ensure food safety.

The first step in the optimization process is screening of the most significant process factors.

Four potentially significant parameters were chosen for this study: (i) temperature of

pasteurization, (ii) holding time, (iii) rate of product heating, and (iv) cavitation mode of the

HTDT pilot-scale machine. The second step of the optimization process involved response

surface methodology (multiple response analysis) to determine the set of processing parameters

to provide a high quality of the product.

4.2 Materials and Methods

4.2.1 Materials

Raw materials for this study were provided by PEI Organic Fruit and Berries Ltd. (frozen

berries, harvested in September 2009). Frozen berries were stored in buckets at – 18°C before

processing. The HTDT blueberry purée was produced in September 2009 at the Engineering

Department of the NSAC. The pasteurized product was filled into 250 ml jars and the jars were

sealed (self-pasteurization).Jars containing HTDT blueberry purée were labeled (number of

batch, order of filling) and stored at +4°C (cold room, Haley Institute) prior to the analysis. Only

the first 5 jars from each batch were used for the analysis (to exclude the effect of prolonged

holding time for the jars filled at the end of the filling process).

4.2.2. Analytical Methods

4.2.2.1 Measurement of Anthocyanin Concentration and Polymeric color Content (Tannins)

The measurement of anthocyanin concentration and polymeric color content (derived

tannins) was done as described in Section 2.2.2.1. The analysis was conducted at the facilities of

the NSAC.

4.2.2.2 Microbial Analysis

The aerobic plate count analysis was performed for the pasteurized blueberry purée and

the raw material (frozen blueberries after thawing). Subsamples of the blueberry product/

66

material (approximately 10g) were aseptically transferred into sterile plastic bags with inner

filters, diluted with buffered peptone water in a 1:10 ratio, and mixed for 2 minutes in a

stomacher. The series of decimal dilutions were performed by transferring 10 ml of inoculate

into 90 ml of sterile buffered peptone water. All dilution samples (1 ml) were aseptically

inoculated into labeled Petrifilm™ plates and were incubated for 48 hours at 30°C. Duplicate

plates were used for each dilution. If no colonies were detected at a plate, the result was reported

as “less than one per plate”.

4.2.3 Statistical Analysis and Experimental Design

The unreplicated 2k factorial design is practical and useful if the significance of two or

more factors needs to be investigated. This type of experimental design suits well to the

sequential experimental approach and can be used in the early stages because it provides the

smallest number of runs for studying k factors in full factorial design. In 2k factorial design it is

assumed that (i) all factors are fixed; (ii) the design is completely randomized to provide

independence, and (iii) normality and constant variance assumptions are satisfied. To achieve

independence, the sequence of runs was completely randomized using the Random Data feature

by MiniTab software.

4.2.3.1 Screening of Processing Factors

For the determination of the significance of the processing factors a 24 factorial design

with four factors on two levels each: (i) temperature of pasteurization, °C, (ii) holding time, min,

(iii) heating rate, °C/min, and (iv) cavitation mode was used (Table 4.1).

Table 4.1 Levels of factors for 24 factorial design

Factor Level

– +

Temperature of pasteurization 85°C 95°C

Holding time 0 min 5 min

Heating rate 0.9 °C/min 1.7 °C/min

Cavitation mode A A+B

67

The temperature was controlled automatically by two thermocouples and the results were

analyzed in real-time by the LabView 8.5 software (National Instruments). The holding time of

pasteurization was provided by the start-stop regime of the motor, keeping the temperature of

pasteurization at ± 0.2°C. The heating rate was regulated by cooling with cold water through the

cooling jacket of the TEK-1processor. The cavitation mode was kept at A for the low level and

was changed to B for the period of the last 10°C of heating for the high level (A+B).

Each treatment combination was used in a single replication. The responses were: (i)

anthocyanin concentration, (ii) polymeric color (tannins) content and (iii) aerobic plate count

(APC).

The statistical model for a replicated 24 factorial design is:

(11)

Where ijklmy is a total response from the ith, jth, kth, lth factors and the mth replication; μ is

the overall mean; iα , jβ , kγ , lδ are the main effects; ij)(αβ , ik)(αγ , jk)(βγ , il)(αδ , jl)(βδ , kl)(γδ

represent 2-way interaction effects; ijk)(αβγ , ijl)(αβδ , ikl)(αγδ , jkl)(βγδ represents 3-way

interaction effects; ijkl)(αβγδ represents 4-way interaction effects; ijklmε represents experimental

error terms.

In the unreplicated factorial design, with only one replicate, there is no estimate of error

ijklmε. Therefore, the statistical model of the 24unreplicated factorial design is:

ijkljkliklklijljlil

lijkjkikkijjiijklmy

)()()()()()()(

)()()()(

αβγδβγδαγδγδαβδβδαδδαβγβγαγγαββαμ

+++++++

+++++++++= (12)

Where ijklmy is a total response from the ith, jth, kth, lth factors; μ is the overall mean; iα is

an effect of the ith level of the temperature of pasteurization; jβ is an effect of the jth level of the

holding time; kγ is an effect of the kth level of the heating rate; lδ is an effect of the lth level of the

i = 1, 2

j = 1, 2

k= 1, 2

l = 1, 2

m=1, 2,…n

i = 1, 2

j = 1, 2

k= 1, 2

l = 1, 2

ijklmijkljkliklklijljl

illijkjkikkijjiijklmy

εαβγδβγδαγδγδαβδβδαδδαβγβγαγγαββαμ

++++++++

+++++++++=

)()()()()()(

)()()()()(

68

cavitation mode; ij)(αβ represents an interaction effect of the interaction between the

temperature and the holding time; ik)(αγ represents an interaction effect between the temperature

and the heating rate; jk)(βγ represents an interaction effect between the holding time and the

heating rate; il)(αδ represents an interaction effect between the temperature and the cavitation

mode; jl)(βδ represents an interaction effect between the holding time and the cavitation mode;

kl)(γδ represents an interaction effect between the heating rate and the cavitation mode; ijk)(αβγ

represents a 3-way interaction effect between the temperature, the holding time and the heating

rate; ijl)(αβδ represents a 3-way interaction effect between the temperature, the holding time and

the cavitation mode; ikl)(αγδ represents a 3-way interaction effect between the temperature, the

heating rate and the cavitation mode; jkl)(βγδ represents a 3-way interaction effect between the

holding time, the heating rate and the cavitation mode; ijkl)(αβγδ represents a 4-way interaction

effect between the temperature, the holding time, the heating rate and the cavitation mode.

Hypotheses were stated as follow (Table 4.2):

Table 4.2 Statement of the hypotheses for a 4 factor unreplicated factorial design

Main effects Two-way interaction Three way interaction Four-way

H0: α1 =α2 = 0

Ha: at least one α≠0

H0: (αβ)ij = 0 for all i, j

Ha: at least one (αβ)ij ≠0

H0: (αβγ)ijk = 0 for all i, j, k

Ha: at least one (αβγ)ijk ≠0

H0: (αβγδ)ijkl = 0

for all i, j, k, l

Ha: at least one

(αβγδ)ijkl ≠0

H0: β1 =β2 =0

Ha: at least one β≠0

H0: (αγ)ik = 0 for all i, k

Ha: at least one (αγ)ik ≠0

H0: (αβδ)ijl = 0 for all i, j, l

Ha: at least one (αβδ)ijl ≠0

H0: γ1 =γ2 =0

Ha: at least one γ≠0

H0: (βγ)jk = 0 for all j, k

Ha: at least one (βγ)jk ≠0

H0: (αγδ)ikl = 0 for all i, k, l

Ha: at least one (αγδ)ikl ≠0

H0: δ1 =δ2 =0

Ha: at least one δ≠0

H0: (αδ)il = 0 for all i, l

Ha: at least one (αδ)il ≠0

H0: (βγδ)jkl = 0 for all j, k, l

Ha: at least one (βγδ)jkl ≠0

H0: (βδ)jl = 0 for all j, l

Ha: at least one (βδ)jl ≠0

H0: (γδ)kl = 0 for all k, l

Ha: at least one (γδ)kl ≠0

69

Due to the lack of replication there is no pure error in the unreplicated design. Hence, one

of the approaches to conduct ANOVA is to assume that the highest order interaction is negligible

and to use its mean squares to estimate the error. This reduction of the model is often possible

due to the “sparsity of effects principle”; that is, that most systems are dominated by the main

effects and the low-order interaction effects, and in most cases the high-order interaction effects

are negligible. The second approach is the collapsing of the model, which is possible in case one

of the factors (the main effect and all interaction effects) is not significant. In this case, two

levels of this factor can be considered as replicates and the ANOVA analysis might be applied.

For performing the ANOVA test, the assumptions of normality, the constant variance and

independence were checked. To check the normal distribution of error terms, normal probability

plots of residuals were generated and analyzed. In order to check the assumption of constant

variance, plots of residuals versus fitted values were analyzed. Independence was assumed due to

complete randomization and checked by using the autocorrelation function incorporated into the

MiniTab software. Another approach of analyzing data from unreplicated designs that doesn’t

require error degrees of freedom for ANOVA is based on the normal probability plot of the

estimates of the effects. This approach was initially developed by Daniel (1959) to detect active

effects. MiniTab software allowed performing Daniel’s plot with incorporated Lenth’s test

(Astatkie et al., 2006; Lenth, 1989) which used the examination of pseudo standard errors to

present the significance of effects.

4.2.3.2 Process Optimization

For further investigation on the effect of processing factors on the HTDT blueberry purée

quality and for determining the optimal level for the factors, the response surface methodology

(RSM) was used. RSM enables optimization of the response, affected by several process

variables, by using a set of mathematical and statistical techniques. The problem of optimization

assumes that there is a curvature in the system which can be represented as a second order

model:

= + + + + (13) Where y is a response, β0, βi are model parameters, xi represent process variables.

70

In this experiment, the results of the factor screening from the 24 unreplicated factorial

design were used. Since the cavitation mode did not affect the response variables, and taking into

account the fact that using a maximum heating rate provides the best energy efficiency of the

process, only two process variables were included into the optimization problem: (i) the

temperature of pasteurization, °C and (ii) the holding time, min. In this particular case the

second-order polynomial model is: = + + + + + (14) where , , , , , are model parameters, represents the holding time,

representsthe temperature of pasteurization, and represent the quadratic components of the

model, represents the interaction between the temperature and the holding time.

A central composite design (CCD) with 2 variables at 5 levels each (Table 4.1) was used.

The response variables studied were: (i) anthocyanin concentration, mg C3G/g of dry weight; (ii)

polymeric color (tannins, %); and microbial load (aerobic plate count, cfu/g). Optimization for

these multiple responses included the maximizing anthocyanin concentration and minimizing

polymeric color (tannins). At the same time, the microbial load was taken into account as a

constraint. For data analysis, the RSREG procedure of the SAS software, as well as the Minitab

software were used to obtain predictive models. Optimization of the independent variables was

conducted by employing canonical analysis (the SAS software). The assumptions of the

normality and constant variance were checked. When the results showed a saddle point in

response surfaces, the ridge analysis of the SAS RSREG procedure was used to compute the

estimated ridge of the optimum response. The contour plots for three response variables, as well

as overlaid contour plots, were generated using the Minitab software.

4.3 Results and Discussion

4.3.1 Processing Factors Screening

The unreplicated experimental design for the different combinations of treatments and the

values of response variables are shown in the Table 4.3.

71

Table 4.3 Results of the unreplicated 24 experimental design N

umbe

r Factor

Ant

hocy

anin

s, m

gC3G

/gD

W

Tan

nins

, %

AP

C, C

FU

/g

Level (coded) Level (uncoded) T

empe

ratu

re

Hol

ding

tim

e

Hea

ting

rat

e

Cav

itat

ion

mod

e

Tem

pera

ture

, °C

Hol

ding

tim

e, m

in

Hea

ting

rat

e, °

C/m

in

Cav

itat

ion

mod

e

1 – – – – 85 0 0.9 A 10.53 15.04 20 2 + – – – 95 0 0.9 A 9.69 15.04 <10 3 – + – – 85 5 0.9 A 9.76 15.57 25 4 + + – – 95 5 0.9 A 8.86 16.83 <10 5 – – + – 85 0 1.7 A 11.05 14.14 35 6 + – + – 95 0 1.7 A 10.57 15.01 <10 7 – + + – 85 5 1.7 A 10.88 14.64 <10 8 + + + – 95 5 1.7 A 10.14 16.46 <10 9 – – – + 85 0 0.9 A+B 10.89 14.23 15 10 + – – + 95 0 0.9 A+B 9.55 16.14 <10 11 – + – + 85 5 0.9 A+B 10.59 15.37 <10 12 + + – + 95 5 0.9 A+B 8.58 18.97 <10 13 – – + + 85 0 1.7 A+B 11.37 13.85 307.5 14 + – + + 95 0 1.7 A+B 11.34 14.14 5 15 – + + + 85 5 1.7 A+B 10.82 15.75 40 16 + + + + 95 5 1.7 A+B 9.52 15.18 <10

4.3.1.1 Anthocyanins

To determine the effect of the

processing factors (temperature of

pasteurization, holding time, heating rate

and cavitation mode) on anthocyanin

concentration (estimated as mg C3G/g

DW), Daniel’s plot (normal plot of the

effects) with incorporated Lenth’s test

was performed (Figure 4.1).

The analysis of Daniel’s plot

shows that the temperature of

1.00.50.0-0.5-1.0

99

95

90

80

70

6050

40

30

20

10

5

1

Effect

Perc

ent

A Temperature, CB Holding time, minC Heating rate, C /minD C av itation mode

Factor Name

Not SignificantSignificant

Effect Type

C

B

A

Lenth's PSE = 0.28125

o

o

Figure 4.1 Normal plot of the effects (response is anthocyanin concentration, mg C3G/g DW, α = 0.05)

72

pasteurization, the holding time and the heating rate affects anthocyanin concentration

significantly. No interaction effects were observed nor was there an effect of the cavitation

mode. This fact allows one to collapse the model and consider two levels of factor D (cavitation

mode) to be replicates. In this case, the design can be analyzed as a three factor factorial with

two replications using ANOVA. The normality and constant variance assumptions were checked

and found to be valid. The model was found to be adequate based on the general impression from

the plots of residuals versus the independent variable (time).The complete randomization and the

results of the autocorrelation function analysis provided enough evidence to assume

independence. The results of the ANOVA test for anthocyanins with two levels of factor D

(cavitation mode) used as replicates are shown as table 4.4.

Table 4.4 Results of ANOVA test for anthocyanins

Treatment combination p-value

Temperature of pasteurization, °C (A) 0.001 Holding time, min (B) 0.003 Heating rate, °C/min (C) 0.001 Temperature * Holding time (A*B) 0.149 Temperature * Heating rate (A*C) 0.110 Holding time * Heating rate (B*C) 0.945 Temperature * Holding time * Heating rate (A*B*C) 0.587

The adjusted R2 is 82.67%,

which means that 82.67% of the total

variability of the system is explained by

the factors chosen for the experiment

(temperature of pasteurization, holding

time and heating rate).

The main effects of the

temperature of pasteurization, the

holding time and the heating rate are

presented in Figure 4.2.Taking into

account the results of the ANOVA test

it was possible to conclude that the

9585

10.6

10.4

10.2

10.0

9.8

50

1.70.9

10.6

10.4

10.2

10.0

9.8

Temperature, C

Ant

hocy

anin

mea

n, m

g C3

G/g

DW

Holding t ime, min

Heating rate, C/min

o

o

Figure 4.2 Main effects plot for anthocyanin concentration, mg C3G/g DW

73

temperature of pasteurization, the holding time and the heating rate affected the anthocyanin

concentration in the pasteurized HTDT blueberry purée. The cavitation mode as well as all two-

and three- way interaction effects did not affect anthocyanin concentration. To conclude which

level of these three factors is preferable to achieve higher response (concentration of

anthocyanins in the product) main effect plots were analyzed. A low level of factor A

(temperature of pasteurization is 85 °C), a low level of factor B (holding time is 0 min) and a

high level of factor C (heating rate is 1.7 °C/min) provided a higher anthocyanin concentration in

the HTDT blueberry purée.

4.3.1.2 Tannins

Daniel’s plot for the effect of

the processing factors on the polymeric

color content (tannins) is presented in

Figure 4.3.

The analysis of Daniel’s plot

shows that the temperature of

pasteurization affects the anthocyanin

concentration significantly. No

interaction effects, neither the effect of

the holding time, the temperature, and

the cavitation mode, show up as a

significant effect at the significance

level α=0.05. However, some effects

are deviated from the straight line and

might be marginally significant.

Therefore, the effects were also

explored at α=0.10. At significance

level α=0.10 both factors A and B

(temperature and holding time)

significantly affected the polymeric

color content (Figure 4.4).

1.51.00.50.0-0.5-1.0

99

95

90

80

70

6050

40

30

20

10

5

1

Effect

Perc

ent

A Temperature, CB Holding time, minC Heating rate, C /minD C av itation mode

Factor Name

Not SignificantSignificant

Effect Type

B

Lenth's PSE = 0.515625

Figure 4.3 Normal plot of the effects(response is tannins, %, α= 0.05)

1.51.00.50.0-0.5-1.0

99

95

90

80

70

6050

40

30

20

10

5

1

Effect

Perc

ent

A Temperature, CB Holding time, minC Heating rate, C /minD C av itation mode

F actor Name

Not SignificantSignificant

Effect Type

B

A

Lenth's PSE = 0.515625

Fig. 4.4 Normal plot of the effects(response is tannins, %, α = 0.10)

74

Then the design was collapsed to and the data was analyzed as a three factor factorial

with two replications.

The assumption of normality was checked and found to be valid; however, the constant

variance assumption was violated. To induce constant variance, the logarithmic transformation

(log based 10) was used (the normality assumption for transformed data was valid too).The

complete randomization and results of the autocorrelation function analysis for transformed data

provided enough evidence to assume independence. The following ANOVA results were

obtained using the transformed response values. The results of the ANOVA test for tannins for

the transformed data are shown in Table 4.5.

Table 4.5 Results of the ANOVA test for processing factors and tannin content

Treatment combination p-value

Temperature of pasteurization, °C (A) 0.019

Holding time, min (B) 0.007

Heating rate, °C/min (C) 0.033

Temperature * Holding time (A*B) 0.432

Temperature * Heating rate (A*C) 0.232

Holding time * Heating rate (B*C) 0.770

Temperature * Holding time * Heating rate (A*B*C) 0.431

The adjusted R2of 62.10%

means that 62.10% of the total

variability of the system was

explained by the factors chosen

for the experiment (temperature of

pasteurization, holding time and

heating rate).

The main effects of the

temperature of pasteurization, the

holding time and the heating rate

9585

16.0

15.5

15.0

14.550

1.70.9

16.0

15.5

15.0

14.5

Temperature, C

Mea

n ta

nnin

s, %

Holding time, min

Heating rate, C/min

Figure 4.5 Main effects plot for tannins, %

75

on tannins are presented in Figure 4.5. For easier comprehension, the main effects plot was

performed using non-transformed data (tannins, %).

Taking into account the results of the ANOVA test, one can conclude that the

temperature of pasteurization, the holding time and the heating rate significantly affected the

polymeric color content (tannins, %) of the product. The cavitation mode as well as all two- and

three- way interaction effects did not affect significantly the tannin content. To conclude to

which level of these three factors is preferable to achieve the lowest response (tannin content) the

main effect plots were analyzed. It follows that low levels of factor A (temperature of

pasteurization is 85 °C), low levels of factor B (holding time is 0 min) and high levels of factor C

(heating rate is 1.9 °C/min) are desirable to achieve a low polymeric color content in the product.

4.3.1.3 Microbial Load

The direct analysis of the microbial load data (Aerobic plate count, cfu/g) did not provide

meaningful results because the initial microbial load of the raw material within the batch varied.

To normalize the effect of unequal microbial load in the raw material, log reduction was

calculated as a response variable. Log reduction for each treatment combination was calculated

as a difference between logarithms of cfu/g for the raw material and the pasteurized product.

Table 4.6 shows the results of the microbial tests taking into account the microbial load

of the initial raw material for each batch. or a treatment combination number 13, the initial

microbial load was noticeably higher than that for the other batches (the period of thawing of the

frozen blueberries for this batch was much longer as compared with the other batches, so the

process of fermentation probably started which might provoke some microbial growth in the raw

material). It resulted in a markedly higher microbial load of the pasteurized product.

76

Table 4.6 Results of the unreplicated 24 design for microbial load N

umbe

r Factor Microbial load

Level (coded) Level (uncoded) Raw material Pasteurized

product

Log

red

ucti

on

Tem

pera

ture

Hol

ding

tim

e

Hea

ting

rat

e

Cav

itat

ion

mod

e

Tem

pera

ture

, °C

Hol

ding

tim

e, m

in

Hea

ting

rat

e, °

C/m

in

Cav

itat

ion

mod

e

cfu,

g

Log

num

ber

cfu,

g

Log

num

ber

1 – – – – 85 0 0.9 A 2.6·104 4.41 20 1.30 3.11 2 + – – – 95 0 0.9 A 1.4·104 4.15 <10 <1.00 >3.15 3 – + – – 85 5 0.9 A 3.5·104 4.55 25 1.40 3.15 4 + + – – 95 5 0.9 A 2.0·104 4.29 <10 <1.00 >3.29 5 – – + – 85 0 1.7 A 1.5·104 4.18 35 1.54 2.64 6 + – + – 95 0 1.7 A 1.7·104 4.23 <10 <1.00 >3.23 7 – + + – 85 5 1.7 A 0.9·104 3.96 <10 <1.00 >2.96 8 + + + – 95 5 1.7 A 2.2·104 4.35 <10 <1.00 >3.35 9 – – – + 85 0 0.9 A+B 1.6·104 4.19 15 1.18 3.02 10 + – – + 95 0 0.9 A+B 2.4·104 4.38 <10 <1.00 >3.38 11 – + – + 85 5 0.9 A+B 1.9·104 4.27 <10 <1.00 >3.27 12 + + – + 95 5 0.9 A+B 2.8·104 4.44 <10 <1.00 >3.44 13 – – + + 85 0 1.7 A+B 1.8·105 5.26 307.5 2.49 2.78 14 + – + + 95 0 1.7 A+B 1.2·104 4.08 5 0.70 3.38 15 – + + + 85 5 1.7 A+B 7.0·104 4.84 40 1.60 3.24 16 + + + + 95 5 1.7 A+B 1.6·104 4.21 <10 <1.00 >3.21

The effect of the processing

factors on log reduction was estimated by

the analysis of Daniel’s plot (Figure 4.6),

which showed that there was no

significant effect on log reduction at

significance level α=0.05. No effect of

the holding time, the temperature, the

heating rate, the cavitation mode, or any

interaction effects showed up as

significant. However, some effects

0.40.30.20.10.0-0.1-0.2-0.3-0.4

99

95

90

80

70

6050

40

30

20

10

5

1

Effect

Perc

ent

A Temperature, CB Holding time, minC Heating rate, C /minD C av itation mode

Factor Name

Not SignificantSignificant

Effect Type

Lenth's PSE = 0.13875

Figure 4.6 Normal plot of the effects(response is log reduction, α = 0.05)

77

deviated from the straight line and might be marginally significant. When the significance at

α=0.10 was checked, factor A

(temperature of pasteurization)

showed up as significantly affecting

log reduction (Fig. 4.7).

As the next step in analysis,

the experimental design was

collapsed and the data was analyzed

as a three factor factorial with two

replications using ANOVA.As a

result of the analysis, it was found

that the error terms are not

distributed normally. The power transformation (reciprocal) was applied to induce the normality

of the data and then the assumptions of the constant variance and independence were found to be

valid for the transformed data. The results of the ANOVA test for the transformed log reduction

response are shown in Table 4.7.

Table 4.7 Results of ANOVA test for log reduction

Treatment combination p-value

Temperature of pasteurization, °C (A) 0.001

Holding time, min (B) 0.025

Heating rate, °C/min (C) 0.046

Temperature * Holding time (A*B) 0.062

Temperature * Heating rate (A*C) 0.074

Holding time * Heating rate (B*C) 0.449

Temperature * Holding time * Heating rate (A*B*C) 0.121

The adjusted R2 accounted for 73.55% of the total variability was explained by the factors

chosen for the experiment (temperature of pasteurization, holding time and heating rate).

0.40.30.20.10.0-0.1-0.2-0.3-0.4

99

95

90

80

70

6050

40

30

20

10

5

1

Effect

Perc

ent

A Temperature, CB Holding time, minC Heating rate, C /minD C av itation mode

F actor N ame

Not SignificantSignificant

Effect Type

A

Lenth's PSE = 0.13875

Fig.4.7 Normal plot of the effects(response is log reduction, α = 0.10)

78

The plots for significant interaction effects are presented in figure 4.8 for non-

transformed data. The letter grouping is done using the SAS statistical software (using the

lsmeans statement of PROC GLM, α=0.01).

Taking into account the results of the ANOVA test, it was concluded that the temperature

of pasteurization, the holding time and the heating rate significantly affected the log reduction of

the product. A high level of factor A (temperature of pasteurization is 95 °C),a high level of

factor B (longer holding time, i.e. 5 min) and a low level of factor C (heating rate is 0.9 °C/min)

provided a higher log reduction during the process of pasteurization.

The interaction plot for the temperature and the heating rate interaction effect shows that

at a high level of temperature (95°C) heating rate did not affect log reduction. But at a lower

level of temperature (85°C), log reduction at a lower heating rate was significantly higher than at

a higher heating rate. This may be because cumulative thermal treatment was higher if the

product heated slower, which resulted in higher log reduction. The interaction plot for the

temperature and the holding time provided similar results. There was no significant effect of the

holding time on log reduction at 95°C. A significantly higher log reduction at 85°C temperature

level was observed at a higher level of holding time (5 minutes) as compared with a lower level

(0 minutes). A longer holding time resulted in a higher cumulative heat treatment and hence, in a

higher log reduction.

In both cases, the effect of the heating rate and the holding time at a high temperature

level (95°C) was not significant. The reason for this phenomena is that the microbial load of the

raw material has a low variability from batch to batch (with some exception), and the heat

treatment combinations at a high temperature level provides commercial sterility (when no

Figure 4.8 a) Interaction plot for log reduction (temperature*heating rate); b) Interaction plot for log reduction (temperature*holding time)

highlow

3.3

3.2

3.1

3.0

2.9

Heating rate, C/min

Mea

n lo

g re

duct

ion

8595

Temperature, C

ab

b

aa

o

oa)50

3.3

3.2

3.1

3.0

2.9

Holding time, min

8595

Temperature, Co

a

a

a

b

b)

79

colonies were detected, the results were reported as less than 10 cfu/g), so log reduction was

reported as “more than” specific number. In order to increase the sensitivity of the system to

detect the impact of factors on log reduction, early fermentation of blueberries may be useful to

increase the initial microbial load of the starting material. The cavitation mode as well as all

three- way interaction effects did not affect log reduction significantly.

4.3.2 Process Optimization

As it was determined in the previous experiment, the cavitation mode did not affect the

anthocyanin concentration, tannin content or log reduction significantly, so it was not included in

the process of optimization. Also, since the heating rate was hard to control (physically) and

since the heating rate was lowered by running cold water through the cooling jacket (with

reduced energy efficiency), it was decided to keep the heating rate at the initial level (1.9°C/min)

without cooling. The combined effects of the temperature and the heating rate on the response

variables were investigated and the results of CCD design are presented in Table 4.8.

Table 4.8 Process variables and response variables for central composite design

#

Levels of operating parameters Response

Coded Uncoded

Tim

e

Tem

pera

ture

Tim

e, m

in

Tem

pera

ture

, °C

Ant

hocy

anin

s,

mgC

3G/g

DW

Tan

nins

, %

AP

C, c

fu/g

1 –1 –1 2.2 85.0 12.07 14.13 25 2 1 –1 12.8 85.0 11.90 13.64 <10 3 –1 1 2.2 95.0 9.81 15.07 <10 4 1 1 12.8 95.0 9.26 16.60 <10 5 –1.41 0 0.0 90.0 12.07 12.15 12.5 6 1.41 0 15.0 90.0 9.19 15.23 <10 7 0 –1.41 7.5 83.0 10.98 13.16 25 8 0 1.41 7.5 97.0 9.13 17.12 <10 9 0 0 7.5 90.0 9.86 15.17 <10 10 0 0 7.5 90.0 10.02 14.79 <10 11 0 0 7.5 90.0 9.72 14.69 <10 12 0 0 7.5 90.0 11.17 15.50 <10

80

4.3.2.1 Anthocyanins

The statistical software (SAS and Minitab) was used to fit a response surface and develop

the contour plots for anthocyanin concentration. Testing model adequacy: the analysis of the

variance and regression coefficients are shown in Table 4.9. The assumptions of normality,

independence and the constant variance were checked and found to be valid.

Table 4.9 Regression coefficients and ANOVA results for anthocyanin concentration

Parameter Factor Coefficient estimate

p-value Significance Coded Uncoded

β0 intercept 10.192 37.722 <0.0001 significant

β1 x1 holding time - 0.599 0.037 0.0750 significant

(marginally)

β2 x2 temperature - 0.940 - 0.418 0.0150 significant

β11 x12 holding time*

holding time 0.323 0.012 0.3395 not significant

β22 x22 temperature*

temperature - 0.095 0.001 0.8175 not significant

β12 x1 x2 holding time* temperature

0.036 - 0.004 0.9127 not significant

Model p-value

Linear 0.0203 significant

Quadratic 0.6072 not significant

Cross product 0.8175 not significant

Total model 0.0828 marginally

significant

Lack of fit (quadratic model) 0.3169 no lack of fit

The analysis of table 4.9 showed that there is no significant effect of the quadratic

components and cross products, which corresponds to the fact that the linear model is

appropriate. In coded variables the fitted model for anthocyanin concentration is: = 10.19 − 0.60 − 0.94 (15a) In uncoded variables: = 37.7 + 0.04 − 0.42 (15b)

81

The equations above were used to generate the contour plot and the response surface for

anthocyanin concentration (Fig. 4.9 and 4.10). The adjusted R2 for the fitted model was 52.47%,

which means that 52.5% of the total variability of the system was explained by the chosen

factors. The canonical analysis indicated that the stationary point was a minimum (Eigen values

are 0.662 and 0.056), and the results of the canonical analysis for the anthocyanin concentration

are presented in Table 4.10.

Table 4.10 Results of the canonical analysis for optimization of anthocyanin concentration

Holding time Temperature

Critical values Coded (x) 3.56 17.94

Uncoded ( ) 26.4 min 180°C

Predicted response 0.70 mg C3G/g DW

The canonical analysis showed the minimum anthocyanin concentration at a temperature

set at 180°C and the holding time of more than 26 minutes. These temperature regimes are not

useful for food product pasteurization. However, this result as well as the analysis of the contour

plot (Fig. 4.9a) and the surface plot (Fig. 4.9b) allows one to conclude that higher temperatures

of pasteurization and longer holding times leads to greater loss of anthocyanins. Anthocyanins

were more sensitive to high temperature than to holding time in these specific ranges (Fig. 4.9b).

As a preliminary conclusion, to maximize the anthocyanin concentration in this time and

Figure 4.9a) Contour plot of anthocyanin concentration, mg C3G/g DW; b) Surface plot of anthocyanins, mg C3G/g DW

8

10

12

85

090595 10

15Holding time, min

Temperature, Co

Anthocyanins, mg C3G/g DW

b)

12.0

11.2

10.4

9.68.8

Holding time, min

Tem

pera

ture

, C

14.512.09.57.04.52.0

95.0

92.5

90.0

87.5

85.0

o

a)

82

temperature range it is better to use mild regimes of pasteurization (temperature of pasteurization

83 to 87°C, holding time 0 to 5 min).

4.3.2.2 Tannins

The statistical software (SAS and Minitab) was used to fit a response surface and to

construct the contour plots for tannin content. The assumptions of normality, independence and

the constant variance were checked and found to be valid.

Table 4.11 Regression coefficients and ANOVA results for tannins

Parameter Factor Coefficient estimate

p-value Significance coded uncoded

β0 intercept 15.038 57.094 <0.0001 significant

β1 x1 holding time 0.675 - 1.287 0.0021 significant

β2 x2 temperature 1.188 - 1.075 0.0263 significant

β11 x12 holding time*

holding time - 0.563 - 0.020 0.5512 not significant

β22 x22 temperature*

temperature 0.163 0.007 0.1719 not significant

β12 x1 x2 holding time* temperature

0.505 0.019 0.0716 marginally

significant

Model p-value

Linear 0.0031 significant

Quadratic 0.1262 not significant

Cross product 0.1719 not significant

Total model 0.0101 significant

Lack of fit (quadratic model) 0.1056 no lack of fit

The analysis of Table 4.11 showed that there is no significant effect of the quadratic

components, which confirms the proper choice of the linear model. In coded variables the fitted

model for anthocyanin concentration is: = 15.04 + 0.68 + 1.19 + 0.51 (16a) In uncoded variables: = 57.09 − 1.29 − 1.08 + 0.02 (16b)

T

tannin co

means th

T

saddle (E

point, the

was cond

that mini

short hol

surface p

Figure 4tannins, %

12

14

16

18

959

Temperature, Co

Tannins, %

c)

a)

The equation

ontent (Fig.

hat 77.8% of

The canonica

Eigen values

e estimated

ducted and th

imum tannin

lding times.

plot (Fig.4.10

.10 a) Ridge%

9085

0

s above wer

4.10b and 4

f the total var

al analysis i

s are 0.484 a

surface did n

he results ar

n content in

. The conto

0c) confirm t

e of maximu

105

Holding ti

re used to ge

4.10c). The

riability of th

indicated th

and –1.284).

not have a u

re presented

this specific

ur plot of t

this conclusi

um tannins;

15

me, min

83

enerate the c

adjusted R2

he system w

hat the predi

. Because th

unique optim

in Figure 4.

c range occu

the predicte

ion.

b) Contou

C

b)

contour plot 2 for the fitt

was explained

icted respon

he canonical

mum. A ridg

10a. The rid

urred at rela

ed response

ur plot of ta

15.

13.6Te

mpe

ratu

re, C

42.0

95.0

92.5

90.0

87.5

85.0

and the resp

ted model i

d by the chos

nse surface

analysis res

e analysis o

dge plot (Fig

atively low t

surface (Fi

annins, %; c

16

14.6

Holding time, min9.57.04.5

ponse surfac

s 77.80%, w

sen factors.

is shaped l

sulted in a s

f tannin resp

g.4.10a) indi

temperature

g.4.10b) and

c) Surface pl

17.6

16.6

13.6

14.512.0

ce for

which

like a

addle

ponse

icated

s and

d the

lot of

84

The analysis of the contour plot and the surface plot also indicates that at lower

temperature (83 to 85 °C) effect of holding time was not so noticeable (small change in tannin

content). At higher temperatures (95 to 97°C), the content of polymeric color increased markedly

with longer holding times. It can be explained by the fact that increasing cumulative thermal

treatment at higher temperatures results in acceleration of the reactions of anthocyanin

condensation. To minimize tannin content, the same combination of temperatures (83 to 87°C)

and holding times (0 to 5 min) can be suggested.

4.3.2.3 Microbial Load

The direct statistical analysis of the microbial load data (Table 4.8, Aerobic plate count,

cfu/g) did not provide meaningful results because the microbial load of the raw material within

the batch was different and because a significant amount of treatment combinations provided

industrial sterility of the product (no bacterial colony growth was observed) which was reported

as “less than 10 cfu/g”. Table 4.12 shows the results of the microbial tests taking into

consideration the microbial load of the initial raw material for each batch. Log reduction for each

treatment combination was calculated as a difference between logarithms of cfu per gram for the

raw material and the pasteurized product. The statistical software (SAS and Minitab) was used to

fit a response surface and to construct the contour plots for log reduction. Testing of the model

adequacy, i.e. analysis of the variance and regression coefficients are shown in Table 4.13. The

assumptions of normality, independence and the constant variance were checked and found to be

valid.

85

Table 4.12 Microbial load of raw material and final product for optimization experiment

#

Levels of operating parameters Microbial load

Coded Uncoded Raw material Pasteurized product

Log

red

ucti

on

Tim

e

Tem

pera

ture

Tim

e, m

in

Tem

pera

ture

, °C

cfu/

g

Log

num

ber

cfu/

g

Log

num

ber

1 –1 –1 2.2 85.0 2.2·104 4.34 25 1.40 2.94 2 1 –1 12.8 85.0 2.1·104 4.33 <10 <1.00 >3.33 3 –1 1 2.2 95.0 7.6·104 4.88 <10 <1.00 >3.88 4 1 1 12.8 95.0 1.1·105 5.04 <10 <1.00 >4.04 5 –1.41 0 0.0 90.0 6.8·104 4.82 12.5 1.09 3.73 6 1.41 0 15.0 90.0 7.4·104 4.87 <10 <1.00 >3.87 7 0 –1.41 7.5 83.0 3.5·104 4.54 25 1.40 3.14 8 0 1.41 7.5 97.0 1.0·105 5.00 <10 <1.00 >4.00 9 0 0 7.5 90.0 7.6·104 4.88 <10 <1.00 >3.88 10 0 0 7.5 90.0 9.1·104 4.96 <10 <1.00 >3.96 11 0 0 7.5 90.0 7.6·104 4.88 <10 <1.00 >3.88 12 0 0 7.5 90.0 5.8·104 4.76 <10 <1.00 >3.76

86

Table 4.13 Regression coefficients and ANOVA results for log reduction

Parameter Factor Coefficient estimate p-value Significance

Coded uncoded

β0 intercept 3.870 - 64.052 <0.0001 significant

β1 x1 holding time 0.358 0.250 0.0002 significant

β2 x2 temperature 0.093 1.420 0.0830 marginally significant

β11 x12 holding time*

holding time - 0.184 - 0.002 0.0105 significant

β22 x22 temperature*

temperature - 0.058 - 0.007 0.4011 not significant

β12 x1 x2 holding time* temperature

- 0.069 - 0.002 0.2172 not significant

Model p-value

Linear 0.0005 significant

Quadratic 0.0276 significant

Cross product 0.4011 not significant

Total model 0.0019 significant

Lack of fit (quadratic model) 0.1525 no lack of fit

The analysis of Table 4.13 indicates that there is a significant effect of one of the

quadratic components. The linear model is specified as highly significant, and the quadratic

model has significance too. In coded variables the fitted model for anthocyanin concentration

looks like: = 3.87 + 0.36 + 0.09 − 0.18 (17a) In uncoded variables: = −64.05 + 0.25 + 1.42 − 0.002 (17b)

The equations above were used to generate the contour plot and the response surface for

log reduction (Fig. 4.15 and 4.16).The adjusted R2for the fitted model is 87.55%, which means

that 87.6% of the total variability of the system was explained by the chosen factors. The

canonical analysis indicated that the stationary point was a maximum (Eigen values are –0.125

and – 0.382). The results of the canonical analysis for log reduction are presented in Table 4.14.

87

Table 4.14 Results of canonical analysis for optimization of log reduction

Holding time Temperature

Critical values Coded (x) 0.926 0.290

Uncoded ( ) 12.4 min 91.5°C

Predicted response 4.05

The canonical analysis shows

maximum log reduction at 91.5°C and at

a holding time of 12 minutes. The

contour plot (Fig. 4.11a) and the surface

plot (Fig. 4.11b) demonstrate that there

was an optimum for log reduction in the

chosen range of time and temperature. It

was not expected to find an optimum for

log reduction since increasing the

temperature of pasteurization and the

prolonged holding time results in the

higher ability to destroy the microbial

cells. These results can be explained by

the fact that many treatment

combinations did not show any

microbial growth in the product (Table

4.8). In this case, log numbers were

reported as “less than 1”. For log

reduction, for most of the samples

treated at the temperatures higher than

90°C and holding time longer than 5 minutes, the results were reported as “more than log

number”, however, for the analysis these data were used as fixed numbers. However, taking into

account the above considerations, it’s possible to conclude that increasing the temperature of

pasteurization and the holding time within specified ranges results in increasing the log reduction

4.00

3.753.50

3.253.00

2.75

Holding time, min

Tem

pera

ture

, C

14.512.09.57.04.52.0

95.0

92.5

90.0

87.5

85.0

o

a)

2.5

3.0

1595

3.5

4.0

1090585

0 Holding time, minTemperature, Co

Log reduction

b)

Figure 4.11 a) Contour plot of log reduction; b) Surface plot of log reduction

88

of the microbial load. Higher levels of times and temperatures are preferable to provide safety of

the pasteurized blueberry purée.

4.3.2.4 Multiple Responses Optimization

To optimize multiple responses an overlaid contour plot of anthocyanin concentration,

tannin content and log reduction was generated in the Minitab software (Fig.4.17). Since

desirable results in terms of product quality (minimum tannin content and maximum anthocyanin

concentration) required lower levels of holding time and temperature, and in terms of product

safety (maximum log reduction) it is required to apply higher levels of time and temperature,

overlaying of the three response surfaces provided visual output useful for selecting processing

regimes. In maximizing log reduction and anthocyanin concentration, the target values were set

higher than was obtained from the

experiment. A low level for

anthocyanin concentration was set at

10 mg C3G/g of dry weight, for log

reduction: 3.8 log number. In

minimizing tannin content, the target

value was set lower than was obtained

during the experiment, the high level

was specified as 14%. The three

response surface overlay shows the

area (white color at the contour plot)

which provides optimum results and

allows one to suggest possible treatment combinations, for example: 2 minutes at 92°C, 1 min at

93°C, or heating till 95°C with no holding time. The final decision on the regimes of

pasteurization can be made based on technological convenience, energy efficiency and other

considerations in the manufacturing process.

Holding time, min

Tem

pera

ture

, C

14.512.09.57.04.52.0

95.0

92.5

90.0

87.5

85.0tannins, less than 14%

anthocyanins, more than 10mgC3G/gDW

log reduction, more than 3,8

o

Figure 4.12 Overlaid contour plot of anthocyanins,

tannins, and log reduction

89

4.4 Conclusions and Recommendations

Lower temperature, shorter holding times, and higher heating rates resulted in a higher

anthocyanin concentration and lower tannin content in the HTDT blueberry purée. Accordingly,

intensive thermal treatment (high temperature, long holding time, and low heating rate) resulted

in lower anthocyanin concentration in the pasteurized product. These results were expected,

since anthocyanins are sensitive to thermal treatment. However, these combinations of time,

temperature and heating rate more effectively reduced microbial load (desirable for food

safety).No significant difference in the effect of holding time and heating rate was detected at a

high level of temperature, in contrast to significant effect of these factors at the low level of

temperature. Cavitation mode was a non-significant factor, so it was excluded from subsequent

models.

The response surface methodology was used to determine the combined effect of time

and temperature on anthocyanin concentration, polymeric color (tannins) content, and the

microbial load (log reduction). Linear models were effective to describe the response surfaces for

anthocyanin concentration and tannin content, while a quadratic model was needed to describe

log reduction. An optimal combination of time and temperature was found to achieve the best

HTDT blueberry purée quality within specified food safety constraints (Fig. 4.17). Pasteurization

temperature in the range of 92 to 95oC in combination with a holding time of 0.5 to 2 minutes

provides a safe product (more than 3.8 log reduction) with a high concentration of anthocyanins

and a low tannin content. The accuracy of optimization was limited with the sensitivity of

microbial (APC) measurements. To increase the accuracy of experiments, provision of the

microbial load (by preliminary fermentation our culture inoculation) before thermal processing

could be suggested.

90

5. CONCLUSION

Wild blueberries are a local product of Atlantic Canada and have a high economic

importance for the region. Wild blueberries are characterized by the very high content of

polyphenolic substances among cultivated crops and have been reported as a product with

potential benefits in human health. However, the amount of wild blueberry-based food products

presented on the local market is very limited. Consumers are interested in new healthy and

natural foods on the market. At the same time, wild blueberry production in Atlantic Canada

increases every year. Blueberry producers are also interested in the development of new

blueberry-based products, since it will allow them to sell more blueberries locally, nationally and

internationally.

Almost all types of food processing used for wild blueberries affect negatively the

polyphenolic substances and, by extension, the potential health promoting properties of

blueberry-based products. Use of new Hydrothermodynamic technology (HTDT) was indicated

to be promising for blueberry food processing in order to minimize polyphenolic degradation.

The research hypothesis was that hydrothermodynamic (HTD) processing would result in a

high-quality pasteurized food product. To test this hypothesis, three objectives were formulated: i)

comparing HTD technology and conventional blueberry processing technology (using the open

contact heater), and study the difference between the HTDT blueberry purée and commercial

blueberry-based products; ii) study and model kinetics of quality degradation during the HTDT

blueberry purée storage in order to develop shelf-life recommendations; iii) study the effect of the

processing factors (temperature, time, heating rate, cavitation mode) on food quality and safety,

and optimize time-temperature regimes for HTDT blueberry processing.

The preliminary experiments showed that the quality of the HTDT blueberry purée in terms

of anthocyanin concentration and tannin content was higher than that of most commercially

available blueberry products. It was demonstrated that HTD technology provided pasteurization of

the blueberry purée with significantly lower losses of anthocyanins than that as a result of

conventional contact heating, so HTD technology can be successfully used for pasteurized

blueberry purée processing with minimal quality degradation.

For HTDT blueberry process optimization, a two stage experiment was used. At the first

stage, screening of the processing factors using the unreplicated factorial design showed that the

holding time, the temperature of pasteurization and the heating rate were significant factors, while

the cavitation mode of HTDT processing was non-significant. At the second stage, the set of

91

optimization experiments was designed using the response surface methodology. The combined

effect of time and temperature on the quality and safety was described as a combined response of

anthocyanin concentration, polymeric color (tannin) content, and the microbial load (log

reduction). Linear models were effective to describe response surfaces for anthocyanin

concentration and tannin content, while the quadratic model was used to describe log reduction.

The combination of time and temperature, optimal for the best quality processing within specified

food safety constraints, was found. Temperatures in the range 92 to 95oC in combination with

holding times of 0.5 to 2 minutes provided acceptable product safety along with high quality in

terms of high concentration of anthocyanins and low tannin content.

The investigation of the product shelf life showed that cold storage at 4°C is preferable in

terms of lower anthocyanin degradation as compared with storage at room temperature (20 to

25°C). The rate of anthocyanin degradation and tannin formation at 4°C was twice less than that

at room temperature. Storage up to 6 months at 4°C and up to 2 months at room temperature

resulted in a moderate loss of anthocyanins and can be recommended as a product shelf-life.

Fitted exponential models, described in this work, could be used to predict the anthocyanin

concentration and tannin content for different storage periods.

Adopting the HTD technology for wild blueberry processing can play a significant role

for Atlantic Canada, Nova Scotia in particular. On one hand, a high quality blueberry-based

product will be available to consumers, which allows them to have more diverse and convenient

ways to consume blueberries. On the other hand, producers will have a chance to launch a new

product on the market, therefore, sell more blueberries and meet demands for more health

beneficial products. To achieve this, the further investigation might be needed. Developing the

continuous system (versus batch processing which was used in this work) and industrial scaling

will be necessary for the product manufacture. Further product development (various textures,

fruit and berries blends, etc.) will be beneficial for product marketing. Also, testing HTDT

blueberry purée health functionality will be helpful in order to investigate and confirm health

beneficial properties of the product.

92

LIST OF REFERENCES

Ahmet, I., Spangler, E., Shukitt-Hale, B., Juhaszova, M., Sollott, S. J., Joseph, J. A., Ingram, D.

K. & Talan, M. (2009). Blueberry-enriched diet protects rat heart from ischemic damage. PloS

One 4(6), e5954.

Astatkie, T., Joseph, A.A., Martin, R.C. (2006) A two-level unreplicated factorial experiment to

determine the effect of organic and inorganic fertilizers on dry matter yield of permanent pasture.

Renewable Agricultural and Food Systems 21(2), 106-113

Barker, W. G., Wood, F. A., & Collins, W. B. (1963). Sugar-levels in fruits of the lowbush

blueberry estimated at four physiological ages. Nature, 198(4882), 810-811.

Basu, A., Rhone, M., & Lyons, T. J. (2010). Berries: emerging impact on cardiovascular health.

Nutrition reviews, 68(3), 168-177.

Bates, D.M. and Watts, D.G. (1988) Nonlinear regression analysis and its applications.

Beaudin, M. (2005). The agri-food industry in Atlantic Canada: recognition and development.

Canadian Institute for Research on Regional Development

Block, G.B., Patterson, B., Subar, A. (1992). Fruits, vegetables and cancer prevention: a review

of epidemiological evidence. 18, 1-29.

Boateng, J., Verghese, M., Shackelford, L., Walker, L. T., Khatiwada, J., Ogutu, S., Williams, D.

S., Jones, J., Guyton, M., Asiamah, D., Henderson, F., Grant, L., DeBruce, M., Johnson, A.,

Washington, S., & Chawan, C. B. (2007). Selected fruits reduce azoxymethane (aom)-induced

aberrant crypt foci (ACF) in fisher 344 male rats. Food and Chemical Toxicology, 45(5), 725-

732.

Bomser J., Madhavi D. L., Singletary K. & Smith M. A. L. (1996).In vitro anticancer activity of

fruit extracts from Vaccinium species. Planta Medica vol. 62(3), 212-216.

Bors, W., Michel, C. & Stettmaier, K. (1997). Antioxidant effects of flavonoids. BioFactors

6(4), 399-402.

Bosetti, C., Spertini, L., Parpinel, M., Gnagnarella, P., Lagiou, P., Negri, E., Franceschi, S.,

Montella, M., Peterson, J., Dwyer, J., Giacosa, A., & La Vecchia, C. (2005). Flavonoids and

breast cancer risk in Italy. Cancer epidemiology, biomarkers & prevention, 14(4), 805-808.

93

Bravo, L. (1998). Polyphenols: chemistry, dietary sources, metabolism, and nutritional

significance. Nutrition Reviews 56(11), 317-333.

Bravo, L., Abia, R. & Saura-Calixto, F. (1994). Polyphenols as dietary fiber associated

compounds. Comparative study on in vivo and in vitro properties.Journal of Agricultural and

Food Chemistry 42(7), 1481-1487.

Brownmiller, C., Howard, L. R. & Prior, R. L. (2008).Processing and storage effects on

monomeric anthocyanins, percent polymeric color, and antioxidant capacity of processed

blueberry products.Journal of Food Science 73(5), H72-H79.

Brownmiller, C., Howard, L. R. & Prior, R. L. (2009).Processing and storage effects on

procyanidin composition and concentration of processed blueberry products.Journal of

Agricultural and Food Chemistry 57(5), 1896-1902.

Burda, S. and Oleszek, W. (2001).Antioxidant and antiradical activities of flavonoids.Journal of

Agricultural and Food Chemistry 49(6), 2774-2779.

Bushway, R. J., Gann, D. F. M., Cook, W. P., & Bushway, A. A. (1983). Mineral and vitamin

content of lowbush blueberries (Vaccinium angustifolium Ait.). Journal of Food Science, 48(6),

1878-1878.

Cabrita, L., Fossen, T., & Andersen, Ø. M. (2000).Colour and stability of the six common

anthocyanidin 3-glucosides in aqueous solutions.Food Chemistry, 68(1), 101-107.

Camire, M. E., Chaovanalikit, A., Dougherty, M. P. & Briggs, J. (2002).Blueberry and grape

anthocyanins as breakfast cereal colorants.Journal of Food Science 67(1), 438-441.

Canter, P. H., & Ernst, E. (2004). Anthocyanosides of Vaccinium myrtillus (bilberry) for night

vision--a systematic review of placebo-controlled trials. Survey of ophthalmology, 49(1), 38-50.

Cao, G., Sofic, E., & Prior, R. L. (1997). Antioxidant and prooxidant behavior of flavonoids:

structure-activity relationships. Free Radical Biology and Medicine, 22(5), 749-760.

Carbone, F., Mourgues, F., Perrotta, G. & Rosati, C. (2008).Advances in functional research of

antioxidants and organoleptic traits in berry crops.BioFactors 34(1), 23-36.

Carlsen, C. & Stapelfeldt, H. (1997). Light sensitivity of elderberry extract. Quantum yields for

photodegradation in aqueous solution. Food Chemistry 60(3), 383-387.

94

Castrejón, A. D. R., Eichholz, I., Rohn, S., Kroh, L. W. & Huyskens-Keil, S. (2008). Phenolic

profile and antioxidant activity of highbush blueberry (Vaccinium corymbosum L.) during fruit

maturation and ripening.Food Chemistry 109(3), 564-572.

Chen, G., & Luo, J. (2010). Anthocyanins: are they beneficial in treating ethanol neurotoxicity?

Neurotoxicity research, 17(1), 91-101.

Chun, O. K., Chung, S., Claycombe, K. J., & Song, W. O. (2008). Serum C-reactive protein

concentrations are inversely associated with dietary flavonoid intake in U.S. adults. The Journal

of Nutrition, 138(4), 753-760.

Cisowska, A., Wojnicz, D., & Hendrich, A. B. (2011).Anthocyanins as antimicrobial agents of

natural plant origin.Natural product communications, 6(1), 149-156.

Cisse, M., Vaillant, F., Acosta, O., Dhuique-Mayer, C. & Dornier, M. (2009).Thermal

degradation kinetics of anthocyanins from blood orange, blackberry, and roselle using the

Arrhenius, Eyring, and ball models.Journal of Agricultural and Food Chemistry 57(14), 6285-

6291.

Connor, A. M., Luby, J. J., Hancock, J. F., Berkheimer, S. & Hanson, E. J. (2002).Changes in

fruit antioxidant activity among blueberry cultivars during cold-temperature storage.Journal of

Agricultural and Food Chemistry 50(4), 893-898.

Cooke, D., Steward, W. P., Gescher, A. J., & Marczylo, T. (2005). Anthocyanins from fruits and

vegetables--does bright color signal cancer chemopreventive activity? European journal of

cancer (Oxford, England : 1990), 41(13), 1931-1940.

Croft, K. D. (1998).The chemistry and biological effects of flavonoids and phenolic acids.Annals

of the New York Academy of Sciences 854, 435-442.

Crozier, A., Jaganath, I. B., & Clifford, M. N. (2009). Dietary phenolics: chemistry,

bioavailability and effects on health. Natural product reports, 26(8), 1001-1043.

Daniel, C. (1959) Use of half-normal plots in interpreting factorial two-level experiments.

Technometrics 1(4), 311-341

Del Rio, D., Borges, G., & Crozier, A. (2010). Berry flavonoids and phenolics: bioavailability

and evidence of protective effects. The British journal of nutrition, 104 (3), S67-90.

95

Donahue, D. W. & Work, T. M. (1998).Sensory and textural evaluation of Main wild blueberries

for the fresh pack market.Journal of Texture Studies 29(3), 305-312.

Donahue, D. W., Debruyne, D. A., Fecteau, J. D., Storey, J. A. & Hazen, R. A. (1999).

Consumer preference and mechanical property of Maine wild blueberries for the fresh pack

market. Journal of Food Quality 22(5), 545-551.

Dulebohn, R. V., Yi, W., Srivastava, A., Akoh, C. C., Krewer, G. & Fischer, J. G. (2008).

Effects of blueberry (Vaccinium ashei) on DNA damage, lipid peroxidation, and phase II enzyme

activities in rats. Journal of Agricultural and Food Chemistry 56(24), 11700-11706.

Fimognari, C., Lenzi, M., & Hrelia, P. (2008). Chemoprevention of cancer by isothiocyanates

and anthocyanins: mechanisms of action and structure-activity relationship. Current medicinal

chemistry, 15(5), 440-447.

Francis, F. J. (1989). Food colorants: anthocyanins. Critical Reviews in Food Science and

Nutrition, 28(4), 273-314.

Gabor, M. (1986).Anti-inflammatory and anti-allergic properties of flavonoids. In: Cody, V.,

Middleton, E., Harbor, J. (Ed), Plant Flavonoids in Biology and Medicine: Biochemical,

Pharmacological, Structure-Activity Relationships (pp. 471-480). New-York: Alan R. Liss, Inc.

Galli, R. L., Shukitt-Hale, B., Youdim, K. A. & Joseph, J. A. (2002).Fruit polyphenolics and

brain aging.Annals of the New York Academy of Sciences, 128-132.

Galli, R. L., Shukitt-Hale, B., Youdim, K. A., & Joseph, J. A. (2002). Fruit polyphenolics and

brain aging: nutritional interventions targeting age-related neuronal and behavioral deficits.

Annals of the New York Academy of Sciences, 959, 128-132.

Galvano, F., La Fauci, L., Vitaglione, P., Fogliano, V., Vanella, L., & Felgines, C.

(2007).Bioavailability, antioxidant and biological properties of the natural free-radical

scavengers cyanidin and related glycosides.Annali dell'Istituto Superiore di Sanita, 43(4), 382-

393.

Gao, L., and Mazza, G. (1994). Quantitation and distribution of simple and acylated

anthocyanins and other phenolics in blueberries.Journal of Food Science, 59(5), 1057-1059.

96

Ghosh, D., & Konishi, T. (2007). Anthocyanins and anthocyanin-rich extracts: role in diabetes

and eye function. Asia Pacific Journal of Clinical Nutrition, 16(2), 200-208.

Giacalone,M., Di Sacco, F., Traupe,I., Topini, R., Forfori, F., & Giunta, F. (2011). Antioxidant

and neuroprotective properties of blueberry polyphenols: a critical review. Nutritional

Neuroscience, 14(3), 119-125.

Gil, M. I., Ferreres, F. & Tomas-Barberan, F. (1999).Effect of postharvest storage and processing

on the antioxidant constituents (flavonoids and vitamin C) of fresh-cut spinach.Journal of

Agricultural and Food Chemistry 47(6), 2213-2217.

Gu, L., Kelm, M., Hammerstone, J. F., Beecher, G., Cunningham, D., Vannozzi, S. & Prior, R.

L. (2002). Fractionation of polymeric procyanidins from lowbush blueberry and quantification of

procyanidins in selected foods with an optimized normal-phase HPLC-MS fluorescent detection

method.Journal of Agricultural and Food Chemistry 50(17), 4852-4860.

Guisti M.M. and Wrolstadt R.E. (2001).Characterization and measurement of anthocyanins by

UV-visible spectroscopy.Current Protocols in Food Analytical Chemistry, F1.2.1 – F1.2.13.

Häkkinen, S. H. & Törrönen, A. R. (2000). Content of flavonols and selected phenolic acids in

strawberries and Vaccinium species: influence of cultivar, cultivation site and technique. Food

Research International 33(6), 517-524.

Hanhineva, K., Törrönen, R., Bondia-Pons, I., Pekkinen, J., Kolehmainen, M., Mykkänen, H., &

Poutanen, K. (2010).Impact of dietary polyphenols on carbohydrate metabolism. International

Journal of Molecular Science, 11(4), 1365-1402.

Health Canada (2009). Nutrition Labeling...Get the Facts! website: http://www.hc-sc.gc.ca/fn-

an/label-etiquet/nutrition/educat/te_background-le_point-08-table2-eng.php

Health Canada (2009).Position Paper on Five US Health Claims Considered for Use in Canada

website: http://www.hc-sc.gc.ca/fn-an/label-etiquet/claims-reclam/position_paper-

enonce_position-eng.php

Hertog, M. G. L., Feskens, E. J. M., Kromhout, D., Hertog, M. G. L., Hollman, P. C. H., Hertog,

M. G. L. & Katan, M. B. (1993). Dietary antioxidant flavonoids and risk of coronary heart

disease: the Zutphen Elderly Study. The Lancet 342(8878), 1007-1011.

97

Holiman, P. C. H., Hertog, M. G. L. & Katan, M. B. (1996).Analysis and health effects of

flavonoids.Food Chemistry 57(1), 43-46.

Hou, D. X. (2003). Potential mechanisms of cancer chemoprevention by anthocyanins.Current

Molecular Medicine, 3(2), 149-159.

Howard, L. R., Castrodale, C., Brownmiller, C., & Mauromoustakos, A. (2010). Jam processing

and storage effects on blueberry polyphenolics and antioxidant capacity. Journal of Agricultural

and Food Chemistry, 58(7), 4022-4029.

Jackman, R. L., & Smith, J. L. (1996).Anthocyanins and Betalains. In G. A. F. Hendry, & J. D.

Houghton, Natural Food Colorants (pp. 244-309). Glasgow, UK: Blackie Academic &

Professional.

Jacman, R. L., Yada, R. Y., Tung, M. A. , Speers, R. A. (1987). Anthocyanins as food colorants

– a review.Journal of Food Biochemistry 11(3), 201-247.

Jager, A. K., & Saaby, L. (2011).Flavonoids and the CNS.Molecules (Basel, Switzerland), 16(2),

1471-1485.

Jensen, G. S., Wu, X., Patterson, K. M., Barnes, J., Carter, S. G., Scherwitz, L., Beaman, R.,

Endres, J. R. & Schauss, A. G. (2008). In vitro and in vivo antioxidant and anti-inflammatory

capacities of an antioxidant-rich fruit and berry juice blend. Results of a pilot and randomized,

double-blinded, placebo-controlled, crossover study. Journal of Agricultural and Food

Chemistry 56(18), 8326-8333.

Joseph, J. A., Denisova, N. A., Arendash, G., Gordon, M., Diamond, D., Shukitt-Hale, B. &

Morgan, D. (2003). Blueberry supplementation enhances signaling and prevents behavioral

deficits in an Alzheimer disease model. Nutritional Neuroscience 6(3), 153-162.

Joseph, J. A., Shukitt-Hale, B. & Willis, L. M. (2009). Grape juice, berries, and walnuts affect

brain aging and behavior. Journal of Nutrition 139 (9), 1813S-1817S

Joseph, J. A., Shukitt-Hale, B., & Willis, L. M. (2009). Grape Juice, Berries, and Walnuts Affect

Brain Aging and Behavior. Journal of Nutrition.

98

Joseph, J. A., Shukitt-Hale, B., Denisova, N. A., Bielinski, D., Martin, A., McEwen, J. J. &

Bickford, P. C. (1999). Reversals of age-related declines in neuronal signal transduction,

cognitive, and motor behavioral deficits with blueberry, spinach, or strawberry dietary

supplementation.The Journal of Neuroscience 19(18), 8114-8121.

Kader, F., Haluk, J., Nicolas, J. & Metche, M. (1998). Degradation of cyanidin 3-glucoside by

blueberry polyphenol oxidase: kinetic studies and mechanisms. Journal of Agricultural and Food

Chemistry 46(8), 3060-3065.

Kader, F., Irmouli, M., Nicolas, J. P. & Metche, M. (2002).Involvement of blueberry peroxidase

in the mechanisms of anthocyanin degradation in blueberry juice.Journal of Food Science 67(3),

910-915.

Kader, F., Irmouli, M., Zitouni, N., Nicolas, J. & Metche, M. (1999).Degradation of cyanidin 3-

glucoside by caffeic acid o-quinone.Determination of the stoichiometry and characterization of

the degradation products.Journal of Agricultural and Food Chemistry 47(11), 4625-4630.

Kader, F., Rovel, B., Girardin, M. & Metche, M. (1997).Mechanism of browning in fresh

highbush blueberry fruit (Vaccinium corymbosum L).Role of blueberry polyphenol oxidase,

chlorogenic acid and anthocyanins.Journal of the Science of Food and Agriculture 74(1), 31-34.

Kalea, A. Z., Clark, K., Schuschke, D. A. & Klimis-Zacas, D. J. (2009a). Vascular reactivity is

affected by dietary consumption of wild blueberries in the Sprague-Dawley rat. Journal of

Medicinal Food 12(1), 21-28.

Kalea, A. Z., Clark, K., Schuschke, D. A., Kristo, A. S. & Klimis-Zacas, D. J. (2009b). Dietary

enrichment with wild blueberries (Vaccinium angustifolium) affects the vascular reactivity in the

aorta of young spontaneously hypertensive rats. The Journal of Nutritional Biochemistry.

Kalea, A. Z., Lamari, F. N., Theocharis, A. D., Cordopatis, P., Schuschke, D. A., Karamanos, N.

K. & Klimis-Zacas, D. J. (2006). Wild blueberry (Vaccinium angustifolium) consumption affects

the composition and structure of glycosaminoglycans in Sprague-Dawley rat aorta. The Journal

of Nutritional Biochemistry 17(2), 109-116.

Kalt W., Joseph J.A. and Shukitt-Hale B. (2007). Blueberries and human health: A review of

current research. Journal of the American Pomological Society 61(3), 151-160.

Kalt, W. & Dufour, D. (1997).Health functionality of blueberries.HortTechnology 7(3), 216-221.

99

Kalt, W. & McDonald, J. E. (1996).Chemical composition of lowbush blueberry

cultivars.Journal of the American Society for Horticultural Science 121(1), 142-146.

Kalt, W. (2005).Effects of production and processing factors on major fruit and vegetable

antioxidants.Journal of Food Science 70(1), R11-R19.

Kalt, W., Fillmore, S. A. E., Mcrae, K. B., Foote, K., Lyon, M., & Van Lunen, T. A. (2008).

Effect of blueberry feeding on plasma lipids in pigs.British Journal of Nutrition, 100(1), 70-78.

Kalt, W., Forney, C. F., Martin, A. & Prior, R. L. (1999).Antioxidant capacity, vitamin C,

phenolics, and anthocyanins after fresh storage of small fruits.Journal of Agricultural and Food

Chemistry 47(11), 4638-4644.

Kalt, W., Hanneken, A., Milbury, P., & Tremblay, F. (2010).Recent research on polyphenolics in

vision and eye health.Journal of Agricultural and Food Chemistry, 58(7), 4001-4007.

Kalt, W., Howell, A. B., MacKinnon, S. L. & Goldman, I. L. (2007).Selected bioactivities of

Vaccinium berries and other fruit crops in relation to their phenolic contents.Journal of the

Science of Food and Agriculture 87(12), 2279-2285.

Kalt, W., Howell, A., Duy, J. C., Forney, C. F. & McDonald, J. E. (2001). Horticultural factors

affecting antioxidant capacity of blueberries and other small fruit. HortTechnology 11(4), 523-

528.

Kalt, W., MacKinnon, S., McDonald, J., Vinqvist, M., Craft, C. & Howell, A. (2008).Phenolics

of Vaccinium berries and other fruit crops.Journal of the Science of Food and Agriculture 88(1),

68-76.

Kalt, W., McDonald, J. E. & Donner, H. (2000).anthocyanins, phenolics, and antioxidant

capacity of processed lowbush blueberry products. Journal of Food Science 65(3), 390-393.

Kalt, W., Ryan, D., Duy, J., Prior, R., Ehlenfeldt, M., Vander Kloet, S. (2001). Interspecific

variation in anthocyanins, phenolics, and antioxidant capacity among genotypes of highbush and

lowbush blueberries (Vaccinium Section cyanococcus spp.).Journal of agricultural and food

chemistry 49, 4761-4767.

100

Kechinski, C. P., Guimaraes, P. V., Norena, C. P., Tessaro, I. C., & Marczak, L. D. (2010).

Degradation kinetics of anthocyanin in blueberry juice during thermal treatment.Journal of Food

Science, 75(2), C173-6.

Khanal, R. C., Howard, L. R. & Prior, R. L. (2009).procyanidin composition of selected fruits

and fruit byproducts is affected by extraction method and variety. Journal of Agricultural and

Food Chemistry 57(19), 8839-8843.

Kim, H., Bartley, G. E., Rimando, A. M., & Yokoyama, W. (2010). Hepatic Gene Expression

Related to Lower Plasma Cholesterol in Hamsters Fed High-Fat Diets Supplemented with

Blueberry Peels and Peel Extract. Journal of Agricultural and Food Chemistry, 58(7), 3984-

3991.

Kong, J. M., Chia, L. S., Goh, N. K., Chia, T. F., & Brouillard, R. (2003).Analysis and biological

activities of anthocyanins.Phytochemistry, 64(5), 923-933.

Kowalczyk, E., Krzesinski, P., Kura, M., Szmigiel, B., & Blaszczyk, J. (2003).Anthocyanins in

medicine.Polish journal of pharmacology, 55(5), 699-702.

Krikorian, R., Shidler, M. D., Nash, T. A., Kalt, W., Vinqvist-Tymchuk, M., Shukitt-Hale, B., &

Joseph, J. A. (2010).Blueberry supplementation improves memory in older adults. Journal of

Agricultural and Food Chemistry, 58(7), 3996-4000.

Lankinen, M., Schwab, U., Kolehmainen, M., Paananen, J., Poutanen, K., Mykkänen, H.,

Seppänen-Laakso, T., Gylling, H., Uusitupa, M., & Orešič, M. (2011). Whole Grain Products,

Fish and Bilberries Alter Glucose and Lipid Metabolism in a Randomized, Controlled Trial: The

Sysdimet Study. PloS one, 6(8), e22646.

Larrauri, J. A., Ruperez, P. & Saura-Calixto, F. (1997).Effect of drying temperature on the

stability of polyphenols and antioxidant activity of red grape pomace peels.Journal of

Agricultural and Food Chemistry 45(4), 1390-1393.

Lee, J., Durst, R. W. & Wrolstad, R. E. (2002). Impact of juice processing on blueberry

anthocyanins and polyphenolics: comparison of two pretreatments. Journal of Food Science

67(5), 1660-1667.

101

Leheska, J. M., Boyce, J., Brooks, J. C., Hoover, L. C., Thompson, L. D. & Miller, M. F. (2006).

Sensory attributes and phenolic content of precooked pork breakfast sausage with fruit purées.

Journal of Food Science 71(3), S249-S252.

Lenth, R.V. (1989) Quick and easy analysis of unreplicated factorials.Technometrics 31(4), 469-

473

Levitsky A.P., Osipenko, S.B., Tsiselskiy U.V., Demyanenko S.A., Makarenko O.A.,

Selivanskaya I.A. The hepatoprotective characteristics of the paste of bilberry in the

experimental toxic hepatitis and intestinal disbiosis.Phytotherapy Journal 3, 26-30.

Littell, R. C., Henry, P. R., Ammerman, C. B. (1998) Statistical analysis of repeated measures

data using SAS procedures. Journal of animal science. 76 (4), 1216-1231

Liu, H. L., Jiang, W. B., & Xie, M. X. (2010). Flavonoids: recent advances as anticancer drugs.

Recent patents on anti-cancer drug discovery, 5(2), 152-164.

Lohachoompol, V., Srzednicki, G. & Craske, J. (2004). The change of total anthocyanins in

blueberries and their antioxidant effect after drying and freezing. Journal of Biomedicine &

Biotechnology 2004(5), 248-252.

Main, G., Faupel, M., Morris, J. & McNew, R. (2001). Quality and stability of blueberry juice

blended with apple, grape and cranberry juice. Journal of Food Quality 24(2), 111-125.

Mazza, G. (2005). Compositional and functional properties of Saskatoon berry and

blueberry.International Journal of Fruit Science, 5(3), 101-120.

Mazza, G. J. (2007). Anthocyanins and heart health.Annali dell'Istituto Superiore di Sanita,

43(4), 369-374.

McDougall, G. J., & Stewart, D. (2005).The inhibitory effects of berry polyphenols on digestive

enzymes.BioFactors (Oxford, England), 23(4), 189-195.

McGhie, T. K., & Walton, M. C. (2007). The bioavailability and absorption of anthocyanins:

towards a better understanding. Molecular nutrition & food research, 51(6), 702-713.

Minitab 15 Statistical Software (2009).[Computer software]. State College, PA, USA: Minitab,

Inc. (www.minitab.com)

102

Moon, Y. J., Wang, X., & Morris, M. E. (2006). Dietary flavonoids: effects on xenobiotic and

carcinogen metabolism. Toxicology in Vitro, 20(2), 187-210.

Neto, C. C. (2007). Cranberry and blueberry: evidence for protective effects against cancer and

vascular diseases. Molecular nutrition & food research, 51(6), 652-664.

Nichenametla, S. N., Taruscio, T. G., Barney, D. L., & Exon, J. H. (2006).A review of the effects

and mechanisms of polyphenolics in cancer.Critical reviews in food science and nutrition, 46(2),

161-183.

Nicoue, E. E., Savard, S. & Belkacemi, K. (2007). Anthocyanins in wild blueberries of Quebec:

extraction and identification. Journal of Agricultural and Food Chemistry 55(14), 5626-5635.

Norton, C., Kalea, A. Z., Harris, P. D. & Klimis-Zacas, D. J. (2005). Wild blueberry-rich diets

affect the contractile machinery of the vascular smooth muscle in the Sprague-Dawley rat.

Journal of Medicinal Food 8(1), 8-13.

Ofek, I., Goldhar, J., Zafrini, D., Lis, H., Adar, R., Sharon, N. (1991). Anti-Escherichia coli

adhesion activity of cranberry and blueberry juices.The New England journal of medicine 324,

1599.

Osipenko S.B. «Liquid blueberry, process and apparatus for producing same».U.S. Provisional

Patent Application № 61289415.Priority from 23.12.2009.

Osipenko S.B. «Method for dispergating plant seeds and device for carrying out said method».

USA PATENT № US 7,428,797 В2 from 30.09.2008.Priority from 23.12.2002.

Papandreou, M. A., Dimakopoulou, A., Linardaki, Z. I., Cordopatis, P., Klimis-Zacas, D.,

Margarity, M. & Lamari, F. N. (2009).Effect of a polyphenol-rich wild blueberry extract on

cognitive performance of mice, brain antioxidant markers and acetylcholinesterase activity

Behavioural Brain Research 198(2), 352-358.

Parada J., Aguilera J. M. (2007). Food microstructure affects the bioavailability of several

nutrients. Journal of Food Science, 72(2), 21-32.

Pascual-Teresa, S. d., & Sanchez-Ballesta, M. T. (2008).Anthocyanins: from plant to health.

Phytochemistry Reviews, 7(2), 281-299.

103

Peluso, M. R. (2006). Flavonoids attenuate cardiovascular disease, inhibit phosphodiesterase,

and modulate lipid homeostasis in adipose tissue and liver. Experimental biology and medicine

(Maywood, N.J.), 231(8), 1287-1299.

Perrissoud, D. (1986). The development of cyanidanol and 3-palmitoyl-(+)-catechin as drugs for

the treatment of liver diseases. In: V. Cody, E. Middleton & J. Harbor (Eds), Plant Flavonoids in

Biology and Medicine: Biochemical, Pharmacological, Structure-Activity Relationships (pp.

559-569). New-York: Alan R. Liss, Inc.

Pietta, P. (2000). Flavonoids as antioxidants.Journal of Natural Products 63(7), 1035-1042.

Prior, R. L., & Wu, X. (2006). Anthocyanins: structural characteristics that result in unique

metabolic patterns and biological activities. Free radical research, 40(10), 1014-1028.

Prior, R. L., Cao, G., Martin, A., Sofic, E., McEwen, J., O'Brien, C., Lischner, N., Ehlenfeldt,

M., Kalt, W., Krewer, G. & Mainland, C. M. (1998). Antioxidant capacity as influenced by total

phenolic and anthocyanin concentration, maturity, and variety of Vaccinium species. Journal of

Agricultural and Food Chemistry 46(7), 2686-2693.

Prior, R. L., Wu, X. & Schaich, K. (2005). Standardized methods for the determination of

antioxidant capacity and phenolics in foods and dietary supplements.Journal of Agricultural and

Food Chemistry 53(10), 4290-4302.

Proctor, A., and Peng, L. C. (1989). Pectin transitions during blueberry fruit development and

ripening. Journal of Food Science, 54(2), 385-387.

Queiroz, F., Oliveira, C., Pinho, O. & Ferreira, I. (2009). Degradation of anthocyanins and

anthocyanidins in blueberry jams/stuffed fish. Journal of Agricultural and Food Chemistry

57(22), 10712-10717.

Ratkowsky, D.A. (1993) Principles of nonlinear regression modeling.Journal of Industrial

Microbiology. 12, 195-199

Rice-Evans, C. A., Miller, N. J. & Paganga, G. (1996).Structure-antioxidant activity

relationships of flavonoids and phenolic acids.Free Radical Biology and Medicine 20(7), 933-

956.

104

Riihinen, K., Jaakola, L., Kärenlampi, S. & Hohtola, A. (2008).Organ-specific distribution of

phenolic compounds in bilberry (Vaccinium myrtillus) and 'northblue' blueberry (Vaccinium

corymbosum x V. angustifolium).Food Chemistry 110(1), 156-160.

Robichaud, M. (2006).Blue skies for blueberries.Vista on the Agri-Food Industry and the Farm

Community, January, 1-9.

Rubinskiene, M., Viskelis, P., Jasutiene, I., Viskeliene, R. & Bobinas, C. (2005).Impact of

various factors on the composition and stability of black currant anthocyanins.Food Research

International 38(8-9), 867-871.

SAS 9.2 Statistical Software (2008). [Computer software], Cary, NC, USA: SAS Institute, Inc.

(www.sas.com)

Schmidt, B. M., Erdman, J. W.,Jr. & Lila, M. A. (2005). Effects of food processing on blueberry

antiproliferation and antioxidant activity.Journal of Food Science 70(6), s389-s394.

Schmidt, B. M., Howell, A. B., McEniry, B., Knight, C. T., Seigler, D., Erdman, John W. & Lila,

M. A. (2004).Effective separation of potent antiproliferation and antiadhesion components from

wild blueberry (Vaccinium angustifolium Ait.) fruits.Journal of Agricultural and Food

Chemistry 52(21), 6433-6442.

Schreiner, M. & Huyskens-Keil, S. (May-June 2006). Phytochemicals in fruit and vegetables:

health promotion and postharvest elicitors. Critical Reviews in Plant Sciences Volume

25(Number 3), 267-278.

Seeram, N. P. (2008). Berry fruits for cancer prevention: current status and future prospects.

Journal of Agricultural and Food Chemistry 56(3), 630-635.

Seeram, N. P., Adams, L. S., Zhang, Y., Lee, R., Sand, D., Scheuller, H. S. & Heber, D.

(2006).blackberry, black raspberry, blueberry, cranberry, red raspberry, and strawberry extracts

inhibit growth and stimulate apoptosis of human cancer cells in vitro. Journal of Agricultural

and Food Chemistry 54(25), 9329-9339.

Shi, J., Mazza, G., LeMaguer, M (2002). Functional foods: biochemical and processing aspects.

Shukitt-Hale, B., Lau, F. C. & Joseph, J. A. (2008). Berry fruit supplementation and the aging

brain. Journal of Agricultural and Food Chemistry 56(3), 636-641.

105

Silva, J. L., Marroquin, E., Matta, F. B., Garner, J. O.,Jr. and Stojanovic, J. (2005).

Physicochemical, carbohydrate and sensory characteristics of highbush and rabbiteye blueberry

cultivars.Journal of the Science of Food and Agriculture 85(11), 1815-1821.

Simmen, F. A., Frank, J. A., Wu, X., Xiao, R., Hennings, L. J., & Prior, R. L. (2009).Lack of

efficacy of blueberry in nutritional prevention of azoxymethane-initiated cancers of rat small

intestine and colon.BMC gastroenterology, 9, 67.

Singleton, V. L., & Rossi Jr., J. A. (1965).Colorimetry of total phenolics with phosphomolybdic-

phosphotungstic acid reagents.American Journal of Enology and Viticulture, 16(3), 144-158.

Skrede, G., Wrolstad, R. E. & Durst, R. W. (2000).Changes in anthocyanins and polyphenolics

during juice processing of highbush blueberries (Vaccinium corymbosum L.).Journal of Food

Science 65(2), 357-364.

Smith, M. A. L., Marley, K. A., Seigler, D., Singletary, K. W. & Meline, B. (2000).bioactive

properties of wild blueberry fruits. Journal of Food Science 65(2), 352-356.

Spencer, J. P. (2010). The impact of fruit flavonoids on memory and cognition.The British

journal of nutrition, 104 Suppl 3, S40-7.

Srivastava, A., Akoh, C. C., Yi, W., Fischer, J. & Krewer, G. (2007). Effect of storage conditions

on the biological activity of phenolic compounds of blueberry extract packed in glass bottles.

Journal of Agricultural and Food Chemistry 55(7), 2705-2713.

Stewart, K. (1996). Processing of cranberry, blueberry, currant, and gooseberry. In: Somogyi,

L.P., Barrett, D.M., Hui, Y.H (Ed), Processing fruits: Science and Technology, Vol. 2: Major

processed products (pp. 159 - 195): Lancaster, PA: Technomic Publishing Co., Inc.

Stintzing, F. C. & Carle, R. (2004).Functional properties of anthocyanins and betalains in plants,

food, and in human nutrition.Trends in Food Science and Technology 15(1), 19-38.

Stoclet, J. C., & Schini-Kerth, V. (2011).Dietary flavonoids and human health.Annales

Pharmaceutiques Francaises, 69(2), 78-90.

Strik, B. (2005). Blueberry: an expanding world berry crop. Horticultural Science Focus, 45(1),

7-12.

106

Strik, B. and Yarborough, D. (2005). Blueberry production trends in North America, 1992 to

2003, and prediction for growth. HortTechnology, 15(2), 391-398.

Su, M. & Chien, P. (2007).Antioxidant activity, anthocyanins, and phenolics of rabbiteye

blueberry (Vaccinium ashei) fluid products as affected by fermentation.Food Chemistry 104(1),

182-187.

Sweeney, M. I., Kalt, W., MacKinnon, S. L., Ashby, J. & Gottschall-Pass, K. T. (2002). Feeding

rats diets enriched in lowbush blueberries for six weeks decreases ischemia-induced brain

damage. Nutritional Neuroscience 5(6), 427-431.

Szajdek, A. & Borowska, E. J. (2008). Bioactive compounds and health-promoting properties of

berry fruits: a review. Plant Foods for Human Nutrition (Dordrecht, Netherlands) 63(4), 147-

156.

Szajdek, A., & Borowska, E. J. (2008). Bioactive compounds and health-promoting properties of

berry fruits: a review. Plant foods for human nutrition (Dordrecht, Netherlands), 63(4), 147-156.

Talavera, S., Felgines, C., Texier, O., Besson, C., Gil-Izquierdo, A., Lamaison, J. & Remesy, C.

(2005).Anthocyanin metabolism in rats and their distribution to digestive area, kidney, and

brain.Journal of Agricultural and Food Chemistry 53(10), 3902-3908.

Tapiero, H., Tew, K. D., Ba, G. N., & Mathe, G. (2002). Polyphenols: do they play a role in the

prevention of human pathologies? Biomedicine & pharmacotherapy, 56(4), 200-207.

Taruscio, T. G., Barney, D. L. & Exon, J. (2004).content and profile of flavanoid and phenolic

acid compounds in conjunction with the antioxidant capacity for a variety of Northwest

Vaccinium berries. Journal of Agricultural and Food Chemistry 52(10), 3169-3176.

Thomasset, S., Teller, N., Cai, H., Marko, D., Berry, D. P., Steward, W. P., & Gescher, A. J.

(2009). Do anthocyanins and anthocyanidins, cancer chemopreventive pigments in the diet, merit

development as potential drugs? Cancer chemotherapy and pharmacology, 64(1), 201-211.

Varma, S.D. (1986). Inhibition of Aldose Reductase by Flavonoids: Possible attenuation of

diabetic complication. In: Cody, V., Middleton, E., Harborn, J. (Ed), Plant Flavonoids in Biology

and Medicine: Biochemical, Pharmacological, Structure-Activity Relationships (pp. 343-358).

New-York: Alan R. Liss, Inc.

107

Villata, M. (1998). Cultivated blueberries: a true-blue baking ingredient. Cereal Foods World,

43(3), 127-130.

Vuong, T., Benhaddou-Andaloussi, A., Brault, A., Harbilas, D., Martineau, L. C., Vallerand, D.,

Ramassamy, C., Matar, C., & Haddad, P. S. (2009).Antiobesity and antidiabetic effects of

biotransformed blueberry juice in KKAy mice.International journal of obesity, 33(10), 1166-

1173.

Vuong, T., Martin, L., & Matar, C. (2006). Antioxidant activity of fermented berry juices and

their effects on nitric oxide and tumor necrosis factor-alpha production in macrophages 264.7

gamma NO(-) cell line. Journal of Food Biochemistry, 30(3), 249-268.

Vuong, T., Martineau, L., Ramassamy, C., Matar, C., & Haddad, P. (2007). Fermented Canadian

lowbush blueberry juice stimulates glucose uptake and AMP-activated protein kinase in insulin-

sensitive cultured muscle cells and adipocytes. Canadian Journal of Physiology and

Pharmacology, 85, 956-965.

Wagner, H. (1986). Antihepatoxic flavonoids. In: V. Cody, E. Middleton & J. Harborn (Eds),

Plant Flavonoids in Biology and Medicine: Biochemical, Pharmacological, Structure-Activity

Relationships (pp. 545-558). New-York: Alan R. Liss, Inc.

Wang, B. C., He, R., & Li, Z. M. (2010). The stability and antioxidant activity of anthocyanins

from blueberry.Food Technology and Biotechnology, 48(1), 42-49.

Wang, H., Cao, G. & Prior, R. L. (1996).Total antioxidant capacity of fruits. Journal of

Agricultural and Food Chemistry 44(3), 701-705.

Wang, L. S., & Stoner, G. D. (2008).Anthocyanins and their role in cancer prevention.Cancer

letters, 269(2), 281-290.

Wang, S. Y., Chen, C., Sciarappa, W., Wang, C. Y. & Camp, M. J. (2008). Fruit quality,

antioxidant capacity, and flavonoid content of organically and conventionally grown blueberries.

Journal of Agricultural and Food Chemistry 56(14), 5788-5794.

Wang, W. & Xu, S. (2007). Degradation kinetics of anthocyanins in blackberry juice and

concentrate.Journal of Food Engineering 82(3), 271-275.

108

Wang, Y. P., Cheng, M. L., Zhang, B. F., Mu, M., Zhou, M. Y., Wu, J., & Li, C. X.

(2010).Effect of blueberry on hepatic and immunological functions in mice.Hepatobiliary &

pancreatic diseases international, 9(2), 164-168.

Wightman, J. D., & Wrolstad, R. E. (1996).β-glucosidase Activity in juice-processing enzymes

based on anthocyanin analysis. Journal of food science, 61(3), 544-548.

Wightman, J. D., & Wrolstad, R. E. (1996).β-glucosidase activity in juice-processing enzymes

based on anthocyanin analysis. Journal of food science, 61(3), 544-548.

Willis, L. M., Shukitt-Hale, B., & Joseph, J. A. (2009). Recent advances in berry

supplementation and age-related cognitive decline. Current opinion in clinical nutrition and

metabolic care, 12(1), 91-94.

Wiseman, W., Egan, J. M., Slemmer, J. E., Shaughnessy, K. S., Ballem, K., Gottschall-Pass, K.

T., & Sweeney, M. I. (2011). Feeding blueberry diets inhibits angiotensin II-converting enzyme

(ACE) activity in spontaneously hypertensive stroke-prone rats. Canadian Journal of Physiology

and Pharmacology, 89(1), 67-71.

Wolfe, K. L., Kang, X., He, X., Dong, M., Zhang, Q. & Liu, R. H. (2008).Cellular antioxidant

activity of common fruits.Journal of Agricultural and Food Chemistry 56(18), 8418-8426.

Wrolfstadt, R.E. (1976). Color and pigment analyses in fruit products.AES, Oregon State

University Station Bulletin 624, 1-17.

Wrolstad, R. E. Anthocyanins. In Natural Food Colorants. Science and Technology (pp. 237-

252). New York: Marcel Dekker, Ink.

Wrolstad, R. E., Durst, R. W. & Lee, J. (2005).Tracking color and pigment changes in

anthocyanin products.Trends in Food Science & Technology 16(9), 423-428.

Wu, X., Beecher, G. R., Holden, J. M., Haytowitz, D. B., Gebhardt, S. E. & Prior, R. L. (2004).

Lipophilic and hydrophilic antioxidant capacities of common foods in the united states. Journal

of Agricultural and Food Chemistry 52(12), 4026-4037.

Wu, X., Gu, L., Holden, J., Haytowitz, D. B., Gebhardt, S. E., Beecher, G. & Prior, R. L. (2006).

Development of a database for total antioxidant capacity in foods: a preliminary study. Journal

of Food Composition and Analysis 17(3-4), 407-422.

109

Zafra-Stone S., Manashi, B. & Debasis, B. (2007a). Health benefits of edible berry anthocyanins:

novel antioxidant and anti-angiogenic properties. In: Anonymous Antioxidant Measurement and

Applications (pp. 337-351). Washington, DC: American Chemical Society.

Zafra-Stone, S., Yasmin, T., Bagchi, M., Chatterjee, A., Vinson, J. A., and Bagchi,D. (2007b).

Berry anthocyanins as novel antioxidants in human health and disease prevention. Molecular

nutrition & food research, 51(6), 675-683.


Recommended