Page 1
OPTIMIZATION OF PAINT SHOP DEPARTMENT USING DISCRETE EVENT
SIMULATION
Pavel Raska(a), Zdenek Ulrych(b)
(a) Department of Industrial Engineering - Faculty of Mechanical Engineering, University of West Bohemia,
Univerzitni 22, 306 14 Pilsen (b) Department of Industrial Engineering - Faculty of Mechanical Engineering, University of West Bohemia,
Univerzitni 22, 306 14 Pilsen
(a)[email protected] , (b) [email protected] ,
ABSTRACT
The paper deals with a realistic simulation case study
focused on the optimization of the production processes
of products staining. The simulation study is focused on
the validation of various options for increasing the total
production quantity of the production system. The goal
of the simulation study is to validate the planned
investment and also verify other possible measures
leading to an overall increase of the production of the
paint shop department.
Keywords: optimization, paint shop, discrete event
simulation, simulation model
1. INTRODUCTION
Using simulation in the optimization of the production
processes is well known (Boysen, Scholl, and Wopperer,
2012; Frank, Laroque, and Uhlig, 2013; Gopalakrishnan,
Skoogh, and Laroque, 2014; Jahangirian, Eldabi, Naseer,
Stergioulas, and Young, 2010; Longo, Massei, and
Nicoletti, 2012; Rabbani, Ahmad, Baladi, and Khan,
2013; Scholl, Laroque, and Weigert, 2014; Su, Fu, Tan,
and Hu, 2010). It is possible to achieve various levels of
performance of the whole system by choosing various
configurations of the production systems (Ulrych,
Votava, Raska, and Horejsi, 2013). Simulation can verify
which measures should be implemented in a given
company with a given structure and production volume.
The paper deals with the modelling and simulation of a
paint shop. Designing a paint shop is usually difficult, if
we need to ensure its maximum throughput. Using
simulation models to describe paint shop optimization
problems is covered in many papers, e.g. (Arinez, Biller,
and Meerkov, 2010; Cheng and Park, 2010; Lemessi,
Schulze, and Rehbein, 2011; Lemessi, Rehbein, and
Rehn, WSC 2012, 2012; Li, Blumenfeld, and Marin,
2007).
The Department of Industrial Engineering and
Management at the University of West Bohemia has been
dealing with discrete event simulation and optimization
of production processes for several years. Various results
of simulation studies have been published e.g. (Horejsi,
Horejsi, Latif, and Ulrych, 2011; Raska and Ulrych,
EMSS 2014, 2014; Votava, Ulrych, Edl, Korecky, and
Trkovsky, 2008).
The second area of interest we are intensively engaged
in, is the use of various algorithms applicable to
optimization of the discrete simulation, e.g. (Raska and
Ulrych, 2015).
2. SIMULATION MODEL DESCRIPTION
This paper deals with the optimization of a paint shop
department where various types of products of different
materials are dyed. The products range in size from tens
of centimetres to approximately four meters long.
The modelled production system consists of a series of
workplaces. Transportation between workplaces is
performed by chains strung on defined paths. The chains
designed for towing a girder are approximately two
kilometres long. Chains are used for conveying the
hanging girder, which carries the products. Each type of
product passes through different workplaces of the paint
shop department according to its painting program.
There are dozens of painting programs.
2.1. Workplaces in the Paint shop Department
Basic modelled painting workplaces are:
Hanging on girder - the products are hung on the
girder. Number of hung products depends on the
size of the product and product type. Selecting
a painting program determines the product path,
sequence of workplaces and processing times.
Furthermore, the chemical preparation program
has to be selected
Sandblasting – this workplace is only used for
some of the painting programs. Sandblasting
time depends mainly on the size and number of
parts
Chemical preparation - products pass through
several successive chemical preparation
chambers. The processing times in different
chambers depend on the selected chemical
preparations program (some of products just
pass through the chamber)
Proceedings of the European Modeling and Simulation Symposium, 2016 978-88-97999-76-8; Bruzzone, Jiménez, Longo, Louca and Zhang Eds.
62
Page 2
Drying furnace - drying time depends on the
selected painting program. All the products
hung on more girders are dried according to the
maximum capacity of the drying furnace
Paint booths – there are several paint booths at
the workplace. Each paint booth applies a
specific powder coating (base coat, second and
another layer, or colour variants). It is possible
to ensure partial interchangeability of the
individual paint booths.
Kiln - firing time depends on the selected
painting program. All the products hung on
more girders are fired according to the
maximum capacity of the kiln. Girders in the
kiln cannot overtake each other.
Cooling – there must be some time for cooling
the products after the firing phase. The
container for this purpose is located behind the
kiln.
Removing - The last workplace in the circuit is
where the product is removed. Products are
removed from the girder and the girder is sent
back to the container, which is located in front
of the workplace where products are hung on
the girder.
The basic scheme of material flow of the paint shop
workplaces is shown in Figure 1. Green arrows represent
input/output of material to/from the paint shop
department workplaces. Before each workplace is a
buffer defined by its maximum capacity.
Depending on the painting program, the girder can pass
through some workplaces several times.
Figure 1: Material Flow of the Paint Shop Workplaces
3. BUILT SIMULATION MODEL
The simulation model was built by Plant Simulation
software version 12.1. It was created hierarchically using
the principles of object-oriented programming. The
following figure shows an example of a class of
sandblasting workplace where there are two sandblasting
chambers - Figure 2. Thus it is possible to sandblast the
two girders at once. This sample class is used in the
model several times depending on the required number
of this workplace in the system that is being modelled.
Figure 2: Sandblasting Workplace Class
The most difficult class model used in this model is a
class representing a section of the path of girder - Figure
3. This sample class path is inherited from the "Track"
class that is used for modelling a path for e.g. forklifts or
Automated Guided Vehicles. We can see only a small
part of the defined user attributes and the programming
method, which assures the behaviour of the girder in the
circuit according to the set attributes of the selected path
and according to the selected painting program of the
girder. Built-in user-defined methods can provide:
Stopper control - whether the girder stops e.g.
when reaching the maximum capacity of the
next section; whether a girder can start moving
- free capacity of the next section; defined rules
of the crossroad (FIFO, according to priority,
etc.); the time needed to hook a girder on a hook
located on a chain
Girder rotation – girder can keep going
longitudinally or transversely (usually in the
magazine)
Collecting statistics - especially statistics on
blocking path
Controlling of intersections - which way a
girder will go
etc.
Figure 3: Class for Modelling Path
Sandblasting Chemical
preparation
Drying
furnace Paint booths Kiln
Cooling Removing
Hanging on
girder
Proceedings of the European Modeling and Simulation Symposium, 2016 978-88-97999-76-8; Bruzzone, Jiménez, Longo, Louca and Zhang Eds.
63
Page 3
The following figure shows only a small part of the
simulated system, including the defined animations -
Figure 4. The animation shows the following attributes:
The girder - which type of product is hung on
the girder (colour); the size of hung products
(size of coloured rectangle)
Stopper on the path - the chart containing the
percentage of blocking on the girder (girder
cannot continue moving on defined path);
Buffers - histogram of buffer occupation
Checkboxes - used for setting a combination of
simulated variants
Figure 4: Animation of Simulated System
A detailed description of the simulation model and the
values of the input parameters cannot be given due to the
legal restrictions of the contract.
4. SIMULATION OF PRODUCTION
OPTIMIZATION
The goal of this study was to find the appropriate
measures to increase the production flow in the paint
shop. Measures to be simulated can be defined as
follows:
Resize selected buffers before workplace
(estimated investment)
Possible changes to the path (planned
investment)
Logic of intersection control (path priority)
Logic of possible path change according to
current occupancy lanes on the path
Change the logic of defining the path according
to the painting program
Change the logic of selection of paint booths
according to current buffers occupancy located
before paint booth than the selection of paint
booths specified in the painting program.
4.1. Modelled measures
The goal of this simulation study was to find ways to
increase the flow of products through the paint shop
department. We tested a number of possible measures,
which could lead to an increased flow rate:
Resize selected buffers before workplaces -
identification of possible buffers where capacity
can be increased, considering their area. These
measures focus on changing the positions of the
stoppers and the control software of the product
path. The product path remains the same. Using
these measures, it is possible to place more
girders between the stoppers instead of one
girder
Possible changes to the path - the influence of
planned investment in the creation of new
transport paths connecting some workplaces. It
is possible to shorten the length of the transport
paths for some painting programmes
Logic of intersection control (path priority) –
testing the control system of selected
intersections where multiple paths from the
various workplaces are merged into one path.
We tested the effects of the advantages of
individual input paths. Tested variants were:
o FIFO Method – right of way of first
girder to arrive at an intersection
o Priority path - each path received a
priority for entry of the girder into an
intersection
Logic of possible path change according to
current occupancy of lanes on the path - there
were a number of duplicate workplaces with
various transport paths. The painting
programme clearly identifies the target
workplace. We tested the control of sending the
girder to a duplicate workplace if the buffer
before the workplace specified by the painting
programme is full (the buffer of the duplicate
workplace cannot also be full)
Change the logic of defining the path according
to the painting programme – we tested the
impact of a predefined path change on the
painting programme. We mainly focused on an
alternative workplace specified in the painting
programme and the change of the selected path
to this workplace
Possible change of the logic of paint booth
selection according to the fullness of the buffer
located in front of a paint booth instead of
definition in the painting programme – some
paint booths have a partial interchangeability.
We tested the impact on overall production of
the selection of an alternative paint booth if the
buffer in front of a paint booth is full (the buffer
of an alternative paint booth is partially filled)
We tested other measures such as the impact of the shift
model on individual workplaces, impact of the
production structure of products on the overall
production capacity, etc.
Proceedings of the European Modeling and Simulation Symposium, 2016 978-88-97999-76-8; Bruzzone, Jiménez, Longo, Louca and Zhang Eds.
64
Page 4
4.2. Conclusions from the Simulation Model
A simulation model was validated on the historical data
from a company. We validated whether the model
showed the same outputs as the already implemented
production. We set the following parameters for
validation of the model:
The structure and the volume of products
entering the workplace at a defined time
according to the data from the information
system
Setting workplaces
o The shift model
o Times of operation
o Number of duplicate workplaces
The logic of control of transport paths
A pre-defined standardized HTML report of each
simulated variant is automatically exported at the end of
the simulation. This report contains settings and all
relevant results from the simulation.
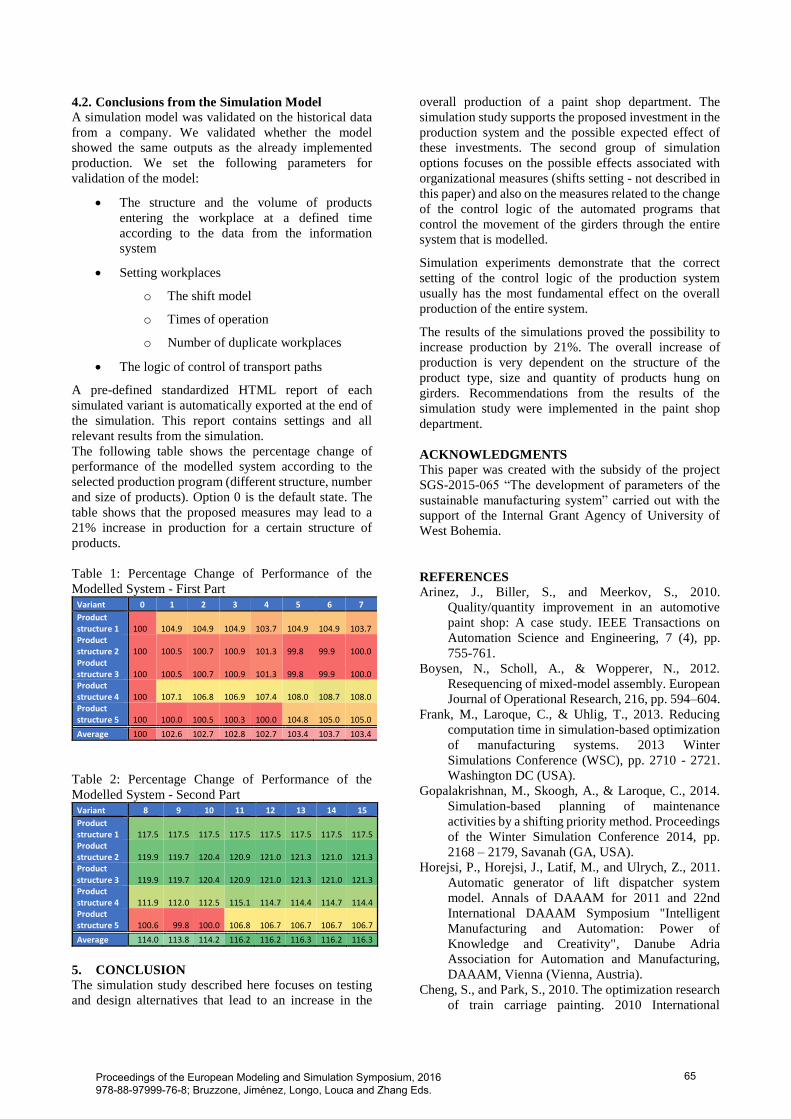
The following table shows the percentage change of
performance of the modelled system according to the
selected production program (different structure, number
and size of products). Option 0 is the default state. The
table shows that the proposed measures may lead to a
21% increase in production for a certain structure of
products.
Table 1: Percentage Change of Performance of the
Modelled System - First Part Variant 0 1 2 3 4 5 6 7
Product structure 1 100 104.9 104.9 104.9 103.7 104.9 104.9 103.7 Product structure 2 100 100.5 100.7 100.9 101.3 99.8 99.9 100.0 Product structure 3 100 100.5 100.7 100.9 101.3 99.8 99.9 100.0 Product structure 4 100 107.1 106.8 106.9 107.4 108.0 108.7 108.0 Product structure 5 100 100.0 100.5 100.3 100.0 104.8 105.0 105.0
Average 100 102.6 102.7 102.8 102.7 103.4 103.7 103.4
Table 2: Percentage Change of Performance of the
Modelled System - Second Part Variant 8 9 10 11 12 13 14 15
Product structure 1 117.5 117.5 117.5 117.5 117.5 117.5 117.5 117.5 Product structure 2 119.9 119.7 120.4 120.9 121.0 121.3 121.0 121.3 Product structure 3 119.9 119.7 120.4 120.9 121.0 121.3 121.0 121.3 Product structure 4 111.9 112.0 112.5 115.1 114.7 114.4 114.7 114.4 Product structure 5 100.6 99.8 100.0 106.8 106.7 106.7 106.7 106.7
Average 114.0 113.8 114.2 116.2 116.2 116.3 116.2 116.3
5. CONCLUSION
The simulation study described here focuses on testing
and design alternatives that lead to an increase in the
overall production of a paint shop department. The
simulation study supports the proposed investment in the
production system and the possible expected effect of
these investments. The second group of simulation
options focuses on the possible effects associated with
organizational measures (shifts setting - not described in
this paper) and also on the measures related to the change
of the control logic of the automated programs that
control the movement of the girders through the entire
system that is modelled.
Simulation experiments demonstrate that the correct
setting of the control logic of the production system
usually has the most fundamental effect on the overall
production of the entire system.
The results of the simulations proved the possibility to
increase production by 21%. The overall increase of
production is very dependent on the structure of the
product type, size and quantity of products hung on
girders. Recommendations from the results of the
simulation study were implemented in the paint shop
department.
ACKNOWLEDGMENTS
This paper was created with the subsidy of the project
SGS-2015-065 “The development of parameters of the
sustainable manufacturing system” carried out with the
support of the Internal Grant Agency of University of
West Bohemia.
REFERENCES
Arinez, J., Biller, S., and Meerkov, S., 2010.
Quality/quantity improvement in an automotive
paint shop: A case study. IEEE Transactions on
Automation Science and Engineering, 7 (4), pp.
755-761.
Boysen, N., Scholl, A., & Wopperer, N., 2012.
Resequencing of mixed-model assembly. European
Journal of Operational Research, 216, pp. 594–604.
Frank, M., Laroque, C., & Uhlig, T., 2013. Reducing
computation time in simulation-based optimization
of manufacturing systems. 2013 Winter
Simulations Conference (WSC), pp. 2710 - 2721.
Washington DC (USA).
Gopalakrishnan, M., Skoogh, A., & Laroque, C., 2014.
Simulation-based planning of maintenance
activities by a shifting priority method. Proceedings
of the Winter Simulation Conference 2014, pp.
2168 – 2179, Savanah (GA, USA).
Horejsi, P., Horejsi, J., Latif, M., and Ulrych, Z., 2011.
Automatic generator of lift dispatcher system
model. Annals of DAAAM for 2011 and 22nd
International DAAAM Symposium "Intelligent
Manufacturing and Automation: Power of
Knowledge and Creativity", Danube Adria
Association for Automation and Manufacturing,
DAAAM, Vienna (Vienna, Austria).
Cheng, S., and Park, S., 2010. The optimization research
of train carriage painting. 2010 International
Proceedings of the European Modeling and Simulation Symposium, 2016 978-88-97999-76-8; Bruzzone, Jiménez, Longo, Louca and Zhang Eds.
65
Page 5
Conference on Machine Learning and Cybernetics,
Volume 3, pp. 1258 – 1263, Qingdao (China).
Jahangirian, M., Eldabi, T., Naseer, A., Stergioulas, L.
K., and Young, T., 2010. Simulation in
manufacturing and business: A review. European
Journal of Operational Research, 203(1), pp. 1-13.
Lemessi, M., Rehbein, S., and Rehn, G., 2012. Semi-
automatic simulation-based bottleneck detection
approach. 2012 Winter Simulation Conference, pp.
1 - 12. Institute of Electrical and Electronics
Engineers Inc.
Lemessi, M., Schulze, T., and Rehbein, S., 2011.
Simulation-based optimization of paint shops. 2011
Winter Simulation Conference, WSC 2011, pp.
2346-2357. Phoenix (Phoenix, AZ, United States)
Li, J., Blumenfeld, D. E., and Marin, S. P., 2007.
Manufacturing System Design to Improve Quality
Buy Rate: An Automotive Paint Shop Application
Study. Automation Science and Engineering, 4(1),
pp. 75 - 79. January.
Longo, F., Massei, M., and Nicoletti, L., March 2012.
An application of modeling and simulation to
support industrial plants design. International
Journal of Modeling, Simulation, and Scientific
Computing, 3(1).
Rabbani, M. J., Ahmad, F. M., Baladi, J., & Khan, Y. A.,
2013. Modeling and simulation approach for an
industrial manufacturing execution system. Third
Iternational Conference on System Engineering
And Technology (ICSET), pp. 26-31, Shah Alam
(Malaysia).
Raska, P., and Ulrych, Z., 2014. Hierarchical approach to
developing a logistic discrete event simulation
model using Automated Guided Vehicles. 26th
European Modeling and Simulation Symposium,
pp. 205-211. Bordeaux (France).
Raska, P., and Ulrych, Z., 2015. Comparison of
optimisation methods tested on testing functions
and discrete event simulation models. International
Journal of Simulation and Process Modelling,
10(3), pp. 279-293.
Scholl, W., Laroque, C., & Weigert, G., 2014.
Evaluations on scheduling in semiconductor
manufacturing by backward simulation.
Proceedings of the Winter Simulation Conference
2014, pp. 2552 - 2560. Savanah (GA, USA).
Su, Z., Fu, Y., Tan, G., & Hu, Y., 2010. Application of
Discrete-Event Simulation in Distribution Center
Design Procedure: Framework & Cases Study.
2010 International Conference on E-Product E-
Service and E-Entertainment (ICEEE), pp. 1-4,
Henan (China).
Ulrych, Z., Votava, V., Raska, P., Horejsi, P., 2013.
Simulation of production systems and processes.
Pilsen, Czech Republic: SmartMotion.
Votava, V., Ulrych, Z., Edl, M., Korecky, M., and
Trkovsky, V., 2008. Analysis and optimization of
complex small-lot production in new
manufacturing facilities based on discrete
simulation. 20th European Modeling and
Simulation Symposium, pp. 198-203. Amantea
(CS, Italy).
AUTHORS’ BIOGRAPHIES
Pavel Raska is Doctor at the Department of Industrial
Engineering and Management at the University of West
Bohemia in Pilsen (Czech Republic). He holds M.Sc.,
Ph.D. in Mechanical Engineering at the same university.
His research interests are oriented towards discrete event
simulation, simulation optimization, modelling and
simulation tools (ARENA, Plant Simulation) and
working on practical simulation projects for companies.
Zdenek Ulrych is Associate Professor at the Department
of Industrial Engineering and Management at the
University of West Bohemia in Plzen and he is also a
research worker in the Regional Technological Institute
at the University of West Bohemia in Pilsen (Czech
Republic). He holds M.Sc., Ph.D. and doc. in Mechanical
Engineering at the same university. His research interests
are oriented towards discrete event simulation,
optimization in the simulation, modelling and simulation
tools (ARENA, Plant Simulation), design and
development of software and working on practical
simulation projects for companies.
Proceedings of the European Modeling and Simulation Symposium, 2016 978-88-97999-76-8; Bruzzone, Jiménez, Longo, Louca and Zhang Eds.
66