Optimized and high efficiency biofouling protection for oceanographic optical devices Authors : Delauney Laurent (1), Boukerma Kada (1), Debeaumont Mathieu (1), Forest Bertrand (1), Peleau Michel (1), Pavanello Giovanni (2); Marco Faimali (3) (1): Ifremer Centre de Brest, ZI de la pointe du Diable, CS 10070, 29280 PLOUZANE, FRANCE. Research and Technological Development Unit; Detection, Measurement and Sensors Laboratory (REM/RDT/LDCM). (2): ALVIM Srl, Via Carducci 3/16, 16121 Genova (Italy) (3): CNR ISMAR, Institute of Marine Science - National Research Council, Via De Marini, 6 - IV P. - 16149 - GE (IT) Biofouling protection of oceanographic sensors and optical devices, a need for in situ monitoring Oceans environmental monitoring and seafloor exploitation need in situ sensors and optical devices (cameras, lights) in various locations and on various carriers in order to initiate and to calibrate environmental models or to operate underwater industrial process supervision. For more than 10 years Ifremer deploys in situ monitoring systems for various seawater parameters and in situ observation systems based on lights and HD Cameras. To be economically operational, these systems must be equipped with a biofouling protection dedicated to the sensors and optical devices used in situ. Indeed, biofouling, in less than 15 days [1] will modify the transducing interfaces of the sensors and causes unacceptable bias on the measurements provided by the in situ monitoring system. In the same way biofouling will decrease the optical properties of windows and thus altering the lighting and the quality of the images recorded by the camera. It is acknowledged that a coastal monitoring system must be able to run without maintenance for 3 months [4-5] in order for the system to be economically acceptable. For deep-sea observatories, actual maintenance interval on the Canadian Venus system is 6 months. ESONET, the European network of excellence for deep-sea observatories defines maintenance interval recommendation from 12 up to 36 months. Protection strategies adopted by oceanographic sensors manufacturers rely on two methods [1]. One first method is classified as active and is based on wipers. This technique presents a weakness, after 1 month in sea water the material used for the wiper is getting ineffective due to its deterioration. Moreover, the design of the sensor-transducing interface must be adapted to allow the wiper to work properly, which is sometime impossible. Another technology, classified as passive consists to coat surfaces that need to be protected with copper. This technique works quite well when a close cell can be arranged around the area to be protected. But, for some measurements, for example for dissolved oxygen monitoring, copper ions can disrupt the measurement process and cause bias on the provided measurements. Recently, the Canadian company AML has proposed a UV irradiation biofouling protection scheme for sensors. The system, called UV•Xchange 1 , is based on UV Bulbs that irradiates the area to be protected. In some situations, where energy is not too much a concern 2 , this solution seems to be be a good choice. Ifremer, in order to protect the sensors and optical devices against biofouling for the in situ oceanographic monitoring systems uses a method derived from industrial applications and based on seawater electrolysis to produce hypochloric acid [2]. This method has been successfully applied in various monitoring applications. For example, for the Marel or Molit 1 http://www.amloceanographic.com/CTD-Sound-Velocity-Environmental-Instrumentation-Home/UVXchange 2 UV•Xchange consumption : 100mA up to 190mA (12-26V) depending of the version.
Transcript
Optimized and high efficiency biofouling protection for oceanographic optical devices Authors : Delauney Laurent (1), Boukerma Kada (1), Debeaumont Mathieu (1), Forest Bertrand (1), Peleau Michel (1), Pavanello Giovanni (2); Marco Faimali (3) (1): Ifremer Centre de Brest, ZI de la pointe du Diable, CS 10070, 29280 PLOUZANE, FRANCE. Research and Technological Development Unit; Detection, Measurement and Sensors Laboratory (REM/RDT/LDCM). (2): ALVIM Srl, Via Carducci 3/16, 16121 Genova (Italy) (3): CNR ISMAR, Institute of Marine Science - National Research Council, Via De Marini, 6 - IV P. - 16149 - GE (IT) Biofouling protection of oceanographic sensors and optical devices, a need for in situ monitoring Oceans environmental monitoring and seafloor exploitation need in situ sensors and optical devices (cameras, lights) in various locations and on various carriers in order to initiate and to calibrate environmental models or to operate underwater industrial process supervision. For more than 10 years Ifremer deploys in situ monitoring systems for various seawater parameters and in situ observation systems based on lights and HD Cameras. To be economically operational, these systems must be equipped with a biofouling protection dedicated to the sensors and optical devices used in situ. Indeed, biofouling, in less than 15 days [1] will modify the transducing interfaces of the sensors and causes unacceptable bias on the measurements provided by the in situ monitoring system. In the same way biofouling will decrease the optical properties of windows and thus altering the lighting and the quality of the images recorded by the camera. It is acknowledged that a coastal monitoring system must be able to run without maintenance for 3 months [4-5] in order for the system to be economically acceptable. For deep-sea observatories, actual maintenance interval on the Canadian Venus system is 6 months. ESONET, the European network of excellence for deep-sea observatories defines maintenance interval recommendation from 12 up to 36 months. Protection strategies adopted by oceanographic sensors manufacturers rely on two methods [1]. One first method is classified as active and is based on wipers. This technique presents a weakness, after 1 month in sea water the material used for the wiper is getting ineffective due to its deterioration. Moreover, the design of the sensor-transducing interface must be adapted to allow the wiper to work properly, which is sometime impossible. Another technology, classified as passive consists to coat surfaces that need to be protected with copper. This technique works quite well when a close cell can be arranged around the area to be protected. But, for some measurements, for example for dissolved oxygen monitoring, copper ions can disrupt the measurement process and cause bias on the provided measurements. Recently, the Canadian company AML has proposed a UV irradiation biofouling protection scheme for sensors. The system, called UV•Xchange1, is based on UV Bulbs that irradiates the area to be protected. In some situations, where energy is not too much a concern2, this solution seems to be be a good choice. Ifremer, in order to protect the sensors and optical devices against biofouling for the in situ oceanographic monitoring systems uses a method derived from industrial applications and based on seawater electrolysis to produce hypochloric acid [2]. This method has been successfully applied in various monitoring applications. For example, for the Marel or Molit 1 http://www.amloceanographic.com/CTD-Sound-Velocity-Environmental-Instrumentation-Home/UVXchange 2 UV•Xchange consumption : 100mA up to 190mA (12-26V) depending of the version.
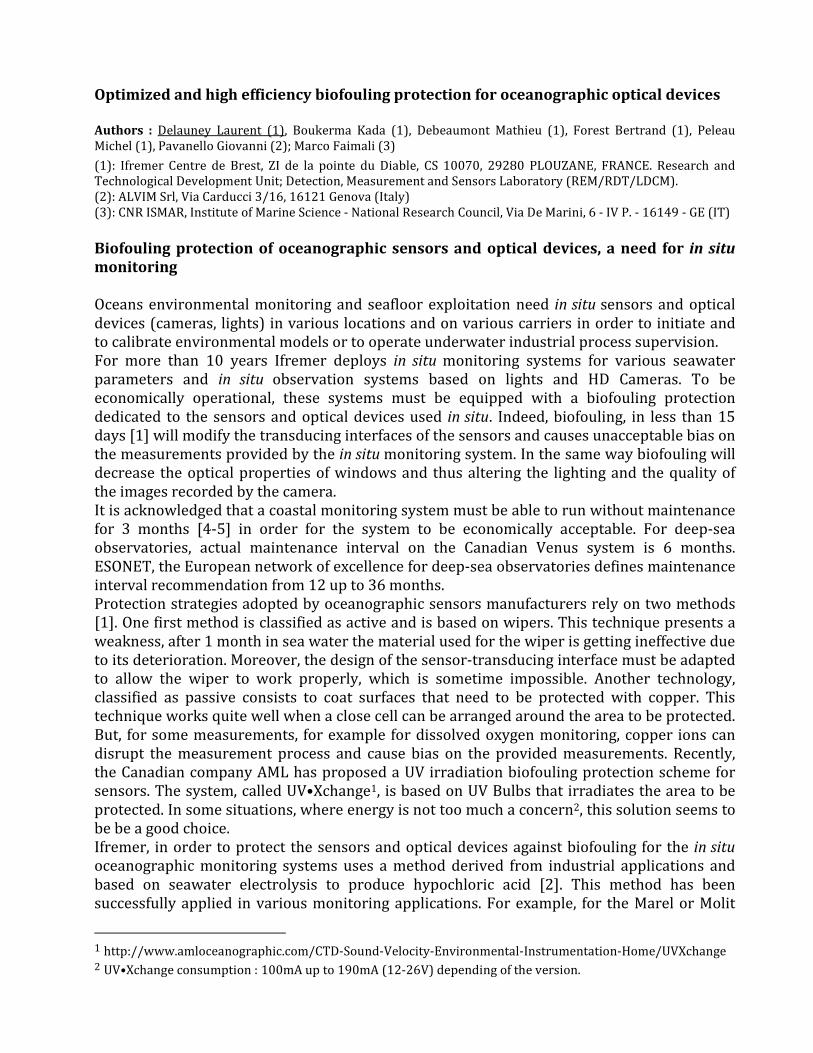
monitoring systems that use a pumped circuit [5] or for autonomous and transportable systems like Marel Estran or Marel Smatch3, and for seafloor observatories [6] like Momar, Venus [7], Neptune, or Ifremer Tempo module [7] where the sensors are directly immersed in seawater without any proxies like pumping devices. For optical sensors, Ifremer has developed a very efficient biofouling protection that is based on the coating of the optical window by a “transparent” conductive layer. This robust transparent conductive layer is polarised in order to generate a very low quantity of hypochlorous acid on the whole surface of the optical port. This technic offers a high level of robustness (no moving parts), a high level of protection efficiency (the whole optical window is protected) and consumes very low energy. It has the advantage to be an active technics that then can be turned ON and OFF in order to arrange free biocide generation period. This specific biofouling protection technic has been coupled to an ALVIM Srl biofilm sensor in order to apply the active biofouling protection only when fouling pressure is indeed sensed by the biofilm sensor. This allow to optimized at it’s maximum the efficiency in term of energy needed and in term of biocide free period to allow proper measurements or usage of the optical device. The results of such arrangement will be presented in this paper. A loop system based on a biofilm sensor to save energy of the active biofouling protection system The active biofouling protection technique can be controlled by a “loop system” based on a biofilm sensor that can trigger the active biofouling protection device only when biofilm formation is detected (figure 1). The final purpose of such arrangement is to save energy by controlling the operation of active biofouling protection systems (wipers, bleach, localized chlorination, etc.) and then to lower as much as possible the energy demand and/or biocide release.
Figure 1: Biofouling protection control scheme. The biofilm sensor, which acts as a microbial growth detector, sends a signal proportional to the degree of biofilm growth. The active antifouling protection device (e.g. the coated window 3 Nke products Ifremer licenced - http://www.nke-instrumentation.com/products/networks/estuary-zone.html
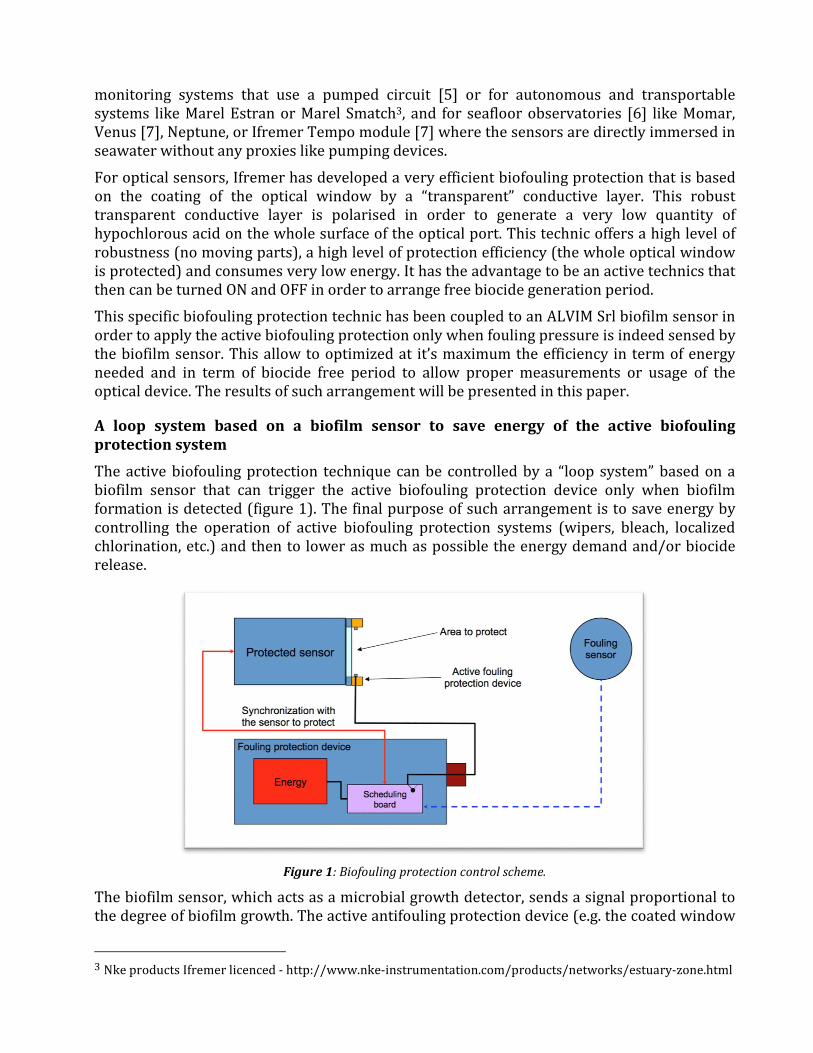
active biofouling protection developed by Ifremer) uses this signal to sequence the energy dedicated to protection, and to tag the sensor data with “biofouling free” index and “active protection” warning. The biofilm sensor used for this demonstration is proposed by the ALVIM Srl SME4 based in Italy. Technological description of biofouling protection by electrolysis on conductive layer for optical windows. The process requires on the surface of the glass window the deposit of a conductive and transparent film of tin dioxide (SnO2) whose physicochemical characteristics have been optimized by the French CNRS-LISE UPR15 laboratory in collaboration with the Ifremer Technological Research Group in Brest [9] [10]. The conductive layer has been optimized and is used as an anode, polarized at a specific potential, to produce chlorine. The biocide action is essentially based on the electrochemical generation of hypochloric acid capable of preventing the development of the biofilm. The SnO2 film deposition on the window is obtained by pyrolysis of a first aerosol SnCl4 + NH4F for film F-doped and then a second aerosol SnCl4 + SbCl3 for film Sb-doped, to 545 °C. Then an optional electro deposition of metallic copper on the edge of the window is performed that will allow establishing the necessary electrical contact to the SnO2 coating (figure 2).
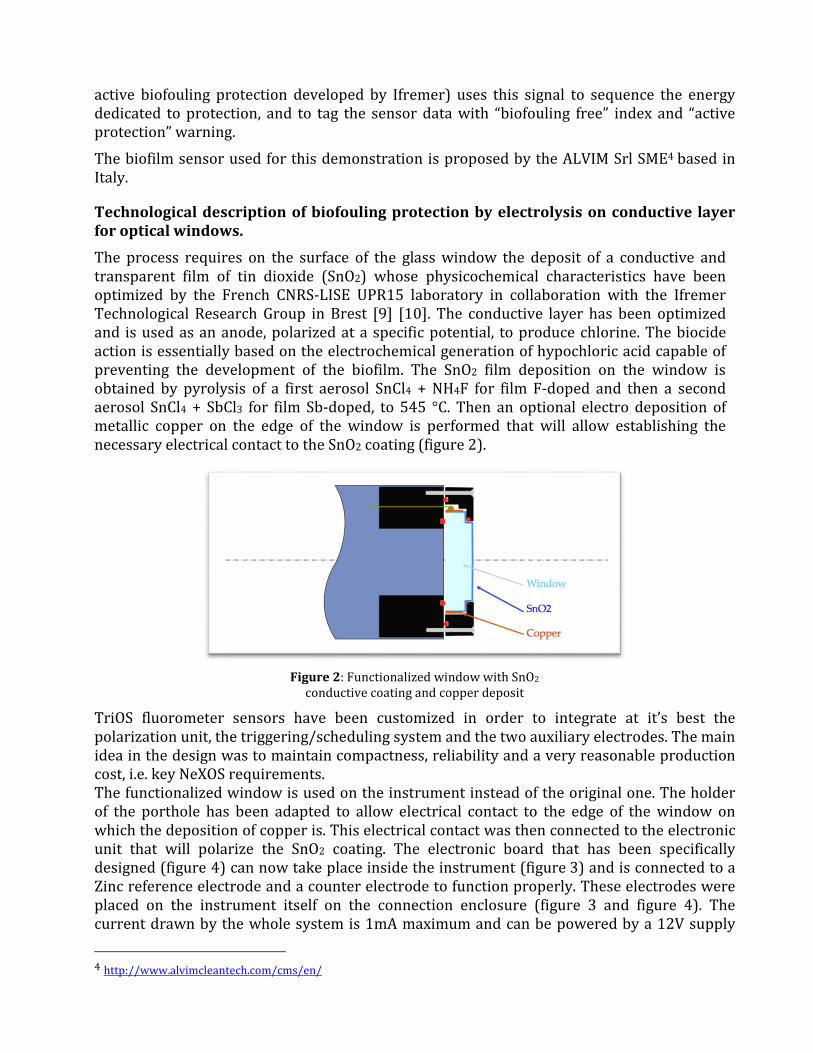
Figure 2: Functionalized window with SnO2 conductive coating and copper deposit TriOS fluorometer sensors have been customized in order to integrate at it’s best the polarization unit, the triggering/scheduling system and the two auxiliary electrodes. The main idea in the design was to maintain compactness, reliability and a very reasonable production cost, i.e. key NeXOS requirements. The functionalized window is used on the instrument instead of the original one. The holder of the porthole has been adapted to allow electrical contact to the edge of the window on which the deposition of copper is. This electrical contact was then connected to the electronic unit that will polarize the SnO2 coating. The electronic board that has been specifically designed (figure 4) can now take place inside the instrument (figure 3) and is connected to a Zinc reference electrode and a counter electrode to function properly. These electrodes were placed on the instrument itself on the connection enclosure (figure 3 and figure 4). The current drawn by the whole system is 1mA maximum and can be powered by a 12V supply 4 http://www.alvimcleantech.com/cms/en/
provided by the existing instrument connector. Then the protection scheme needs around 15 mW to be effective.
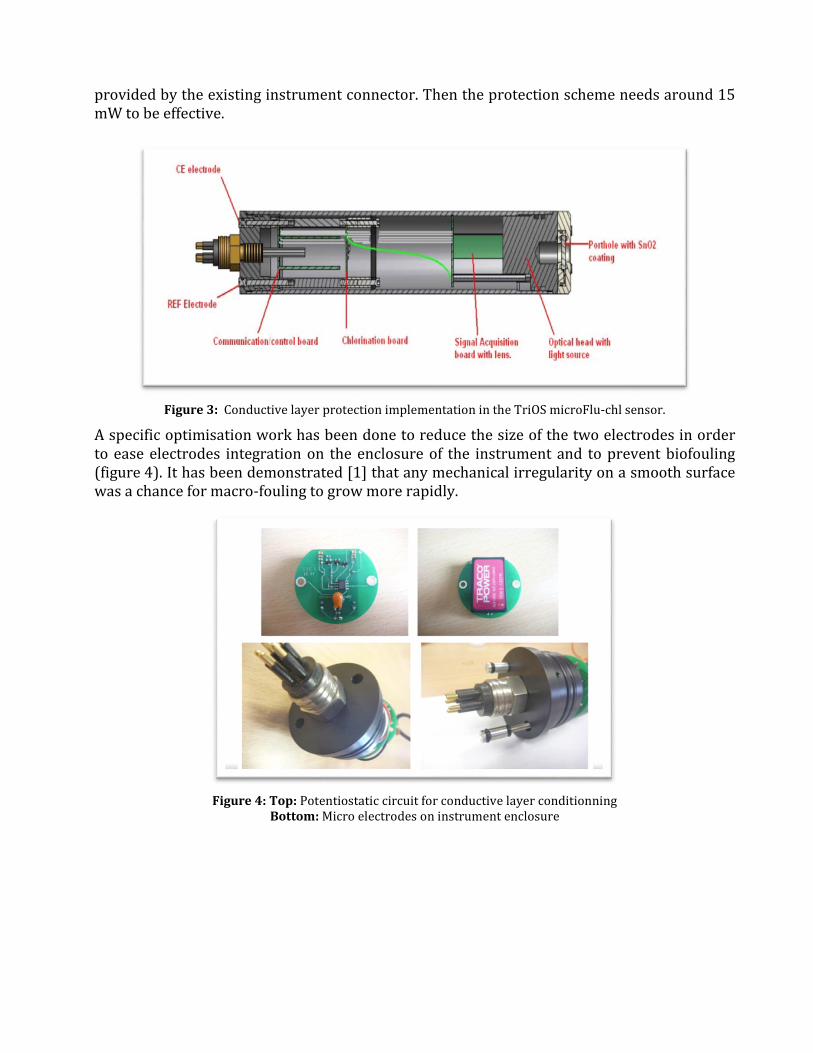
Figure 3: Conductive layer protection implementation in the TriOS microFlu-chl sensor. A specific optimisation work has been done to reduce the size of the two electrodes in order to ease electrodes integration on the enclosure of the instrument and to prevent biofouling (figure 4). It has been demonstrated [1] that any mechanical irregularity on a smooth surface was a chance for macro-fouling to grow more rapidly.
Figure 4: Top: Potentiostatic circuit for conductive layer conditionning
Bottom: Micro electrodes on instrument enclosure
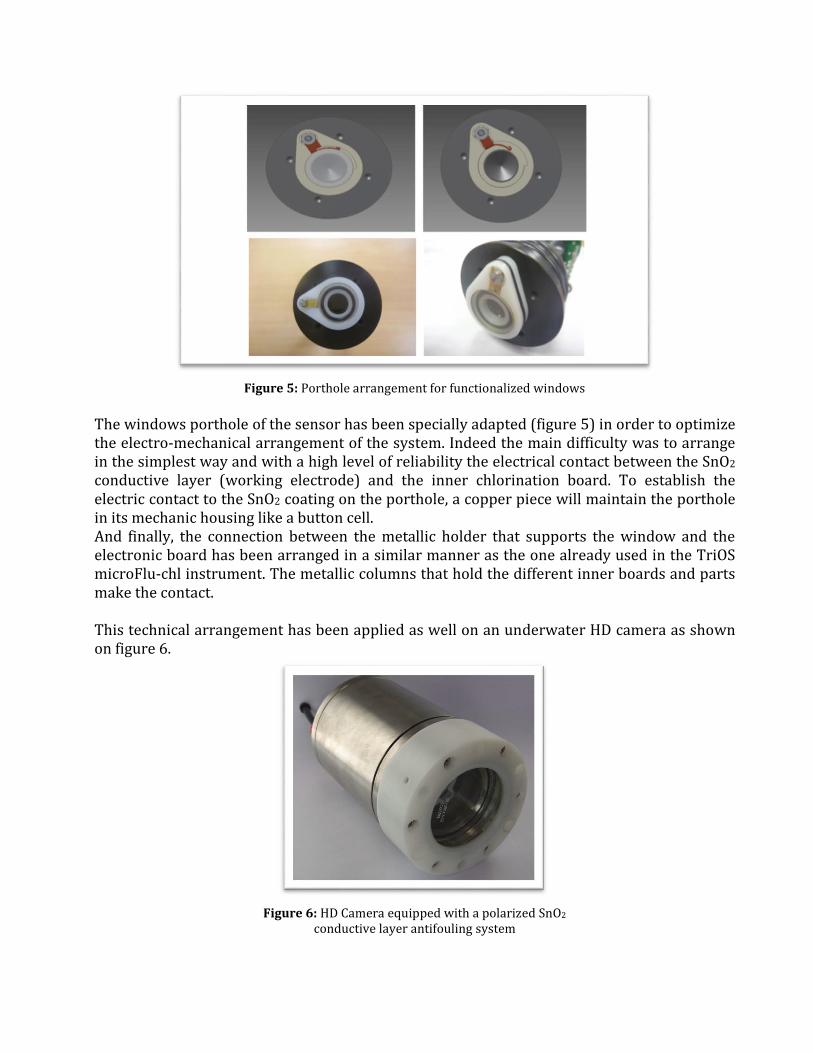
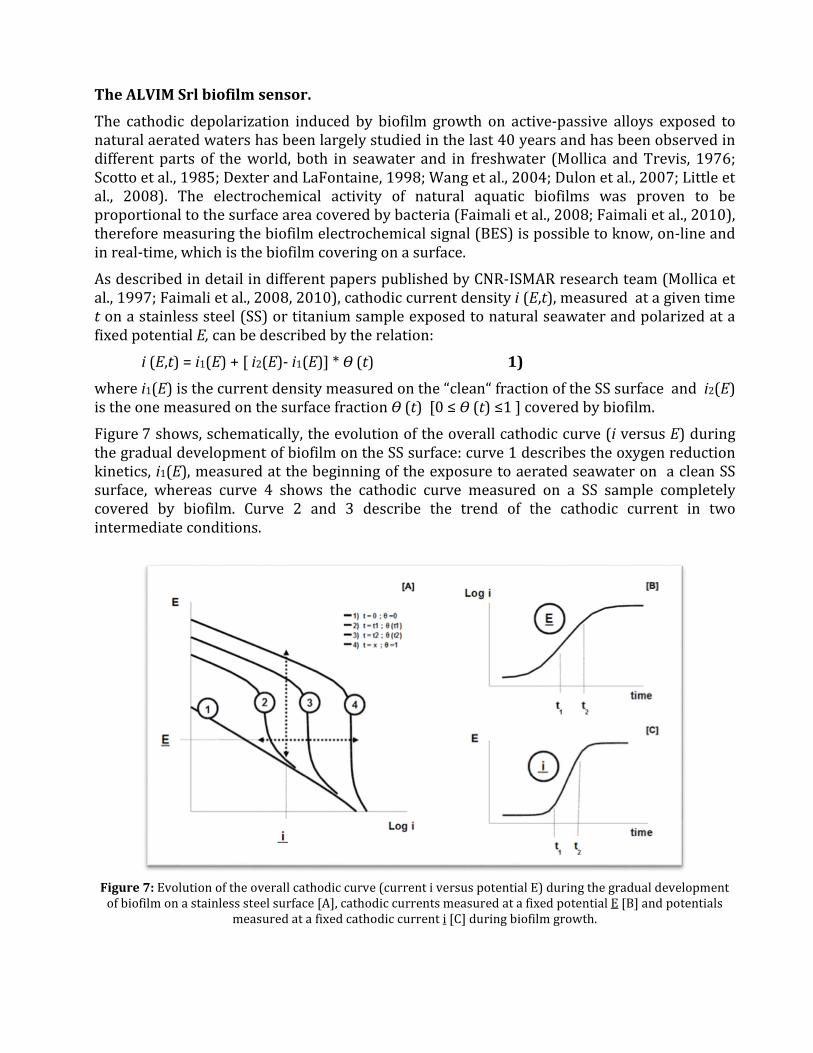
Figure 5: Porthole arrangement for functionalized windows The windows porthole of the sensor has been specially adapted (figure 5) in order to optimize the electro-mechanical arrangement of the system. Indeed the main difficulty was to arrange in the simplest way and with a high level of reliability the electrical contact between the SnO2 conductive layer (working electrode) and the inner chlorination board. To establish the electric contact to the SnO2 coating on the porthole, a copper piece will maintain the porthole in its mechanic housing like a button cell. And finally, the connection between the metallic holder that supports the window and the electronic board has been arranged in a similar manner as the one already used in the TriOS microFlu-chl instrument. The metallic columns that hold the different inner boards and parts make the contact. This technical arrangement has been applied as well on an underwater HD camera as shown on figure 6.
Figure 6: HD Camera equipped with a polarized SnO2 conductive layer antifouling system
The ALVIM Srl biofilm sensor. The cathodic depolarization induced by biofilm growth on active-passive alloys exposed to natural aerated waters has been largely studied in the last 40 years and has been observed in different parts of the world, both in seawater and in freshwater (Mollica and Trevis, 1976; Scotto et al., 1985; Dexter and LaFontaine, 1998; Wang et al., 2004; Dulon et al., 2007; Little et al., 2008). The electrochemical activity of natural aquatic biofilms was proven to be proportional to the surface area covered by bacteria (Faimali et al., 2008; Faimali et al., 2010), therefore measuring the biofilm electrochemical signal (BES) is possible to know, on-line and in real-time, which is the biofilm covering on a surface. As described in detail in different papers published by CNR-ISMAR research team (Mollica et al., 1997; Faimali et al., 2008, 2010), cathodic current density i (E,t), measured at a given time t on a stainless steel (SS) or titanium sample exposed to natural seawater and polarized at a fixed potential E, can be described by the relation:
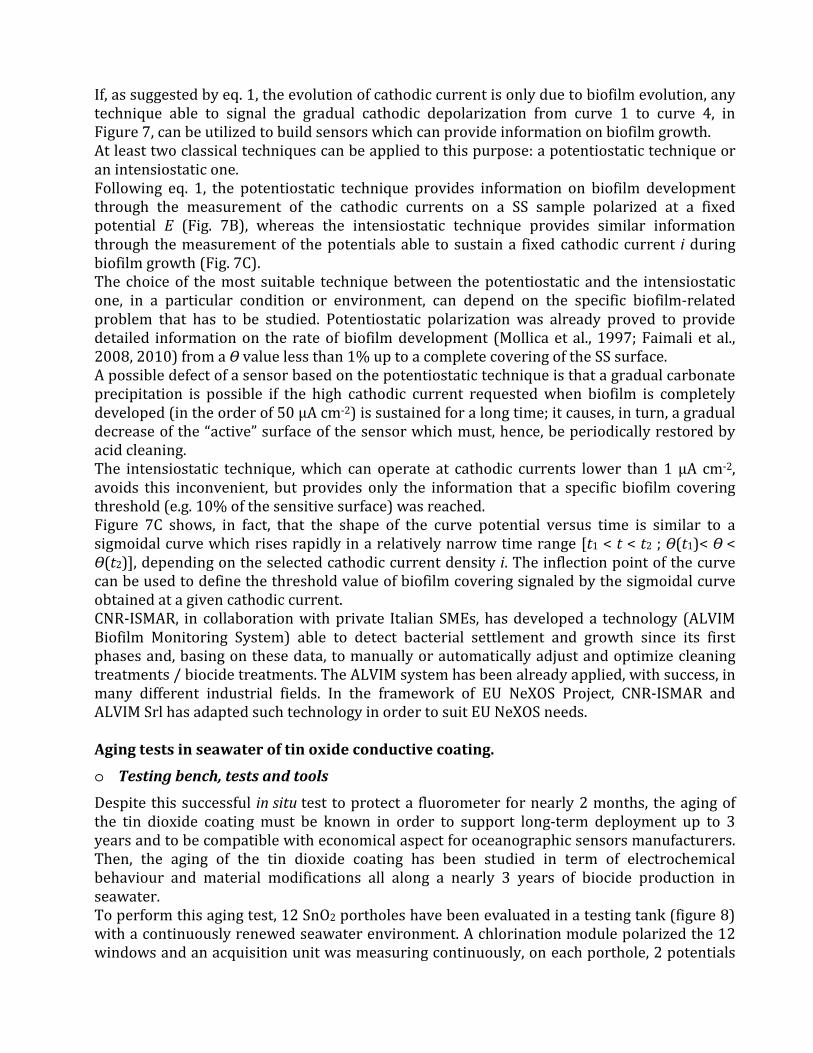
i (E,t) = i1(E) + [ i2(E)- i1(E)] * ϴ (t) 1) where i1(E) is the current density measured on the “clean“ fraction of the SS surface and i2(E) is the one measured on the surface fraction ϴ (t) [0 ≤ ϴ (t) ≤1 ] covered by biofilm. Figure 7 shows, schematically, the evolution of the overall cathodic curve (i versus E) during the gradual development of biofilm on the SS surface: curve 1 describes the oxygen reduction kinetics, i1(E), measured at the beginning of the exposure to aerated seawater on a clean SS surface, whereas curve 4 shows the cathodic curve measured on a SS sample completely covered by biofilm. Curve 2 and 3 describe the trend of the cathodic current in two intermediate conditions.
Figure 7: Evolution of the overall cathodic curve (current i versus potential E) during the gradual development of biofilm on a stainless steel surface [A], cathodic currents measured at a fixed potential E [B] and potentials measured at a fixed cathodic current i [C] during biofilm growth.
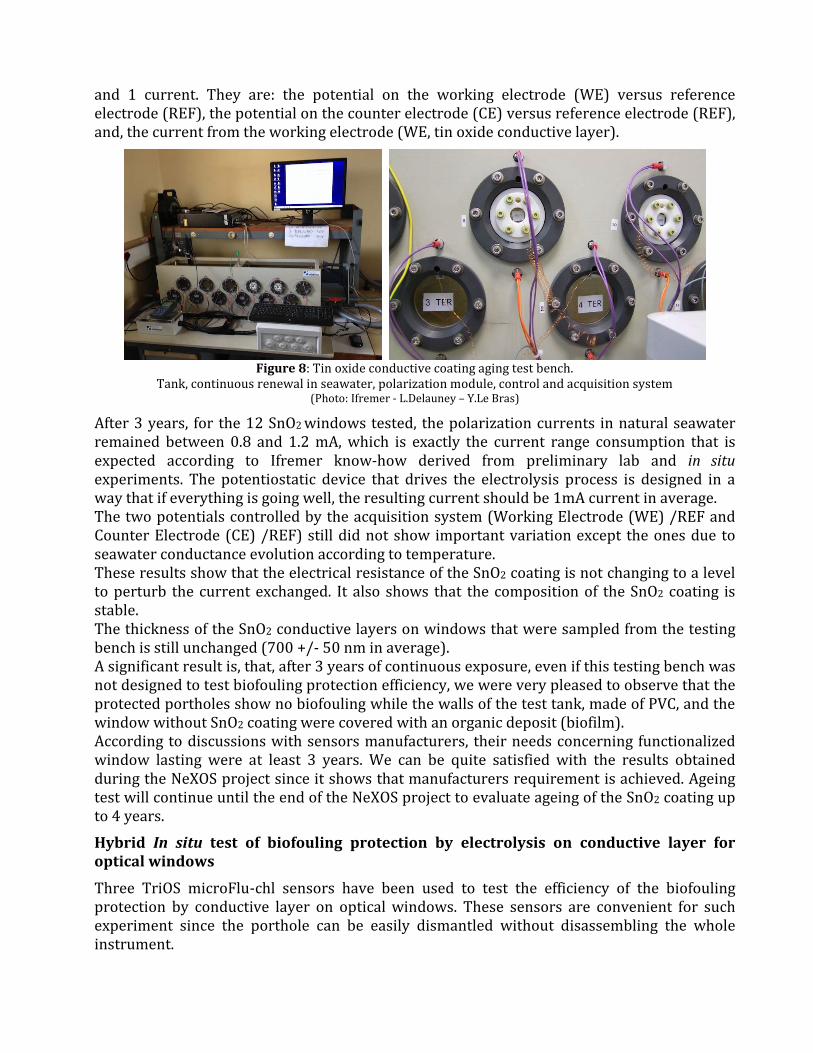
If, as suggested by eq. 1, the evolution of cathodic current is only due to biofilm evolution, any technique able to signal the gradual cathodic depolarization from curve 1 to curve 4, in Figure 7, can be utilized to build sensors which can provide information on biofilm growth. At least two classical techniques can be applied to this purpose: a potentiostatic technique or an intensiostatic one. Following eq. 1, the potentiostatic technique provides information on biofilm development through the measurement of the cathodic currents on a SS sample polarized at a fixed potential E (Fig. 7B), whereas the intensiostatic technique provides similar information through the measurement of the potentials able to sustain a fixed cathodic current i during biofilm growth (Fig. 7C). The choice of the most suitable technique between the potentiostatic and the intensiostatic one, in a particular condition or environment, can depend on the specific biofilm-related problem that has to be studied. Potentiostatic polarization was already proved to provide detailed information on the rate of biofilm development (Mollica et al., 1997; Faimali et al., 2008, 2010) from a ϴ value less than 1% up to a complete covering of the SS surface. A possible defect of a sensor based on the potentiostatic technique is that a gradual carbonate precipitation is possible if the high cathodic current requested when biofilm is completely developed (in the order of 50 μA cm-2) is sustained for a long time; it causes, in turn, a gradual decrease of the “active” surface of the sensor which must, hence, be periodically restored by acid cleaning. The intensiostatic technique, which can operate at cathodic currents lower than 1 μA cm-2, avoids this inconvenient, but provides only the information that a specific biofilm covering threshold (e.g. 10% of the sensitive surface) was reached. Figure 7C shows, in fact, that the shape of the curve potential versus time is similar to a sigmoidal curve which rises rapidly in a relatively narrow time range [t1 < t < t2 ; ϴ(t1)< ϴ < ϴ(t2)], depending on the selected cathodic current density i. The inflection point of the curve can be used to define the threshold value of biofilm covering signaled by the sigmoidal curve obtained at a given cathodic current. CNR-ISMAR, in collaboration with private Italian SMEs, has developed a technology (ALVIM Biofilm Monitoring System) able to detect bacterial settlement and growth since its first phases and, basing on these data, to manually or automatically adjust and optimize cleaning treatments / biocide treatments. The ALVIM system has been already applied, with success, in many different industrial fields. In the framework of EU NeXOS Project, CNR-ISMAR and ALVIM Srl has adapted such technology in order to suit EU NeXOS needs. Aging tests in seawater of tin oxide conductive coating. o Testing bench, tests and tools Despite this successful in situ test to protect a fluorometer for nearly 2 months, the aging of the tin dioxide coating must be known in order to support long-term deployment up to 3 years and to be compatible with economical aspect for oceanographic sensors manufacturers. Then, the aging of the tin dioxide coating has been studied in term of electrochemical behaviour and material modifications all along a nearly 3 years of biocide production in seawater. To perform this aging test, 12 SnO2 portholes have been evaluated in a testing tank (figure 8) with a continuously renewed seawater environment. A chlorination module polarized the 12 windows and an acquisition unit was measuring continuously, on each porthole, 2 potentials
and 1 current. They are: the potential on the working electrode (WE) versus reference electrode (REF), the potential on the counter electrode (CE) versus reference electrode (REF), and, the current from the working electrode (WE, tin oxide conductive layer).
Figure 8: Tin oxide conductive coating aging test bench. Tank, continuous renewal in seawater, polarization module, control and acquisition system (Photo: Ifremer - L.Delauney – Y.Le Bras) After 3 years, for the 12 SnO2 windows tested, the polarization currents in natural seawater remained between 0.8 and 1.2 mA, which is exactly the current range consumption that is expected according to Ifremer know-how derived from preliminary lab and in situ experiments. The potentiostatic device that drives the electrolysis process is designed in a way that if everything is going well, the resulting current should be 1mA current in average. The two potentials controlled by the acquisition system (Working Electrode (WE) /REF and Counter Electrode (CE) /REF) still did not show important variation except the ones due to seawater conductance evolution according to temperature. These results show that the electrical resistance of the SnO2 coating is not changing to a level to perturb the current exchanged. It also shows that the composition of the SnO2 coating is stable. The thickness of the SnO2 conductive layers on windows that were sampled from the testing bench is still unchanged (700 +/- 50 nm in average). A significant result is, that, after 3 years of continuous exposure, even if this testing bench was not designed to test biofouling protection efficiency, we were very pleased to observe that the protected portholes show no biofouling while the walls of the test tank, made of PVC, and the window without SnO2 coating were covered with an organic deposit (biofilm). According to discussions with sensors manufacturers, their needs concerning functionalized window lasting were at least 3 years. We can be quite satisfied with the results obtained during the NeXOS project since it shows that manufacturers requirement is achieved. Ageing test will continue until the end of the NeXOS project to evaluate ageing of the SnO2 coating up to 4 years.
Hybrid In situ test of biofouling protection by electrolysis on conductive layer for optical windows Three TriOS microFlu-chl sensors have been used to test the efficiency of the biofouling protection by conductive layer on optical windows. These sensors are convenient for such experiment since the porthole can be easily dismantled without disassembling the whole instrument.
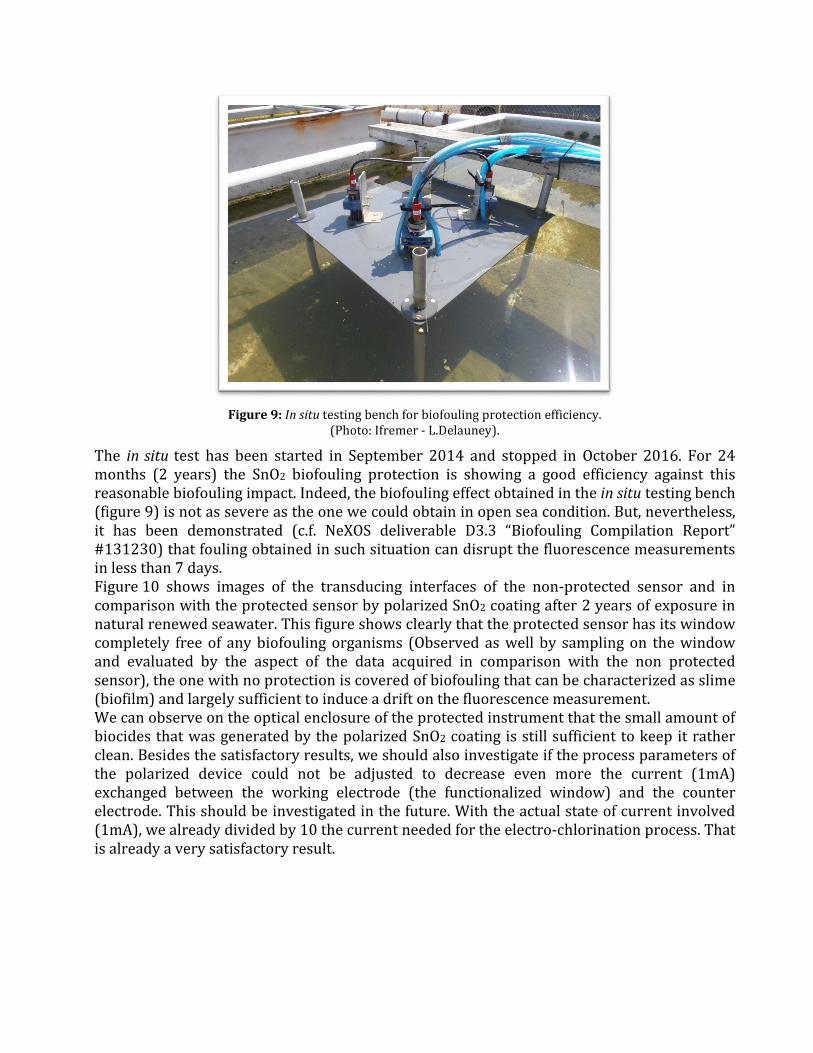
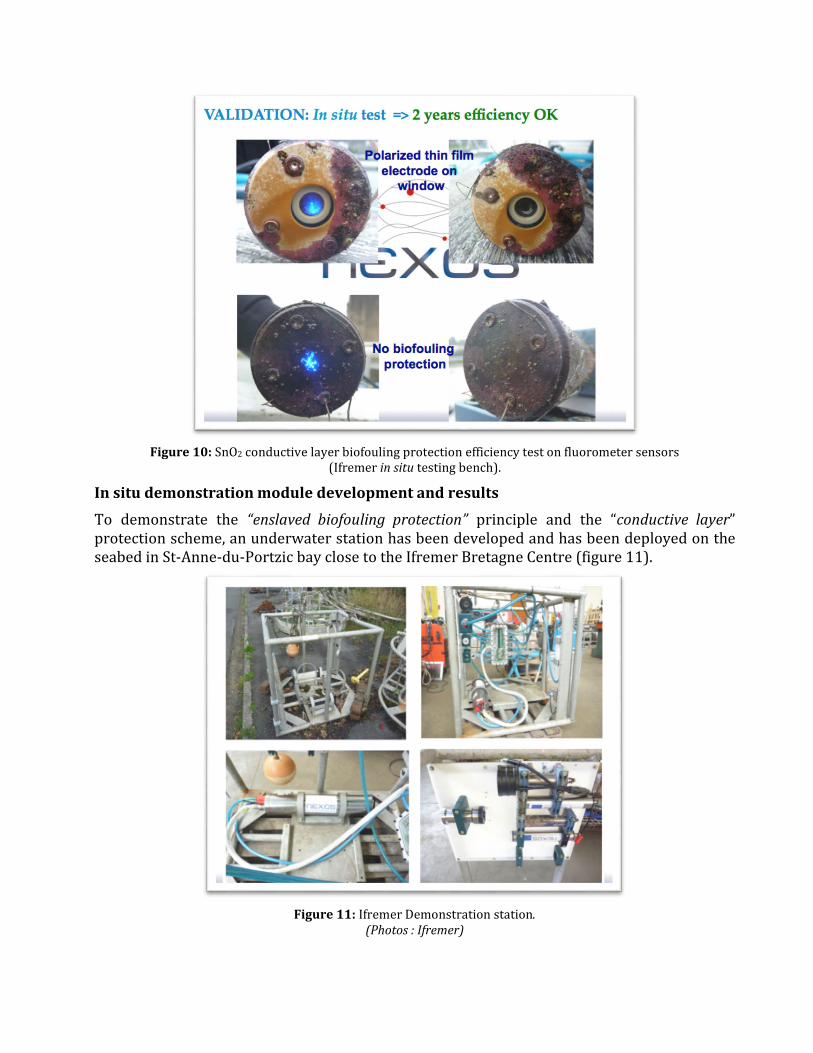
Figure 9: In situ testing bench for biofouling protection efficiency. (Photo: Ifremer - L.Delauney). The in situ test has been started in September 2014 and stopped in October 2016. For 24 months (2 years) the SnO2 biofouling protection is showing a good efficiency against this reasonable biofouling impact. Indeed, the biofouling effect obtained in the in situ testing bench (figure 9) is not as severe as the one we could obtain in open sea condition. But, nevertheless, it has been demonstrated (c.f. NeXOS deliverable D3.3 “Biofouling Compilation Report” #131230) that fouling obtained in such situation can disrupt the fluorescence measurements in less than 7 days. Figure 10 shows images of the transducing interfaces of the non-protected sensor and in comparison with the protected sensor by polarized SnO2 coating after 2 years of exposure in natural renewed seawater. This figure shows clearly that the protected sensor has its window completely free of any biofouling organisms (Observed as well by sampling on the window and evaluated by the aspect of the data acquired in comparison with the non protected sensor), the one with no protection is covered of biofouling that can be characterized as slime (biofilm) and largely sufficient to induce a drift on the fluorescence measurement. We can observe on the optical enclosure of the protected instrument that the small amount of biocides that was generated by the polarized SnO2 coating is still sufficient to keep it rather clean. Besides the satisfactory results, we should also investigate if the process parameters of the polarized device could not be adjusted to decrease even more the current (1mA) exchanged between the working electrode (the functionalized window) and the counter electrode. This should be investigated in the future. With the actual state of current involved (1mA), we already divided by 10 the current needed for the electro-chlorination process. That is already a very satisfactory result.
Figure 10: SnO2 conductive layer biofouling protection efficiency test on fluorometer sensors (Ifremer in situ testing bench).
In situ demonstration module development and results To demonstrate the “enslaved biofouling protection” principle and the “conductive layer” protection scheme, an underwater station has been developed and has been deployed on the seabed in St-Anne-du-Portzic bay close to the Ifremer Bretagne Centre (figure 11).
Figure 11: Ifremer Demonstration station.
(Photos : Ifremer)
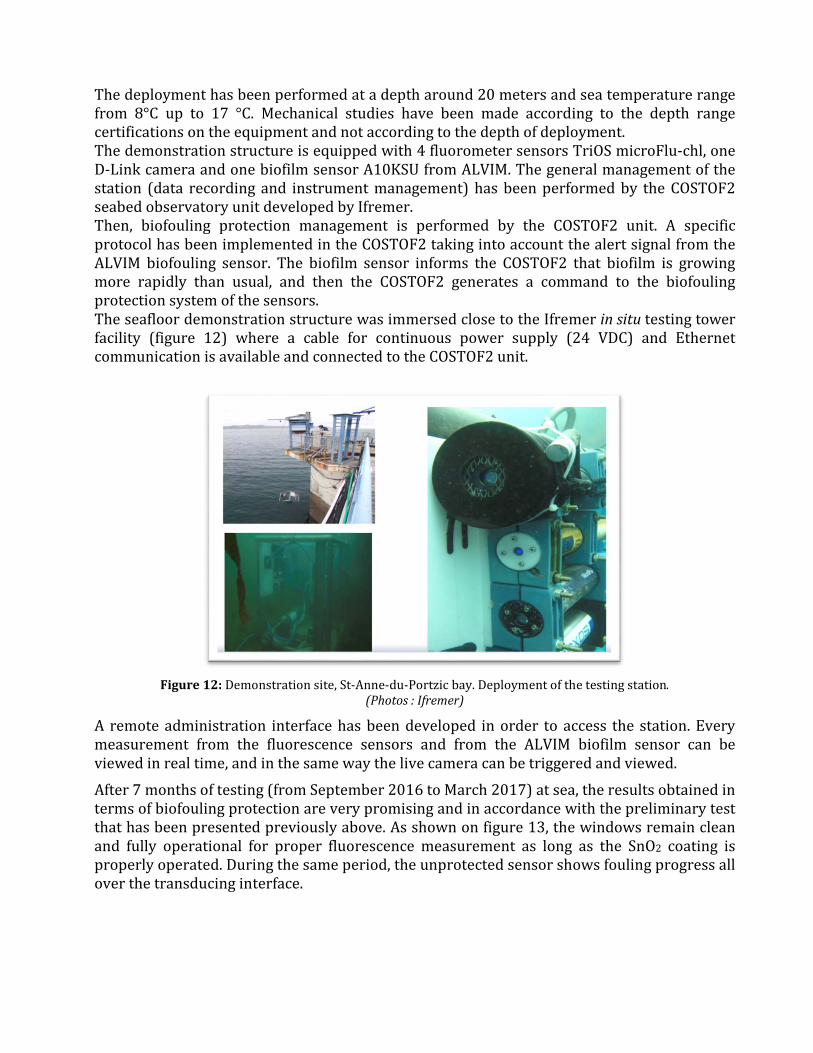
The deployment has been performed at a depth around 20 meters and sea temperature range from 8°C up to 17 °C. Mechanical studies have been made according to the depth range certifications on the equipment and not according to the depth of deployment. The demonstration structure is equipped with 4 fluorometer sensors TriOS microFlu-chl, one D-Link camera and one biofilm sensor A10KSU from ALVIM. The general management of the station (data recording and instrument management) has been performed by the COSTOF2 seabed observatory unit developed by Ifremer. Then, biofouling protection management is performed by the COSTOF2 unit. A specific protocol has been implemented in the COSTOF2 taking into account the alert signal from the ALVIM biofouling sensor. The biofilm sensor informs the COSTOF2 that biofilm is growing more rapidly than usual, and then the COSTOF2 generates a command to the biofouling protection system of the sensors. The seafloor demonstration structure was immersed close to the Ifremer in situ testing tower facility (figure 12) where a cable for continuous power supply (24 VDC) and Ethernet communication is available and connected to the COSTOF2 unit.
Figure 12: Demonstration site, St-Anne-du-Portzic bay. Deployment of the testing station.
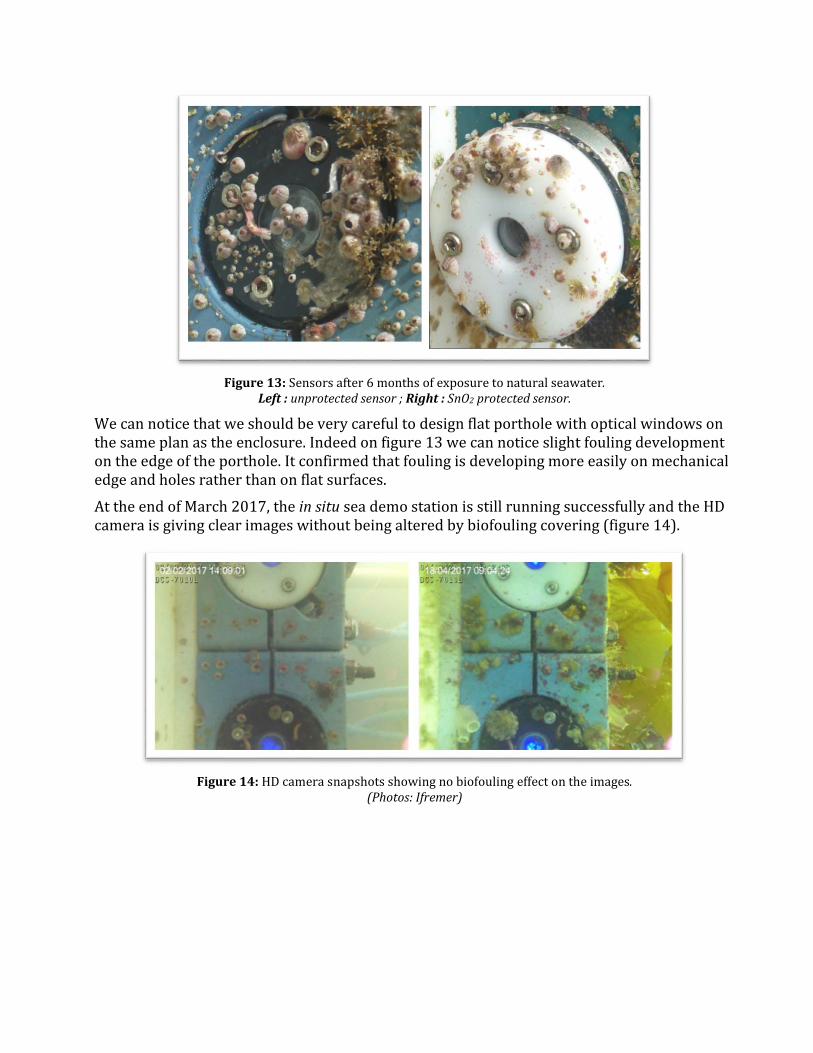
(Photos : Ifremer) A remote administration interface has been developed in order to access the station. Every measurement from the fluorescence sensors and from the ALVIM biofilm sensor can be viewed in real time, and in the same way the live camera can be triggered and viewed. After 7 months of testing (from September 2016 to March 2017) at sea, the results obtained in terms of biofouling protection are very promising and in accordance with the preliminary test that has been presented previously above. As shown on figure 13, the windows remain clean and fully operational for proper fluorescence measurement as long as the SnO2 coating is properly operated. During the same period, the unprotected sensor shows fouling progress all over the transducing interface.
Figure 13: Sensors after 6 months of exposure to natural seawater.
Left : unprotected sensor ; Right : SnO2 protected sensor. We can notice that we should be very careful to design flat porthole with optical windows on the same plan as the enclosure. Indeed on figure 13 we can notice slight fouling development on the edge of the porthole. It confirmed that fouling is developing more easily on mechanical edge and holes rather than on flat surfaces. At the end of March 2017, the in situ sea demo station is still running successfully and the HD camera is giving clear images without being altered by biofouling covering (figure 14).
Figure 14: HD camera snapshots showing no biofouling effect on the images.
(Photos: Ifremer)
Conclusion and discussion on biofouling protection by electrolysis on conductive layer for optical windows The ageing in seawater of the conductive coating has been studied for 3 years and is showing no variations for the thickness and for the electrolysis behaviour. These results are crucial and will allow considering using this technique for operational purpose and in collaboration with optical sensors manufacturers and optical devices (camera and lights) manufacturers. The ALVIM biofouling sensor worked for 3 months without interruption on the Ifremer test site. We have now a first approach of the gain obtained up to this device. In comparison to an average chlorination rate used to protect optical sensors, a biofouling protection for sensor controlled by the ALVIM biofilm sensor has a global duration of chlorination needed to get a non-fouled system divided by 6. It means that the energy demand is as well divided by 6. This is a very promising first result in terms of overall efficiency improvement. Chlorine is generated in such small amount that it is not possible to measure it by colorimetric method. Consequently, we are very confident on the effect that chlorine could have on the sensors parts as rubber ring or plastic window holder. In addition, Ifremer uses for many years localised chlorination to protect sensor-transducing interface from biofouling [1] [2], and no damaged has been observed on the sensor due to the chlorine production that takes place in much larger quantities than the method proposed here. The spraying station used to produce the “functionalized” optical windows is actually a laboratory device that has been setup internally at Ifremer. In order to organize the use of this protection method by sensors manufacturers and optical devices (camera and lights) manufacturers, the spraying machine will need to be transferred to a company in charge of producing the functionalized windows. This is a delicate aspect of the future of the project since oceanographic instruments dedicated to long term deployments is still a niche market. Biofouling protection by conductive layer on optical windows has now a Technological Readiness Level (TRL5) equal to 7 (System technology prototype demo in an operational environment). Indeed, the protection has been tested with success for 2 years on 2 prototypes in a relevant environment (Ifremer in situ testing bench) and up to now for 7 months on 3 off the shelves sensors and a camera in real in situ marine condition (St Anne du Portzic Bay). TRL 8 (System technology qualified through test and demonstration) is in reach and should be achieved soon before the end of the NeXOS project by deploying the testing station on a Mediterranean NeXOS Demo site. AKNOWLEDGEMENTS The authors would like to thanks the French Carnot ANR grant agreement and the EU NeXOS project grant agreement (N°614102) for the inestimable help to fund these research works. REFERENCES [1] Delauney L., Compère C., Lehaitre M., Biofouling protection for marine environmental sensors, Ocean Science, 6(2), 503-511, ISSN: 1812-0784 - 2010 [2] Delauney L., Compère C., Biofouling protection for marine environmental sensors by local chlorination, Springer Series on Biofilms vol. 4, Marine and Industrial Biofouling, pp119-134, 2009 5 Technology Readiness Level – Technological Maturity scale used for oceanographic instrumentation development [12]
[3] M.Lehaitre, L.Delauney and C. Compère, Biofouling and underwater measurements pp463-494 - Real-time coastal observing systems - UNESCO 2008 - ISBN 978-92-3-104042-9 [4] Woerther P., Grouhel A. (1998) Automated measurement network for the coastal environment. OCEAN’S 98 IEEE-Conference Proceedings, 2, p 1149-1154 [5] Woerther P. (1999) Coastal environment of the Seine bay area monitored by a new French system of automated measurement stations. EUROGOOS, Second International Conference Proceeding, p 255-264 [6] Y. Auffret, J. Blandin, D. Choqueuse, C. Compère, L.Delauney, J.F. Drogou, P. Jégou, C. Lévêque, J.F. Drogou, J.F. Rolin, P. Valdy - Long-term subsea observatories: architecture comparison, infrastructure design, interfaces, materials, sensor protection and deployment operations, Springer Praxis Book, January 2010 - 1st Edition., 2011, 500 p., Hardcover, ISBN: 978-3-642-11373-4. [7] Sarrazin J., Blandin J., Delauney L., Dentrecolas S., Dorval P., Dupont J., Legrand J., Leroux D., Leon P., Leveque J-P., Rodier P., Vuillemin R., Sarradin P-M. (2007) TEMPO: a new ecological module for studying deep-sea community dynamics at hydrothermal vents. In OCEAN’S 07 IEEE-Aberdeen Conference Proceedings, p 1-4 [8] VENUS Newsletter, Volume 19 - Summer/Fall 2008, New and Improved: http://venus.uvic.ca/resources/documents/2008SummerNewsletter.pdf [9] Patent WO 2004069645 A1 - Method for production of an anti-fouling protective coating on a support and corresponding support. [10] Debiemme-Chouvy, Y. Hua, F. Hui, J.-L. Duval, D. Festy, H. Cachet (2011) Electrochemical treatments using tin oxide anode to prevent biofouling, Electrochimica Acta 56 (2011) 10364– 10370 [11] Ralph D.Prien, “The future of Chemical in-situ sensor”, Marine Chemistry vol.107, pp 422–432, 2007. [12] C. Waldmann, M. Tamburri, R. D. Prien, P. Fietzek "Assessment of sensor performance” Ocean Sci., vol. 6, pp. 235– 245, 2010.