Optimized Method Development of Large Volume Injection for GC/MS/MS of Food Pesticides Authors Limian Zhao and Chin-Kai Meng Agilent Technologies, Inc. 2850 Centerville Road, Wilmington, DE, 19808 USA Application Note Food Testing & Agriculture Abstract The development and optimization of large volume injection (LVI) techniques for trace pesticide analysis in food matrices by GC/MS/MS is discussed. Excellent inertness provided by Agilent Ultra Inert liners with wool and an Agilent J&W HP-5ms Ultra Inert GC column ensures the accurate and precise delivery of trace levels of pesticides from 5 μL food extracts in acetonitrile. Compared to hot splitless and cold splitless injections, the optimal LVI method demonstrates lower detection limits and better peak shapes for early eluting compounds. Introduction LVI techniques have gained wide attention for lowering system detection limits to meet newer and more stringent regulations. By introducing more sample into the system, the mass of analyte reaching the detector will be proportionately increased, resulting in larger peak area and peak height. If the baseline noise stays constant, larger peak height means greater signal-to-noise ratios and lower system detection limits. With properly optimized injection conditions, chromatography issues caused by large sample volume, such as distorted analyte peaks and long solvent tailing, can be minimized. Another advantage of LVI is the decrease in solvent that reaches the detector. In LVI, the solvent is carefully evaporated and vented from the inlet before the analytes are transferred to the analytical column. As a result, solvent impact on chromatography is greatly reduced, especially for solvents that do not wet the typical 5% phenol stationary phase well, such as acetonitrile [1].
Transcript
Optimized Method Development ofLarge Volume Injection forGC/MS/MS of Food Pesticides
Authors
Limian Zhao and Chin-Kai Meng
Agilent Technologies, Inc.
2850 Centerville Road,
Wilmington, DE, 19808
USA
Application Note
Food Testing & Agriculture
Abstract
The development and optimization of large volume injection (LVI) techniques for
trace pesticide analysis in food matrices by GC/MS/MS is discussed. Excellent
inertness provided by Agilent Ultra Inert liners with wool and an Agilent J&W
HP-5ms Ultra Inert GC column ensures the accurate and precise delivery of trace
levels of pesticides from 5 µL food extracts in acetonitrile. Compared to hot splitless
and cold splitless injections, the optimal LVI method demonstrates lower detection
limits and better peak shapes for early eluting compounds.
Introduction
LVI techniques have gained wide attention for lowering system detection limits tomeet newer and more stringent regulations. By introducing more sample into thesystem, the mass of analyte reaching the detector will be proportionately increased,resulting in larger peak area and peak height. If the baseline noise stays constant,larger peak height means greater signal-to-noise ratios and lower system detectionlimits. With properly optimized injection conditions, chromatography issues causedby large sample volume, such as distorted analyte peaks and long solvent tailing,can be minimized. Another advantage of LVI is the decrease in solvent that reachesthe detector. In LVI, the solvent is carefully evaporated and vented from the inletbefore the analytes are transferred to the analytical column. As a result, solventimpact on chromatography is greatly reduced, especially for solvents that do not wetthe typical 5% phenol stationary phase well, such as acetonitrile [1].
2
The Agilent Multimode Inlet (MMI) incorporates differentinjection modes into 1 inlet by using the same consumablesand inlet liner. Its operational modes include hotsplit/splitless (also in pulsed mode), cold split/splitless (alsoin pulsed mode), and solvent vent [2]. In this application note,LVI refers to the solvent vent mode.
The Agilent Ultra Inert liner with wool provides extremeinertness for the trace analysis of labile pesticides in foodmatrices, as well protecting the analytical column and MS ionsource [3, 4]. With the excellent selectivity and sensitivity ofthe Agilent GC/MS/MS system, the 5 ng/mL detection limitof analytes in matrix is easily achieved using a 1 µL hotsplitless injection. Many pesticides have detection limits aslow as 1 ng/mL. These limits typically meet the MaximumResidue Level (MRL) for pesticide residue requirements inmost food commodities. However, recent concern regardingpesticide residues in baby food, and their potential role indisrupting the endocrine system’s normal function, pushpesticide detection limits to even lower levels.
This application note describes an optimized method forlowering GC/MS/MS detection limits by LVI in solvent ventmode. The completely deactivated wool in the Ultra Inert linerincreases the surface area on which sample can depositduring slow sample injection in LVI, which improves solventvaporization during solvent vent. The wool also providesbetter analyte delivery to the analytical column as well asbeing a barrier that traps the nonvolatile matrix interferencesto protect the GC column and MS ion source [3, 4]. Thistrapping characteristic is very important for successful largevolume injections of complex food extracts, because thesolvent vent procedure removes the solvent but leaves a largeamount of sample matrix in the liner. Without the wool in theliner, the matrix interferences can easily enter andaccumulate on the column and even the MS ion source,which quickly result in column deterioration and ion sourcecontamination.
Experimental
The standards, sample matrix preparation, and experimentalconditions generally followed a previous study [4]. Arepresentative group of 33 challenging pesticides wereselected for this work. A 10 ng/mL standard solution was
used for LVI method development and optimization.The optimal LVI method was then compared with hot splitlessand cold splitless injection methods using Ultra Inert liners. Apepper matrix blank, prepared using an Agilent QuEChERSprotocol, was used for pesticide analysis evaluation in a foodmatrix.
Chemicals and reagentsAll reagents and solvents were HPLC or analytical grade.Acetonitrile (ACN) was from Honeywell B&J (Muskegon, MI,USA). Ultra Resi-analyzed-grade acetone was from J.T. Baker(Phillipsburg, NJ, USA). Acetic acid was from Sigma-Aldrich(St Louis, MO, USA). The pesticide standards and internalstandard (triphenyl phosphate, TPP) were purchased fromSigma-Aldrich (St Louis, MO, USA), Chem Service (WestChester, PA, USA), or Ultra Scientific (North Kingstown, RI,USA).
Solutions and standardsA 1% acetic acid in ACN reagent blank solution was preparedby adding 1 mL of glacial acetic acid to 100 mL ACN. Thissolution was also used as the extraction solvent for theQuEChERS protocol. Pesticide standard spiking solution (20 µg/mL) and internal standard (IS) spiking solution wereused [4]. A 500 ng/mL intermediate standard solution inreagent blank was made to accurately spike 10 ng/mL testingstandard solution. Because this 10 ng/mL testing standardsolution was for method development, IS was not added. Allstandard solutions were stored at 4 °C.
Pepper blank extracts were used to prepare a series of 1 to100 ng/mL five-point calibration standards, and 10 ng/mL and1 ng/mL QC samples were spiked in the matrix blank [4].
InstrumentationAll analyses were done on an Agilent 7890 GC equipped withan Agilent 7693B Automatic Sampler, and an Agilent 7000Series GC/MS Triple Quadrupole system [4]. An Agilent J&WHP-5ms Ultra Inert GC column was used to provide analyteseparation and a highly inert flow path to the detector. Table 1lists the instrument parameters, except MMI conditions, andTable 2 shows the Agilent supplies. MRM transition settingswere published previously [3, 4]. Backflushing was usedbecause it significantly shortens analysis time for samplesthat contain high-boiling matrix residues and reduces systemmaintenance [5, 6].
3
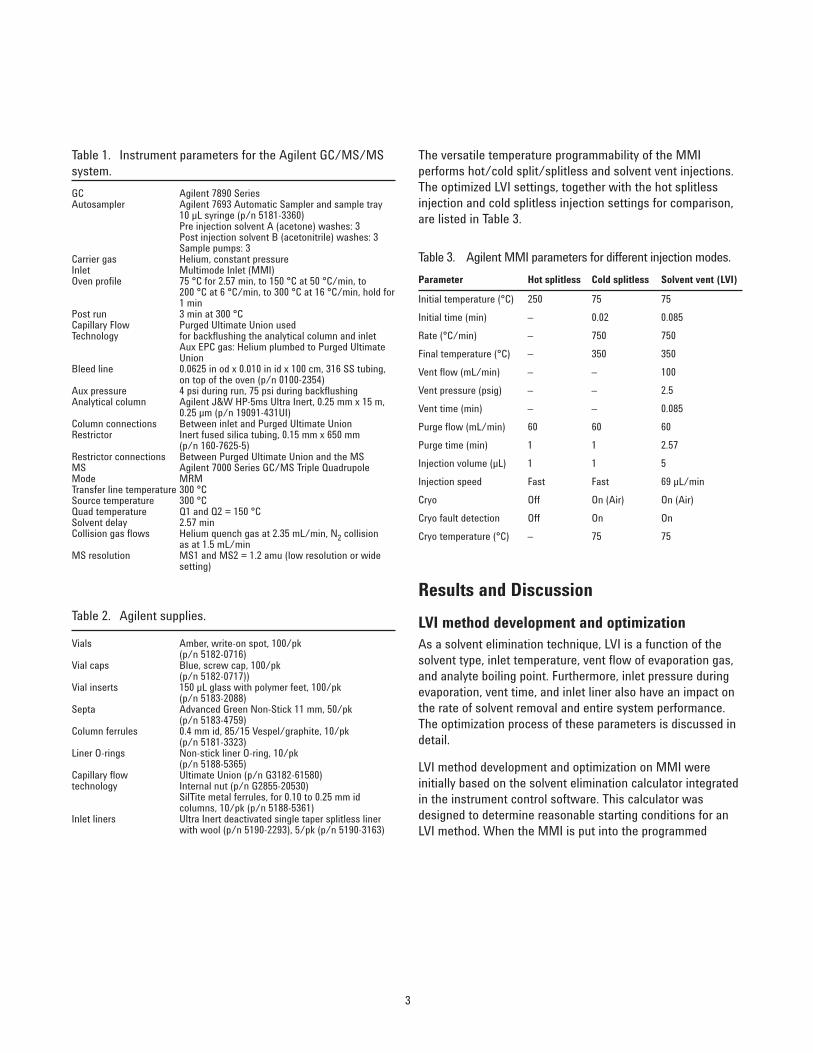
The versatile temperature programmability of the MMIperforms hot/cold split/splitless and solvent vent injections.The optimized LVI settings, together with the hot splitlessinjection and cold splitless injection settings for comparison,are listed in Table 3.
Table 1. Instrument parameters for the Agilent GC/MS/MSsystem.
10 µL syringe (p/n 5181-3360)Pre injection solvent A (acetone) washes: 3Post injection solvent B (acetonitrile) washes: 3Sample pumps: 3
Carrier gas Helium, constant pressure Inlet Multimode Inlet (MMI)Oven profile 75 °C for 2.57 min, to 150 °C at 50 °C/min, to
200 °C at 6 °C/min, to 300 °C at 16 °C/min, hold for1 min
Post run 3 min at 300 °C Capillary Flow Purged Ultimate Union usedTechnology for backflushing the analytical column and inlet
Aux EPC gas: Helium plumbed to Purged UltimateUnion
Bleed line 0.0625 in od x 0.010 in id x 100 cm, 316 SS tubing,on top of the oven (p/n 0100-2354)
Aux pressure 4 psi during run, 75 psi during backflushingAnalytical column Agilent J&W HP-5ms Ultra Inert, 0.25 mm x 15 m,
0.25 µm (p/n 19091-431UI)Column connections Between inlet and Purged Ultimate UnionRestrictor Inert fused silica tubing, 0.15 mm x 650 mm
(p/n 160-7625-5)Restrictor connections Between Purged Ultimate Union and the MSMS Agilent 7000 Series GC/MS Triple Quadrupole Mode MRMTransfer line temperature 300 °CSource temperature 300 °CQuad temperature Q1 and Q2 = 150 °C Solvent delay 2.57 min Collision gas flows Helium quench gas at 2.35 mL/min, N2 collision
as at 1.5 mL/minMS resolution MS1 and MS2 = 1.2 amu (low resolution or wide
Capillary flow Ultimate Union (p/n G3182-61580)technology Internal nut (p/n G2855-20530)
SilTite metal ferrules, for 0.10 to 0.25 mm idcolumns, 10/pk (p/n 5188-5361)
Inlet liners Ultra Inert deactivated single taper splitless liner with wool (p/n 5190-2293), 5/pk (p/n 5190-3163)
Table 3. Agilent MMI parameters for different injection modes.
Parameter Hot splitless Cold splitless Solvent vent (LVI)
Initial temperature (°C) 250 75 75
Initial time (min) – 0.02 0.085
Rate (°C/min) – 750 750
Final temperature (°C) – 350 350
Vent flow (mL/min) – – 100
Vent pressure (psig) – – 2.5
Vent time (min) – – 0.085
Purge flow (mL/min) 60 60 60
Purge time (min) 1 1 2.57
Injection volume (µL) 1 1 5
Injection speed Fast Fast 69 µL/min
Cryo Off On (Air) On (Air)
Cryo fault detection Off On On
Cryo temperature (°C) – 75 75
Results and Discussion
LVI method development and optimizationAs a solvent elimination technique, LVI is a function of thesolvent type, inlet temperature, vent flow of evaporation gas,and analyte boiling point. Furthermore, inlet pressure duringevaporation, vent time, and inlet liner also have an impact onthe rate of solvent removal and entire system performance.The optimization process of these parameters is discussed indetail.
LVI method development and optimization on MMI wereinitially based on the solvent elimination calculator integratedin the instrument control software. This calculator wasdesigned to determine reasonable starting conditions for anLVI method. When the MMI is put into the programmed
4
temperature vaporizer (PTV) solvent vent mode, an additionalbutton appears on the inlet screen, as shown in Figure 3 ofthe LVI tutorial [1]. On the first screen of the solventelimination calculator (Figure 4 in LVI tutorial [1]), samplesolvent, desired injection volume, and boiling point of theearliest eluting analyte need to be entered. The calculatoruses these parameters to calculate the starting LVIconditions.
The QuEChERS sample preparation protocol has gained wideattention for multiresidue pesticide analysis in food in recentyears. Because acetonitrile is the most common solvent forQuEChERS extraction, the method was developed andoptimized based on acetonitrile. Although LVI can analyze upto 50 µL of sample in an MMI [1], 5 µL injection volume wasused in this study due to the concern of excess samplematrix. The boiling point of the first eluting analyte was left at150 °C, as suggested by the calculator. The next screen(Figure 5 in LVI tutorial [1]) showed calculated results and thefive parameters that can be adjusted, including inlettemperature, vent flow, injected volume, vent pressure, andoutlet pressure.
During the optimization process, it was noticed that earlyeluting analytes were more sensitive to the parametersettings, while the middle-to-late eluters did not show muchdifference. The early eluting pesticides usually have lowboiling points, and so they tend to be more sensitive to thesolvent evaporation conditions. Acetonitrile is not a suitablesolvent for a nonpolar GC column such as the HP-5ms UltraInert. Due to the polarity difference, acetonitrile could not wetthe stationary phase very well. This caused analyte peak
splitting when using the oven program for solvent focusing,especially with the early eluters. As a result, the LVIoptimization process was centered to achieve better recoveryand peak shape of early eluting pesticides.
Vent flowThe calculator recommended 30 °C for inlet temperature. Itwas difficult to reach this temperature with air cooling, andso 70 °C was used during vent flow optimization. Thecalculated vent flow was 100 mL/min. However, vent flows of50, 100, 150, and 300 mL/min were investigated.
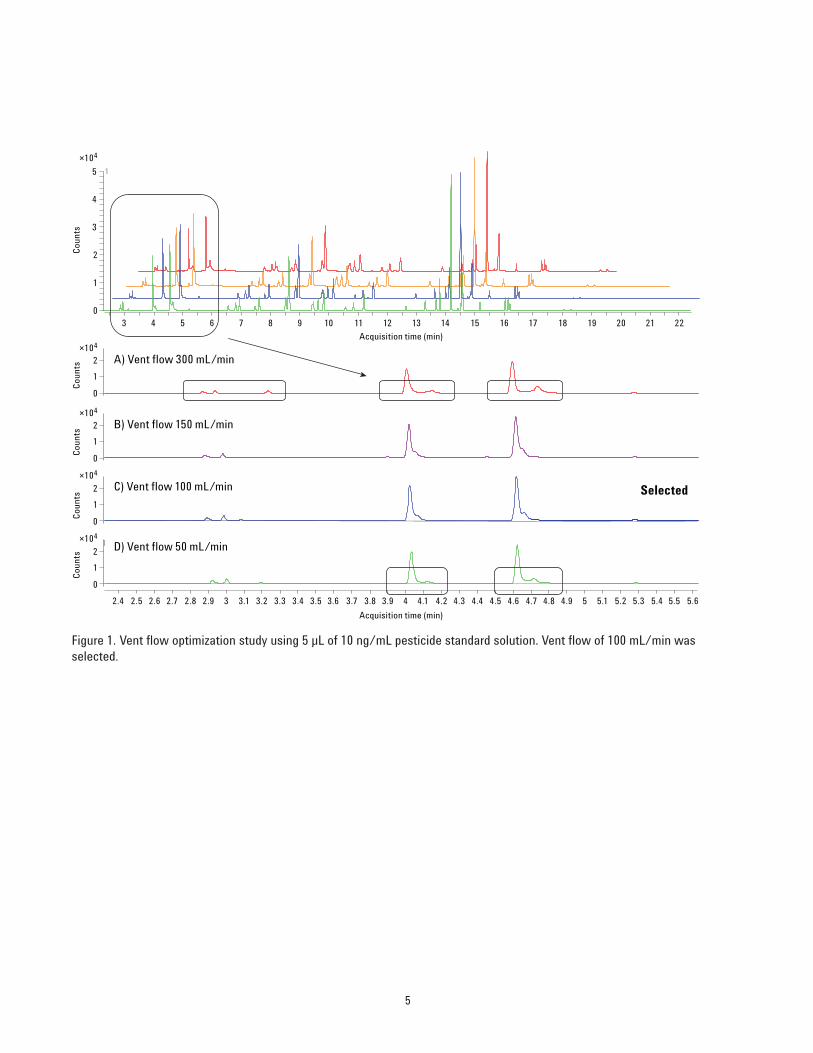
Vent flow has a linear effect on solvent elimination, that is,higher vent flow provides faster solvent evaporation.However, fast solvent elimination can result in the loss ofanalytes, especially the more volatile compounds. The“suggested injection rate” is designed to leave a smallamount of solvent in the liner at the end of the venting periodto trap the more volatile analytes. Therefore, a faster injectionrate is accompanied by higher vent flow. Figure 1 shows thechromatograms from four different vent flows. Higher ventflow of 100 and 150 mL/min showed more compact peakshape than lower vent flow of 50 mL/min, which indicatedthat faster solvent elimination (up to 150 mL/min) washelpful to prevent solvent-caused peak splitting. When ventflow goes too high, 300 mL/min, lower responses indicateloss of analytes. As 100 and 150 mL/min vent flow gavesimilar results, 100 mL/min was selected due to less risk ofanalyte loss.
Figure 1. Vent flow optimization study using 5 µL of 10 ng/mL pesticide standard solution. Vent flow of 100 mL/min wasselected.
6
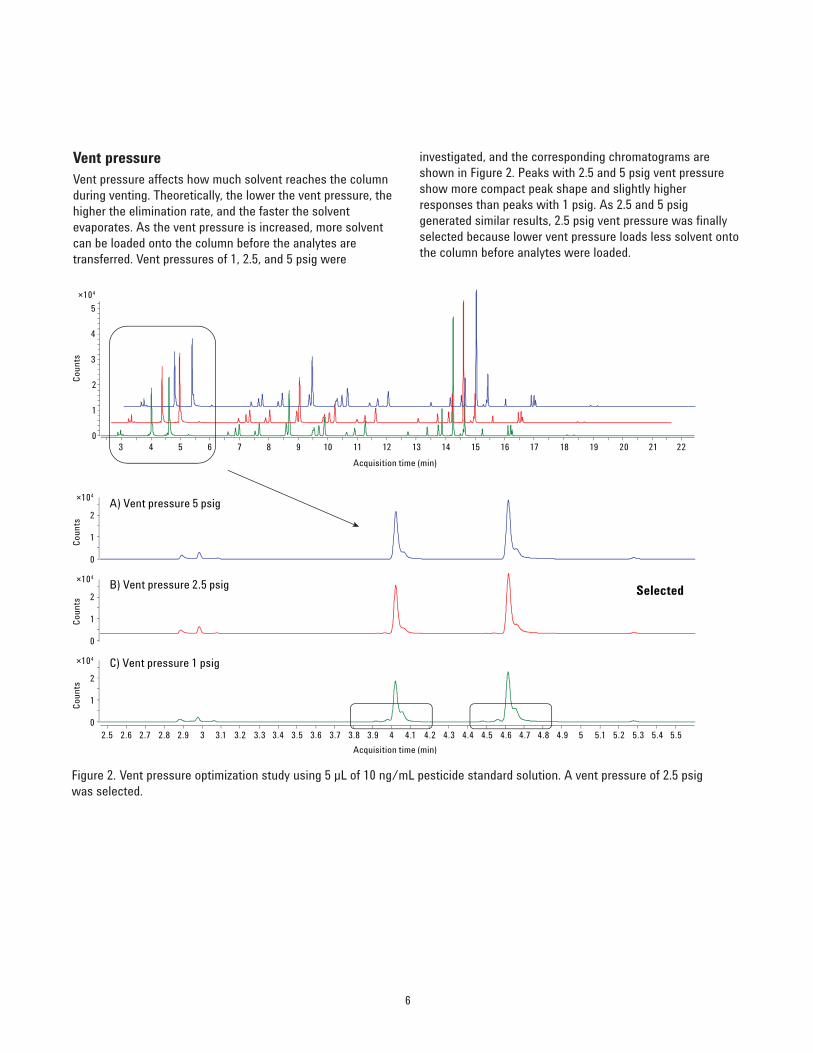
Vent pressureVent pressure affects how much solvent reaches the columnduring venting. Theoretically, the lower the vent pressure, thehigher the elimination rate, and the faster the solventevaporates. As the vent pressure is increased, more solventcan be loaded onto the column before the analytes aretransferred. Vent pressures of 1, 2.5, and 5 psig were
investigated, and the corresponding chromatograms areshown in Figure 2. Peaks with 2.5 and 5 psig vent pressureshow more compact peak shape and slightly higherresponses than peaks with 1 psig. As 2.5 and 5 psiggenerated similar results, 2.5 psig vent pressure was finallyselected because lower vent pressure loads less solvent ontothe column before analytes were loaded.
Figure 2. Vent pressure optimization study using 5 µL of 10 ng/mL pesticide standard solution. A vent pressure of 2.5 psig was selected.
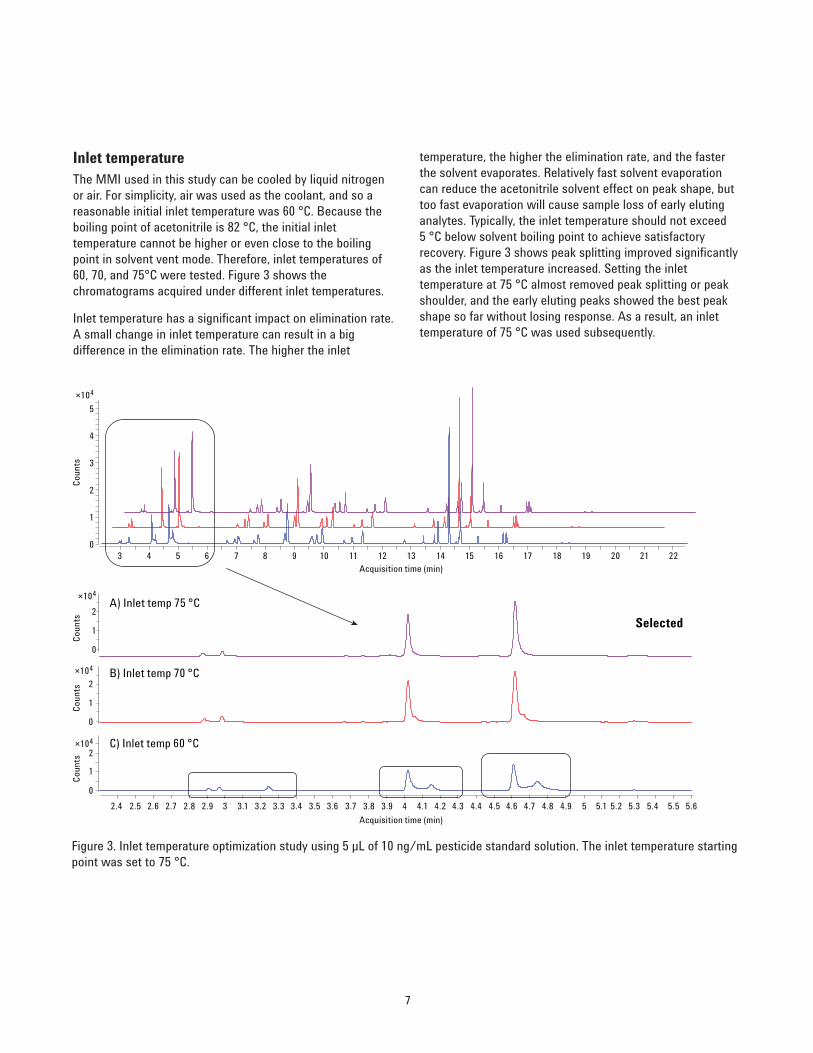
Inlet temperatureThe MMI used in this study can be cooled by liquid nitrogenor air. For simplicity, air was used as the coolant, and so areasonable initial inlet temperature was 60 °C. Because theboiling point of acetonitrile is 82 °C, the initial inlettemperature cannot be higher or even close to the boilingpoint in solvent vent mode. Therefore, inlet temperatures of60, 70, and 75°C were tested. Figure 3 shows thechromatograms acquired under different inlet temperatures.
Inlet temperature has a significant impact on elimination rate.A small change in inlet temperature can result in a bigdifference in the elimination rate. The higher the inlet
temperature, the higher the elimination rate, and the fasterthe solvent evaporates. Relatively fast solvent evaporationcan reduce the acetonitrile solvent effect on peak shape, buttoo fast evaporation will cause sample loss of early elutinganalytes. Typically, the inlet temperature should not exceed5 °C below solvent boiling point to achieve satisfactoryrecovery. Figure 3 shows peak splitting improved significantlyas the inlet temperature increased. Setting the inlettemperature at 75 °C almost removed peak splitting or peakshoulder, and the early eluting peaks showed the best peakshape so far without losing response. As a result, an inlettemperature of 75 °C was used subsequently.
Figure 3. Inlet temperature optimization study using 5 µL of 10 ng/mL pesticide standard solution. The inlet temperature startingpoint was set to 75 °C.
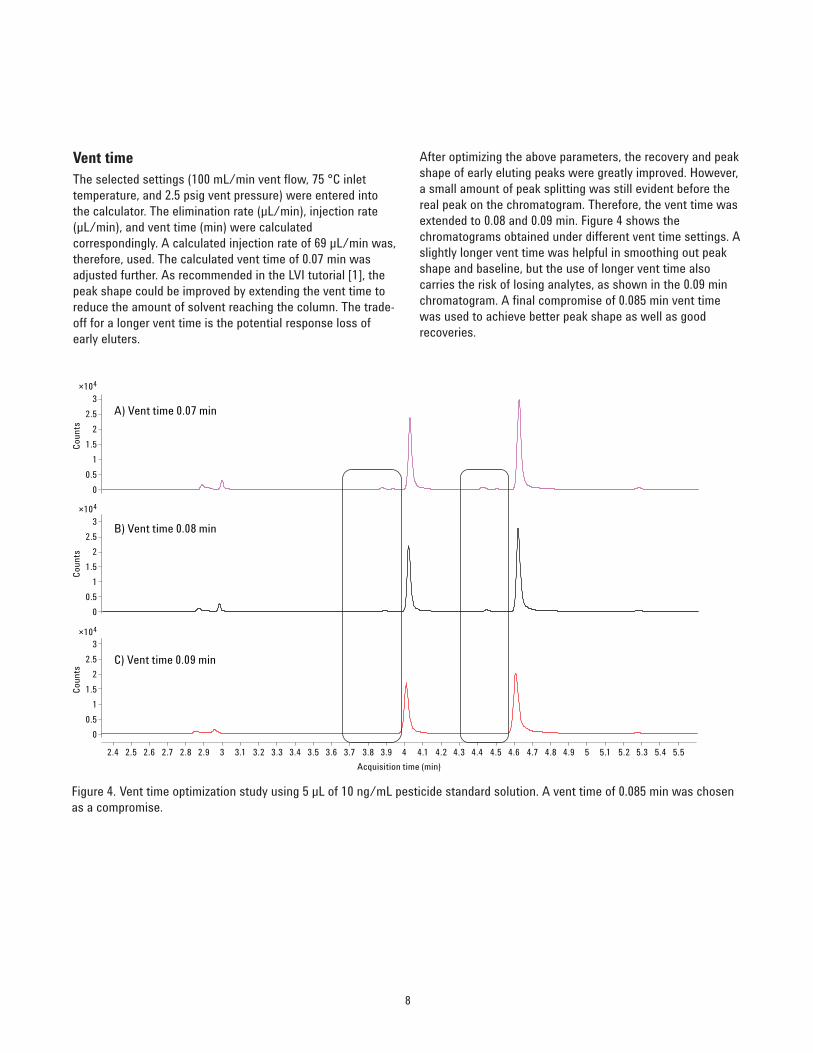
Vent timeThe selected settings (100 mL/min vent flow, 75 °C inlettemperature, and 2.5 psig vent pressure) were entered intothe calculator. The elimination rate (µL/min), injection rate(µL/min), and vent time (min) were calculatedcorrespondingly. A calculated injection rate of 69 µL/min was,therefore, used. The calculated vent time of 0.07 min wasadjusted further. As recommended in the LVI tutorial [1], thepeak shape could be improved by extending the vent time toreduce the amount of solvent reaching the column. The trade-off for a longer vent time is the potential response loss ofearly eluters.
After optimizing the above parameters, the recovery and peakshape of early eluting peaks were greatly improved. However,a small amount of peak splitting was still evident before thereal peak on the chromatogram. Therefore, the vent time wasextended to 0.08 and 0.09 min. Figure 4 shows thechromatograms obtained under different vent time settings. Aslightly longer vent time was helpful in smoothing out peakshape and baseline, but the use of longer vent time alsocarries the risk of losing analytes, as shown in the 0.09 minchromatogram. A final compromise of 0.085 min vent timewas used to achieve better peak shape as well as goodrecoveries.
Figure 4. Vent time optimization study using 5 µL of 10 ng/mL pesticide standard solution. A vent time of 0.085 min was chosenas a compromise.
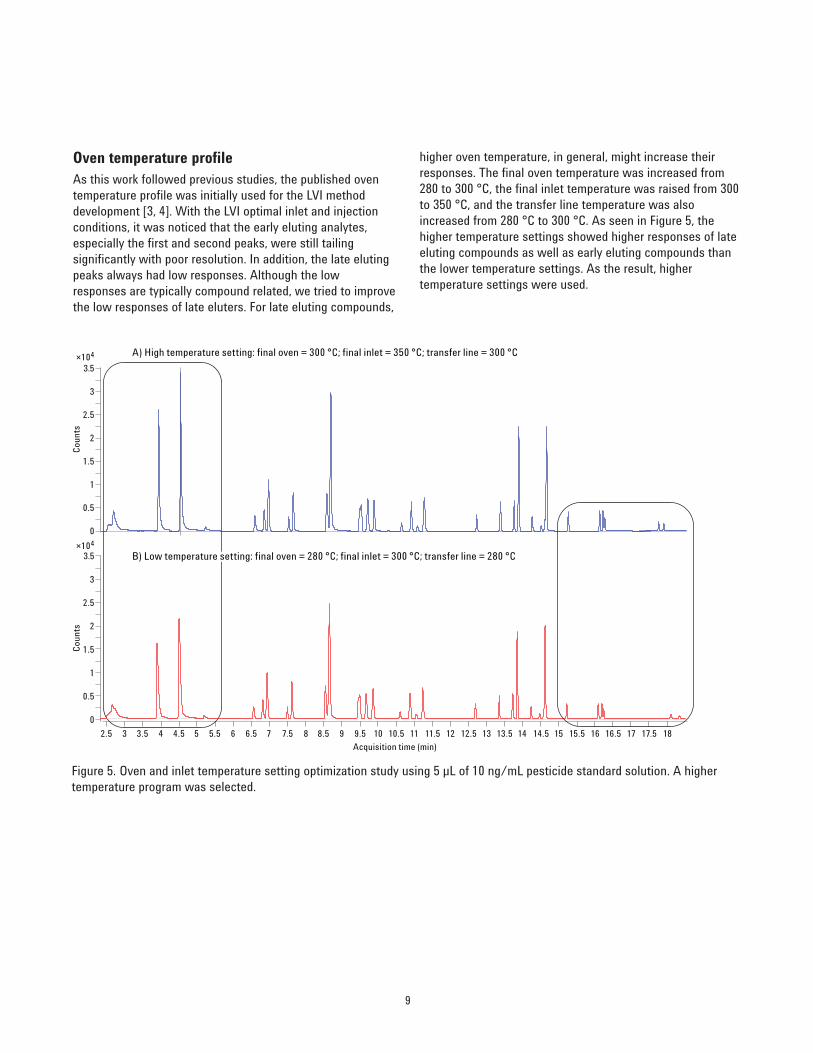
Oven temperature profileAs this work followed previous studies, the published oventemperature profile was initially used for the LVI methoddevelopment [3, 4]. With the LVI optimal inlet and injectionconditions, it was noticed that the early eluting analytes,especially the first and second peaks, were still tailingsignificantly with poor resolution. In addition, the late elutingpeaks always had low responses. Although the lowresponses are typically compound related, we tried to improvethe low responses of late eluters. For late eluting compounds,
higher oven temperature, in general, might increase theirresponses. The final oven temperature was increased from280 to 300 °C, the final inlet temperature was raised from 300to 350 °C, and the transfer line temperature was alsoincreased from 280 °C to 300 °C. As seen in Figure 5, thehigher temperature settings showed higher responses of lateeluting compounds as well as early eluting compounds thanthe lower temperature settings. As the result, highertemperature settings were used.
Figure 5. Oven and inlet temperature setting optimization study using 5 µL of 10 ng/mL pesticide standard solution. A highertemperature program was selected.
0
0.5
1
1.5
2
2.5
3
3.5
0
0.5
1
1.5
2
2.5
3
3.5
×104
×104
A) High temperature setting: final oven = 300 °C; final inlet = 350 °C; transfer line = 300 °C
B) Low temperature setting: final oven = 280 °C; final inlet = 300 °C; transfer line = 280 °C
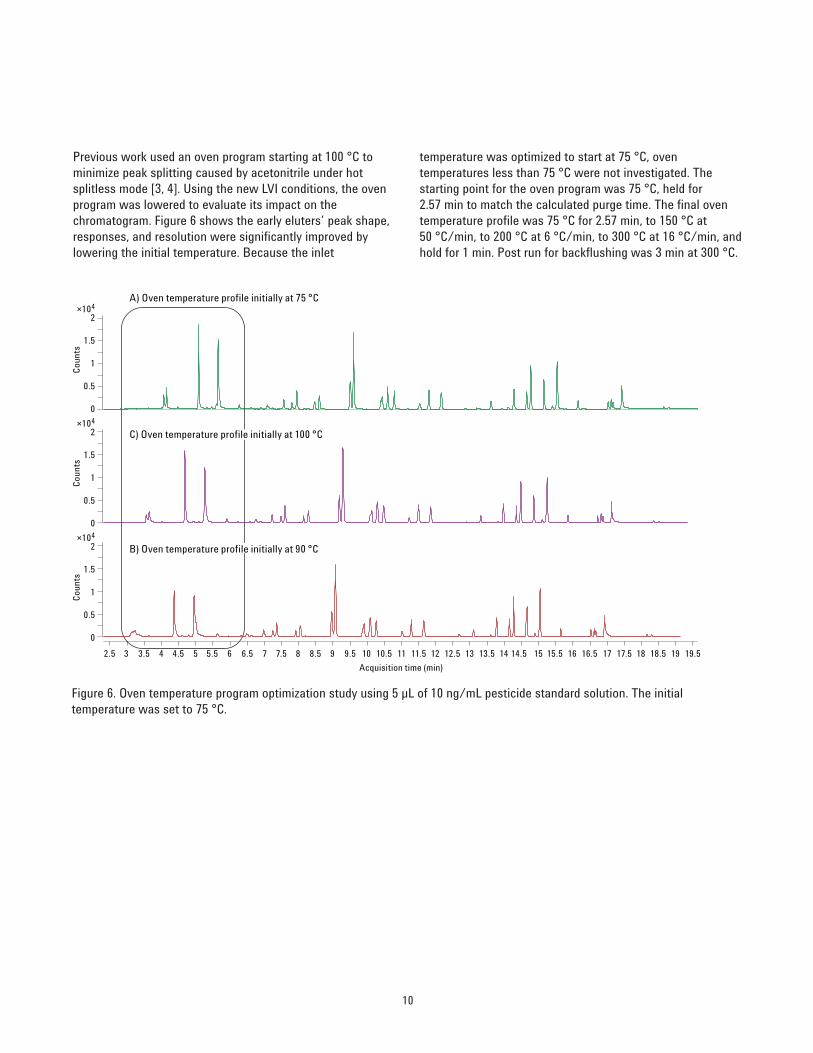
Previous work used an oven program starting at 100 °C tominimize peak splitting caused by acetonitrile under hotsplitless mode [3, 4]. Using the new LVI conditions, the ovenprogram was lowered to evaluate its impact on thechromatogram. Figure 6 shows the early eluters’ peak shape,responses, and resolution were significantly improved bylowering the initial temperature. Because the inlet
temperature was optimized to start at 75 °C, oventemperatures less than 75 °C were not investigated. Thestarting point for the oven program was 75 °C, held for2.57 min to match the calculated purge time. The final oventemperature profile was 75 °C for 2.57 min, to 150 °C at50 °C/min, to 200 °C at 6 °C/min, to 300 °C at 16 °C/min, andhold for 1 min. Post run for backflushing was 3 min at 300 °C.
Figure 6. Oven temperature program optimization study using 5 µL of 10 ng/mL pesticide standard solution. The initialtemperature was set to 75 °C.
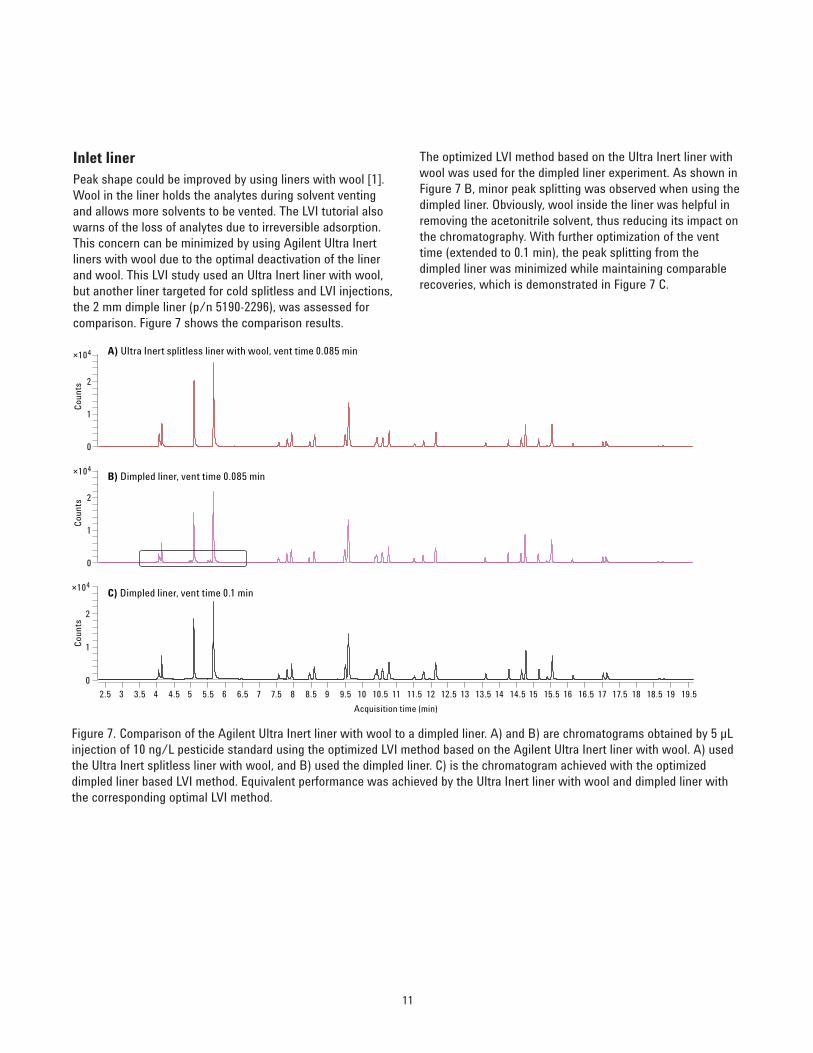
Inlet linerPeak shape could be improved by using liners with wool [1].Wool in the liner holds the analytes during solvent ventingand allows more solvents to be vented. The LVI tutorial alsowarns of the loss of analytes due to irreversible adsorption.This concern can be minimized by using Agilent Ultra Inertliners with wool due to the optimal deactivation of the linerand wool. This LVI study used an Ultra Inert liner with wool,but another liner targeted for cold splitless and LVI injections,the 2 mm dimple liner (p/n 5190-2296), was assessed forcomparison. Figure 7 shows the comparison results.
The optimized LVI method based on the Ultra Inert liner withwool was used for the dimpled liner experiment. As shown inFigure 7 B, minor peak splitting was observed when using thedimpled liner. Obviously, wool inside the liner was helpful inremoving the acetonitrile solvent, thus reducing its impact onthe chromatography. With further optimization of the venttime (extended to 0.1 min), the peak splitting from thedimpled liner was minimized while maintaining comparablerecoveries, which is demonstrated in Figure 7 C.
Figure 7. Comparison of the Agilent Ultra Inert liner with wool to a dimpled liner. A) and B) are chromatograms obtained by 5 µLinjection of 10 ng/L pesticide standard using the optimized LVI method based on the Agilent Ultra Inert liner with wool. A) usedthe Ultra Inert splitless liner with wool, and B) used the dimpled liner. C) is the chromatogram achieved with the optimizeddimpled liner based LVI method. Equivalent performance was achieved by the Ultra Inert liner with wool and dimpled liner withthe corresponding optimal LVI method.
0
1
2
0
1
2
0
1
2
×104
×104
×104
A) Ultra Inert splitless liner with wool, vent time 0.085 min
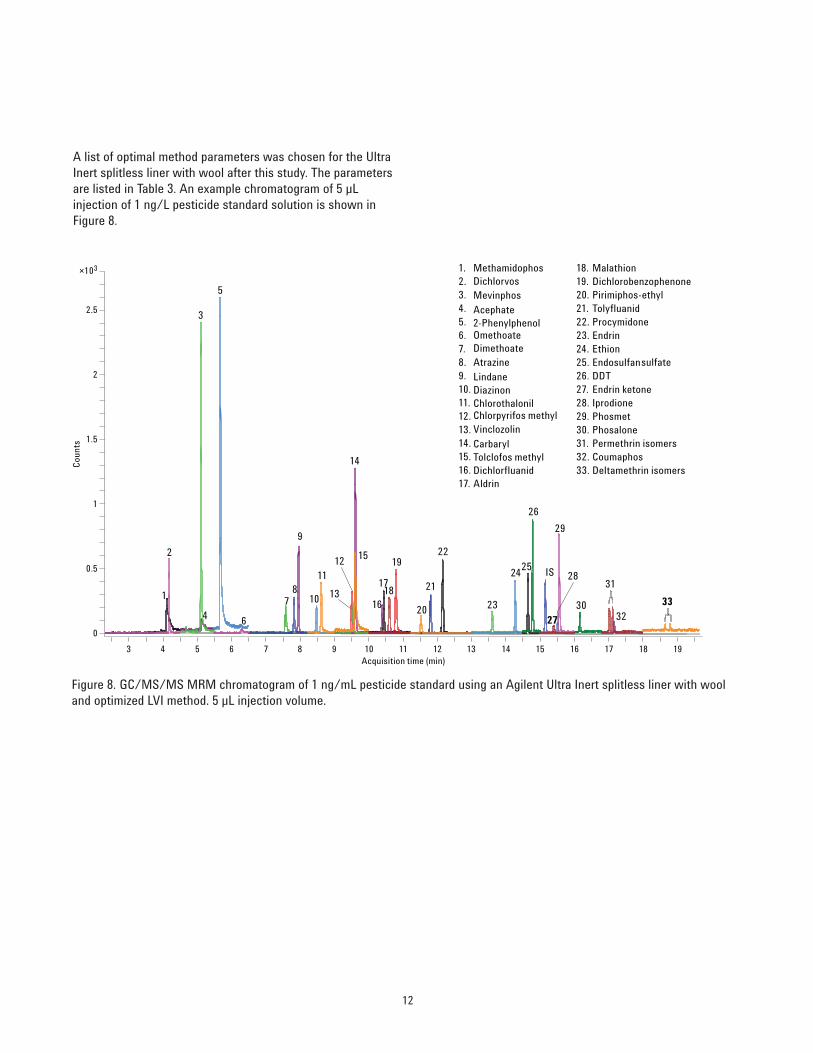
A list of optimal method parameters was chosen for the UltraInert splitless liner with wool after this study. The parametersare listed in Table 3. An example chromatogram of 5 µLinjection of 1 ng/L pesticide standard solution is shown inFigure 8.
Figure 8. GC/MS/MS MRM chromatogram of 1 ng/mL pesticide standard using an Agilent Ultra Inert splitless liner with wooland optimized LVI method. 5 µL injection volume.
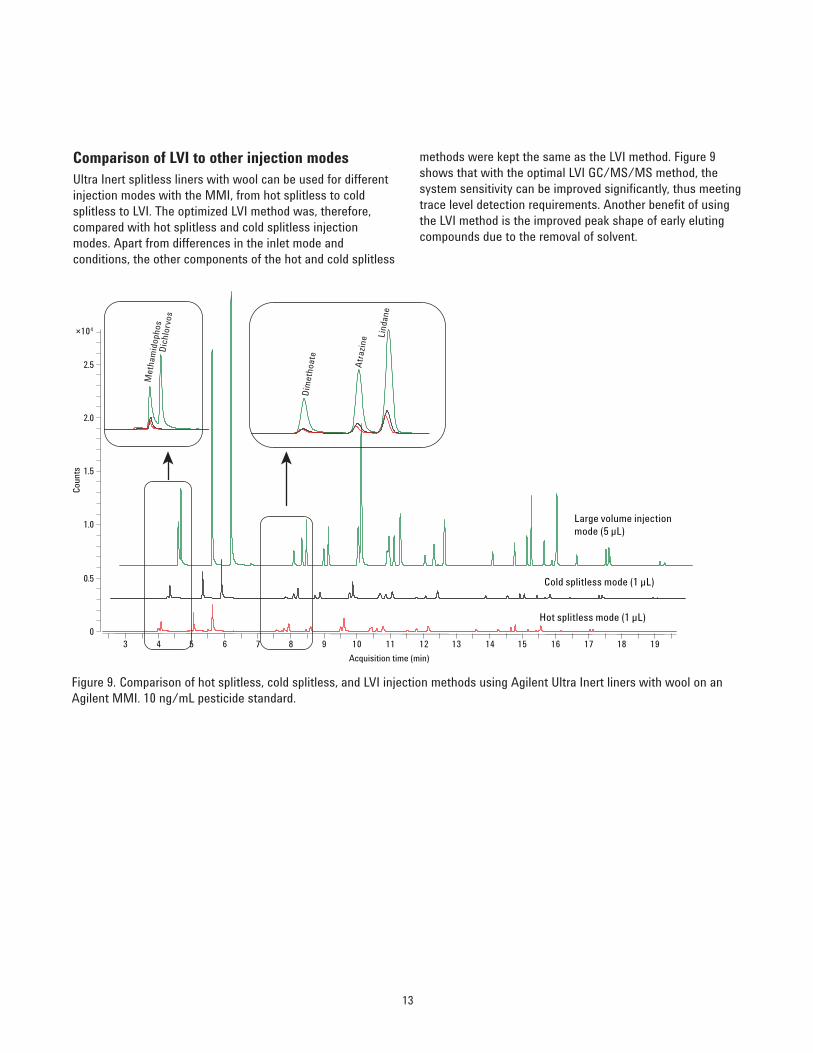
Comparison of LVI to other injection modesUltra Inert splitless liners with wool can be used for differentinjection modes with the MMI, from hot splitless to coldsplitless to LVI. The optimized LVI method was, therefore,compared with hot splitless and cold splitless injectionmodes. Apart from differences in the inlet mode andconditions, the other components of the hot and cold splitless
methods were kept the same as the LVI method. Figure 9shows that with the optimal LVI GC/MS/MS method, thesystem sensitivity can be improved significantly, thus meetingtrace level detection requirements. Another benefit of usingthe LVI method is the improved peak shape of early elutingcompounds due to the removal of solvent.
Figure 9. Comparison of hot splitless, cold splitless, and LVI injection methods using Agilent Ultra Inert liners with wool on anAgilent MMI. 10 ng/mL pesticide standard.
0
0.5
1.0
1.5
2.0
2.5
3 4 5 6 7 8 9 10 11
Acquisition time (min)
Coun
ts
12 13 14 15 16 17 18 19
Large volume injectionmode (5 µL)
Cold splitless mode (1 µL)
Hot splitless mode (1 µL)
Met
ham
idop
hos
Dic
hlor
vos
Dim
etho
ate
Atr
azin
e Lind
ane
×104
14
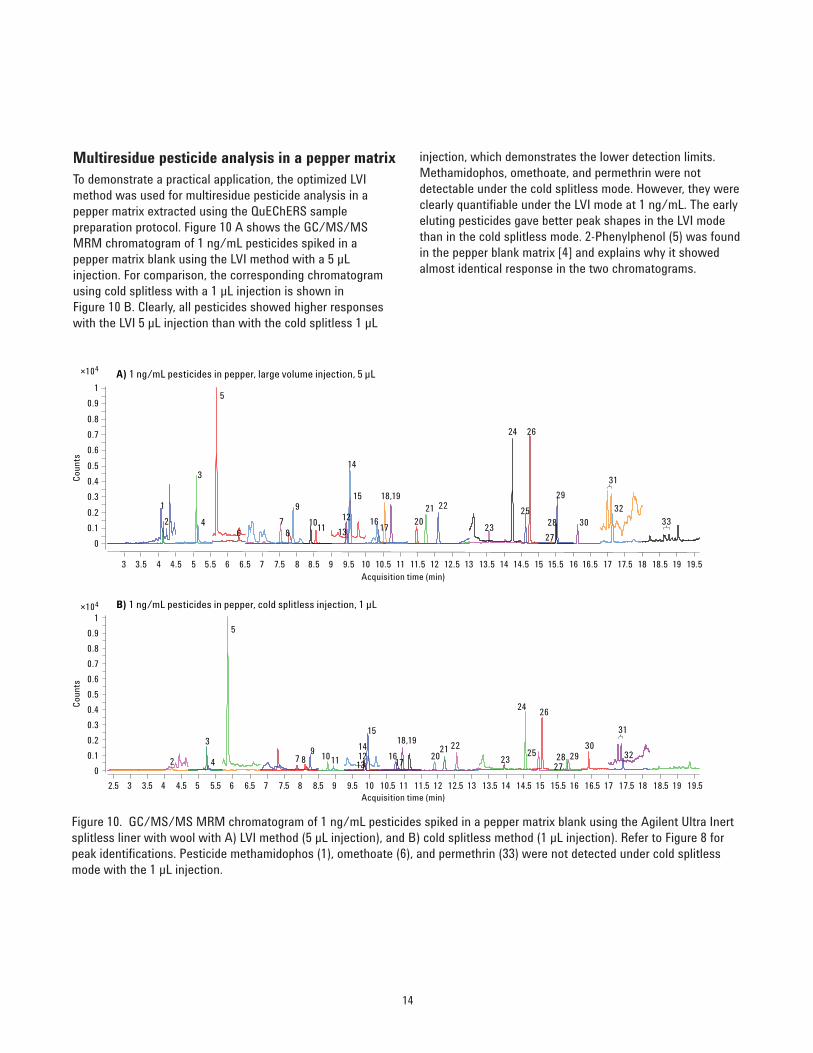
Multiresidue pesticide analysis in a pepper matrixTo demonstrate a practical application, the optimized LVImethod was used for multiresidue pesticide analysis in apepper matrix extracted using the QuEChERS samplepreparation protocol. Figure 10 A shows the GC/MS/MSMRM chromatogram of 1 ng/mL pesticides spiked in apepper matrix blank using the LVI method with a 5 µLinjection. For comparison, the corresponding chromatogramusing cold splitless with a 1 µL injection is shown inFigure 10 B. Clearly, all pesticides showed higher responseswith the LVI 5 µL injection than with the cold splitless 1 µL
injection, which demonstrates the lower detection limits.Methamidophos, omethoate, and permethrin were notdetectable under the cold splitless mode. However, they wereclearly quantifiable under the LVI mode at 1 ng/mL. The earlyeluting pesticides gave better peak shapes in the LVI modethan in the cold splitless mode. 2-Phenylphenol (5) was foundin the pepper blank matrix [4] and explains why it showedalmost identical response in the two chromatograms.
Figure 10. GC/MS/MS MRM chromatogram of 1 ng/mL pesticides spiked in a pepper matrix blank using the Agilent Ultra Inertsplitless liner with wool with A) LVI method (5 µL injection), and B) cold splitless method (1 µL injection). Refer to Figure 8 forpeak identifications. Pesticide methamidophos (1), omethoate (6), and permethrin (33) were not detected under cold splitlessmode with the 1 µL injection.
A) 1 ng/mL pesticides in pepper, large volume injection, 5 µL
B) 1 ng/mL pesticides in pepper, cold splitless injection, 1 µL
Acquisition time (min)
Acquisition time (min)
Cou
nts
Cou
nts
15
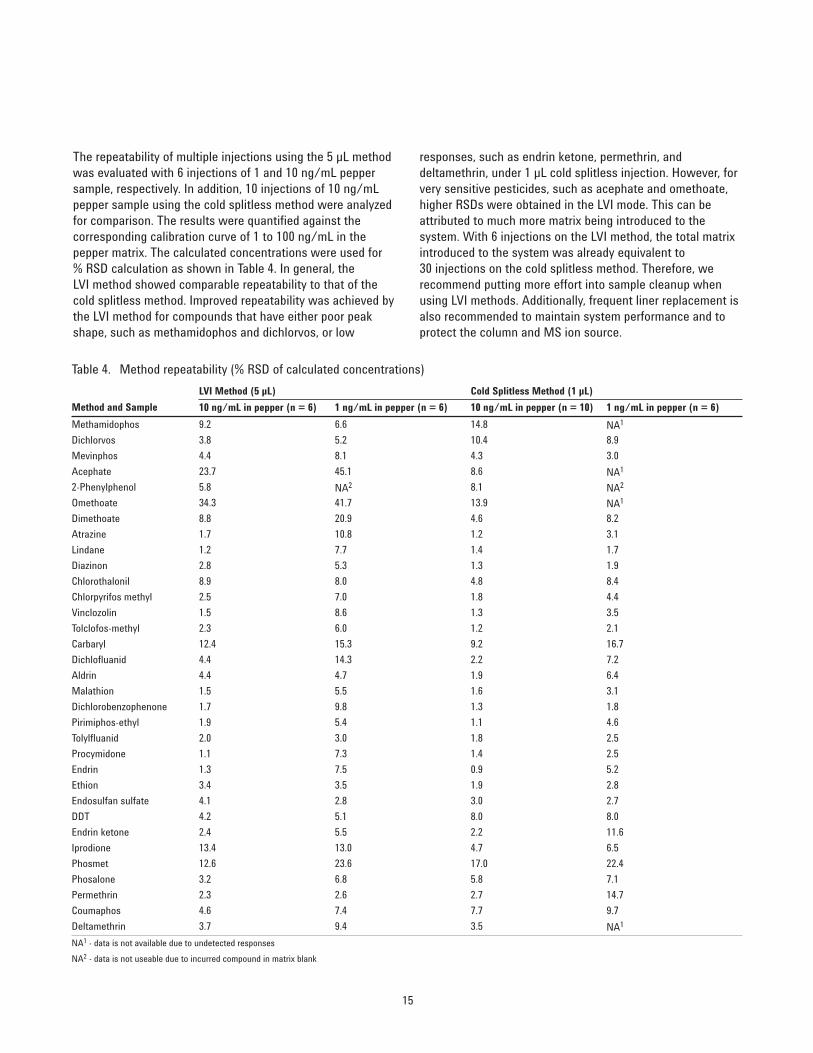
The repeatability of multiple injections using the 5 µL methodwas evaluated with 6 injections of 1 and 10 ng/mL peppersample, respectively. In addition, 10 injections of 10 ng/mLpepper sample using the cold splitless method were analyzedfor comparison. The results were quantified against thecorresponding calibration curve of 1 to 100 ng/mL in thepepper matrix. The calculated concentrations were used for% RSD calculation as shown in Table 4. In general, theLVI method showed comparable repeatability to that of thecold splitless method. Improved repeatability was achieved bythe LVI method for compounds that have either poor peakshape, such as methamidophos and dichlorvos, or low
responses, such as endrin ketone, permethrin, anddeltamethrin, under 1 µL cold splitless injection. However, forvery sensitive pesticides, such as acephate and omethoate,higher RSDs were obtained in the LVI mode. This can beattributed to much more matrix being introduced to thesystem. With 6 injections on the LVI method, the total matrixintroduced to the system was already equivalent to30 injections on the cold splitless method. Therefore, werecommend putting more effort into sample cleanup whenusing LVI methods. Additionally, frequent liner replacement isalso recommended to maintain system performance and toprotect the column and MS ion source.
Table 4. Method repeatability (% RSD of calculated concentrations)
Method and Sample
LVI Method (5 µL) Cold Splitless Method (1 µL)
10 ng/mL in pepper (n = 6) 1 ng/mL in pepper (n = 6) 10 ng/mL in pepper (n = 10) 1 ng/mL in pepper (n = 6)
Methamidophos 9.2 6.6 14.8 NA1
Dichlorvos 3.8 5.2 10.4 8.9
Mevinphos 4.4 8.1 4.3 3.0
Acephate 23.7 45.1 8.6 NA1
2-Phenylphenol 5.8 NA2 8.1 NA2
Omethoate 34.3 41.7 13.9 NA1
Dimethoate 8.8 20.9 4.6 8.2
Atrazine 1.7 10.8 1.2 3.1
Lindane 1.2 7.7 1.4 1.7
Diazinon 2.8 5.3 1.3 1.9
Chlorothalonil 8.9 8.0 4.8 8.4
Chlorpyrifos methyl 2.5 7.0 1.8 4.4
Vinclozolin 1.5 8.6 1.3 3.5
Tolclofos-methyl 2.3 6.0 1.2 2.1
Carbaryl 12.4 15.3 9.2 16.7
Dichlofluanid 4.4 14.3 2.2 7.2
Aldrin 4.4 4.7 1.9 6.4
Malathion 1.5 5.5 1.6 3.1
Dichlorobenzophenone 1.7 9.8 1.3 1.8
Pirimiphos-ethyl 1.9 5.4 1.1 4.6
Tolylfluanid 2.0 3.0 1.8 2.5
Procymidone 1.1 7.3 1.4 2.5
Endrin 1.3 7.5 0.9 5.2
Ethion 3.4 3.5 1.9 2.8
Endosulfan sulfate 4.1 2.8 3.0 2.7
DDT 4.2 5.1 8.0 8.0
Endrin ketone 2.4 5.5 2.2 11.6
Iprodione 13.4 13.0 4.7 6.5
Phosmet 12.6 23.6 17.0 22.4
Phosalone 3.2 6.8 5.8 7.1
Permethrin 2.3 2.6 2.7 14.7
Coumaphos 4.6 7.4 7.7 9.7
Deltamethrin 3.7 9.4 3.5 NA1
NA1 - data is not available due to undetected responses
NA2 - data is not useable due to incurred compound in matrix blank
www.agilent.com/chem
Agilent shall not be liable for errors contained herein or for incidental or consequentialdamages in connection with the furnishing, performance, or use of this material.
Information, descriptions, and specifications in this publication are subject to changewithout notice.
This application note shows the development andoptimization of an LVI GC/MS/MS method using the AgilentUltra Inert splitless liner with wool and the AgilentJ&W HP-5ms Ultra Inert GC column for multiresiduepesticide analysis. Based on the solvent eliminationcalculator imbedded in the instrument control software, themethod optimization was conducted according to theevaluation of critical parameters, including vent flow, ventpressure, inlet temperature, vent time, oven temperatureprogram, and inlet liner. The optimized LVI method providedlower detection limits for all compounds and better peakshape for early eluting compounds when compared to coldsplitless and hot splitless methods. A pepper matrix,extracted with the QuEChERS sample preparation protocol,was used to evaluate detection limits and methodrepeatability. The lower detection limits and betterrepeatability for low response compounds weredemonstrated. When using an LVI method, sample matrixhad more impact on liner durability, especially for activepesticides, due to the larger amount of sample matrix beingintroduced to the system. Frequent liner replacement is,therefore, recommended to maintain system performanceand to protect the column and MS ion source. In addition,investing in sample cleanup is very helpful in achievingbetter results when using LVI methods.
References
1. Agilent Multimode Inlet Large Volume Injection. Tutorial,Agilent Technologies, Inc., Part number G3510-90020(2009).
2. B. Wilson, C-K Meng. “Achieving Lower Detection LimitsEasily with the Agilent Multimode Inlet (MMI)”.Application Note, Agilent Technologies, Inc., PublicationNumber 5990-4169EN (2009).
3. L. Zhao, D. Mao. “Analysis of Pesticides in Food byGC/MS/MS Using the Ultra Inert Liners with Wool”.Application Note, Agilent Technologies, Inc., PublicationNumber 5990-7706EN (2011).
4. L. Zhao, C-K Meng. “Quantitative and RepeatabilityAnalysis of Trace Level Pesticides in Plantation Food byGC/MS/MS”. Application Note, Agilent Technologies,Inc., Publication Number 5990-9317EN (2011).
5. M.J. Szelewski, B. Quimby. “New Tools for RapidPesticide Analysis in High Matrix Samples”. ApplicationNote, Agilent Technologies, Inc., Publication Number5989-1716EN (2011).
6. C-K. Meng. “Improving Productivity and ExtendingColumn Life with Backflush”. Application Note, AgilentTechnologies, Inc., Publication Number 5989-6018EN(2006).
For More Information
These data represent typical results. For more informationon our products and services, visit our Web site atwww.agilent.com/chem.