Optothermally induced mechanicaloscillation in a silk fibroin coated high-QmicrosphereCite as: Appl. Phys. Lett. 116, 201104 (2020); https://doi.org/10.1063/1.5142649Submitted: 17 December 2019 . Accepted: 08 May 2020 . Published Online: 18 May 2020
Yiming Liu, Xuefeng Jiang, Changqing Wang, and Lan Yang
ARTICLES YOU MAY BE INTERESTED IN
Spinwave detection by nitrogen-vacancy centers in diamond as a function of probe–sampleseparationApplied Physics Letters 116, 202401 (2020); https://doi.org/10.1063/1.5141921
Flexible measurement of high-order optical orbital angular momentum with a variablecylindrical lens pairApplied Physics Letters 116, 201105 (2020); https://doi.org/10.1063/5.0002756
Optothermally induced mechanical oscillationin a silk fibroin coated high-Q microsphere
Cite as: Appl. Phys. Lett. 116, 201104 (2020); doi: 10.1063/1.5142649Submitted: 17 December 2019 . Accepted: 8 May 2020 .Published Online: 18 May 2020
Yiming Liu, Xuefeng Jiang, Changqing Wang, and Lan Yanga)
AFFILIATIONS
Electrical and Systems Engineering Department, Washington University, St. Louis, Missouri 63130, USA
a)Author to whom correspondence should be addressed: [email protected]
ABSTRACT
Protein-based optical devices with biocompatibility and biodegradability have distinct advantages for applications in biomedical sensing. Silkfibroin with unique optical, thermal, and mechanical properties renders great flexibility in designing functional photonic platforms. Here,we report the experimental observation of optothermally induced mechanical oscillation in a silk-fibroin coated microcavity. Theoreticalanalysis reveals that the observed oscillation results from the interplay of several nonlinear effects in the silk-coated-microsphere as well asthe coexistence of fast and slow thermal dynamic processes. The physics in our study breaks ground for the study of nonlinear dynamics ofstructural protein optical material that can be used for functional optical devices.
Published under license by AIP Publishing. https://doi.org/10.1063/1.5142649
Whispering gallery mode (WGM) microresonators1–4 with anultrahigh quality factor (Q) and a small mode volume, which couldstrongly enhance light-matter interaction, are suitable for both funda-mental physics and photonic applications such as sensing,5–14
lasing,15–22 nonlinear optics,23–27 optomechanics,28–30 cavity quantumelectrodynamics,31,32 and non-Hermitian optics.33–37 Particularly, aseries of optical and thermal nonlinear effects can occur inside the cav-ity at relatively low input power due to significantly enhanced lightintensities by resonance effects.38–47 Thermal nonlinear oscillatoryphenomena, such as regenerative pulsation at low temperature,48 oscil-latory instability resulting from thermal nonlinearity,39 and dynamicthermal behavior,38 have been demonstrated in high-Q pure silicamicroresonators. Typically, they originate from the interplay betweenthe resonance shift and optically induced effects, such as the thermal-optic effect, thermal expansion, free carrier dispersion, and Kerreffect.39,48–55 Recent studies based on hybrid microresonators have alsoshown various kinds of dynamics, such as (1) thermo-optomechanicaloscillation in poly(methyl methacrylate) (PMMA)-coated silica microt-oroids,56 (2) optical instability and self-pulsing in silicon nitride micro-resonators,50,54 and (3) thermal oscillation in polydimethylsiloxane(PDMS)-coated microresonators.51,52 In particular, optothermalmechanic effects enabled by thermal expansion of cavity materials havebeen demonstrated in PMMA-coated microtoroids56 and ZBLANmicrospheres.57 Such effects combine the mechanical properties ofoptical material with the field intensity enhancement in resonators and,thus, can potentially be applied to build photothermal actuators withlower power consumption and fast actuation.58
Natural structural proteins like bombyx mori silk fibroin areknown for their robust mechanical properties, simple control of mate-rial properties through adjusting the water content during processing,programmable degradation, high transparency in the visible light band(>95%), and unique optical and electronic properties.59 Consequently,silk-based optical devices are of great interest for in-vivo sensing appli-cations. However, the rich nonlinearity enabled by the interactionbetween mechanical and optical properties of silk-based photonicstructures remains largely unexplored.
Here, we experimentally demonstrate optothermally inducedmechanical oscillation in a silk fibroin-coated high-Q microsphere.This hybrid microsphere consists of a silica core and a silk fibroinnanolayer coating. Theoretical analysis reveals that the observed oscil-lation results from the interplay among the positive thermo-opticeffect of silica, negative thermo-optic effect, negative thermal expan-sion effect of silk fibroin, and dynamic thermal processes due to differ-ent thermal relaxation times in different regions of the structure. Thisoscillatory behavior is also found to be dependent on the optical inputpower. In contrast to previously studied hybrid microresonators suchas the optothermal oscillation in PDMS-coated microtoroids,51 the silkfibroin coating boosts the optothermo-mechanical (expansion) effectand results in this unique oscillatory waveform when coupled with thethermo-optical effect and the fast and slow thermal dynamic processesat different timescales.
The fabrication processes of the optical microresonator are pre-sented as follows. Reconstituted silk solution was prepared asdescribed in the previous literature.60 The process started with 2.5 g of
Appl. Phys. Lett. 116, 201104 (2020); doi: 10.1063/1.5142649 116, 201104-1
bombyx mori silkworm cocoons, which were cut into small pieces andthen boiled in 0.02M Na2CO3 solution to remove sericin. The silk fiberwas rinsed with cold ultrapure water for 20min three times to ensurecomplete removal. The degummed silk was subsequently dried in afume hood followed by a 4 h dissolution in 9.3M LiBr solution at60 �C. Next, the dissolved silk solution was dialyzed against 1 L ofultrapure water using a Slide-a-Lyzer dialysis cassette (MWCO 3500,Thermo Fisher) for 48 h. The water was changed regularly six timesduring this period. The dialyzed silk solution was finally centrifugedtwice at 9000 r.p.m at 4 �C for 20min, resulting in 8wt. % precursorsilk solution. This precursor solution was then diluted 80-fold to0.1wt. % for the coating purpose.
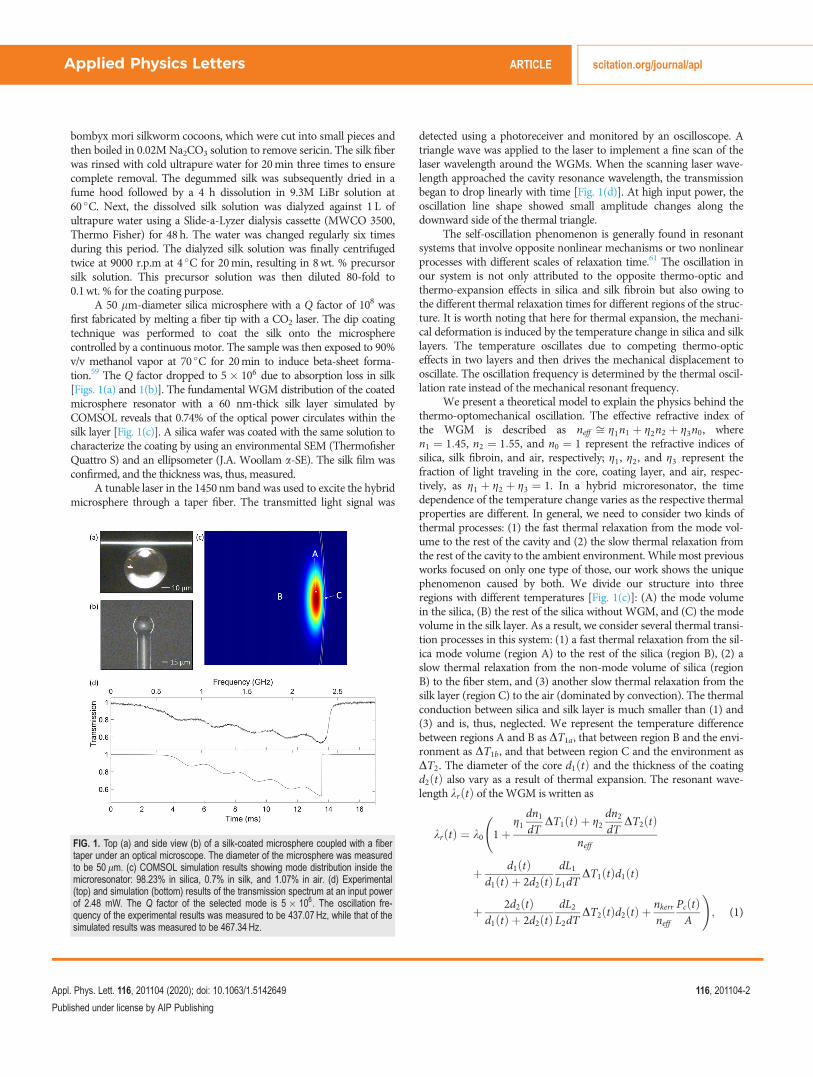
A 50 lm-diameter silica microsphere with a Q factor of 108 wasfirst fabricated by melting a fiber tip with a CO2 laser. The dip coatingtechnique was performed to coat the silk onto the microspherecontrolled by a continuous motor. The sample was then exposed to 90%v/v methanol vapor at 70 �C for 20min to induce beta-sheet forma-tion.59 The Q factor dropped to 5� 106 due to absorption loss in silk[Figs. 1(a) and 1(b)]. The fundamental WGM distribution of the coatedmicrosphere resonator with a 60 nm-thick silk layer simulated byCOMSOL reveals that 0.74% of the optical power circulates within thesilk layer [Fig. 1(c)]. A silica wafer was coated with the same solution tocharacterize the coating by using an environmental SEM (ThermofisherQuattro S) and an ellipsometer (J.A. Woollam a-SE). The silk film wasconfirmed, and the thickness was, thus, measured.
A tunable laser in the 1450nm band was used to excite the hybridmicrosphere through a taper fiber. The transmitted light signal was
detected using a photoreceiver and monitored by an oscilloscope. Atriangle wave was applied to the laser to implement a fine scan of thelaser wavelength around the WGMs. When the scanning laser wave-length approached the cavity resonance wavelength, the transmissionbegan to drop linearly with time [Fig. 1(d)]. At high input power, theoscillation line shape showed small amplitude changes along thedownward side of the thermal triangle.
The self-oscillation phenomenon is generally found in resonantsystems that involve opposite nonlinear mechanisms or two nonlinearprocesses with different scales of relaxation time.61 The oscillation inour system is not only attributed to the opposite thermo-optic andthermo-expansion effects in silica and silk fibroin but also owing tothe different thermal relaxation times for different regions of the struc-ture. It is worth noting that here for thermal expansion, the mechani-cal deformation is induced by the temperature change in silica and silklayers. The temperature oscillates due to competing thermo-opticeffects in two layers and then drives the mechanical displacement tooscillate. The oscillation frequency is determined by the thermal oscil-lation rate instead of the mechanical resonant frequency.
We present a theoretical model to explain the physics behind thethermo-optomechanical oscillation. The effective refractive index ofthe WGM is described as neff ffi g1n1 þ g2n2 þ g3n0, wheren1 ¼ 1:45, n2 ¼ 1:55, and n0 ¼ 1 represent the refractive indices ofsilica, silk fibroin, and air, respectively; g1, g2, and g3 represent thefraction of light traveling in the core, coating layer, and air, respec-tively, as g1 þ g2 þ g3 ¼ 1. In a hybrid microresonator, the timedependence of the temperature change varies as the respective thermalproperties are different. In general, we need to consider two kinds ofthermal processes: (1) the fast thermal relaxation from the mode vol-ume to the rest of the cavity and (2) the slow thermal relaxation fromthe rest of the cavity to the ambient environment. While most previousworks focused on only one type of those, our work shows the uniquephenomenon caused by both. We divide our structure into threeregions with different temperatures [Fig. 1(c)]: (A) the mode volumein the silica, (B) the rest of the silica without WGM, and (C) the modevolume in the silk layer. As a result, we consider several thermal transi-tion processes in this system: (1) a fast thermal relaxation from the sil-ica mode volume (region A) to the rest of the silica (region B), (2) aslow thermal relaxation from the non-mode volume of silica (regionB) to the fiber stem, and (3) another slow thermal relaxation from thesilk layer (region C) to the air (dominated by convection). The thermalconduction between silica and silk layer is much smaller than (1) and(3) and is, thus, neglected. We represent the temperature differencebetween regions A and B as DT1a, that between region B and the envi-ronment as DT1b, and that between region C and the environment asDT2. The diameter of the core d1 tð Þ and the thickness of the coatingd2 tð Þ also vary as a result of thermal expansion. The resonant wave-length kr tð Þ of the WGM is written as
kr tð Þ ¼ k0
1þ
g1dn1dT
DT1 tð Þ þ g2dn2dT
DT2 tð Þ
neff
þ d1 tð Þd1 tð Þ þ 2d2 tð Þ
dL1L1dT
DT1 tð Þd1 tð Þ
þ 2d2 tð Þd1 tð Þ þ 2d2 tð Þ
dL2L2dT
DT2 tð Þd2 tð Þ þ nkerrneff
Pc tð ÞA
!; (1)
FIG. 1. Top (a) and side view (b) of a silk-coated microsphere coupled with a fibertaper under an optical microscope. The diameter of the microsphere was measuredto be 50lm. (c) COMSOL simulation results showing mode distribution inside themicroresonator: 98.23% in silica, 0.7% in silk, and 1.07% in air. (d) Experimental(top) and simulation (bottom) results of the transmission spectrum at an input powerof 2.48 mW. The Q factor of the selected mode is 5� 106. The oscillation fre-quency of the experimental results was measured to be 437.07 Hz, while that of thesimulated results was measured to be 467.34 Hz.
where k0 is the cold cavity resonance wavelength; DT1 ¼ DT1aþDT1b
is the temperature difference between region A and the environment;dn1dT ¼ 1:2� 10�5K�1 and dn2
dT ¼�2:4� 10�4K�1 designate thethermo-optic coefficients of silica and silk fibroin, respectively;dL1L1dT¼ 5:5� 10�7K�1 and dL2
L2dT¼�2:4� 10�4K�1 represent the lin-
ear thermal expansion coefficients of silica and silk fibroin, respec-tively;51,62 nkerr represents the optical Kerr coefficient of silk fibroin; A
is the effective cross-sectional area of the WGM; and Pc tð Þ ¼EC tð Þj j2
srstands for the power of the intracavity field EC tð Þ, wheresr ¼ neff pðd1 þ 2d2Þ=c represents the cavity round trip time.
The temperature changes within and outside of the mode volumecan be expressed with the rate equations as follows:38,51,63
dDT1a tð Þdt
¼ �cth;1DT1a þ cabs;1Pc tð Þ; (2)
dDT1b tð Þdt
¼ �K1DT1b þ K2DT1a; (3)
dDT2 tð Þdt
¼ �cth;2DT2 þ cabs;2Pc tð Þ; (4)
where cth;i depicts the thermal relaxation rate and cabs;i describesthe thermal absorption coefficient (i ¼ 1: Silica, i ¼ 2: Silk). Theirvalues are obtained by curve fitting the experimental results:cth;1 ¼ 7:2� 104 Hz, cth;2 ¼ 1568Hz, cabs;1 ¼ 697:7K/J, and cabs;2¼ 600:3K/J. Here, K1 ¼ 1258Hz represents the thermal conduc-tivity between (b) and the surrounding, while K2 ¼ 23918Hz is thethermal conductivity between (a) and (b), the values of which areobtained by fitting. The next rate equation describes the dynamicsof the intracavity field,64
dEc tð Þdt¼ iDx� d0 � dcð ÞEc tð Þ �
ffiffiffiffiffiffiffi2dcp
Einffiffiffiffisrp ; (5)
where d0 ¼ xr=2Q0 denotes the intrinsic loss rate of the cavity, withQ0 being the intrinsic Q of the cavity, and dc ¼ xr=2Qc denotes thetaper-cavity coupling induced loss rate, with Qc representing the cou-pling Q. Dx tð Þ � xs tð Þ � xr tð Þ is the detuning between the pumpfrequency xs tð Þ and the resonance frequency xr tð Þ. The excitationfield Ein is related to the input power as Einj j2 ¼ Pinsr . Equation (5) iscalculated using the Runge–Kutta (fourth order) method to obtain theintracavity field value. The field output is written as
Eo tð Þ ¼ Ein tð Þ þ
ffiffiffiffiffiffiffi2dcsr
sEc tð Þ: (6)
The normalized transmission is calculated as T ¼ Eo tð Þ�� ��2= Einj j2.
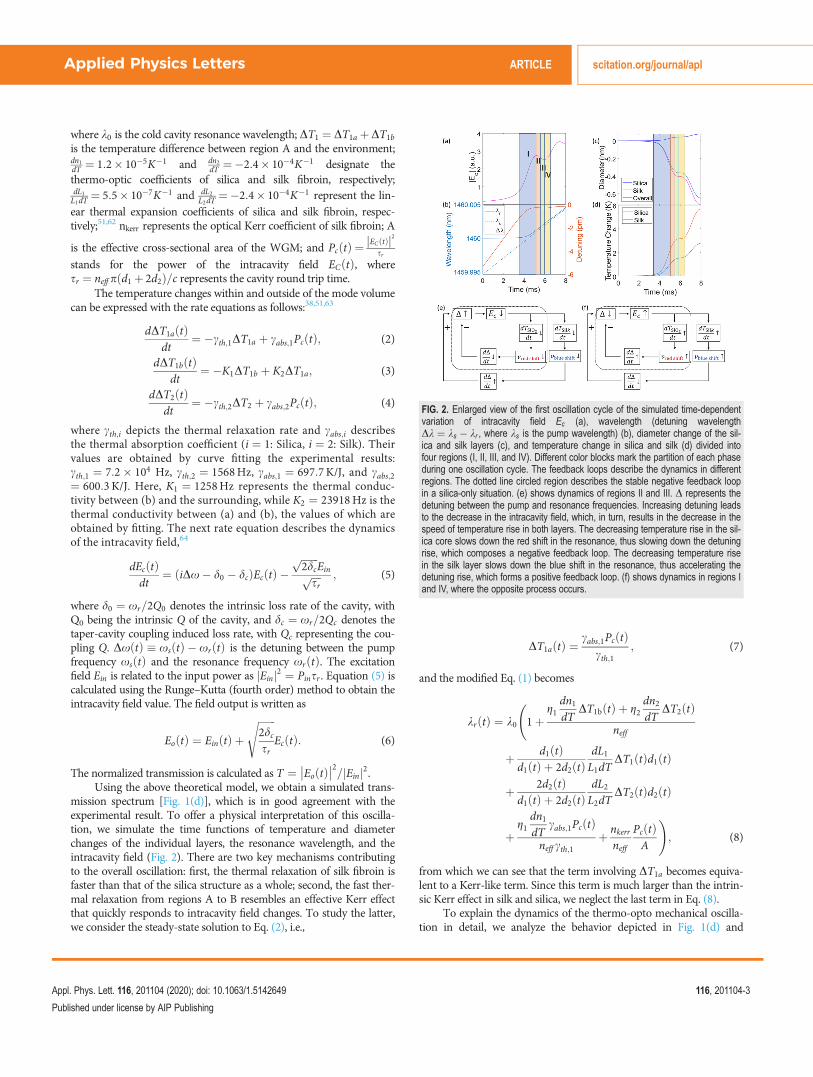
Using the above theoretical model, we obtain a simulated trans-mission spectrum [Fig. 1(d)], which is in good agreement with theexperimental result. To offer a physical interpretation of this oscilla-tion, we simulate the time functions of temperature and diameterchanges of the individual layers, the resonance wavelength, and theintracavity field (Fig. 2). There are two key mechanisms contributingto the overall oscillation: first, the thermal relaxation of silk fibroin isfaster than that of the silica structure as a whole; second, the fast ther-mal relaxation from regions A to B resembles an effective Kerr effectthat quickly responds to intracavity field changes. To study the latter,we consider the steady-state solution to Eq. (2), i.e.,
DT1a tð Þ ¼cabs;1Pc tð Þ
cth;1; (7)
and the modified Eq. (1) becomes
kr tð Þ ¼ k0
1þ
g1dn1dT
DT1b tð Þ þ g2dn2dT
DT2 tð Þ
neff
þ d1 tð Þd1 tð Þ þ 2d2 tð Þ
dL1L1dT
DT1 tð Þd1 tð Þ
þ 2d2 tð Þd1 tð Þ þ 2d2 tð Þ
dL2L2dT
DT2 tð Þd2 tð Þ
þg1
dn1dT
cabs;1Pc tð Þ
neff cth;1þ nkerr
neff
Pc tð ÞA
!; (8)
from which we can see that the term involving DT1a becomes equiva-lent to a Kerr-like term. Since this term is much larger than the intrin-sic Kerr effect in silk and silica, we neglect the last term in Eq. (8).
To explain the dynamics of the thermo-opto mechanical oscilla-tion in detail, we analyze the behavior depicted in Fig. 1(d) and
FIG. 2. Enlarged view of the first oscillation cycle of the simulated time-dependentvariation of intracavity field Ec (a), wavelength (detuning wavelengthDk ¼ ks � kr , where ks is the pump wavelength) (b), diameter change of the sil-ica and silk layers (c), and temperature change in silica and silk (d) divided intofour regions (I, II, III, and IV). Different color blocks mark the partition of each phaseduring one oscillation cycle. The feedback loops describe the dynamics in differentregions. The dotted line circled region describes the stable negative feedback loopin a silica-only situation. (e) shows dynamics of regions II and III. D represents thedetuning between the pump and resonance frequencies. Increasing detuning leadsto the decrease in the intracavity field, which, in turn, results in the decrease in thespeed of temperature rise in both layers. The decreasing temperature rise in the sil-ica core slows down the red shift in the resonance, thus slowing down the detuningrise, which composes a negative feedback loop. The decreasing temperature risein the silk layer slows down the blue shift in the resonance, thus accelerating thedetuning rise, which forms a positive feedback loop. (f) shows dynamics in regions Iand IV, where the opposite process occurs.
Figs. 2(a)–2(d) section by section. When the scanning pumpapproaches the resonance wavelength, the intracavity field becomesstronger, causing a temperature increase in both silica and silk layers[Fig. 2(f)]. The positive optothermal effect of silica results in a red shiftof resonance, whereas the negative optothermal and thermal expan-sion effects of silk result in a blue shift. As the positive effect outweighsthe negative side, the resonance wavelength undergoes a red shift.However, since the silk layer undergoes a faster temperature rise thansilica as a whole, the speed of this red shift starts off slow until SiO2 isfully heated. The red shift is then accelerated so that at the end ofphase I, the speed of the red shift catches up with that of the scanningwavelength. The feedback loop shown in Fig. 2(e) describes phases IIand III collectively. As the system enters phase II, the resonance redshift starts moving faster than the scanning wavelength, thus becomingfurther away from the pump. This causes the intracavity field todecrease, while the temperature rise continues as the system has yetto detect a significant change in the field. Thus, the red shift continuesto accelerate. At the end of phase II, the acceleration of the red shiftfalls to zero as the speed reaches the maximum. However, as fieldintensity decreases, the fast optothermal effect in silica is reducedimmediately. As a result, the resonance red shift slows down in phaseIII. At the end of this phase, the detuning reaches the maximum, thespeed of the resonance red shift equates that of the scanning wave-length again, and the fast positive optothermal effect reaches its mini-mum point. Meanwhile, the temperature starts to react to the decayingfield and, thus, decreases. Note that the temperature of the silk fibroindrops faster than that of silica as a whole. Starting from phase IV, theresonance red shift further slows down and becomes slower than thatof the scanning wavelength. This reduces the detuning and, thus,increases the field [Fig. 2(f)]. The temperature of the silk layer reachesa low point and then gradually climbs up, which further slows downthe red shift. Going into phase I of the next cycle, the temperature ofsilica finally catches up, thus driving the system forward with the nextcycle coming, and so on and so forth. When the pump frequencyfinally catches up with the resonance frequency, the intracavity fieldreaches its maximum, after which the temperature falls so that thepump and resonance frequencies move in opposite directions, leadingto a quick recovery of the transmission to one.
To understand the dependence of the optothermal oscillatorybehavior on the field power, we first analyze the effect of varying inputpower on the oscillatory behavior (Fig. 3). For a small input power of0.89 mW [Fig. 3(a)], the transmission spectrum shows a cavityLorentzian line shape broadened by the positive optothermal effect.At the threshold condition, the falling edge of the triangle starts tooscillate like a wave [Fig. 3(b)]. As the input power increases, thedownward edge widens, and more oscillating dips are observed[Figs. 3(c)–3(e)]. This is due to the fact that the resonance is easilycaught up by the scanning pump wavelength at low input power;higher input power induces a larger temperature rise in the cavity, sup-porting a quicker and larger red shift so that the resonance is ahead ofthe pump wavelength for a longer period of time, allowing oscillationcycles to repeat. This observation, in general, agrees with our simula-tion results [Figs. 3(f)–3(j)]. The small discrepancy may owe to the factthat the distinct separation in our model between the environmentand the non-mode volume silica is relatively gradual in reality.
In summary, we have theoretically and experimentally demon-strated the optothermal mechanical nonlinear oscillatory behavior in a
high-Q silk fibroin-coated silica microsphere. The phenomenon isattributed to the thermal dynamic processes with different time scalesas well as the combined interaction of several thermal nonlinear effectsof the hybrid silk-coated-microsphere. Particularly, the input power isdemonstrated to drastically change the oscillation behavior in thetransmission spectra. We envision that this work will provide a plat-form for photothermal actuation with low power consumption, fastresponse, low cost, and biocompatibility. It will also open up furtherpossibilities for the investigations of optical modulation, all-opticalswitching, and optical sensing by utilizing hybrid microresonatorsintegrated with materials with a large thermal expansion coefficient.
This work was supported by NSF Grant No. ECCS1711451and ARO Grant No. W911NF1710189.
DATA AVAILABILITY
The data that support the findings of this study are availablefrom the corresponding author upon reasonable request.
REFERENCES1K. J. Vahala, Nature 424, 839 (2003).2G. C. Righini, Y. Dumeige, P. F�eron, M. Ferrari, G. N. Conti, D. Ristic, and S.Soria, Riv. Nuevo Cimento 34, 435 (2011).
3A. Chiasera, Y. Dumeige, P. F�eron, M. Ferrari, Y. Jestin, G. Nunzi Conti, S.Pelli, S. Soria, and G. C. Righini, Laser Photonics Rev. 4, 457 (2010).
4X. Jiang, L. Shao, S.-X. Zhang, X. Yi, J. Wiersig, L. Wang, Q. Gong, M. Loncar,L. Yang, and Y.-F. Xiao, Science 358, 344 (2017).
5M. R. Foreman, J. D. Swaim, and F. Vollmer, Adv. Opt. Photonics 7, 168(2015).
6F. Vollmer and S. Arnold, Nat. Methods 5, 591 (2008).7L. Yang, X. Jiang, and A. J. Qavi, Proc. SPIE 10629, 106290R (2018).8F. Vollmer, L. Yang, and S. Fainman, Nanophotonics 1, 267 (2012).9X. Jiang, A. J. Qavi, S. H. Huang, and L. Yang, arXiv:1805.00062 (2018).
10S. H. Huang, S. Sheth, E. Jain, X. Jiang, S. P. Zustiak, and L. Yang, Opt. Express26, 51 (2018).
11F. Shu, X. Jiang, G. Zhao, and L. Yang, Nanophotonics 7, 1455 (2018).12L. Shao, X. F. Jiang, X. C. Yu, B. B. Li, W. R. Clements, F. Vollmer, W. Wang,Y. F. Xiao, and Q. Gong, Adv. Mater. 25, 5616 (2013).
13X. Xu, X. Jiang, G. Zhao, and L. Yang, Opt. Express 24, 25905 (2016).
FIG. 3. Study of the oscillatory behavior with different input power. (a)–(e)Experimental transmission spectra with increasing input power, from a deformedLorentzian shape to oscillation. The input power from top to bottom: 0.89 mW,1.65mW, 2.13 mW, 2.77 mW, and 3.40 mW. (f)–(j) The simulation results corre-sponding to the experimental results in (a)–(e).
14J. Zhu, G. Zhao, I. Savukov, and L. Yang, Sci. Rep. 7, 1 (2017).15L. He, SK. €Ozdemir, and L. Yang, Laser Photonics Rev. 7, 60 (2013).16X.-F. Jiang, Y.-F. Xiao, C.-L. Zou, L. He, C.-H. Dong, B.-B. Li, Y. Li, F.-W. Sun,L. Yang, and Q. Gong, Adv. Mater. 24, OP260 (2012).
17X.-F. Jiang, C.-L. Zou, L. Wang, Q. Gong, and Y.-F. Xiao, Laser Photonics Rev.10, 40 (2016).
18G. Zhao, SK. €Ozdemir, T. Wang, L. Xu, E. King, G. L. Long, and L. Yang, Sci.Bull. 62, 875 (2017).
19G. Lin, S. Diallo, K. Saleh, R. Martinenghi, J. C. Beugnot, T. Sylvestre, and Y. K.Chembo, Appl. Phys. Lett. 105, 231103 (2014).
20X. F. Jiang, Y. F. Xiao, Q. F. Yang, L. Shao, W. R. Clements, and Q. Gong,Appl. Phys. Lett. 103, 101102 (2013).
21L. Yang, T. Carmon, B. Min, S. M. Spillane, and K. J. Vahala, Appl. Phys. Lett.86, 091114 (2005).
22L. Yang, D. K. Armani, and K. J. Vahala, Appl. Phys. Lett. 83, 825 (2003).23Y. Li, X. Jiang, G. Zhao, and L. Yang, arXiv:1809.04878 (2018).24J. Topolancik and F. Vollmer, Appl. Phys. Lett. 89, 184103 (2006).25G. Lin, J. U. F€urst, D. V. Strekalov, and N. Yu, Appl. Phys. Lett. 103, 181107(2013).
26C. Z. Chai, X. X. Hu, C. L. Zou, G. C. Guo, and C. H. Dong, Appl. Phys. Lett.114, 021101 (2019).
27H. S. Choi and A. M. Armani, Appl. Phys. Lett. 97, 223306 (2010).28M. Aspelmeyer, T. J. Kippenberg, and F. Marquardt, Rev. Mod. Phys. 86, 1391(2014).
29J. D. Thompson, B. M. Zwickl, A. M. Jayich, F. Marquardt, S. M. Girvin, and J.G. E. Harris, Nature 452, 72 (2008).
30X. Jiang, M. Wang, M. C. Kuzyk, T. Oo, G.-L. Long, and H. Wang, Opt.Express 23, 27260 (2015).
31H. Mabuchi and A. C. Doherty, Science 298, 1372 (2002).32D. V. Strekalov, C. Marquardt, A. B. Matsko, H. G. L. Schwefel, and G. Leuchs,J. Opt. 18, 123002 (2016).
33W. Chen, SK. €Ozdemir, G. Zhao, J. Wiersig, and L. Yang, Nature 548, 192(2017).
34R. El-Ganainy, K. G. Makris, M. Khajavikhan, Z. H. Musslimani, S. Rotter, andD. N. Christodoulides, Nat. Phys. 14, 11 (2018).
35K. €Ozdemir, S. Rotter, F. Nori, and L. Yang, Nat. Mater. 18, 783 (2019).36B. Peng, S. K. €Ozdemir, F. Lei, F. Monifi, M. Gianfreda, G. L. Long, S. Fan, F.Nori, C. M. Bender, and L. Yang, Nat. Phys. 10, 394 (2014).
37C. Wang, X. Jiang, G. Zhao, M. Zhang, C. W. Hsu, B. Peng, A. D. Stone, L.Jiang, and L. Yang, Nat. Phys. 16, 334 (2020).
38T. Carmon, L. Yang, and K. J. Vahala, Opt. Express 12, 4742 (2004).39V. S. Il’chenko and M. L. Gorodetskii, Laser Phys. 2, 1004 (1992).
40E. Kim, M. R. Foreman, M. D. Baaske, and F. Vollmer, Appl. Phys. Lett. 106,161101 (2015).
41B.-B. Li, Q.-Y. Wang, Y.-F. Xiao, X.-F. Jiang, Y. Li, L. Xiao, and Q. Gong, Appl.Phys. Lett. 96, 251109 (2010).
42L. He, Y.-F. Xiao, C. Dong, J. Zhu, V. Gaddam, and L. Yang, Appl. Phys. Lett.93, 201102 (2008).
43C. H. Dong, L. He, Y. F. Xiao, V. R. Gaddam, S. K. Ozdemir, Z. F. Han, G. C.Guo, and L. Yang, Appl. Phys. Lett. 94, 231119 (2009).
44W. Chen, J. Zhu, SK. €Ozdemir, B. Peng, and L. Yang, Appl. Phys. Lett. 109,061103 (2016).
45J. Zhu, S. Kaya €Ozdemir, L. He, and L. Yang, Appl. Phys. Lett. 99, 171101(2011).
46H. Rokhsari, S. M. Spillane, and K. J. Vahala, Appl. Phys. Lett. 85, 3029(2004).
47Y. Zhi and A. Meldrum, Appl. Phys. Lett. 105, 031902 (2014).48Y.-S. Park and H. Wang, Opt. Lett. 32, 3104 (2007).49T. J. Johnson, M. Borselli, and O. Painter, Opt. Express 14, 817 (2006).50C. Baker, S. Stapfner, D. Parrain, S. Ducci, G. Leo, E. M. Weig, and I. Favero,Opt. Express 20, 29076 (2012).
51L. He, Y.-F. Xiao, J. Zhu, S. K. Ozdemir, and L. Yang, Opt. Express 17, 9571(2009).
52Z.-C. Luo, C.-Y. Ma, B.-B. Li, and Y.-F. Xiao, AIP Adv. 4, 122902 (2014).53S. Diallo, G. Lin, and Y. K. Chembo, Opt. Lett. 40, 3834 (2015).54J. Wang, B. Zhu, Z. Hao, F. Bo, X. Wang, F. Gao, Y. Li, G. Zhang, and J. Xu,Opt. Express 24, 21869 (2016).
55X. Sun, H. Liang, R. Luo, W. C. Jiang, X.-C. Zhang, and Q. Lin, Opt. Express25, 13504 (2017).
56Y. Deng, F. Liu, Z. C. Leseman, and M. Hossein-Zadeh, Opt. Express 21, 4653(2013).
57Y. Deng, M. R. Flores-Flores, R. K. Jain, and M. Hossein-Zadeh, Opt. Lett. 38,4413 (2013).
58T. Wang, D. Torres, F. E. Fern�andez, C. Wang, and N. Sep�ulveda, Sci. Adv. 3,e1602697 (2017).
59H. Tao, D. L. Kaplan, and F. G. Omenetto, Adv. Mater. 24, 2824 (2012).60D. N. Rockwood, R. C. Preda, T. Y€ucel, X. Wang, M. L. Lovett, and D. L.Kaplan, Nat. Protoc. 6, 1612 (2011).
61X. Jiang and L. Yang, Light Sci. Appl. 9, 24 (2020).62L. Xu, X. Jiang, G. Zhao, D. Ma, H. Tao, Z. Liu, F. G. Omenetto, and L. Yang,Opt. Express 24, 20825 (2016).
63A. E. Fomin, M. L. Gorodetsky, I. S. Grudinin, and V. S. Ilchenko, J. Opt. Soc.Am. B 22, 459 (2005).
64M. L. Gorodetsky and V. S. Ilchenko, J. Opt. Soc. Am. B 16, 147 (1999).