Christensen Associates Energy Consulting, LLC 800 University Bay Drive, Suite 400 Madison, WI 53705-2299 Voice 608.231.2266 Fax 608.231.2108 ENSURING ADEQUATE POWER SUPPLIES FOR dKDKZZKt^ >dZ/ITY NEEDS prepared by Mathew J. Morey Laurence D. Kirsch B. Kelly Eakin Robert J. Camfield Christensen Associates Energy Consulting LLC prepared for June 3, 2014
Transcript
Christensen Associates Energy Consulting, LLC 800 University Bay Drive, Suite 400 Madison, WI 53705-2299 Voice 608.231.2266 Fax 608.231.2108
CA Energy Consulting is a wholly owned subsidiary of Laurits R. Christensen Associates, Inc., whose multi-‐disciplinary team of economists, engineers, and market research specialists has been serving the electric power industry (as well as other industries) since 1976. CA Energy
issues concerning wholesale and retail electricity market restructuring, market design, power supply, asset evaluation, transmission pricing, market power, retail and wholesale rate design, and customer response to price signals.
TABLE OF CONTENTS
Contents EXECUTIVE SUMMARY ............................................................................................................ I
1. THE RESOURCE ADEQUACY CHALLENGE ........................................................................... 1
2. SECURITY, ADEQUACY, AND RELIABILITY .......................................................................... 2
3.1.1. Traditional Markets ........................................................................................ 4 3.1.2. Restructured Markets .................................................................................... 5 3.1.3. Overview of Prevalent Market Types in Each State....................................... 7 3.1.4. Similarities and Differences Among the Market Types ................................. 8
3.2. Capacity Cost Recovery Mechanisms ......................................................................... 10 3.2.1. Cost Recovery Under a Purely Market Scheme ........................................... 11 3.2.2. Cost Recovery With a Capacity Requirement Scheme ................................ 13
4.1.1. North American Electric Reliability Corporation Standards ........................ 16 4.1.2. Regional Reliability Entities Standards ........................................................ 17 4.1.3. Federal Energy Regulatory Commission Requirements .............................. 19 4.1.4. State Requirements ..................................................................................... 20
4.2. Requirements of the Regional Transmission Operators ............................................. 20 4.2.1. Methods for Determining Capacity Requirements ...................................... 20 4.2.2. Determination of Capacity Prices ................................................................ 23 4.2.3. Market Power Mitigation............................................................................. 27 4.2.4. Strengths and Weaknesses of the Price Determination Methods .............. 28
4.3. Traditionally Regulated Regions ................................................................................. 29
5.7.1. Relationships of Market Design to Resource Adequacy .............................. 57 5.7.2. Assessment of Resource Diversity Effects ................................................... 60 5.7.3. Long-‐Term Contracting and Generation Investment .................................. 60 5.7.4. Natural Gas Deliverability ............................................................................ 60 5.7.5. Plant Retirements ........................................................................................ 62 5.7.6. Reliability Issues Arising from Intermittent Resources ................................ 63
6. PROSPECTIVE RELIABILITY IMPACTS OF EVOLVING TECHNOLOGY ................................... 64 6.1. Increases in Resource Capacities ................................................................................ 64 6.2. Improvements in Power System Control .................................................................... 64 6.3. Complications to Power System Control .................................................................... 64
7. DIRECTIONS FOR FUTURE REFORM OF METHODS FOR ASSURING ADEQUATE CAPACITY . 65 7.1. Reforms in Defining the Capacity Mandate ................................................................ 65
7.1.1. Reformed Pricing of Operating Reserves ..................................................... 65 7.1.2. Capacity Compensation Based on Actual Resource Availability .................. 67 7.1.3. Recognition of the Diversity of Capacity Values .......................................... 69
7.2. Reforms in Methods for Meeting Capacity Mandates ............................................... 74 7.2.1. Resource Obligations Borne by Distribution Service Providers ................... 74 7.2.2. Capacity Options .......................................................................................... 76 7.2.3. Treatment of Self-‐Supply Relative to Centralized Capacity Markets .......... 76 7.2.4. Reform of LMP Pricing ................................................................................. 79
The Electric Markets Research Foundation (Foundation) critically examines key issues facing the electricity sector arising from industry restructuring that has taken place over the past
two decades. The Foundation commissioned Christensen Associates Energy Consulting to examine the ability of the U.S. electric power industry to build and maintain sufficient electric
While many regions of the country have undertaken restructuring of both retail and wholesale electricity markets, others have not, so that the U.S. electricity sector now serves consumers under two distinct market models. These models have different impacts upon the development of power facilities and the production and delivery of power. One market model relies on competitive bidding to establish market prices for wholesale power delivered to end-‐use customers by retail suppliers who may or may not own generation, transmission, and distribution facilities. Regional transmission organizations (RTOs) or independent system operators (ISOs) operate the competitive wholesale markets in restructured market regions.
The other market model relies on traditional regulation of vertically integrated utilities that provide generation, transmission, and distribution services to end-‐use customers at prices approved by state regulatory commissions. Within the restructured market regions, many but not all states have adopted retail competition, in which multiple retail suppliers of electric energy and related services compete to serve end-‐users. The first report published by the Foundation, entitled Evolution of the Electric Industry Structure in the U.S. and Resulting Issues, discusses in significant detail th and the
current status.1
Whether the electricity sector is able to continue to develop and maintain sufficient resources esource adequacy, has emerged
over the past several years as perhaps the greatest challenge facing the electric power industry. Potentially serious resource adequacy of January and February 2014, when record cold temperatures across most of the eastern and Midwestern United States had the industry scrambling to keep up with the demand for electricity. While the industry managed to avoid blackouts, a general consensus has emerged that the industry came perilously close to exceeding its limits to maintain electric system
1 Navigant Consulting, Inc., Evolution of the Electric Industry Structure in the U.S. and Resulting Issues, prepared for Electric Markets Research Foundation, October 12, 2013, available at www.emrf.net.
ii
reliability. Maintaining reliability during this period meant that many electricity consumers in some parts of the country paid unprecedented high prices for electricity.
few years of many of the generating plants called upon to keep the lights on during this last . American Electric Power Company (AEP) CEO Nicholas Akins, in testimony
before the Senate Energy and Natural resources Committee in April, pointed to January's deep freeze as a warning signal:
A month ago, I made headlines when I said 89 percent of the generation that AEP will be retiring in 2015 was called upon to meet electricity demand in January. That is a fact The weather events experienced this winter provided an early warning about serious issues with electric supply and reliability This country did not just dodge a bullet -‐-‐ we dodged a cannon ball.2
Akins told Congress that the problem needs to be fixed quickly. He asserted that the capacity markets in restructured market regions are , and are failing to attract investment capital and to send price signals to retain existing generation in order to maintain a mix of energy resources necessary to ensure grid reliability. According to Akins,
he [restructured] competitive wholesale markets are not currently providing the structure necessary to maintain that reliability and do not currently provide the proper economic signals
3
Instead the electric power industry has become increasingly reliant on natural gas, particularly in the restructured wholesale markets. Recent downward trends in wholesale market prices and compliance with environmental regulations are increasingly rendering base load (coal and nuclear) power sources uneconomic. For example, AEP is slated to retire more than 6,500 megawatts of coal-‐fired generation most of it by mid-‐2015 and does not plan to add new capacity in the near term.
Reliability is not the only issue. Shortages of power during the polar vortex created significant spikes in the price of wholesale power, which has quickly morphed into a political issue. PPL Corporation, a utility serving customers in central Pennsylvania, saw wholesale (spot market) prices briefly exceed $2,000 per megawatt hour compared to $40 per megawatt hour on a normal day.4 In Texas, where the grid is managed by the Electric Reliability Council of Texas (ERCOT), prices reached wholesale market price cap of $5,000 per megawatt hour for the first
2 Testimony of Nicholas K. Akins, Chairman, President and Chief Executive Officer, American Electric Power, Senate Energy and Natural Resources Committee Hearing -‐ Are We Doing Enough to Ensure the
, April 10, 2014, pp. 2-‐4. 3 Id., p. 5. 4 G.J. Millman, by Polar Vortex, Wall Street Journal, April 17, 2014, obtained at http://blogs.wsj.com/riskandcompliance/2014/04/17/ppls-‐risk-‐management-‐tested-‐by-‐polar-‐vortex/.
iii
time ever on January 6th, partly due to plant outages.5 Few retail customers experienced these high prices at the time because retail electricity rates typically do not fluctuate with changes in wholesale spot market prices. But those electricity customers whose bills do reflect hourly wholesale prices, including many in New York and New England, experienced significant price shock. For example, based on an estimated 27% jump in wholesale electricity prices in January, the New York Public Service Commission authorized National Grid serving northern New York State to recover higher wholesale power costs in retail rates over a four month period. U.S. Senator Charles Schumer has called for an FTC investigation into these price spikes in northern New York.
Most of the concerns regarding resource adequacy have arisen in the context of restructured wholesale and retail electric markets. The restructured markets are still trying to prove the workability of their model for assuring resource adequacy. By contrast, capacity reserves have been successfully maintained in almost all regions that have not restructured and that continue to rely on franchised electric utilities that take direct responsibility for resource adequacy under an obligation to serve. The success of traditionally regulated electric markets to maintain resource adequacy has not been achieved without controversy, however, as questions have sometimes arisen about how those reserve requirements were satisfied and at what cost. Nevertheless, resource adequacy has not been seen as a major issue in traditionally regulated markets in the past.
Additional Concerns in Restructured Markets
While the polar vortex provided a warning signal to the nation, it is not just extreme weather and attendant wholesale power price spikes that is creating concern about resource adequacy in the restructured markets. Additional concerns that have arisen in restructured markets include the following:
Reserve margins have declined in almost all regions of the country over the past decade. However, the decline in restructured market regions has been more pronounced than in other regions, and has become the center of increasing concern, highlighted by the recent polar vortex experience. Furthermore, projected capacity retirements primarily due to environmental restrictions -‐ exceed planned additions for the foreseeable future.
Low average wholesale market electricity prices in restructured markets in recent years have made it more difficult for owners to recover plant operating costs and have thereby induced the retirement of two carbon-‐free nuclear power plants. Additional nuclear plants are in danger of closing for similar reasons.
5 K. Kelly-‐Detwiler, Volatility In Early January Power Markets: The Vexing Polar Vortexobtained at http://www.forbes.com/sites/peterdetwiler/2014/01/16/volatility-‐in-‐early-‐january-‐power-‐markets-‐the-‐vexing-‐polar-‐vortex/.
iv
With natural gas as the preferred fuel source for the majority of newly installed or planned generation capacity in restructured markets, the polar vortex has also focused attention on long-‐term gas availability and pricing, including the availability of firm gas pipeline transportation. Is there over-‐reliance on natural gas? What are the economic security and consumer price volatility concerns that result from heavy reliance on natural gas?
Increased reliance on intermittent resources that are not always available when needed, such as solar and wind, raise additional concerns for maintaining resource adequacy.
Subsidies for particular generation technologies, such as the production tax credits for wind energy, tend to distort competitive market outcomes.
A host of public policies interfere with the operation of restructured electricity markets. Consequently, these markets provide only limited support for investment in generation and other resources.
o The restructured markets cap prices in order to limit consumers exposure to price volatility. With prices capped, the market-‐clearing price paid to resources under capacity shortage conditions cannot reach levels high enough to encourage the provision of sufficient additional resources or induce sufficient load reductions. .
o indicate that net revenues were generally insufficient to allow recovery of the levelized capital costs of generation investment. Thus, on a levelized basis, the
kets did not present an attractive enough opportunity to encourage sufficient investment in needed generation.
o Some RTOs have implemented a market-‐like approach to capacity adequacy through the institution of centralized capacity markets that provide cost recovery assurance at most three years into the future. This short timeframe gives a very limited incentive for investments in capital-‐intensive generators with lives of thirty years or more.
o Restructured markets do not provide market participants with mechanisms to arrange the long-‐term price hedges that can be critical to investment in long-‐term capacity.
o Restructured market rules have been subject to frequent revision, thus creating uncertainty about their durability and adding to investment uncertainty.
The consequences of these realities have been supplier bankruptcies and disincentives for arranging long-‐term supplies.
There is reason to be concerned that, as a nation, we are paying insufficient attention to the issue of resource adequacy, particularly in restructured markets. While the obligation to serve coupled with integrated resource planning have enabled traditionally regulated markets to maintain sufficient planning reserves to meet current and future needs, levels of planning
v
reserves in restructured markets have by and large been left to market forces. As these restructured markets have found that market prices have not always provided sufficient incentives to maintain required levels of reserves, they have attempted numerous market adjustments, including the establishment of separate capacity markets, to add additional resources. It does not appear that these efforts have been successful to date.
A key finding of this report is that problems of restructured markets with securing adequate resources stems from their seeking a market solution to a problem for which there is not a market solution within existing political and institutional frameworks. Because of the shortcomings of market-‐based approaches, non-‐market (i.e., regulatory) mechanisms must be part of the overall approach to ensuring long-‐term resource adequacy. Long-‐term contracts and self-‐build options for load-‐serving entities (LSEs) must be encouraged to ensure an adequate resource mix.
Traditional Versus Restructured Markets
About a third of the U.S. population obtains electric power service based on traditional institutional arrangements. Under these arrangements, power is provided to consumers by vertically integrated utilities that own generation, have exclusive retail franchises, and trade wholesale power through bilateral contracts. Retail prices are regulated by state public service commissions.
About two-‐thirds of the U.S. population obtains electricity through electric markets that have been restructured at the wholesale level. In these markets, generating capacity owned by utilities and independent third parties compete to sell generation into a centralized wholesale market as well through bilateral trades, with the lowest-‐cost resources that can reliably serve demand being chosen on a real-‐time basis. In some states within these restructured markets, retail customers may choose their electric supplier among competing entities that may be utilities or third-‐party competitive retail suppliers.
Both traditional and restructured markets require mechanisms for assuring resource adequacy.
In all markets other than Texas, LSEs have an obligation to procure capacity that is sufficient to serve their own retail load and cover reserves.6 In traditional markets, utilities build and own their own generating units or do so jointly with other utilities, develop long-‐term purchase arrangements with independent power producers, or procure short-‐ and long-‐term resources under negotiated bilateral power purchase agreements with entities that have surplus resources. Utilities in these markets recover the costs of procuring these resources by charging rates that are determined by their costs of service.
In restructured markets, utilities sometimes procure capacity resources in much the same fashion as in traditionally regulated regions. However, in restructured markets, utilities are
6 In Texas, retail energy providers (REPs) serve retail electric consumers without bearing a requirement to secure capacity sufficient to meet their load.
vi
typically either allowed or in some cases required to trade through centralized short-‐term capacity markets operated by Regional Transmission Operators (RTOs). In states with retail access, regulators have often discouraged retail LSEs from owning their own generating resources, sometimes even barring LSEs from engaging in long-‐term contracts to hedge against short-‐term price fluctuations.
While traditionally regulated electricity markets have regulatory issues, such as sometimes contentious proceedings to determine whether investments have been prudently incurred, these markets continue to meet resource adequacy requirements under the supervision of state regulators. The restructured markets, by contrast, are still trying to prove the workability of their model for assuring resource adequacy. Thus far, the RTOs have maintained adequate capacity. Nonetheless, some RTOs may or will soon be operating with historically low planning reserves under peak period conditions, particularly given planned retirements. It is unclear to what extent centralized capacity markets will assure reserve margins in restructured RTO markets, especially because the restructured states continue to play a significant role in determining capacity requirements for LSEs and mandating investments in renewable resource capacity. And some states are attempting to mandate additional investment in traditional resources outside RTO capacity markets as well.7
The current debate on resource adequacy arises primarily from questions about how to make s work. The fundamental problem is that the RTOs seek a
market solution for a problem that does not have a market solution because a suite of public policies require that capacity resources meet several non-‐market goals. These non-‐market goals include:
Electricity is vital to the national economy and shortages and price spikes are not tolerated by policymakers, regulators, and customers.
To protect customers from excessive price volatility, prices offered by generators in restructured markets are capped below levels that are needed to clear the market during peak load periods when capacity is scarce. Consequently, generators that serve load at peak are not able to obtain revenues sufficient to cover all of their costs, causing a that dampens incentives for investment in new capacity.
The portfolio of capacity resources must include certain types of preferred resources notably renewable resources and demand-‐side resources that may be costly relative to conventional resources.
7 See New Jersey Board of Public Utilities and New Jersey Division of Rate Counsel, Petitioners, in Case No. 11-‐4245 v. Federal Energy Regulatory Commission, Respondent; and Maryland Public Service Commission, Petitioner, in Case No. 11-‐4405 v. Federal Energy Regulatory Commission, Respondent. The United States Court of Appeals for the 3rd Circuit in February 2014 denied requests of both New Jersey and Maryland commissions, as well as
to the PJM capacity market that eliminated the exemption from capacity market mitigation rules for resources built pursuant to a state mandate.
vii
Different customers have different willingness to pay for different levels of bulk system reliability, but only one level of reliability can be maintained. Thus, reliability must be maintained at levels that exceed many customers .
Because of these and other problems, the RTOs are continually reforming their capacity markets, sometimes in major ways, often through contentious proceedings, as they search for a market solution that cannot exist. Some RTOs have attempted to implement a market solution through the institution of short-‐term centralized capacity markets; but these markets have the key deficiency of going at most three years into the future, which cannot provide incentives for long-‐term capital-‐intensive generation investments with lives of thirty years or more.
Resource Mix
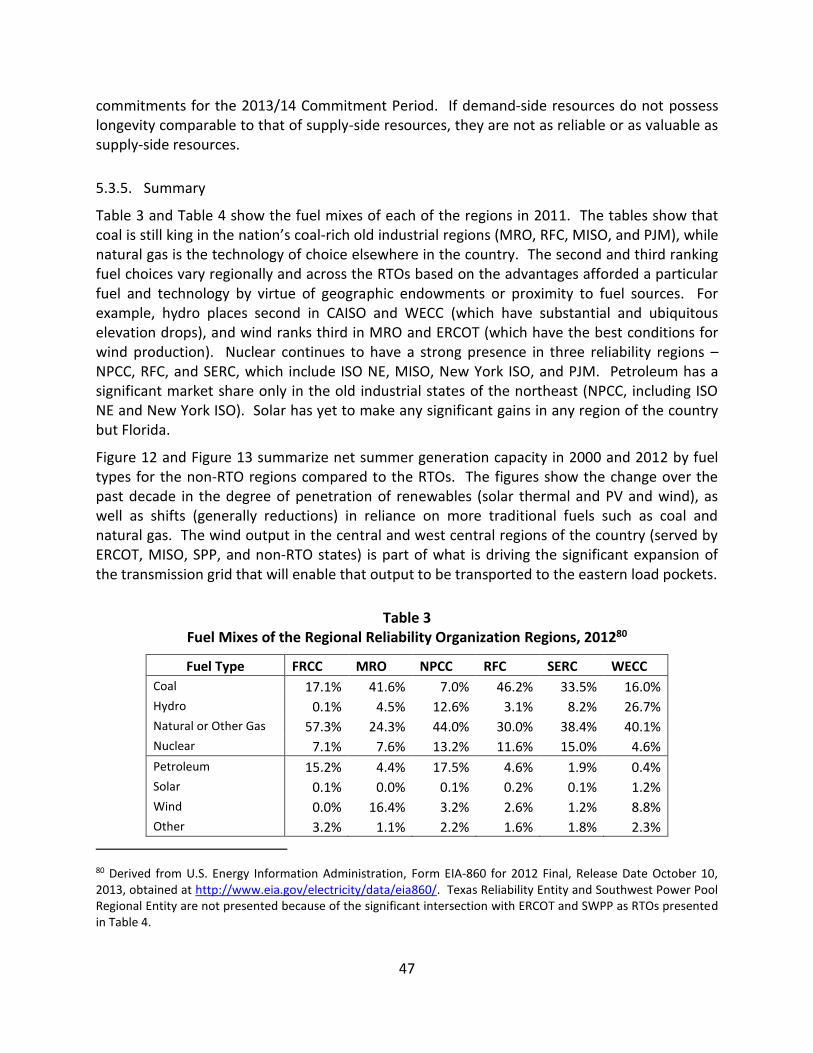
The mix of capacity resources can have major impacts on power system reliability, for several reasons. First, supplies of particular resources can become constrained due to weather conditions, transportation bottlenecks, or production problems; so over-‐reliance upon a single resource technology can have adverse reliability or cost impacts. Second, demand-‐side capacity resources are an innovation that is not entirely out of the testing stage: in the long run, such resources may or may not prove to be as reliable as traditional supply-‐side resources. Third, intermittent renewable resources (i.e., wind and solar) pose new challenges for maintaining power system security; and these challenges will grow disproportionately quickly as the market share of these resources grows.
About 23,000 MW of coal-‐fired generating capacity retired between 2005 and 2013, and another 37,300 MW is expected to retire over the next decade, mostly during the next four years.8 Many of these retirements are in RTO regions. Meanwhile, in nearly every RTO region, gas-‐fired generation capacity has at least doubled over the past decade. Wind capacity has increased from almost nothing in 2000 to approximately 6% of total U.S. generating capacity today.
The strong trend throughout the U.S. is toward natural gas capacity, in both restructured and traditionally regulated regions, though traditionally regulated regions have retained more fuel diversity. The differences between restructured and traditionally regulated regions in the change in resource mix seem to rise primarily from state requirements for renewable energy, plus the particular locational advantages of wind and solar resources.
Resource Profitability
To assess the market incentives for capacity investments, several RTOs estimate the net revenues (i.e., profits) that would have been earned in their markets by combustion turbines and combined cycle generators. For each of the years 2005 through 2012, net revenues on an
RTO-‐wide basis were generally insufficient to cover the levelized costs of these generators, though they were sufficient in ERCOT and New York in a few years and were sufficient in several subregions of the RTOs in some years. Because there was some need for new resource capacity during the boom years of 2005-‐2007, the insufficiency of net revenues implies a general failure
capacity shortages in these years. The failure has led to a general decline in RTO planning reserves in recent years and, particularly in light of the polar vortex experience this past winter, a rising concern that restructured markets may need to do more to address the resource adequacy issue.
capacity markets were created to provide resource owners with steady income streams. Nonetheless, their capacity market prices have been volatile over the past decade; so the centralized capacity markets have provided rather volatile income streams that create financial risks for investors in new generating plants.
The investment problem is particularly acute because of the nature of electricity demand. Customer demand has a profile that includes baseline needs during normal weather conditions and usage, and higher peak demands during particularly cold or hot weather (depending on the region). A mix of generating technologies satisfies this range in electricity demand at least cost. The generators that serve demand only during peak load hours may be needed to run only a few days or even a few hours each year. Although such peaker plants have relatively low capital costs, they nonetheless need extremely high prices during those few days or hours to earn revenues sufficient to cover both the variable and fixed costs, including a return on their investment in capacity. Inconsistent with this need, however, the restructured markets have caps on prices generators can offer, thus precluding market prices from reaching levels high enough to provide the needed revenue for the peaker plants during those few hours when they are needed. This all other plant types, including baseload plants. Th capacity market mechanisms are intended to sufficient incentives for investment in both base load and peaking generation so far with limited success.
Key Findings of the Report
The U.S. electric power industry has a 100-‐year history of providing capacity resources that have been adequate under all but the most extreme conditions. The main contributor to this favorable outcome has been a set of power industry business practices that require resources to exceed peak loads according to certain engineering-‐based analyses or rules of thumb. These industry practices have been supplemented and strengthened by various state proceedings such as integrated resource planning.
While traditionally regulated electricity markets have issues such as contentious prudence determinations, these markets continue to meet resource adequacy requirements under the supervision of state regulators.
ix
The current debate on resource adequacy arises primarily from questions about how to make the restructured market model work. These questions arise from the following fundamental causes:
-‐term centralized capacity markets do not provide incentives for long-‐term resource investments. These markets were designed to improve the short-‐term commitment and dispatch of power system resources; and for this short-‐term purpose, they have been very successful. But these RTO markets, being short-‐term markets, do not and cannot address long-‐term capacity needs.
The political process will not allow peak-‐period demand pricing that is consistent with a market solutionby regulators; and on the rare occasions when non-‐price rationing (e.g., rolling blackouts) occurs due to a capacity shortfall, that rationing does not tend to discriminate between those consumers and retail suppliers who arrange adequate supplies and those who do not.
These fundamental causes imply that the resource adequacy problem does not lend itself to a market solution. The RTOs, as they struggle to fit a square peg into a round hole, must therefore continually reform their capacity markets, sometimes in major ways, always through contentious proceedings, as they search for a market solution that cannot exist under existing political and regulatory frameworks. While a well-‐functioning market attracts participation because that market provides trades on terms that are comparable to or better than those available through other venues, the centralized capacity markets tend to be mandatory. There are few places in the American economy wherein one can find a free market in which participation is mandatory.
The traditionally regulated markets avoid all the foregoing problems by simply not attempting a market solution, except to the extent that they have competitive bidding procedures to meet identified capacity needs.
There are additional matters that should be, and indeed already are, of great concern to policymakers and all stakeholders in the electric power industry:
The reliability of some portions of the power system has been challenged by a lack of fuel diversity in new generation development. The cold winter of 2013-‐
hlight the perils of over-‐reliance on any one fuel.
Gas-‐electric coordination has become increasingly important as we rely more on natural gas. Questions arise as to whether generation can be counted as firm capacity if it does not have firm gas pipeline transportation contracts. Again, the polar vortex was a demonstration of the possible implications of insufficient firm gas transportation.
The planned retirement of coal plants (for both economic and environmental reasons), and the actual and potential retirements of nuclear plants for economic reasons, will exacerbate the resource adequacy problem in some RTOs, creating significant reliability concerns.
x
There is reasonable concern about the capacity value of demand-‐side resources. It is risky to over-‐rely on these resources until they have been thoroughly tested by experience.
There is reasonable concern about the capacity value of intermittent resources, and about the power system control and security problems raised by their intermittency.
There have been many proposals made to reform capacity markets or to design new methods to ensure resource adequacy in the restructured markets, but most of these proposals assume that tweaks to the restructured market model will be sufficient. A more comprehensive solution is necessary, however. For example, the restructured markets could be designed so that capacity is procured in ways similar to those used in traditional regulated markets: set capacity requirements according to engineering criteria; impose high penalties on those LSEs who fail to meet their requirements; and offer a centralized market for those parties who find the centralized Generation could be procured through competitive solicitation as it is done successfully in some traditionally regulated markets as well as in some restructured markets. And RTOs could continue to operate energy markets in the same way as they do today.
Our nation needs to continually strive for better regulatory and market rules that ensure resource adequacy at reasonable cost to consumers and the economy. We recommend that regulators and legislators, at both the federal and state levels, examine the resource adequacy problem in restructured markets closely and develop solutions soon. Because of the significant time that is required to develop new resources, we cannot afford to wait until resource adequacy problems pose a threat to the economy.
1
ENSURING ADEQUATE POWER SUPPLIES FOR ITY NEEDS
1. THE RESOURCE ADEQUACY CHALLENGE
The Electric Markets Research Foundation (Foundation) critically examines key issues facing the ectricity sector arising from industry restructuring that has taken place over the past
two decades. The Foundation commissioned Christensen Associates Energy Consulting to examine the ability of the U.S. electric power industry to build and maintain sufficient electric
country have undertaken restructuring of both retail and wholesale electricity markets, others have not, so that the U.S. electricity sector now serves consumers under two distinct market models. These models have different impacts upon the development of power facilities and the production and delivery of power.
One market model relies on competitive bidding to establish market prices for wholesale power delivered to end-‐use customers by retail suppliers who may or may not own generation, transmission, and distribution facilities. Restructured market regions utilize regional transmission organizations (RTOs) or independent system operators (ISOs) to operate the competitive wholesale markets.
The other market model relies on traditional regulation of vertically integrated utilities that provide generation, transmission and distribution services to end-‐use customers at prices approved by state regulatory commissions. Within the restructured market regions, many but not all states have adopted retail competition, in which multiple retail suppliers of electric energy and related services compete to serve end-‐users. The first report published by the Foundation, entitled Evolution of the Electric Industry Structure in the U.S. and Resulting Issues, discusses in significant detail the his
.9
January and February 2014, when record cold temperatures across most of the eastern and Midwestern United States had the industry scrambling to keep up with the demand for electricity. While the industry managed to avoid blackouts, a general consensus has emerged that the industry came perilously close to exceeding its limits to maintain electric system reliability. While the industry managed to maintain reliability, doing so meant that many electricity consumers in some parts of the country paid unprecedented high prices for electricity during this period. compromised by the slated retirements over the next few years of many of the generating plants called upon to keep the lights Thus the issue of resource adequacy to meet tomorro
9 Navigant Consulting, Inc. op cit.
2
2. SECURITY, ADEQUACY, AND RELIABILITY
The physics of electric power systems requires that supply and demand be kept in exact balance at all times and that voltages throughout the systems remain within tight limits. Failure to maintain this balance and proper voltages causes deterioration in power quality and can cause blackouts. Reliability problems occur when system operators lack the resources, information, or judgment to maintain the power balance and voltages.
Power system reliability at the transmission level has two major dimensions: security and adequacy. Security depends upon power system operations, particularly including real-‐time localized deliverability, resource commitment, and dispatch. Adequacy depends upon resource planning and investment, particularly in generation, transmission, and demand-‐side resources. These two dimensions of reliability are related because security can be maintained only if adequate resources are available to system operators.
Security is a short-‐ -‐time contingencies, particularly outages of major power system facilities (like generators and transmission lines), that would cause demand to exceed supply in some portion(s) of the power system. Without prompt restoration of the power balance either through an increase in supply or controlled but involuntary shedding of firm load, the power system can experience frequency instability, voltage drop, cascading blackouts, and system collapse. Security can change instantaneously due to changes in any of the many factors affecting the power system, including resource availability. Maintenance of security requires that system operators have sufficient resources to be able to respond rapidly to contingencies. A secure power system is one that remains intact and continues to deliver power following some limited amount of equipment failures.
Adequacy is a long-‐term concept that refers to having planned supply-‐ and demand-‐side resources that exceed forecasted peak loads plus a planning reserve margin to account for forced outages of some generation units. Adequacy thus refers to the relationship between planned resources on the one hand and expected electricity loads and planning reserve requirements on the other hand.
Security and adequacy depend upon operating reserves and planning reserves, respectively. Operating reserves are, in any hour or dispatch interval, the amount by which available
capacities but also by the speed and extent to which they can respond to contingencies. Planning reserves are, in any yearexceeds annual peak loads. Operating reserves and planning reserves are thus indicators of system reliability in short-‐ and long-‐term timeframes, respectively.
The purpose of this report is to examine issues of resource adequacy in both restructured and traditionally regulated markets in the United States. To achieve this purpose, we begin, in Section 3, by providing basic background on electricity market structures and capacity cost recovery mechanisms. Section 4 is devoted to reviewing and assessing the methods by which various industry organizations, government organizations, and regions determine capacity needs. Section 5 presents regional statistics on resource adequacy, resource mix, resource
3
profitability, and capacity prices, and discusses the factors that influence these outcomes. Section 6 describes how technological advances may influence future reliability outcomes. Section 7 discusses various proposals for future reform of the means of assuring adequate capacity. Section 8 provides conclusions.
3. MARKET STRUCTURES
Traditionally regulated U.S. electricity markets have a hundred-‐year history of providing adequate generation capacity under nearly all circumstances. Nonetheless, questions have often been raised about the costs of providing and operating this capacity, particularly about whether the quantity of capacity has been too costly relative to the value of the reliability provided, whether generation investments have been efficient, and whether generation has been operated at least-‐cost. With such questions in the background, the energy crisis of the 1970s, the nuclear power cost overruns of the 1970s and 1980s, and the contemporaneous movement to deregulate other key infrastructure industries led to a search for new institutional arrangements that would shift generation investment risks from consumers to investors. The basic hope was that such a shift in risk would induce innovation in generation technologies, which did, in fact, occur; but these institutional arrangements also led to new issues and problems, many of which have yet to be resolved.
This section begins with an overview of electricity market structures and then describes the two general types of capacity cost recovery mechanisms.
3.1. Overview of Electricity Market Structures
About a third of the U.S. population continues to obtain electric power service through wholesale markets that are based on traditional institutional arrangements, while about two-‐thirds of the U.S. population obtains electricity through wholesale markets that have been substantially restructured to allow greater competition at the wholesale and/or retail levels. Both types of market traditional and restructured require mechanisms for assuring resource adequacy.
This section describes and compares each of these types of markets, and provides an overview of the states in which each market type prevails.
4
3.1.1. Traditional Markets10
In general, utilities with monopoly franchise service territories prevail in those areas of the U.S. that are not served by Regional Transmission Organizations (RTOs), though many such utilities do operate in RTO areas. These utilities are usually required to serve all retail customers within their respective service territories, in exchange for which they are granted an opportunity to earn a return on their investments commensurate with risk. This has commonly been referred
, which involves an obligation to serve in exchange for exclusive service rights.11 Because of this obligation to serve, utilities must procure sufficient short-‐ and long-‐term resources to reliably meet customer needs within their service territories. They build and own their own generating units or do so jointly with other utilities, develop long-‐term purchase arrangements with independent power producers, or procure short-‐ and long-‐term resources under negotiated bilateral power purchase agreements with entities that have surplus resources. Utilities recover the costs of procuring these resources by charging rates that are determined by their costs of service.
A bilateral capacity contract is an agreement between a willing buyer and a willing seller to exchange electricity, rights to generating capacity, or a related product under mutually agreeable terms for a specified period of time. Many non-‐RTO areas thus have non-‐centralized bilateral capacity markets in which various capacity suppliers compete to meet resource needs, often by building generation. Even in those areas in which there is little or no retail electricity competition, there may be significant wholesale competition to meet the needs of the monopoly utility. This wholesale competition has been promoted by various regulatory changes (like Federal Energy Regulatory Commission Order No. 88812) that have created non-‐discriminatory open transmission access.
Resource development continues to be supported by various sharing arrangements among utilities. Some utilities jointly develop and own power plants. Some utilities participate in reserve-‐sharing arrangements t
resources.13
10 Traditional markets have evolved substantially over the past thirty years, particularly due to changes in law and regulation that have required most utilities, in both traditional and restructured regions, to offer non-‐discriminatory open access transmission service and to purchase capacity from third parties under certain conditions. The discussion of traditional markets should not be misinterpreted to suggest that these markets have been fixed in their design or operation, but that they have instead seen less radical change than has characterized restructured markets. 11 There are some cases where limited retail competition is allowed even in states with exclusive franchises. For example, Georgia allows competition for new customers over a certain size. 12 Federal Energy Regulatory Commission, Order No. 888, Promoting Wholesale Competition Through Open Non-‐discriminatory Services by Public Utilities, 75 FERC ¶ 61,080, Docket No. RM95-‐8-‐000, April 24, 1996. 13 utilities serve customers with different load patterns, and different resources are available at different times. For example, California often sends power to the Pacific Northwest in
5
Most states in non-‐RTO areas have integrated resource planning (IRP) processes that determine resource requirements and that identify the resources that can meet those requirements at the lowest cost to customers. IRP processes consider present and future loads, existing and prospective supply-‐ and demand-‐side resources, existing and prospective transmission capabilities, risk factors (like fuel diversity), and public policy requirements (like environmental restrictions and renewable resource laws). Based upon all these factors, IRP processes result in utilities building or purchasing capacity sufficient to meet the identified resource needs. Some states require utilities to allow third parties (such as independent generators) to compete, on a non-‐discriminatory basis, to meet these resource needs. Just as in restructured markets, utilities in traditional markets utilize the principles of cost-‐based economic dispatch of their capacity resources to minimize overall variable energy costs for customers based on the short-‐term incremental costs of each resource.
3.1.2. Restructured Markets
The restructured wholesale electricity markets are all located in regions covered by RTOs. The new institutional arrangements of these markets have fostered competition in generation services through new rules for transmission access and pricing and through the creation of RTOs (also called Independent System Operators ) that direct resource commitment and dispatch over wide geographic areas.
Many states in restructured market regions allow retail access. Retail access allows many consumers to shop for their power supply among competing firms, some of which are brokers or marketers that do not own generation. This competition provides incentives for innovation and cost-‐cutting in the provision of retail electricity services, and it also encourages suppliers to link retail prices to wholesale prices. Although the investments, expenditures, and rates of competitive retail electricity suppliers are not subject to state regulation, these suppliers are subject to light regulatory oversight under consumer protection rules. As a backstop, incumbent electric utilities usually retain an obligation to serve those customers who do not choose alternative suppliers.
In the absence of retail access, utilities procure capacity resources in much the same fashion as in traditionally regulated regions, except that
rules. In states with retail access, regulators have often discouraged or even prohibited retail load-‐serving entities (LSEs) from owning their own generating resources, sometimes even barring LSEs from engaging in long-‐term contracts to hedge against short-‐term price fluctuations, under the assumption that such contrathe benefits of competition from accruing to consumers.14 These markets are dominated by
the winter, when the Pacific Northwest has its highest electricity demand; and the Pacific Northwest often sends power to California in the summer, when California has its highest electricity demand. 14 purchase all electricity in the spot market, under the assumption that any long-‐term contracts would become
6
organized spot market transactions in which all generators that clear the market get paid the market price, regardless of actual costs of their generation. These spot market transactions are centrally administered by the RTO, through which electricity can be purchased hourly on a real-‐time or day-‐ahead basis. Retail customers may not see this hourly or day-‐ahead price, however, as their particular contracts or regulatory situation determine the retail rates they pay.
The original theory was that, in these restructured wholesale markets, generation investment would be supported by competitively determined market prices for electrical energy and ancillary services which, through locational differentiation, would also induce generators to locate where generation services were most valuable. The reality, however, has been that:
neither producers, consumers, regulators, nor legislators are able or willing to tolerate the extreme and unpredictable price volatility of unfettered electricity markets;
in times of capacity shortage, the political process will not support interruption of service to consumers and retail suppliers who fail to arrange for adequate supplies, but
who do arrange for adequate supplies;
-‐term markets for electrical energy and ancillary services have not been accompanied by sufficient development of long-‐term markets for these services; and
the market rules of the RTOs and of regulators occasionally change, usually with significant notice but sometimes unexpectedly.
The consequences of these realities have been supplier bankruptcies, disincentives for arranging long-‐term supplies, the inability of market participants to arrange long-‐term price hedges, and uncertainty about the durability of market rules.
Thus, contrary to the hopes of the 1980s and 1990s, public policy does not allow unfettered electricity markets to support investment in generation and other resources. Instead, the restructured markets have had price caps imposed to limit price volatility, with the result being that, under shortage conditions, the price mechanism does not encourage the provision of sufficient additional resources nor induce sufficient load reductions. Whether simply allowing prices to reflect shortage conditions by eliminating price caps would solve capacity adequacy issues is a moot question since regulators are not likely to allow the price volatility that could result.
To avoid the shortages that the price mechanism is not allowed to handle, an assortment of administrative rules have been put in place specifying the quantities and locations of the resources that must be procured. In short, capacity needs are determined by administrative rules, RTO capacity markets identify the amounts (but not types) of resources
uneconomic as competitive pressures caused wholesale prices to fall. This turned out to be an extremely costly mistake when wholesale prices skyrocketed in the winter of 2000-‐01 and 100% of the non-‐municipal load in the state was unhedged.
7
that meet these needs, and it is hoped that the resulting capacity prices will support investment. This approach has not been enough to fully solve the resource adequacy problem,
at most only the first few years of the life of decades-‐long generation investments, and because there are uncertain relationships between capacity on the one hand and the energy and ancillary services that they provide on
how renewable resource intermittency, changing forced outage rates of power system components, uncertain future technological change, uncertain future economic conditions, uncertain electricity market rules, and uncertain future government regulatory policies affect the uncertain ability of capacity to provide the energy and ancillary services that consumers need.15
3.1.3. Overview of Prevalent Market Types in Each State
In addition to the distinction between traditional and restructured electricity markets, there is also a distinction among the states in their authorization of retail access. This latter distinction is important because it has influenced how the states deal with resource adequacy. For example, states without full retail access (such as Georgia16 and North Carolina) rely on integrated resource planning. Unlike full retail access states, they have not ordered their utilities to acquire capacity through a reverse auction of load responsibility (as occurs in New Jersey) or with regular utility semi-‐annual wholesale power procurements (as occurs in Maryland).
The RTO regions also encompass retail markets that have not restructured. In these situations, wholesale market prices are largely determined by the centralized RTO markets, while retail prices are determined on a traditional cost-‐of-‐service basis, where costs are influenced by
Considering these two dimensions traditional versus restructured markets, retail access versus no retail access we divide the 48 contiguous states and the District of Columbia into the three groups:
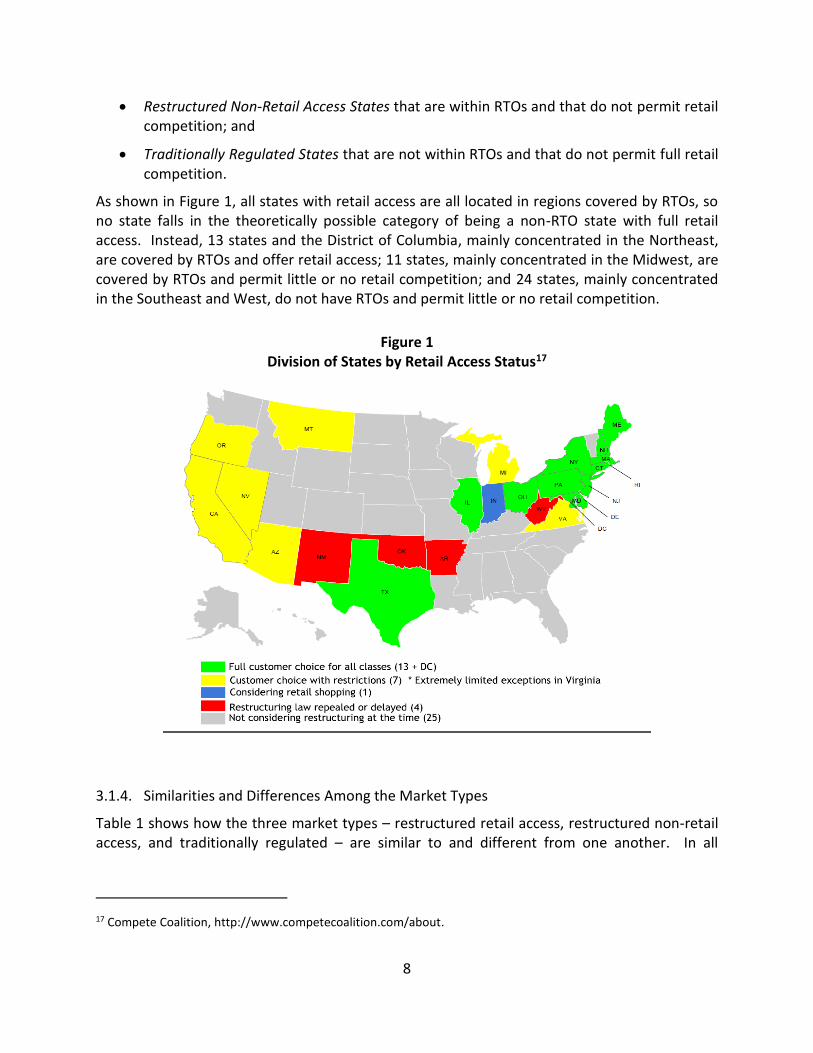
Restructured Retail Access States that are within RTOs and that permit retail competition among suppliers;
15 The current Federal Energy Regulatory Commission proceeding on revisions to the capacity market of the Midcontinent Independent System Operator (Docket No. ER11-‐4081-‐001) is the latest in a series of FERC proceedings to revise key characteristics of the capacity markets under its jurisdiction. Texas, meanwhile, is in the midst of a long and contentious process by which it seems to be heading toward adopting its own RTO-‐administered capacity market. 16 Some retail competition has been present in Georgia since 1973 with the passage of the Georgia Territorial Electric Service Act. This Act enables customers with manufacturing or commercial loads of 900 kW or greater a one-‐time choice in their electric supplier. It also provides eligible customers the opportunity to transfer from one electric supplier to another if all parties agree. See http://www.psc.state.ga.us/electric/electric.asp.
8
Restructured Non-‐Retail Access States that are within RTOs and that do not permit retail competition; and
Traditionally Regulated States that are not within RTOs and that do not permit full retail competition.
As shown in Figure 1, all states with retail access are all located in regions covered by RTOs, so no state falls in the theoretically possible category of being a non-‐RTO state with full retail access. Instead, 13 states and the District of Columbia, mainly concentrated in the Northeast, are covered by RTOs and offer retail access; 11 states, mainly concentrated in the Midwest, are covered by RTOs and permit little or no retail competition; and 24 states, mainly concentrated in the Southeast and West, do not have RTOs and permit little or no retail competition.
Figure 1 Division of States by Retail Access Status17
3.1.4. Similarities and Differences Among the Market Types
Table 1 shows how the three market types restructured retail access, restructured non-‐retail access, and traditionally regulated are similar to and different from one another. In all
markets other than Texas,18 LSEs have an obligation to procure capacity either owned or procured under contract that is sufficient to serve their own retail load. The RTOs offer an additional venue their centralized capacity markets in which LSEs can procure capacity. Consumers have a choice of retail supplier only in markets with retail access, in exchange for which utilities have a more limited obligation to serve than in markets without retail access.19 While retail rates continue to be cost-‐based in markets without retail access, they are more market-‐based in markets with retail access in that the energy portion of rates depends on a pass-‐through of the wholesale cost of the electricity procured in the wholesale market.
Table 1 Similarities and Differences Among Market Types
Characteristic Market Type
Restructured Retail Access
Restructured Non-‐Retail Access
Traditionally Regulated
Capacity planning forum RTO / IRPs or LTRPs20 RTO / IRPs IRPs
LSE obligation to procure capacity sufficient to serve own load
Centralized market purchases yes yes not applicable
Consumer choice of supplier mostly yes No, or severely
restricted No, or severely
restricted Utility obligation to serve limited yes yes 18 In Texas, retail energy providers (REPs) serve retail electric consumers without bearing a requirement to secure capacity sufficient to meet their load. 19 In retail access states, distribution utilities have an obligation to serve customers regardless of which supplier the customer chooses. The investments, expenditures, and rates of distribution utilities are still regulated by state regulatory agencies.
competitive supplier. The prices and terms of this default service are also regulated by the state regulatory agency. 20 Requirements for long-‐term resource plans (LTRPs) differ from requirements for IRPs. For LTRPs, planning periods are typically ten years, although some states require a five-‐year planning period with yearly updates. Because utilities in states with LTRPs operate in restructured retail markets and typically do not own generation, LTRPs evaluate purchases for capacity and energy, as well as energy efficiency and other demand-‐side management programs.
10
Basis of retail rates market prices for
energy and reserves, cost for wires
cost cost
Figure 2 shows that a vast majority of the states have an IRP requirement, including a significant number of states that are part of an RTO. Furthermore, many other states in RTO regions require LSEs to file long-‐term resource plans that supersede the IRPs that existed prior to the restructuring of the retail market.
Figure 2 States with Integrated Resource Planning or Similar Processes21
3.2. Capacity Cost Recovery Mechanisms
In principle, there are two basic methods by which the required amount of capacity can be determined. First, the required amount of capacity can be determined through purely market
21 Synapse Energy Economics Inc., Best Practices in Electric Utility Integrated Resource, June 2013, Figure 2, p. 5.
11
processes, whereby investors build capacity when they expect that the market prices of electricity services will be sufficiently high to make their investments profitable.22 Second, some agency like a reliability organization, state regulators, RTOs, or utilities themselves can determine the capacity requirement.
The methods by which capacity costs are recovered are determined, in large part, by the methods for determining the capacity requirement. When the capacity requirement is determined by the market, capacity costs must be recovered through market prices. When the capacity requirement is determined by an agency or by a utility satisfying a regulatory requirement, there needs to be some scheme for more or less guaranteeing recovery of prudently incurred costs.
3.2.1. Cost Recovery Under a Purely Market Scheme
Under a purely madevelop resources when they expect to profit from the sales of energy and ancillary services at projected market prices. Such sales may be at spot (real-‐time) prices, but resource owners and customers would generally seek to avoid price volatility through derivative contracts such as long-‐term bilateral sales contracts and option contracts. Capital costs and operating costs would be recovered solely through revenues from the sale of these services. When demand threatens to exceed available capacity, high energy and ancillary services prices would encourage immediate load reductions, often through demand response programs (though in some instances through utility-‐imposed load curtailments); and investment would respond to expectations of persistent high prices.
That is the theory.
In real electricity markets, by contrast, energy and ancillary services prices are significantly distorted, and cost recovery is seriously undermined, by the following circumstances and policies:
In some RTO regions, limited demand-‐side participation and electricity customersgeneral insulation from volatile wholesale electricity prices restrict the extent to which market prices and capacity choices aservices.
RTOs -‐of-‐market purchases of energy and ancillary services, by increasing short-‐term energy and reserve supply for the purpose of improving short-‐term reliability, have the side-‐effect of depressing energy and reserve prices.23
22 As discussed below, this first approach is not likely to result in capacity sufficient to meet traditional capacity requirements or the laws or regulations related to such requirements. 23 ancillary services in the right locations. Consequently, for the purpose of assuring power system reliability, they
-‐of-‐operating reserves that these generators would not be willing to provide at market prices. The RTOs recover these
12
Energy and ancillary service prices are generally subject to caps, partly to reduce the price volatility borne by consumers and partly because of concerns that high prices may be due to exercises of supplier market power. These price caps limit cost recovery under shortage conditions, thereby depriving capacity resources of what could otherwise be a significant source of revenues. This leads to the so-‐
, which inhibits new investment in restructured markets.
The investment problem is particularly acute because of the nature of electricity demand. Customer demand has a profile that includes baseline needs during normal weather conditions and usage, and higher peak demands during particularly cold or hot weather (depending on the region). A mix of generating technologies satisfies this range in electricity demand at least cost. The generators that serve demand only during peak load hours may be needed to run only a few days or even a few hours each year. Although such peaker plants have relatively low capital costs, they nonetheless need extremely high prices during those few days or hours to earn revenues sufficient to cover both the variable and fixed costs, including a return on their investment in capacity. Inconsistent with this need, however, the restructured markets have caps on
to provide the needed revenue for the peaker plants during those few hours when they
mechanisms are intended to make up incentives for investment in both base load and peaking generation so far with limited success.
Policies that support particular types of capacity resources such as renewable resource portfolio standards or tax credits for renewable resource investments have the implicit
on other resources occurs in the form of reduced market prices for energy, ancillary services, and capacity due to the presence and operation of the preferred, subsidized resources. 24,25
extra payments through uplift charges of various sorts, generally imposed on all load. The generators who receive these payments supply of energy and ancillary services that they would not provide without these payments; and this extra supply has the effect of reducing energy and ancillary services prices relative to what they would otherwise be. 24 undermined by price discrimination in favor of certain preferred resources. See Statement of Michael M. Schnitzer, Co-‐founder and Director of The NorthBridge Group, on behalf of the Electric Power Supply Association , Centralized Capacity Markets in Regional Transmission Organizations and Independent System Operators, before the Federal Energy Regulatory Commission, Docket No. AD13-‐7-‐000, September 9, 2013. 25 The size of this tax on other resources has been estimated for the Texas power market for the years 2013
state renewable resource policies will depress peaker margins by about $6 per kW-‐year and natural gas combined-‐cycle margins by about $14 per kW-‐year. See M. Kline, B. Gibbs, and R.
13
U.S. power industry practice sets planning reserve requirements at levels that exceed many customers willingness to pay for reliability.26 In general, it might be cheaper for many customers to suffer more bulk power system-‐related outages than to pay for the resources needed to avoid those outages, even considering (for example) business customers lost production, lost sales, and additional production equipment repair and maintenance costs following an unexpected outage. Outage costs do vary widely among customers. Nonetheless, because many
ual planning reserve requirements as determined by public policy, markets alone will not
, even with a perfectly functioning demand-‐side of electricity markets.
The latter four policies all restrict or reduce market prices; and the latter two policies require capacity that would not be supported by free markets. Eliminating these policies is simply not realistic. Consequently, given the likelihood that these policies and market design practices will remain in place, capacity costs will not be recoverable under a purely market scheme and investment in new capacity will continue to be suppressed.
3.2.2. Cost Recovery With a Capacity Requirement Scheme
Capacity requirement schemes characterize both traditional and RTO markets. Such schemes impose capacity obligations on individual LSEs for specified present and future periods (such as three years ahead). These obligations can be enforced through penalties, or LSEs may meet their requirements merely as a matter of good business practice.
Capacity requirements are generally set at some level in excess of loads plus any wholesale sales obligations that the LSE may have under contract. This excess is
-‐Onl
August 2013, p. 1. 26 -‐for a 15.25% reserve margin; but customer willingness-‐to-‐pay $9,000 per MWh to avoid curtailment implies a need for only a 10% reserve margin. See S. Newell, K. Spees, J. Pfeifenberger, R. Mudge, M. DeLucia, and R. Carlton, ERCOT Investment Incentives and Resource Adequacy, Brattle Group, prepared for Electric Reliability Council of Texas, June 1, 2012, p. 3. The $9,000 value is roughly the magnitude of multiple studies of the costs that customers incur due to curtailment.
-‐ -‐to-‐pay of $300,000 per MWh to avoid curtailment, an absurd result that is equivalent to an average homeowner
capacity is $90,000 per MW-‐year; and b) that a typical resource-‐related firm load shed event lasts three hours. $300,000 = $90,000 per MW-‐year / [(3 hours per event) / (1 event per 10 years)]. Note that the $90,000 figure is consistent with the $891 per kW cost of a combustion turbine peaking unit shown in Figure 16: $90,000 = $891 per kW * 1000 kW per MW * 10.1% cost of capital. See Astrape Consulting, The Economic Ramifications of Resource Adequacy, for Utility Commissioners, January 2013, p. 1.
14
the planning reserve margin, usually a number in the range of 12% to 18% of peak load. The determination of capacity requirements thus depends upon load forecasts, which are more uncertain for individual LSEs in competitive retail situations wherein customers may shift among LSEs than in monopoly situations in which a single LSE can count on serving the whole market.
LSEs can fulfill their capacity obligations through resource ownership or resource rights conferred by contract. Contractual resource rights may be procured in bilateral markets and, in some RTOs, in centralized capacity markets.27
There is some complexity, however, in defining meets the obligations. In principle, elements of this definition could include the following:
supply-‐side versus demand-‐side resources versus transmission resources;
resource technology (such as fuel type);
performance requirements (such as minimum availability rates, speed of availability, dispatchability by the system operator);
requirements for substantiating expected performance;
requirements for power deliverability;
requirements for firm fuel transportation;
timeframe of the capacity obligation (such as one month ahead or five years ahead); and
quantification of capacity (such as crediting dispatchable resources with their full nameplate capacities while crediting intermittent resources with only a quarter of their nameplate capacities).
Capacity investors must have a reasonable expectation that they will recover the capital costs of their investments regardless of the institutional arrangements under which the investment is made. The capital cost recovery methods are very different under traditional regulatory schemes than under restructured market schemes.
Traditional Recovery Through Cost-‐of-‐Service Based Rates
Traditionally, capacity costs have been recovered from retail customers through retail charges based upon those costs. In general, cost-‐of-‐service ratemaking annualizes capacity costs according to some measures of capital costs (like interest rates), assigns these costs to the
s the functionalized costs among customer classes or groups, and then divides class-‐level costs by some class-‐level billing determinants (like peak loads or energy sales) to derive retail prices. The costs that are recovered through
27 LSE participation in centralized capacity markets may be mandatory or voluntary, depending upon the RTO.
15
these retail prices may be lower or higher than costs actually incurred depending upon the accuracy of the forecasts (particularly the load forecasts) that went into the price calculation.
There are two main factors that make traditional recovery of capacity costs uncertain. The less important factor is the inevitable misforecasting of the loads and costs that underlie the calculation of retail prices. These misforecasts might reasonably be expected to offset each other over the life of a capacity resource, which makes the uncertainty relatively minor over the
. The more important factor, for regulated utilities, is uncertainly of the extent to which regulators will accept the prudency of capacity investments, which depends, in large part, on the extent of any capacity cost overruns. In short, under traditional regulation, the prudency of a capacity resource investment largely determines the uncertainty in the recovery of capacity costs. A utility can pretty much count on recovering those capacity investment costs deemed prudent by regulators.
Competitive Recovery With Capped Energy and Ancillary Services Prices
Recovery of capacity costs in a competitive market context requires either: a) regulatory or administrative support of market prices, such as Minimum Offer Price Rules that discourage investment in some capacity resources as a counterbalance to those policies that encourage investment in other (possibly subsidized) capacity resources; and/or b) imposition of implicit taxes on electricity consumers, which is accomplished primarily through the capacity requirements imposed on LSEs. It also requires the imposition upon LSEs of stiff penalties for failure to procure sufficient capacity through owned or purchased capacity to meet their respective requirements.
Because of the policies (enumerated in Section 3.2.1) that distort and depress the market prices of electricity services, capacity cost recovery in competitive markets depends upon the mandatory resource requirements imposed upon LSEs. Because the mandatory requirements raise the costs of all LSEs, each individual LSE is able to raise its retail prices to recover these costs without fear of losing customers to competitors. Nonetheless, these mandatory requirements have, in practice, often been insufficient to assure full capacity cost recovery and thereby provide insufficient incentives for investors to develop new resources.
4. DETERMINATION OF CAPACITY REQUIREMENTS
Capacity requirements are determined first and foremost by the need to maintain power system reliability. Reliability needs are generally translated into capacity requirements through various rules of thumb that are implemented through engineering analysis of probable reliability outcomes, with the objective of minimizing costs subject to meeting the reliability requirement.
This section describes the regulatory context in which capacity requirements are determined, and then looks at the actual and proposed practices of certain entities responsible for assessing resource adequacy.
16
4.1. Regulatory Context Various reliability and regulatory agencies impose overlapping rules on the utilities, transmission owners, and system operators who are responsible for the day-‐to-‐day and minute-‐to-‐minute tasks of maintaining power system reliability. In general, the national standards set minimum criteria, while more local standards can set higher criteria.
For example, resource adequacy in New York State depends upon the various rules established by the North American Electric Reliability Corporation (NERC), the Northeast Power Coordinating Council (NPCC), the New York State Reliability Council (NYSRC), the Federal Energy Regulatory Commission (FERC), the New York Public Service Commission, and the New York Independent System Operator (New York ISO).28 Because of the particular reliability needs of the northeast region, NPCC regional level standards may be more stringent than the national-‐level standards -‐level standards may be more stringent than the regional-‐level standards of NPCC.
Following the national-‐to-‐local scheme, this section begins at the highest level the North American Electric Reliability Corporation and then sequentially looks at Regional Reliability Entities, FERC, and state requirements.
4.1.1. North American Electric Reliability Corporation Standards29
NERC develops reliability standards in collaboration with stakeholders in the U.S. and Canadian bulk power systems. The standards are based upon power engineering models that estimate
and risks.30 NERC does not set reserve margins or mandate resource development (such as the building of generation or transmission facilities). Instead, NERC develops reliability standards, independently assesses reliability issues, and identifies emerging reliability risks.
Reliability Standards define the power system operating and planning requirements to which each entity responsible for operating or planning the bulk power system must adhere. Each standard must be consistent with all of the following Reliability Principles:31
28 New York State Reliability Council, Reliability Rules For Planning And Operating the New York State Power System, Version 31, May 11, 2012, p. 4. 29 Sources of this section include http://www.nerc.com/pa/stand/Pages/default.aspx; North American Electric Reliability Corporation, Reliability Standards for the Bulk Electric Systems of North America, December 12, 2013, http://www.nerc.com/pa/Stand/Reliability%20Standards%20Complete%20Set/RSCompleteSet.pdf; and North American Electric Reliability Corporation, Reliability and Market Interface Principles, undated, http://www.nerc.com/pa/Stand/Standards/ReliabilityandMarketInterfacePrinciples.pdf. 30 http://www.nerc.com/pa/stand/Pages/default.aspx. 31 http://www.nerc.com/pa/Stand/Standards/ReliabilityandMarketInterfacePrinciples.pdf.
17
Reliability Principle 1 Interconnected bulk electric systems shall be planned and operated in a coordinated manner to perform reliably under normal and abnormal conditions as defined in the NERC Standards.
Reliability Principle 2 The frequency and voltage of interconnected bulk electric systems shall be controlled within defined limits through the balancing of real and reactive power supply and demand.
Reliability Principle 3 Information necessary for the planning and operation of interconnected bulk electric systems shall be made available to those entities responsible for planning and operating the systems reliably.
Reliability Principle 4 Plans for emergency operation and system restoration of interconnected bulk electric systems shall be developed, coordinated, maintained and implemented.
Reliability Principle 5 Facilities for communication, monitoring, and control shall be provided, used, and maintained for the reliability of interconnected bulk electric systems.
Reliability Principle 6 Personnel responsible for planning and operating interconnected bulk electric systems shall be trained, qualified, and have the responsibility and authority to implement actions.
Reliability Principle 7 The security of the interconnected bulk electric systems shall be assessed, monitored, and maintained on a wide-‐area basis.
Each standard must also be consistent with all of several Market Interface Principles that are intended to facilitate electricity competition without discriminating in favor of or against any particular market participant.
4.1.2. Regional Reliability Entities Standards
NERC delegates authority to regional reliability entities that are responsible for promoting and improving the reliability, adequacy, and critical infrastructure of their respective regional power systems. These entities serve each of the several NERC reliability regions shown in Figure 3. Each regional entity develops, updates, monitors, and enforces reliability standards within its own region, without discrimination among market participants. These standards may be tailored to regional circumstances, but must be consistent with NERC standards. The regional reliability entities may also help coordinate power system planning, design, and operations.
For each of the eight regional reliability entities, resource requirements or, equivalently, planning reserve requirements are determined as follows:
18
Florida Reliability Coordinating Council (FRCC), in collaboration with the Florida Public Service Commission, requires that investor-‐owned utilities (IOUs) maintain a 20% planning reserve margin while non-‐IOUs maintain a 15% reserve margin.32
Midwest Reliability Organization (MRO) has two subregions Mid America Power Pool (MAPP) and the Midcontinent Independent Transmission System Operator (MISO).
in target for utilities within that sub-‐region of the MRO. Resource requirements in MISO are determined as described in Section 4.2.1.
Northeast Power Coordinating Council (NPCC), in its U.S. portion, is divided between ISO New England and the New York ISO. The reliability criteria and targets for planning reserve requirements for these RTOs are determined as described in Section 4.2.1.
Figure 3 NERC Reliability Regions33
32 North American Electric Reliability Corporation, 2013 Summer Reliability Assessment, May 2013, p. 8. 33 The reliability regions are Florida Reliability Coordinating Council (FRCC), Midwest Reliability Organization (MRO), Northeast Power Coordinating Council (NPCC), ReliabilityFirst Corporation (RFC), SERC Reliability Corporation (SERC), Southwest Power Pool Regional Entity (SPP), Texas Reliability Entity (TRE), and Western Electricity Coordinating Council (WECC).
19
ReliabilityFirst Corporation (RFC) is split between Midcontinent ISO and PJM. Therefore, the reliability criteria and targets for planning reserve requirements are established as described in Section 4.2.1.
SERC Reliability Corporation (SERC) is guided by the NERC benchmark of 15% planning reserves as well as by reliability criteria that apply to each of the sub-‐regions and power systems within SERC. SERC uses region-‐wide reliability criteria only to the extent that the criteria applied to smaller areas do not adequately address reliability for the whole region. Subject to the foregoing and to the condition that each financial entity within SERC is responsible for serving its own load, each financial entity determines its own planning reserve requirement. Nonetheless, capacity planning is coordinated among the entities within each sub-‐region.
Southwest Power Pool Regional Entity (SPP) has a Reference Margin Level of 13.6%.34
Texas Reliability Entity (TRE) has a Reference Margin Level of 13.75%. This figure is based on a target of no more than 0.1 loss-‐of-‐load events per year.35 Electric Reliability Council of Texas (ERCOT) stakeholders are currently reviewing a recently completed loss-‐of-‐load study that supports the target reserve margin determination. A final decision by the ERCOT Board is expected later this summer.
Western Electricity Coordinating Council (WECC) covers a very large geographic region that is divided into 19 reliability assessment zones. Target reserve margins in the U.S. zones for summer range between 12.6% and 17.9%, averaging 14.8%, while those for winter range between 11.0% and 19.9%, averaging 14.3%. For the Canadian zone, the figures are 12.4% and 14.0%, while for the Mexico zone, the figures are 11.9% and 10.7%. Thus, the U.S. zones tend to have higher target reserve margins than those of Canada and Mexico. For WECC as a whole, that target reserve margin is 14.6% in both summer and winter.36
In addition to regional entities, there are sub-‐regional entities (like the NYSRC) that may impose reliability standards that go beyond those of the regional entities.
4.1.3. Federal Energy Regulatory Commission Requirements
FERC has issued several important orders pertaining to the organization of RTO capacity markets. Some of these orders have been generic orders that address market design issues, among which capacity markets and/or resource adequacy issues are a part.37 Other orders
34 North American Electric Reliability Corporation, 2013 Summer Reliability Assessment, May 2013, p. 142. 35 North American Electric Reliability Corporation, 2013 Summer Reliability Assessment, May 2013, p. 19. 36 Western Electricity Coordinating Council, 2012 Power Supply Assessment, October 15, 2012, Table 7, p. 7. 37 These include, for example, Order No. 719 (Federal Energy Regulatory Commission, Wholesale Competition in Regions with Organized Electric Markets, 125 FERC ¶ 61,071, Docket Nos. RM07-‐19-‐000 and AD07-‐7-‐000, October
20
.38 The general thrust of these orders has been to promote the following:
Non-‐discriminatory treatment of generation, demand response, and transmission as capacity resources;
Recognition of the importance of capacity locations, to account for transmission constraints that limit deliverability;
Encouragement of advance commitment of capacity, to support planning and allow time for capacity construction or development;
Determination of capacity prices according to peaking plant revenue requirements net of energy and ancillary service market revenues.
Within the general thrust of its policy, FERC has allowed the RTOs significant latitude in setting the details of how their capacity markets work, including differences in how the RTOs determine capacity requirements, define capacity, set capacity performance requirements, mandate capacity market participation, set the timing of capacity commitments, conduct auctions, determine capacity prices, and mitigate market power.
4.1.4. State Requirements
State reliability requirements are consistent with those established by NERC, the Regional Reliability Entities, and FERC. They do, however, sometimes go beyond the national and regional requirements.
4.2. Requirements of the Regional Transmission Operators
This section describes, comparesdetermines its capacity requirements.
4.2.1. Methods for Determining Capacity Requirements
Capacity requirements are usually determined by the amount of capacity that will achieve some reliability target (like one outage event in ten years) under peak load conditions. The critical determinants of capacity requirements are therefore the reliability targets, forecast peak loads, and the modeling assumptions that relate power system conditions to reliability outcomes.
17, 2008) and Order No. 745 (Federal Energy Regulatory Commission, Demand Response Compensation in Organized Wholesale Energy Markets, 134 FERC ¶ 61,187, Docket No. RM10-‐17-‐000, March 15, 2011). 38 These include, for example, Federal Energy Regulatory Commission, Initial Order on Reliability Pricing Model, PJM Interconnection, L.L.C., 115 FERC ¶ 61,079, Docket Nos. EL05-‐148-‐000 and ER05-‐1410-‐000, April 20, 2006; and Federal Energy Regulatory Commission, Order Accepting Market Rules, ISO New England, Inc., 119 FERC ¶ 61,239, Docket No. ER07-‐547-‐000, June 5, 2007.
21
Because of transmission limitations, capacity requirements are set by zones that are defined by existing transmission constraints. Significant changes in power system configurations, notably including additions or retirements of generation or transmission facilities, can change the definitions of zones.
Retail choice creates substantial uncertainty in the quantity of load that will be served by any LSE. For a monopoly utility, the load in any particular year is uncertain because of the major common factors weather and economic conditions that affect all loads and are uncertain on an annual time scale. For LSEs competing to serve customers, the load in any particular year
consumer preferences, market campaign successes and failures, and other competitive conditions. Consequently, the load uncertainty faced by an LSE in a retail choice environment is proportionally much greater than the load uncertainty faced by an LSE in a market without retail choice.
y of load that it serves, the obligation in retail choice environments is proportionately much more uncertain than in non-‐retail choice environments. Furthermore, this relatively larger uncertainty increases with longer forward timeframes. For example, athree years in advance than one month in advance.
California Independent System Operator
The California Independent System Operator (California ISO) tariff requires LSEs to have generation capacity equal The 15% planning reserve requirement covers operating reserves (about 7% of load) plus an allowance for resource outages and other potential resource deficiency issues (about 8% of load). LSEs may be required to procure additional resources to address reliability issues in certain local areas.
Electric Reliability Council of Texas
ERCOT does not have a capacity market, though it is considering the possibility of adopting one.39 Although a 13.75% planning reserve margin is implied by its target reliability standard of one-‐in-‐ten-‐year loss-‐of-‐load expectation (LOLE), ERCOT does not have a formal resource adequacy requirement. Instead, LSEs procure resources as they think appropriate in accordance with their expectations of future electrical energy prices. Consequently, actual
decisions.
39 The Public Utility Commission of Texas together with the ERCOT has commissioned a significant amount of research into the question of how best to ensure resource adequacy in Texas. A contentious debate continues over whether the Texas electricity market needs a formal capacity market to solve its resource adequacy issues. A most recent addition to the research on the question is The Brattle Group, Estimating the Economically Optimal Reserve Margin in ERCOT, prepared for the Public Utility Commission of Texas, January 31, 2014.
22
ISO New England
ISO New England forecasts loads according to historical loads and forecasts of future real income and real electricity prices.40 Based upon this load forecast, it determines the amount of additional capacity, on top of existing capacity, that would be needed to achieve a one-‐in-‐ten-‐year LOLE. With various adjustments for Hydro-‐Québec Interconnection Capability Credits and import capability, the Installed Capacity Requirement (ICR) is then set equal to: a) existing capacity; times b) one plus the ratio of the needed additional capacity to summer peak load.41
ISO New England has capacity requirements for each of four Capacity Zones: the Maine Load Zone, the Connecticut Load Zone, the Northeastern Massachusetts Load Zone, and the Rest of Pool Capacity Zone.42
Midcontinent Independent Transmission System Operator
Resource adequacy requirements in the MISO region are set by state regulators and influenced by stakeholders and FERC. Resource adequacy requirements therefore vary by state.
Nonetheless, MISO performs an annual LOLE study that serves as the basis for its minimum Planning Reserve Margin (PRM) for the upcoming planning year and its PRM forecast for the
maintenance outages, and forced outages; load forecast uncertainty; and transmission congestion. MISO relies on its members for load and other information that determines the PRM. The PRM is not mandatory.
New York Independent System Operator
New York Installed Reserve Margin (IRM) requirement.43 New York ISO forecasts peak load by escalating historical peak loads according to forecast growth of loads and of dispatchable load management programs.44 The NYSRC sets the IRM requirement to achieve a one-‐in-‐ten-‐year LOLE, where the calculation of the LOLE depends outages and deratings, assistance over interconnections with neighboring control areas, NYS
40 ISO New England, Regional Long-‐Run Energy and Peak Load Forecast (2012-‐2021), System Planning, presentation to NEPOOL LFC Meeting, January 31, 2012. 41 ISO New England, ISO New England Installed Capacity Requirement, Local Sourcing Requirements, and Maximum Capacity Limit for the 2014/15 Capability Year, April 2011, p. 11 and p. 25. 42 ISO New England, Market Rule 1, Section III.12.4, p. 143. 43 New York Independent System Operator, Installed Capacity Manual, August 2011, p. 2-‐3. 44 New York Independent System Operator, NYISO Load Forecasting Manual, Manual 6, April 2010, pp. 1-‐1 1-‐2, http://www.nyiso.com/public/markets_operations/documents/manuals_guides/index.jsp.
23
Transmission System emergency transfer capability, and capacity and/or load relief from 45
PJM
weather conditions and economic growth in its forecasts of peak loads.46 It sets the IRM
loads, generator forced outage rates, and generator maintenance schedules.47 PJM differentiates capacity requirements by Locational Deliverability Area, each of which is defined by actual past transmission constraints, potential future transmission constraints, or a perceived reliability need.
Southwest Power Pool
Southwest Power Pool (SPP) requires that most LSEs have capacity equal to at least 112% of their system peak responsibility, while LSEs with resources that are at least 75% hydroelectric are required to have capacity equal to at least 109% of their system peak responsibility.48 Each
annual load plus firm wholesale power sales at the time of its annual peak less firm wholesale power purchases at the time of its annual peak.
4.2.2. Determination of Capacity Prices
In a market context, the incentives for resource investment depend upon the costs that can be recovered through markets over the long term. Because these markets include capacity markets, the determination of capacity prices can affect resource investment incentives.
In the eastern RTOs (that is, New England, New York, and PJM), centralized market capacity auctions are held for specific future time periods (up to four years in advance) and at specific intervals. The auctions may have several rounds to allow market participants to adjust their positions and find market equilibrium. Resources that are accepted in each auction are those that have bid below the relevant market-‐clearing price: they are paid a market-‐clearing price that reflects the netting of the revenues (if any) that a pure peaking generator would earn from energy and ancillary services sales. Capacity prices are determined by the intersections of supply and demand curves for each season and each relevant capacity market zone. Supply
45 New York State Reliability Council, LLC, New York Control Area Installed Capacity Requirements for the Period May 2012 -‐ April 2013, December 2, 2011, p. 3. 46 PJM Interconnection, Load Forecasting and Analysis, Manual 18, November 16, 2011. 47 PJM Interconnection, PJM Capacity Market, Manual 18, November 11, 2011, p. 7 and p. 9; and PJM Interconnection, PJM Resource Adequacy Analysis, Manual 20, June 1, 2011, pp. 21-‐34. 48 Southwest Power Pool, Southwest Power Pool Criteria, Section 2.1.9, April 25, 2011.
24
curves are determined by the capacities and offer prices of the resources offered in each auction. Demand curves are administratively determined by each RTO, and depend principally upon the estimated cost of new entry of a pure peaking generator (net of energy and ancillary services revenues) and the capacity that is required to meet reliability criteria for each zone. The market-‐clearing price and the market-‐clearing quantity are determined by the intersection of the supply and demand curves. In the event of failure to perform, accepted resources may be penalized and may be liable to pay for replacement capacity.
ISO New England has a mandatory centralized capacity market through which LSEs trade capacity up to three years in advance and, for new capacity, can obtain guaranteed prices for up to five years. Its auction begins at a high price that yields more capacity than the ICR. The price is then reduced until the cleared capacity exactly meets the ICR and the requirements for each of local capacity zones. Existing capacity resources are price-‐takers that clear the auction automatically. New capacity resources, which are those that have not cleared in a previous auction, must bid to receive compensation. Only new capacity offers determine the clearing price, while existing capacity resources influence the clearing price only by exiting the auction. Capacity and capacity prices are differentiated by zone.
MISO has a voluntary centralized capacity market through which LSEs can trade capacity one year in advance. LSEs can opt out of the centralized market if they procure sufficient resources through resource ownership or bilateral contracts. LSEs without sufficient resources must pay a penalty charge that is based upon the cost of new entry.
New York has a mandatory monthly spot market auction through which LSEs trade capacity up to one month in advance. It also runs voluntary six-‐month strip and monthly auctions for each
Capacity suppliers indicate the quantities and prices of their offers; and offers are accepted up to the point that the resulting supply curve meets the demand curve. LSEs are allowed to self-‐supply part or all of their capacity obligations. Capacity and capacity prices are differentiated by zone.
PJM has a mandatory centralized capacity market through which LSEs trade capacity up to three years in advance and in which new capacity can obtain guaranteed prices for up to three years. A Base Residual Auction (BRA) is held for a delivery year three years in the future. To allow market participants to make adjustments in their capacity resources by selling excess capacity or purchasing additional amounts to make up capacity deficiencies, three additional auctions may be held for each delivery year, occurring twenty, ten, and three months, respectively, prior to the delivery year.49 The BRA determines the capacity price based upon a mathematical optimization program that finds the intersection point of capacity supply offers,
demand curve. The
49 The three additional capacity auctions allow LSEs to adjust their capacity purchases to changing circumstances. Also, a conditional incremental auction may be held if a need to procure additional capacity results from a delay in a planned large transmission upgrade that was modeled in the BRA for the relevant delivery year.
25
optimization considers deliverability constraints that define capacity pricing zones. In general, LSEs are allowed to self-‐supply only capacity that clears the centralized market.50,51
Figure 4 shows samples of the capacity demand curves used by the three eastern RTOs. The curves for the New York ISO and PJM begin at high capacity price levels when reserve margins are very low, then fall continuously as reserve margins rise, finally reaching zero prices at high reserve levels. The downward slope of these curves reflects the usual economic fact that the value of a good falls as it becomes more abundant. The curve for ISO New England, by contrast, begins at a high price level but then suddenly drops (vertically) to a low but positive floor price level at a threshold reserve level. The downward-‐sloping demand curve approach of ISO New England, the New York ISO, and PJM leads to less volatile capacity prices than would a vertical demand curve approach, as the former has price gradually change with reserve margins while the latter has price suddenly change at the threshold reserve level.52
50 -‐supply all of their capacity on stringent terms that are cost-‐effective for only very large LSEs with very large resource portfolios. 51 Federal Energy Regulatory Commission, 143 FERC ¶61,090 (2013), PJM Interconnection LLC, Order Conditionally Accepting in Part, and Rejecting In Part Proposed Tariff Provisions, Subject to Conditions, May 2, 2013. 52 ISO New England and the New England Power Pool (NEPOOL) recently replaced its fixed capacity requirement (i.e., vertical demand curve) with an administratively determined, downward-‐sloping demand curve. See FERC, ISO New England Inc., New England Power Pool Participants Committee, Docket No. ER14-‐1639-‐000, April 1, 2014.
26
Figure 4 Sample Demand Curves for PJM, New York ISO, and ISO NE, 2016/2017 Delivery53
The maximum price when capacity falls short of the target is defined in all three RTOs in relation to the Cost of New Entry (CONE). CONE is defined as the annualized capacity cost of a new peaking plant. As illustrated in Figure 4, all three RTOs have set their maximum prices in the neighborhood of $200 per kW-‐year for the 2016/17 delivery year. All three RTOs set the maximum price at 1.5 times their estimates of CONE net of revenue earned from the energy and ancillary services markets as adjusted for forced outage rates (adjusted net CONE). The downward-‐sloping segments of the demand curves for New York ISO and PJM are defined by their reserve targets and various multiples of CONE, again adjusted for forced outage rates.
ions is steel in the ground or qualifying demand-‐side resourcesin traditionally regulated regions is a call option that gives the buyer the right to purchase power at specified terms under particular conditions. The prices of capacity in traditionally regulated
The capacity development process in traditionally regulated regions provides incentives for resource investment to the extent that sales of capacity add to the recovery of investment costs.
53 Federal Energy Regulatory Commission, Centralized Capacity Market Design Elements, Commission Staff Report, Docket No. AD13-‐7-‐000, August 23, 2013, Figure 2, p.6.
27
suppose that the price of
traditionally regulated regions than in RTO regions, and because the determinants of demand and suppthat the prices of capacity are comparable between the two types of regions.
4.2.3. Market Power Mitigation
Market power can be exercised in capacity markets if and when participants can profitably manipulate capacity prices. A capacity seller that has resources in excess of its own requirements may be able to profit from withholding capacity from the market and thereby raising the prices at which they sell their excess. A capacity buyer that is deficient in resources may be able to profit by procuring subsidized resources and thereby reducing the market prices at which they must purchase resources to cure their deficiency; though some controversy has been generated by the strangeness of accusing participants of wrongdoing for procuring resources that meet their own needs.
Market power can be problematic in short-‐term capacity markets because of the insensitivity of supply to price: most resources that will be available a few years from now have already been built or at least have significant sunk costs that cannot be avoided by a decision to withhold capacity from the market; so, except in cases of retirement, the resources will be available regardless of the capacity price. The consequence of this insensitivity is that small changes in supply can have large impacts on short-‐term capacity prices. The price impacts are particularly
RTO requires a particular quantity of capacity regardless of price. Consequently, New York ISO and PJM have attempted to mitigate the price impacts of supply changes by incorporating a downward-‐slope into their administratively determined demand curves, which has the effect of reducing the profitability of exercising market power.
The RTOs have a variety of tests for market power. The tests for supplier market power variously seek to determine if there will be a shortage without the capacity of certain suppliers,
substantially from its offer price. The tests for buyer market power require that a supplier justify a low bid (below a minimum offer price) with cost data under certain circumstances.
The three eastern RTOs have similar market power mitigation rules. PJM, for example, has explicit rules that define the must-‐offer requirement for capacity, structural market power, and offer caps based on the marginal cost of capacity. These rules incorporate flexible criteria for competitive offers by new entrants or by entrants that may have an incentive to exercise monopsony power. Demand-‐side resources and Energy Efficiency resources may be offered directly into the capacity auctions and receive the clearing price without mitigation.
Market power mitigation can affect resource investments in a few ways. First, supply-‐side mitigation can induce capacity owners to offer all their capacity to the market, thereby increasing supply; though by holding down capacity prices, it might discourage new investment.
28
Second, buyer-‐side mitigation can dissuade resource-‐deficient LSEs from investing in new capacity; though by increasing capacity prices, it might encourage new investment by others. Third, market power mitigation may be implemented in ways that support or undermine state renewable resource policies or state resource planning processes.
Market power is not a problem in long-‐term capacity markets that is, for capacity that is to be available more than a few years from the present because buyers have the ability to build (or subscribe to) new capacity in this longer time frame. Consequently, capacity market power evaluation and mitigation occurs only in the conte -‐term capacity markets.
4.2.4. Strengths and Weaknesses of the Price Determination Methods
The main strength of the centralized capacity market price determination processes of the eastern RTOs lies in price transparency and liquidity of the markets. In addition, the downward-‐sloping demand curves used by New York ISO and PJM mitigate the volatility of capacity market clearing prices that are experienced under a vertical demand curve design, which also helps mitigate market power.
The price-‐setting methods of the eastern RTOs have several important weaknesses. First, the assumptions and estimates that underlie the determination of the demand curves are critical to price determination; and yet these assumptions and estimates, including those about the slope of the demand curve and CONE, have often been controversial. Moreover, some of the controversial estimates must be revised regularly, leading to regular repetition of the controversies. The controversies can be keen because the assumptions and estimates can have significant effects on the amounts of capacity procured and the prices of capacity.
Second, the physical and design characteristics of the eastern them prone to exercises of market power. This susceptibility to market power arises from the physical limits that transmission places on capacity deliverability among zones and the steepness of the demand curves.
Third, in addition to fostering market power, transmission deliverability issues lead to zonal capacity markets of relatively small size, which decreases liquidity and increases the volatility of the zonal capacity prices. Furthermore, power system configurations change over time, even from year to year; so that the definitions of capacity zones must change over time. The consequence of the decreased liquidity, increased volatility, and shifting zonal definitions is to increase the uncertainty about future capacity prices and thereby increase the cost of capacity investment.
Fourth, the eastern RTOs try to treat heterogeneous resources as a homogeneous product. Consequently, they struggle, with limited success, to find ways to give comparable treatment to resources (e.g., fossil-‐fuel versus intermittent versus demand-‐side, existing versus planned, unlimited dispatchability versus limited dispatchability versus no dispatchability, flexible versus inflexible) that have very different operating and availability characteristics.
Fifth, ed capacity markets make unrealistic assumptions about the relationship of capacity prices to capacity cost. The basic assumption is that the capacity prices should generally reflect the levelized cost of pure peaking capacity, which is why CONE is
29
defined as the levelized annualized capacity cost of a new peaking plant. In addition to the various problems with the ways that CONE is quantified and annualized, however, there is little or no reason for anyone to offer capacity to the market at CONE or even at their own levelized annualized cost. Existing resources will always offer capacity at their opportunity cost of remaining in service, which is zero for most plants and a low figure for most of the rest. New resources will offer capacity at prices that depend upon their forecasts of market conditions over their whole lives, without the unrealistic assumption (explicit in levelization) that they must recover the same amount of capacity cost in every year. In the words of one prominent advocate of capacity markets,
unit are vastly more important that the clearing price in the initial year in which y
governed by either expectations of future capacity prices beyond the initial auction or on a bilateral forward capacity contract that locks in a number of
years equal to $90 per kW-‐Year. It is unlikely that the new resource would be offered in a forward procurement market at close to $90 per kW-‐Year. If the investor has already made the decision to enter based on its projections of capacity prices over the next 30 years or the fact that it has signed a long-‐term bilateral contract, then the investor would likely submit offers well below $90 per kW-‐Year to ensure its offer clears. If the investor has not already made the decision to enter and expects that capacity prices are likely to fluctuate below $90 per kW-‐Year over the next 30 years (as surplus capacity levels rise and fall), then the investor would likely submit its offer at a price much higher than $90 per kW-‐Year.54
But in spite of the fact that no resource can reasonably be expected to base its offer price on -‐
side market power mitigation are both based upon CONE.
4.3. Traditionally Regulated Regions In traditionally regulated regions, resource requirements are determined by a combination of NERC, the relevant regional reliability entities, federal and state requirements, and utilities implementation of good utility practices. Each LSE (possibly in the context of a state proceeding) forecasts its resources and loads and determines whether it needs additional resources to meet it capacity obligation or whether it has excess resources to offer to other parties. If it needs additional resources, it either invests in generation capacity on its own, invests in joint ownership arrangements with other LSEs, enters into competitively determined
54 Post-‐Technical Conference Comments of Potomac Economics Ltd. New York ISO Market Monitoring Unit, Centralized Capacity Markets in Regional Transmission Organizations and Independent System Operators, before the Federal Energy Regulatory Commission, Docket No. AD13-‐7-‐000, January 8, 2014, p. 19.
30
bilateral contracts to purchase the output of capacity from other parties, or undertakes some combination of the foregoing options.
The options, which will also include consideration of fuel mix, capacity lumpiness, expected rate of load growth, and a host of other factors including regulatory policy (such as those regarding competitive bidding requirements, renewable resources and environmental regulations).
option is pursued, the utility typically issues a request for proposals to supply the needed incremental capacity, which also typically includes energy. Contract length can vary from only a couple of years to very long term (e.g., 20 years). Bids from interested suppliers are evaluated on terms that go beyond price, including deliverability, generator characteristics, and technology type. Thus acquisition of capacity in bilateral markets is subject to competition, and the prices of capacity in bilateral markets are determined by a competitive process.
The main strengths of capacity price determination in traditionally regulated regions are that prices depend upon the real demands of buyers and upon the actually available supplies of sellers, and that prices are determined through a competitive process, albeit often scrutinized by state utility regulators. These capacity prices reflect real market value. Because the capacity markets in traditionally regulated regions are not limited to a homogeneous capacity product, buyers and sellers can take into account the particular operational and other characteristics of the particular resources involved; and the capacity price can reflect those characteristics.
The main weakness of the price-‐setting process in traditionally regulated regions is that prices are not transparent, so it is possible that the most efficient capacity trades are sometimes unrecognized. Related to the lack of transparency is a relative lack of liquidity, which can cause prices to be volatile. The impacts of volatility on customers are muted, however, since the volatility affects only incremental capacity needs while
5. RESOURCE OUTCOMES
How well has each capacity market approach done at assuring reliability at least cost? Are there significant differences among the approaches in their reliability outcomes? Are there significant differences among the approaches in their costs?
This section assesses resource outcomes primarily in terms of reliability outcomes, reliability indicators (like reserve margins), achievement of public policy goals (like expansion of renewable resources), capacity prices, and consumer costs.
5.1. Reliability Power system reliability is measured by the MWh magnitude, the geographic extent, and the time duration of customer service outages. In principle, reliability should be the gold standard for judging resource outcomes: adequate resources should result in relatively reliable power systems, while inadequate resources should result in relatively unreliable power systems. In practice, however, the overwhelming majority of customer service outages are due to failure of local, low-‐voltage distribution systems, usually caused by adverse weather conditions; and most
31
of the remaining outages are caused by bulk power transmission failures. By contrast, our concern in this report is with those outages that occur at the transmission level due to insufficient capacity resources, which are a tiny percentage of all outages experienced by customers.
Unfortunately, it is not possible to easily separate outages due to insufficient capacity resources from those due to other causes. While transmission failures due to lightning or trees are among these other causes, system operator error is the most common cause. Operator errors include:
overestimation of generator availability;
inability to visualize events over the entire power system;
failure to ensure that system operation was within safe limits;
lack of coordination on system protection;
ineffective communication between system operators and resource operators;
inadequate training of personnel.
Consider, for example, the following major North American outages of the past half century:55
November 9, 1965, Northeastern U.S. System operators lacked adequate information about system conditions, and were unaware of the operating set point of the relay that started the cascading outages.
July 13, 1977, New York City. Lightning struck and tripped out two transmission lines on a common tower, and separated New York City from the surrounding power systems. A bent contact on a relay contributed to the collapse.
December 22, 1982, West Coast. High winds knocked over a transmission tower, which fell onto an adjacent tower, taking out of service the two transmission lines held up by the two towers. Contingency planning failed to consider the power flows caused by this event. A control signal was delayed by a communications failure. System operators lacked sufficient information to identify appropriate action.
July 2-‐3, 1996, West Coast. Due to a vegetation maintenance failure, a sagging transmission line contacted a tree and tripped out. A protective relay on a parallel line incorrectly tripped out.
August 10, 1996, West Coast. Due to high temperatures, three transmission lines sagged, contacted untrimmed trees, and trip out. Because of insufficient contingency
55 JTF 031119 Report, Chapter 6.
32
planning, system operators were unaware, for the next hour, that the system was in an insecure state.
June 25, 1998, Ontario and North Central U.S. Lightning struck and tripped out two 345-‐kV transmission lines, which led to overloading of lower-‐voltage lines. Relays took these lower-‐voltage lines out of service. This cascading removal of lines from service eventually separated the entire northern MAPP Region was separated from the Eastern Interconnection.
July 1999, Northeastern U.S. resulting in a loads exceeding available resources.
August 14, 2003, Northeastern U.S and Ontario. Beginning with a vegetation maintenance failure, MISO system operators were literally out to lunch. They lacked adequate system information, failed to operate the system within secure limits, failed to identify emergency conditions, failed to communicate with neighboring systems, lacked sufficient regional and interregional visibility of the power system, had a dysfunctional SCADA/EMS system, lacked adequate backup for their SCADA/EMS system, and suffered inadequate operator training.
September 8, 2011, Southern California. A 500-‐kilovolt east-‐west transmission line in California, the Hassayampa-‐North Gila line, failed because a technician skipped several steps as he tried to isolate some transmission equipment for testing. His actions led to a
operators had been trained to intentionally cut off some areas to prevent a cascade. As with the Eastern blackout in 2003, however, system operators had poor knowledge of what was happening in neighboring systems, which prevented them from taking proper action until it was too late.56
Thus, with the exception of the 1999 Northeast blackout, the major North American outages of the past half century have not been due to inadequate resources. Consequently, reliability statistics reveal little about resource adequacy.
5.2. Resource Additions and Reserves The most relevant measure of resource adequacy is arguably reserve margins, which are the amounts by which resources exceed loads. The patterns of resource additions over time directly affect reserve margins and indicate whether investment has been sufficient and will be sufficient to maintain reserve margins. Consequently, this section presents statistics on capacity additions and reserve margins.
56 FERC and NERC Staffs, Arizona-‐Southern California Outages on September 8, 2011, Causes and Recommendations, April 2012.
33
5.2.1. Overview of U.S. Capacity Resources
Figure 5 shows how total resources (including generation and demand-‐side resources), total annual peak loads, and reserve margins have changed (and are projected to change) for the entire U.S. over the period 2002-‐2017. The figure looks at summer peaks rather than winter peaks because, for the U.S. as a whole, summer peaks are about 8% higher than winter peaks; so summer reliability issues tend to be more critical than winter reliability issues.57 The figure shows that the U.S. summer resource capacity has exceeded net internal demand by approximately 15% or more over the last 12 years and is projected to continue that relationship through at least 2017.
Resource additions and reserve margins are the consequence of many factors, of which market design is only one. Other major factors include, for example, regulatory rules, legal requirements for renewable resources, fuel prices, and general economic conditions. Nonetheless, this section looks at traditionally regulated regions separately from RTO regions in an effort to see if different market structures lead to any obvious differences in resource addition or reserve margin outcomes.
57 Perhaps the one exception to that has been the most recent 2013/2014 winter, which was characterized by the
of this report.
34
Figure 5 Resources, Peak Loads, and Reserve Margins for the U.S., Summer 2002-‐201758
5.2.2. Traditionally Regulated Regions with Vertically Integrated Utilities
Figure 6 shows summer peak reserve margins for three traditionally regulated regions, namely Florida (FRCC), the southeastern U.S. (SERC), and the western interconnection excluding California (WECC). Years through 2012 are actual historical results, while years beginning in
s
above the 10% level. In all cases, the reserve margins do not reflect demand-‐side capacity.
58 U.S. Energy Information Administration, Form EIA-‐411, Coordinated Bulk Power Supply and Demand Program Reportcapacity margins, 2001-‐2011 actual, 2012-‐ -‐411). planned by the electric power industry`s reliability authority and is equal to Internal Demand less Direct Control
-‐ and non-‐utility-‐owned generating capacity that exists (as part of the historical record) or is in various stages of planning or construction (as part of the project capacity), less inoperable capacity, plus planned capacity purchases from other resources,
power system at peak load as a percentage of capacity resources. These definitions apply to all subsequent figures. The Summer peak period is defined to begin on June 1 and extends through September 30.
Figure 6 Summer Peak Reserve Margins (%) of Non-‐RTO Regions59
In FRCC, reserve margins bounced around throughout most of the past decade, hit a low of 6% in 2009, and have been (and are projected to be) in the 14% to 27% range since 2010. The low reserves occurred in 2009 because, in spite of the 2008-‐2009 financial crisis, FRCC loads hit a high in that year at the same time that there happened to be resource retirements. The stability of reserve margins from 2011 onward reflects the actual and forecast stability of total capacity and peak loads beginning in 2011.
In SERC, reserve margins were in the 10% to 16% range through 2008. Since the onset of the financial crisis of 2008-‐2009, reserve margins have been (and are projected to be) of 20% to 35%. -‐2009 was consistently over 186 GW, but has been (and is forecast to be) only about 160 GW from 2010
ments reduced capacity by 20%, with future capacity forecast to be flat.
In WECC (excluding California), reserve margins generally have been maintained at or above the NERC reference level with the exception of 2012, when capacity reached its low point while peak load jumped 9%. The recent and forecast jump in reserve margins is due largely to an
59 WECC data are obtained from Energy Information AdminiCapacity Resources, and Capacity Margins by North American Electric Reliability Assessment Areas 2002-‐2012,
by North American Electric Reliability Corporation Assessment Areas, 2012 Actual, 2013-‐http://www.eia.gov/electricity/annual/. The original source is Form EIA-‐411. Projected reserve margins for FRCC and SERC were obtained from North American Electric Reliability Corporation, 2013 Long-‐Term Resource Assessment, December 2013.
expected 35 GW increase in supply-‐side capacity, split about evenly between gas-‐fired, wind, and solar generation.
5.2.3. Centralized Markets of Regional Transmission Operators
Figure 7 shows that the RTOs shared a common reserve margin trend up until the wake of the financial crisis of 2008-‐2009, since which time their paths have diverged. The RTOs generally had excess reserves in 2002 that were left over from the investment binge of the late 1990s, when electricity industry deregulation gave investors some of the irrational exuberance for generation investments as they had for stock market investments. Rising loads in California, ERCOT, and SPP helped to bring down their reserve margins in the years through 2006, while their capacity was basically flat. The years 2006-‐2009 saw rising reserve margins as loads generally declined (with Texas being the exception) while capacity was flat to rising.
that are best explained by looking at each RTO.
In California, since the shortages of the 2000-‐2001 crisis, reserve margins generally have been
to remain well above the target over the next four years. A significant driver in the increase in reserve margin over
by 2020. On the other hand, environmental restrictions on once-‐through cooled generation60 are expected to force retirement of about 13,000 MW of older capacity by 2020. Another major reduction in non-‐renewable resource capacity will occur later this decade with the retirement of the 2,100 MW San Onofre nuclear plant. The combination of these factors is forecast to reduce reserves in 2017 and beyond.
To deal with retirements as well as the reliability and resource adequacy issues that will accompany the substantial growth of intermittent generation, the California ISO proposed a special compensation mechanism for critical generation resources that might otherwise retire.
-‐of-‐et-‐based
mechanism to achieve its resource adequacy goals.61
60 Once-‐through cooled generation uses water's cooling capacity only a single time before discharging the water as waste. It thus withdraws and promptly returns large volumes of warmed water. 61 Federal Energy Regulatory Commission, Order On Tariff Revisions, 142 FERC ¶ 61,248, Docket No. ER13-‐550-‐000, March 29, 2013.
37
Figure 7 Summer Peak Reserve Margins (%) of RTO Regions62
In ERCOT, reserve margins have been eroding since 2002, when they were well above 25%. Reserve margins are expected to remain well below the NERC target reference level of 13.75% for the next several years. According to NERC:
The depleting Reserve Margin in ERCOT is due to generation resource additions not having kept pace with the higher than normal load growth experienced in recent years. The generation market in ERCOT is unregulated and generators
62 Historical reserve margins for ERCOT, MISO, PJM, and SPP were obtained from Energy Information
American Electric Reliability Assessment Areas 2002-‐ http://www.eia.gov/electricity/annual/.
American Electric Reliability Corporation, 2013 Long-‐Term Reliability Assessment, December 2013, pp. 20, 123,
http://www.caiso.com/Documents/CaliforniaISOPeakLoadHistory.pdf. California ISO capacity for 2005-‐2013 is
https://www.caiso.com/planning/Pages/ReportsBulletins/Default.aspx. California ISO projected reserve margins for 2014-‐2017 are from California Public Utility Commission, CPUC Briefing Paper: A Review of Current Issues with Long-‐Term Resource Adequacy, February 20, 2013, Appendix B: 2012 LTPP Base Scenario (2012-‐2022), obtained at http://docs.cpuc.ca.gov/PublishedDocs/Published/G000/M040/K642/40642804.PDF. Historical reserve margins for ISO New England are based on ISO New England, 2013 CELT Report, obtained at http://www.iso-‐ne.com/trans/celt/report/from North American Electric Reliability Corporation, 2013 Long-‐Term Reliability Assessment, p. 91. Historical
reserve Reliability Corporation, 2013 Long-‐Term Reliability Assessment, December 2013, p. 101.
make resource decisions based on market dynamics. Generation investors state that a combination of lack of long-‐term contracting with buyers, low market heat rates, and low gas prices are hindering decisions to build new generation. For its part, the PUCT and ERCOT are working through to study, and facilitate revisions to, market protocols and pricing rules to bolster the reserve margin. To incent new generator construction, improvements such as increases in system-‐wide Energy Offer caps, rising of Energy Offer floors, and adjustments to Emergency Response Service to include distributed generator participation, are among the results so far. Several proposed initiatives focus on DR resources, such as revising market rules to stimulate greater participation of weather-‐sensitive loads in the Emergency Response Service program. The PUCT has directed ERCOT to draft rules for incorporation of an interim energy market funding solution called the Operating Reserve Demand Curve (ORDC). The PUCT will continue efforts regarding possible setting of a mandated reserve margin level in the ERCOT region.63
In New England, reserve margins have consistently exceeded the target of 15% over the past decade, and are expected to fall to the target level by 2017. The forecast for 2017 appears to be a statistical quirk, however, due to exclusion of Capacity Supply Obligations (CSOs) in ISO
will likely remain in the neighborhood of 20%.
In MISO, there is forecast to be a dramatic decline in reserve margins for MISO from 23% in 2010 down to 6.3% in 2017, well below the target level of 14.2%. Peak demand has already fallen and is forecast to remain relatively flat over the next several years, while capacity has fallen more sharply as generating plant is retired, particularly in response to new environmental rules. According to NERC:
plans of its membership, Planning Reserve Margins will erode over the course of the next couple of years and will not meet the 14.2 percent requirement. The impacts of environmental regulations and economic factors contribute to a potential shortfall of 6,750 MW, or a 7.0 percent Anticipated Reserve Margin by summer 2016. Accordingly, existing-‐certain resources are projected to be reduced by 10,382 MW due to retirement and suspended operation.64
In New York, just over half of the investment during the period 2000-‐2012 occurred in the three years 2004 2006. Since 2002, reserve margins have generally remained above the NERC
margin target is 17% (set by the NYSRC) and the forecast indicates the region will exceed that
63 North American Electric Reliability Corporation, 2013 Long-‐Term Resource Assessment, December 2013, p. 150. Note that low market heat rates and low gas prices lead to low prices for electrical energy. 64 North American Electric Reliability Corporation, 2013 Long-‐Term Resource Assessment, December 2013, p. 54.
39
target through at least 2017. The stable reserve margins projected over the next few years are due to moderate expected growth in peak load coupled with few planned generator retirements. However, retirement of the Indian Point Nuclear Power Plant, in 2015 or
In PJM, reserve margins have generally held 15.5%, but are projected to decline below this level after 2014. With peak demand growth expected at just over 1% per year and demand-‐side management resource capacity expected to remain fairly constant, the principal driver of the decay in reserve margins is the significant retirement of fossil-‐fired generation 13,000 MW (or about 7% of the existing capacity) composed of 9,700 MW of coal plants, 2,000 MW of gas-‐fired plants, and 1,300 MW of oil-‐fired generation.65
In SPP, reserve margins during the mid-‐2000s dropped below the planning reserve target of 13.6%, but since have climbed to acceptable levels, rising abruptly in 2012 to 27%reserve margins are expected to remain above the NERC reference target for the foreseeable future as a result of moderate load growth and a modest 400 MW of retirements.66
5.2.4. Summary of Findings
Baseline forecasts usually reflect an assumption that the future world will be normal which it usually is on average, but which it often is not in individual cases. With the exceptions of ERCOT and MISO, whose reserve margins are projected to decline to levels well below the NERC target margins, the NERC regional reliability entities and the RTOs project adequate reserve margins for the foreseeable future. However, reserve margins in all regions are projected to decline over the next decade, primarily because the capacity of the large number of retirements of coal-‐fired plants will exceed the capacity of the new plants (gas-‐fired and renewable for the most part) coming into service.
5.3. Resource Mix
The mix of capacity resources can have major impacts on power system reliability, for several reasons. First, supplies of particular resources can become constrained due to weather conditions, transportation bottlenecks (as happened with natural gas supplies and coal supplies this past winter of 2013-‐2014), or production problems; so over-‐reliance upon a single resource technology can have adverse reliability or cost impacts. Second, demand-‐side capacity resources are an innovation that is not entirely out of the testing stage: in the long run, such resources may or may not prove as reliable as traditional supply-‐side resources. Third, intermittent renewable resources (i.e., wind and solar) pose new challenges for maintaining power system security; and these challenges will grow disproportionately quickly as the market share of these resources grows. 65 North American Electric Reliability Corporation, 2013 Long-‐Term Resource Assessment, December 2013, p. 124. 66 North American Electric Reliability Corporation, 2013 Long-‐Term Resource Assessment, December 2013, p. 143.
40
5.3.1. Overview of the U.S. Resource Capacity Mix
Figure 8 shows how, for the entire U.S., the resource capacity mix has evolved over the period 2000-‐2012 and is forecast to evolve over the period 2013-‐2017. The figure shows that, for the 2000-‐2017 period, coal and gas switch first and second places: coal drops from a 39% market share to a 26% market share, while gas rises from a 27% market share to a 42% market share. The other resource technologies have market shares that are generally 10% or less. The shares of nuclear, hydroelectric, petroleum, and pumped storage all gradually decline over the period, even though all but petroleum have more GWs of capacity in 2017 than in 2000. Meanwhile, the shares of wind and solar, which were near 0% in 2000, rise to 6% and 1%, respectively, in 2017. The overall story, then, is that gas, wind, and solar have been rising stars while petroleum is fading out.
Figure 8 U.S. Resource Mix, Shares of Summer Capacity, 2000-‐201767
The changing market shares reflect changing economics and politics. Coal faces growing and particularly costly environmental restrictions, the uncertainty of greenhouse gas-‐related costs, and well organized environmental opposition, all of which make traditional coal-‐fired investments less attractive. Natural gas, by contrast, has enjoyed technological progress that has substantially increased potential gas supplies and significantly reduced gas costs, thus
67 generating capacity additions from new generators, by energy source, 2011-‐
ricity/data.cfm#gencapacity.
0%
5%
10%
15%
20%
25%
30%
35%
40%
45%
2000
2001
2002
2003
2004
2005
2006
2007
2008
2009
2010
2011
2012
2013
2014
2015
2016
2017
Natural Gas
Coal
Nuclear
Hydroelectric
Wind
Petroleum
Pumped Storage
Solar
Other
41
making gas-‐fired investments more attractive.68 Petroleum has continued its long-‐term decline as oil-‐fired generation is generally replaced by cheaper and cleaner gas-‐fired generation. The progress made by wind and solar resources has partly been due to technological improvements that have reduced their costs but has mostly been due to substantial subsidies.69
5.3.2. Overview of Regional Capacity Resources
Figure 9 illustrates the fuel mix across the regions of the U.S. in 2011. The central (Mountain, West North Central, East North Central, South Atlantic, East South Central) and southeastern regions rely heavily on coal, whereas the northeastern regions (New England and Middle Atlantic) rely more heavily on a combination of nuclear and natural gas. The West South Central region relies heavily on a combination of coal and natural gas, while hydro and natural gas dominate in the Pacific Contiguous region.
Despite the abundance of coal and natural gas resources in the U.S., the fuel diversity displayed in Figure 9 dramatic shift, spurred by low natural gas prices and a suite of new environmental regulations that are particularly adverse to coal use. This shift is expected to occur largely over the next five to seven years as natural gas prices are expected to remain low and recent environmental regulations are likely to accelerate the retirement of a significant portion -‐fired power plants. In addition, pending regulations would prohibit the construction of new coal-‐fired power plants that do not have carbon capture and sequestration capabilities, effectively phasing out the use of new coal generation as a future resource in the United States.70
5.3.3. Renewable Energy Resources
Because of their relatively high costs, wind, solar, geothermal, and biomass resource investments have been heavily dependent upon public policy, particularly federal and state income tax subsidies and renewable portfolio mandates. As the subsidies have grown and (particularly) as the mandates have become more stringent, investment in these technologies has increased. Since 2000, this investment has been substantial and been concentrated on wind power. Renewable energy capacity grew at a 4.8% per annum compound rate from 2000 through 2012, nearly doubling during the period. In 2012, renewable power resources provided 56% of generating capacity additions, and constituted 14% of U.S. installed capacity 68 The abundance of natural gas in the U.S. has created a strong lobby for increasing U.S. natural gas exports, which would be profitable due to high overseas natural gas prices and could improve the energy security of U.S. allies. Significant export of natural gas would put upward pressure on gas prices in the U.S. and could eventually make investment in gas-‐based capacity less economic. 69 Section 5.6 reviews the cost trends that influence the resource mix. 70 U.S. Environmental Protection Agency, Standards of Performance for Greenhouse Gas Emissions for New Stationary Sources: Electric Utility Generating Units, Notice of Proposed Rulemaking, 77 Fed. Reg. 22,392, April 13, 2012.
42
and 12% of generated electrical energy. Of the renewable resource generation in 2012, 55% was hydroelectric, 28% was wind, 11% was biomass, and solar and geothermal provided 3% each.71 While wind, biomass, and geothermal generation will continue to grow, solar power is projected to have the largest future growth, in percentage terms, between now and 2040.
Figure 9 U.S. Regional Fuel Diversity, 201172
The leading states for solar power investments (photovoltaic (PV) and concentrating solar power (CSP)) are mostly in the southwestern and southern states that have the best solar exposure. Similarly, the leading states for geothermal and hydroelectric resources tend to be those with the best geological conditions for these resources. But these are merely tendencies. What particularly drives the locations of investments are the public policies that support renewable power.73 Not surprisingly, the ten states with the largest amounts of installed
71 U.S. Department of Energy, Renewable Energy and Energy Efficiency, 2012 Renewable Energy Data Book, October 2013, pp. 17-‐18, http://www.nrel.gov/docs/fy14osti/60197.pdf. 72 U.S. House of Representatives, The Committee on Energy and Commerce, Memorandum, Subcommittee On Energy and Power Hearing, March 4, 2013, Appendix, p. 4. 73 U.S. Department of Energy, Renewable Energy and Energy Efficiency, 2012 Renewable Energy Data Book, October 2013, p. 31. Original sources: EIA, GEA, LBNL, SEIA/GTM, Larry Sherwood/IREC.
renewable capacity in 2012 are also states with renewable portfolio standards that mandate large amounts of installed renewable capacity by 2016. Table 2 lists these states, which together had about 61% of the total RE capacity in the country in 2012. Aside from Texas, the top five states rank high because of their significant hydro capacity. Texas, by contrast, rates high because of its huge investment in wind and solar, which can be attributed largely to the
.
Table 2 Relationships Between RPS Requirements and Renewable Investment
Top Ten Renewable Resource States in 2012, by Total RE74
State 2011 Installed Capacity RE Target Intermediate
Target 2012 Installed
RE Total
% of Installed Capacity
2012 Installed Wind + PV
% of Installed Capacity
WA 30,507 15% by 2020 3% by 2012 24,342 80% 2,827 9%
CA 68,295 33% by 2020 20% by 2014 22,508 33% 8,102 12%
TX 109,179 5,880 MW by 2015 (8.8% of 2012 Peak) 5256 MW by 2013 13,517 12% 12,354 11%
OR 14,535 Large Utils -‐ 25% by 2025; Small Utils -‐ 10%; Smallest Utils -‐ 5% 5% by 2011 11,845 81% 3210 22%
NY 39,629 Overall target of 7% of incremental MWh by 2015 (equivalent to about
0.5673 of total load) No interim goals 7,003 18% 1818 5%
IA 15,288 105 MW fixed (1.3% of 2012 Peak) No interim goals 5,280 35% 5,134 34%
AZ 27,043 10.55% by 2025 No interim goals 4,108 15% 1,345 5%
OK 21,824 15% by 2015 No interim goals 3,699 17% 2,998 14%
Al 32,577 No explicit RPS No interim goals 3,917 11% 1 < 1%
IL 43,830 25% by 2025 6% by 2012 3,803 9% 3,611 8%
Wind power has become a large share of RE, and the rankings in Table 2 reflect the rise of wind power. Back in 2000, when total U.S. wind capacity was only 2,578 MW, California had nearly two-‐thirds of the capacity. In 2012, when capacity was about 60,000 MW, Texas had taken the top spot and wind capacity was much more evenly spread among states. The southeastern U.S. is nearly devoid of wind resources, which is partly a reflection of the relatively poor wind conditions in that part of the country.75 Iowa and Illinois now appear in the top five states ranked on total installed wind and PV capacity, which is a reflection of the relatively good
74 Installed cap
http://www.eia.gov/electricity/data.cfm#gencapacity. RE Target and Intermediate Target information are from Database of State Incentives for Renewable Energy (DESIRE), obtained at http://www.dsireusa.org/. RE capacity data are from U.S. Department of Energy, Energy Efficiency & Renewable Energy, 2012 Renewable Energy Data Book, http://www.nrel.gov/docs/fy14osti/60197.pdf. 75 American Wind Energy Association, AWEA U.S. Wind Industry Third Quarter 2013 Market Report, October 31, 2013, p. 5.
conditions for location of wind installations. The top ten states possess about 69% of wind and solar capacity in the country.
Washington, Oregon, and California are all among the top five RE states because of their significant hydro capacity. Alabama likewise makes it into the top ten for overall RE because of its abundant hydro capacity, though it would rank among the bottom of the states on the basis of its wind and solar capacity.
5.3.4. Demand-‐Side Resources
Figure 10 summarizes the actual peak load reductions achieved through energy efficiency measures and load management over the period 2002 to 2012. During this eleven year period, peak load reductions achieved through demand-‐side management programs have nearly doubled, with energy efficiency growing at an 8.0% annual rate and load management growing at a 3.6% annual rate. These demand side resources were 2.5% of supply-‐side capacity in 2002 and 4.0% of supply-‐side capacity in 2012.
Figure 10 provides a projection of peak load reductions due to demand-‐side management programs over the period 2012 to 2023. The growth rates of demand resources are projected to fall to a 3.6% annual rate for energy efficiency and a 2.3% annual rate for load management. Nonetheless, this NERC projection has energy efficiency and load management programs together accounting for nearly 15% of non-‐coincident total internal demand for the peak summer season of 2023.
45
Figure 10 Estimated Demand-‐Side Management Load Reductions by Program Type, 2002-‐201276
Figure 11 Projected Demand-‐Side Management Load Reductions by Program Type, 2012-‐202377
76 Energy Information Administration, Electric Power Annual, 2012, Table 10.1, Demand-‐Side Management Annual Effects by Program Category, 2002 to 2012, obtained at http://www.eia.gov/electricity/annual/. 77 Projections based on NERC, 2013 Long-‐Term Resource Assessment, pp. 8-‐9. NERC projects that available energy efficiency will increase by 11.9 GW and load management will increase by 3.3 GW between 2014 and 2023. This translates to a compound annual growth rates of 3% for energy efficiency and 2% for load management.
In the eastern RTO capacity market auctions, large quantities of demand-‐side resources have been offered and cleared In PJM, for example, about one-‐third of new capacity obtained through its Base Residual Auctions has been from demand-‐side resources.
Unfortunately, in at least some RTO markets, demand-‐side resources provide a lower quality of capacity than do supply-‐side resources. Andy Ott of PJM explains the limitations of the demand-‐side resources available to PJM:
-‐hour notice requirements and emergency-‐only status[,] resulting in over 12,000 MW of demand response-‐based capacity resources having very similar operational characteristics. PJM has
generation and demand response given the notice requirements and emergency-‐only status of most of the demand response resources. These significant
sicPJM operators in preventing the triggering of emergency conditions and then responding to emergency conditions once they have materialized. Unfortunately, to date, those demand response resources do not offer more diverse operational characteristics even though they are physically capable of doing so. PJM believes demand response resources can be available in a manner largely comparable to generation and that market rules should be adapted to provide the necessary incentives.78
FERC has recently approved a cap on the quantity of capacity procured from demand response that has limited availability.79 PJM requested the procurement cap because it believes that substituting limited-‐availability demand response for higher-‐availability resources has suppressed auction clearing prices and has impeded its ability to procure capacity to ensure grid reliability.
The plain implications are that the security value of demand-‐side resources can be less than that of supply-‐side resources, and that more costly incentives may be required to get performance from demand-‐side resources than are needed to get similar performance from supply-‐side resources.
Furthermore, there is some question about the durability of demand-‐side resources. For example, some entities that offered demand-‐side resources in ISO New Englacapacity auction did not continue to offer part of that capacity in subsequent auctions. Instead, they ultimately purchased supply-‐side capacity to cover about a quarter of their capacity 78 Statement Of Andrew Ott, Executive Vice President Markets, PJM Interconnection, L.L.C., Centralized Capacity Markets in Regional Transmission Organizations and Independent System Operators, before the Federal Energy Regulatory Commission, Docket No. AD13-‐7-‐000, September 9, 2013. 79 FERC, 146 FERC ¶ 61,052, Order on Proposed Tariff Changes, Docket No. ER14-‐504-‐000, January 30, 2014.
47
commitments for the 2013/14 Commitment Period. If demand-‐side resources do not possess longevity comparable to that of supply-‐side resources, they are not as reliable or as valuable as supply-‐side resources.
5.3.5. Summary
Table 3 and Table 4 show the fuel mixes of each of the regions in 2011. The tables show that coal is still king in the -‐rich old industrial regions (MRO, RFC, MISO, and PJM), while natural gas is the technology of choice elsewhere in the country. The second and third ranking fuel choices vary regionally and across the RTOs based on the advantages afforded a particular fuel and technology by virtue of geographic endowments or proximity to fuel sources. For example, hydro places second in CAISO and WECC (which have substantial and ubiquitous elevation drops), and wind ranks third in MRO and ERCOT (which have the best conditions for wind production). Nuclear continues to have a strong presence in three reliability regions NPCC, RFC, and SERC, which include ISO NE, MISO, New York ISO, and PJM. Petroleum has a significant market share only in the old industrial states of the northeast (NPCC, including ISO NE and New York ISO). Solar has yet to make any significant gains in any region of the country but Florida.
Figure 12 and Figure 13 summarize net summer generation capacity in 2000 and 2012 by fuel types for the non-‐RTO regions compared to the RTOs. The figures show the change over the past decade in the degree of penetration of renewables (solar thermal and PV and wind), as well as shifts (generally reductions) in reliance on more traditional fuels such as coal and natural gas. The wind output in the central and west central regions of the country (served by ERCOT, MISO, SPP, and non-‐RTO states) is part of what is driving the significant expansion of the transmission grid that will enable that output to be transported to the eastern load pockets.
Table 3 Fuel Mixes of the Regional Reliability Organization Regions, 201280
80 Derived from U.S. Energy Information Administration, Form EIA-‐860 for 2012 Final, Release Date October 10, 2013, obtained at http://www.eia.gov/electricity/data/eia860/. Texas Reliability Entity and Southwest Power Pool Regional Entity are not presented because of the significant intersection with ERCOT and SWPP as RTOs presented in Table 4.
Fuel Type CA ISO ERCOT ISO NE MISO NY ISO PJM SPP Coal 0.5% 21.1% 7.2% 45.2% 6.8% 40.7% 31.6% Hydro 19.6% 0.6% 10.5% 4.4% 14.5% 5.1% 3.2% Natural or Other Gas 58.8% 61.3% 40.4% 28.0% 47.2% 29.9% 49.5% Nuclear 6.2% 4.5% 13.2% 10.6% 13.3% 13.8% 6.6% Petroleum 0.3% 0.5% 19.0% 2.5% 10.7% 6.4% 2.4% Solar 1.6% 0.1% 0.1% 0.0% 0.1% 0.2% 0.1% Wind 7.7% 11.1% 2.2% 8.5% 4.1% 1.6% 5.6% Other 5.2% 0.8% 7.3% 0.7% 3.2% 2.3% 0.9%
For non-‐RTO regions of the country, coal capacity has not changed over the past decade; but its share has declined significantly and is now second in importance to gas-‐fired capacity. Solar technology has not entered the fuel mix in non-‐RTO regions, but wind has now a small but significant presence.
81 Derived from U.S. Energy Information Administration, Form EIA-‐860 for 2012 Final, Release Date October 10, 2013, obtained at http://www.eia.gov/electricity/data/eia860/ .
Figure 12 Net Summer Generating Capacity (MW) by Non-‐RTO and RTO Regions, 200082
Figure 13 Net Summer Generating Capacity (MW) by Non-‐RTO and RTO Regions, 201283
82 Energy Information Administration, Existing capacity by energy source, by producer, by state back to 2000 obtained at http://www.eia.gov/electricity/data.cfm, Original source: Form EIA-‐860, Annual Electric Generator Report, 2000. 83 Derived from U.S. Energy Information Administration, Form EIA-‐860 for 2012 Final, Release Date October 10, 2013, obtained at http://www.eia.gov/electricity/data/eia860/.
-‐
20,000
40,000
60,000
80,000
100,000
120,000
Reg Non-‐RTO
CA ISO ERCOT ISONE MISO NYISO PJM SPP
Coal Geo Hydro NGNuke Other Otr Bio Otr GasPetrol Pumped Strg Solar Thm & PV WindWood
0
20,000
40,000
60,000
80,000
100,000
120,000
Reg Non-‐RTO
CA ISO ERCOT ISONE MISO NYISO PJM SPP
Coal Geo Hydro NGNuke Other Otr Bio Otr GasPetrol Pumped Strg Solar Thm & PV Wind
In nearly every RTO region, gas-‐fired generation capacity has at least doubled over the past decade. The effect of a combination of state renewable portfolio standards and geographical advantages have allowed wind capacity to increase from almost nothing in 2000 to relative significance in 2011 in all RTO regions outside of the northeast.
5.4. Net Revenue Analysis To assess the market incentives for capacity investments, several RTOs estimate the profits that would have been earned in their markets by certain generation technologies. Specifically, the
each tech net revenues that is, the amount by which a energy and ancillary services can be expected to exceed
its variable production costs. (including retu
market revenues.
In principle, it is economic for net revenues to be deficient persistently when the market has surplus capacity because, in such a situation, the price mechanism should not signal a need for additional capacity. It is also economic for net revenues to be excessive persistently when the market is short on capacity because, in such a situation, the price mechanism should signal a need for additional capacity. Net revenue analysis may yield findings that temporarily contradict these principles due to temporary fluctuations in market or economic conditions, such as may occur because of weather or unusually high or low forced outages of resources. If net revenue analysis yields findings that persistently contradict these principles, there is a market design problem.
Table 5 and Table 6 summarize the estimated net revenue for new combustion turbines and combined cycle units in RTOs for each of the years 2005 through 2012. The figures in these tables, which were developed by the RTOs or their independent market monitors, represent the revenues that would have been earned in the energy and ancillary services markets (and in capacity markets, where those exist) by a hypothetical combustion turbine or combined cycle unit operating in each year. The rightmost column presents the PJM Independent Market
levelized (in nominal dollars) over twenty years.84 For both natural gas plant types, net revenues on an RTO-‐wide basis were generally insufficient to cover levelized costs, with the exception of New York in 2005-‐2007 for combined cycle plants. The summer peak reserve margins shown in Figure 7 imply some need for new resource capacity during the boom years of 2005-‐2007; so this insufficiency implies a failure to signal shortages in these years.
84 E as bases for comparison even though the other RTOs estimate
CONE estimates would lead to similar general conclusions about the insufficiency of revenues to support entry.
51
Table 5 Comparison of Net Revenue for Combustion Turbine Gas Plant ($ per MW-‐month)85
Year CAISO ERCOT ISO NE MISO NYISO PJM Levelized Cost
85 The RTOs assume that combustion turbine units have heat rates between 10,250 and 10,500 MMBtu per MWh. See California ISO, 2011 Annual Report on Market Issues & Performance, Department of Market Monitoring, April 2012; California ISO, 2012 Annual Report on Market Issues & Performance, Department of Market Monitoring, April 2013; Potomac Economics Ltd., 2012 State of the Market Report for the ERCOT Wholesale Electricity Market, June 2013, Figures 63 and 64, pp. 76 & 77; The Brattle Group, 2013 Offer Review Trigger Price Study, October 2013; Potomac Economics, 2012 State of the Market Report, for MISO, Figure 6, p. 10; Potomac Economics, New York ISO 2008 State of the Market Report, Figures 10 and 11, pp. 36-‐37; Potomac Economics, New York ISO 2012 State of the Market Report, Figures A-‐14 and A-‐15, p. A-‐22; and Monitoring Analytics, 2008 and 2012 State of the Market Report for PJM, Net Revenue Analysis sections. The New York figures are averages of values for the Hudson Valley and Capital Zones for 2004-‐2007, and averages for the Hudson Valley, Capital, and West Zones for 2008-‐2012. 20-‐year levelized cost figures are from Monitoring Analytics, 2008 and 2012 State of the Market Report for PJM, obtained at http://www.monitoringanalytics.com/reports/PJM_State_of_the_Market/2012.shtml. 86 The RTOs assume that combined cycle units have heat rates between 7,000 and 7,500 MMBtu per MWh. Sources are the same as listed in the preceding footnote.
52
Although the net revenues presented in Table 5 and Table 6 represent overall regional averages, net revenues actually vary by zones within each RTO. Hence, in some RTOs, there are some zones, particularly in metropolitan and industrial regions with relatively high loads, in which net revenues have been high enough to cover levelized costs.87
lity are shaped by many factors and may not depend on
generally not been sufficient to cover levelized costs.
5.5. Price Trends Capacity market prices have been volatile over the past decade and have remained volatile even as some of those RTOs ISO NE, PJM, and New York ISO launched centralized forward capacity markets in the mid-‐2000s. Figure 14 summarizes the capacity market prices for selected zones of the Eastern RTOs over delivery years 2010-‐2016. The selected zones New York City and Long Island zones for the New York ISO and Southwest Mid-‐Atlantic Area Council for PJM are included to illustrate the price separation among capacity markets that can occur when transmission constrains deliverability of capacity among zones. Both MISO and New York ISO , while ISO New England and PJM conduct auctions that set capacity prices for a delivery year from three to five years in the future.
87 For example, in PJM in 2013, a new combined cycle plant would have earned sufficient revenues from the
Nonetheless, a new combustion turbine would not have earned sufficient revenues in 2013 to cover levelized costs in any of the twenty zones.
53
Figure 14 Capacity Market Prices: RTO-‐Wide and Selected Zones ($/MW-‐month)88
5.6. Cost Trends Figure 15 summarizes the levelized cost of energy for selected renewable and conventional generating technologies over the period 2008 to 2013. Costs for 2008-‐2011 are reduced by various tax subsidies, while costs for 2012-‐2013 do not consider such subsidies.
The figure shows that gas combustion turbines have the highest levelized costs, of over $200 per MWh, which occurs because they are used for peaking purposes in relatively few hours of each year. Solar thermal technologies have the second highest costs, of about $150 per MWh, while solar photovoltaic (PV) technologies had the third highest costs until their costs
88 New York ISO prices include Rest of State (ROS), New York City (NYC), and Long Island (LI). PJM prices include RTO and SW Mid-‐Atlantic Area Council. The horizontal axis displays calendar years (on top) and delivery years (on bottom). Prices for New York ISO and MISO correspond to averages based on calendar year, while prices for ISO NE and PJM are based on a twelve-‐month delivery year that straddles two calendar years.
ISO NE NY ISO -‐ ROS NY ISO -‐ NYC NY ISO -‐ LI MISO PJM-‐RTO PJM-‐SWMAAC
54
significantly dropped in 2013 with improvements in utility-‐scale technologies. In favorable locations, utility-‐scale solar technologies are now competitive on a levelized cost basis with IGCC, nuclear, and coal plants, all of which have costs in the neighborhood of $100 per MWh. The least costly technologies, at around $75 per MWh, are gas combined cycle plants and wind turbines.
Note that the solar and wind costs, in addition to benefiting from targeted subsidies, do not include the costs of the backup generation and other services necessary to handle intermittency. Solar and wind capacity may not be available when they are needed most. In addition, levelized costs of intermittent resources and those of conventional technologies, such as combustion turbines, are not comparable unless they are adjusted according to equivalent availability factors.
Figure 15 Levelized Cost of Generation Technologies, 2008-‐2013 (2011 $/MWh)89
Figure 16 shows the capital costs per MW of capacity of selected renewable and conventional generating technologies over the period 2008 to 2013. Nuclear plants are the most expensive,
89 Lazard Ltd., Levelized Cost of Energy Analysis, Version 2 (June 2008) through Version 7 (June 2013), Table Levelized Cost of Energy Comparison. For years 2008 through 2011, reported costs account for subsidies: Production Tax Credit, investment tax credit, and accelerated depreciation where applicable. Costs for 2012 and 2013 are expressed without subsidies. Costs assume a 20-‐ to 40-‐ year economic life, 40% tax rate, and 5-‐ to 40-‐ year tax life. For alternative technologies, the assumed capital structure is 30% debt at 8% interest, 50% tax equity at an 8.5% annual return, and 20% common equity at a 12% annual return. The capital structure for traditional technologies is assumed 60% debt at 8% interest and, 40% equity at a 12% return. Coal and gas prices vary by year. All costs are expressed in 2011 dollars.
0
50
100
150
200
250
300
2008 2009 2010 2011 2012 2013
Gas Combustion Turbine
Solar Thermal
IGCC
Nuclear
Coal
Solar PV
Gas Combined Cycle
Wind
55
rising from $5,900 up to $7,500 per MW during the period. IGCC, coal, and solar thermal plants have an intermediate level of expense, beginning around $3,500 per MW in 2008 and rising in 2013 to $4,300 in the case of solar thermal and to $6,800 in the case of IGCC. The cost of utility-‐scale solar PV fell from $3,100 to $1,900 while the cost of wind varied around $2,000 per MW. Gas combined cycle and gas combustion turbine plants are the least expensive plants, with costs around $1,000 per MW.
The levelized cost for each technology is determined based on an assumption about the capacity factor, which generally corresponds to the high end of its likely utilization
range. For example, the Energy Information Administration (EIA) assumes a 30% percent capacity factor for simple combustion turbines (conventional or advanced technology) that are typically used for peak load duty cycles. In contrast, the duty cycle for intermittent renewable resources such as wind and solar is dependent on the weather or solar cycle and so will not necessarily correspond to operator-‐dispatched duty cycles. Consequently, levelized costs of intermittent resources are not directly comparable to those for other technologies (even when the average annual capacity factor may be similar) and therefore direct comparisons made on the basis of Figure 15 should be made with extreme caution.
56
Figure 16 Capital Costs of Generation Technologies, 2008-‐2013 (2011 $/MW)90
Given their relatively low capital and operating costs, it is apparent why gas combined cycle plants are the technology of choice. The other technologies are attractive for their low costs under special conditions (e.g., solar in sunny climates, gas combustion turbines for peaking purposes), for their environmental benefits (e.g., wind), or for fuel diversity.
5.7. Observations The centralized capacity markets were created to provide resource owners with steady income streams, thereby helping encourage generation investment and delays in generation retirements. Thus far, however, the centralized capacity markets have provided rather volatile income streams, as is evident from the price histories shown in Figure 14; and reasonable questions may be raised about how generators with thirty-‐ to fifty-‐year lives can gain financial solace from capacity markets that look only a few years into the future.
90 Id.
-‐
1,000
2,000
3,000
4,000
5,000
6,000
7,000
8,000
2008 2009 2010 2011 2012 2013
Capital Cost ($/MW)
Solar PV -‐ Thin Techonolgy Solar Thermal Wind Gas Combustion TurbineIGCC Nuclear Coal Gas Combined Cycle
57
Further investment uncertainties arise from the fact that capacity is not a real product: consumers want the energy that capacity provides; and system operators want the operating reserves and other ancillary services that capacity provides; but nobody wants capacity for the mere pleasure of having steel in the ground. In traditional markets, capacity has implicitly been a call option that gives the capacity purchaser the right to obtain electrical energy from the capacity seller under particular circumstances. In the centralized markets, by contrast,
y obligation is determined by the RTO.
Having little anchor in physics or economics, the constructions of capacity market demand curves have been and will continue to be subject to perpetual controversy. When RTOs suddenly change their minds about the extent to which demand-‐side resources can count as capacity, or the extent to which intermittent wind resources can count as capacity, or whether certain capacity will be subject to minimum offer pricing restrictions, or when congestion will change the definitions of capacity pricing zones, capacity prices can change substantially.91 The different ways that RTOs set the capacity demand curves likewise have large impacts on capacity prices. Because definitions of
they will change over time and thereby have a limited ability to offer steady income streams.
5.7.1. Relationships of Market Design to Resource Adequacy
Figure 17 and Figure 18 present forecast summer reserve margins for traditionally regulated and RTO regions, respectively. For each region, the bars indicate NERC forecasts of anticipated planning reserve margins for 2014, 2018, and 2023; and the black horizontal lines indicate
The figures show that planning reserve margins are projected to decline significantly across much of the country between 2014 and 2023, with the largest percentage declines in MISO, ERCOT, SERC-‐E, NPCC-‐NE, SERC-‐W, MRO-‐MAPP, and SERC-‐N. These declines reflect the expectation that large quantities of coal-‐fired capacity will be retired as a result of increasingly more stringent and costly environmental compliance rules. MISO and ERCOT appear to be most affected, with projected planning reserve margins falling below 5%, while SERC-‐E is a close third with projected reserve margins below 10%. There appears to be no section of the country
91 For example, PJM eliminated the Interruptible Load for Reliability (ILR) demand-‐side product effective for the
instead of providing the three-‐year advance commitment required for capacity resources, ILR allowed certification in as little as three months prior to the delivery year. For demand response resources procured under the ILR program to continue to serve as capacity resources after the progr
-‐term demand-‐response resources due to the discontinuance of ILR, short-‐term demand-‐side resources were accommodated by removing 2.5% of the reliability requirement from the demand curve in the BRA for auctions close to the actual delivery year. The movement of significant demand-‐side capacity into the BRA coupled with the reliability requirement reduction led to significant drop in the market prices for capacity in the 2012/2013 BRA and subsequent years.
58
that escapes the impact of retirements and the increasing role played by renewable technologies under state RPS mandates.
Figure 17 Forecast Summer Reserve Margins for Traditionally Regulated Regions92
92 North American Electric Reliability Corporation, 2013 Long-‐Term Reliability Assessment, December 2013, pp. 15-‐17.
-‐10%
0%
10%
20%
30%
40%
50%
60%
2014 2018 2023
59
Figure 18 Forecast Summer Reserve Margins for RTO Regions93
The most striking difference between the traditional and RTO regions is that the traditional regions have higher forecast reserve margins than the RTO regions in all forecast years. The respective simple averages for the three years 2014, 2018, and 2023 are: traditional regions, 31.9%, 25.2%, and 17.2%; RTO regions, 23.8%, 17.4%, and 13.7%. A plausible explanation for this result is that the relatively stable regulated returns on investment in traditionally regulated regions tends to induce ample resource investment in these regions, while competition in the RTO regions tends to induce cost-‐cutting that drives reserve margins to be closer to requirements.
Consistent with this difference in forecast reserve margins and with the similarity in reserve requirements among regions, none of the traditionally regulated regions are forecast to violate reserve requirements in 2014 or 2018, while ERCOT is forecast to violate requirements in both years and MISO is forecast to violate requirements in 2018. Half the traditionally regulated regions and half the RTO regions are forecast to violate requirements in 2023; but because of the conservative assumptions underlying the forecasts, most of these violations are unlikely to occur as there is still ample time to take remedial action. For example, IRP processes in traditionally regulated markets typically project reserves as though no previously uncommitted resource additions will be made even though these IRP processes typically require building or procuring wholesale capacity well in advance of the capacity need.
93 Id.
-‐10%
0%
10%
20%
30%
40%
50%
60%
2014 2018 2023
60
Capacity market design seems to have a modest impact on reserves. A statistical test of the difference between the average reserve margins for traditional and RTO markets finds that these markets differ at the 10% level of significance, with the RTO market average lower than the traditional market average. There is thus some statistical evidence that RTO markets tend to have lower reserve margins than traditional regulated markets, but this does not explain the significant difference between the forecast reserve margins of the two market groups.
5.7.2. Assessment of Resource Diversity Effects
The shift away from coal-‐fired generation to natural gas and renewables may create problems for grid stability and reliability. The intermittency of wind and solar generation will have to be backed by a reasonable combination of baseload, intermediate, and peaking generation and possibly storage, if it becomes cost-‐effective in the future with fast start, load following and ramping characteristics. Public policy that influences long-‐term generation planning must be guided by an appreciation of the benefits of fuel diversity for maintaining a reliable power supply.
This dramatic shift away from the use of coal has significant implications for the diversity of the U.S. electricity generation portfolio, for electricity suppliers, and for their customers. As the U.S.
mix, the need to maintain diversity in the baseload power portfolio is critical.
5.7.3. Long-‐Term Contracting and Generation Investment
Long-‐term bilateral power purchase contracts are crucial to the functioning of electricity markets. They give price stability and certainty to both buyers and sellers, thereby helping manage risk and thereby supporting new resource development. Prudent business practice would have utilities and LSEs procure most of their capacity resources through ownership or bilateral contracts, with short-‐term markets serving as the venue for rectifying inevitable mismatches between resources and obligation. Arbitrage should cause bilateral contract prices to reflect risk-‐adjusted expectations of short-‐term market prices.
In jurisdictions with traditional regulation of electric utilities, which includes states within RTO regions as well as those in non-‐RTO regions, just about all electricity is procured either through self-‐supply or through competitive wholesale market solicitations that result in bilateral arrangements. In restructured regions, the short-‐capacity markets seems far too short in duration (one to three years) to provide new capital-‐intensive capacity with the revenue guarantees necessary to support favorable financing. The eastern RTOs have tried to address this issue by instituting forward locational capacity markets that nonetheless fail to provide the long-‐term assurance of revenues which would be needed to adequately support generation investments.
5.7.4. Natural Gas Deliverability
Power systems increasingly rely on natural gas-‐fired capacity for a number of reasons, including low gas prices. This increase has exposed power systems and LSEs in much of the country to
61
the risk that sufficient gas may not be available to meet power system needs during periods of very high seasonal demand, under other stressed system conditions, or when facing contingencies associated with natural gas supply/transportation system infrastructure. Gas deliverability constraints, rather than gas production constraints, are the concern.
Deliverability threatens the reliability of power systems due to the limited capacity of the pipelines used to transport gas, coupled with -‐in-‐ as used by power generators. The reliability risks partly arise from the differences between gas and electric system operational requirements and market mechanisms. Gas transportation systems are designed to meet the needs of firm (non-‐interruptible) contract holders (historically comprised mostly of Local Distribution Companies) that draw gas more slowly and predictably from pipelines than do generators. Uncertainties in generation availability, commitment, and dispatch make it risky for any one independent generator to choose long-‐term firm contracts for gas delivery. On the other hand, as non-‐firm gas delivery customers, gas-‐fired generators can be interrupted when pipelines are unable to fully meet gas demand, which leads to electric reliability issues. Utilities with fleets of gas-‐fired generators have the economy-‐of-‐scale advantage of being able to commit to firm (non-‐interruptible) gas transportation because they can depend upon the average availability, commitment, and dispatch of the fleet to be more stable than availability, commitment, and dispatch of any single generator.
The risks created by the power industry participants that rely on non-‐firm gas transportation were much of the Midwest in the winter of 2013/2014. The combination of record-‐high winter peak electricity loads, gas deliverability constraints, and volatile gas prices caused wholesale price spikes as generators and other gas consumers without firm gas transportation commitments struggled to procure natural gas. In anticipation of such conditions, FERC decided in November 2013 to allow interstate natural gas pipeline and electric system operators to share nonpublic operational information to facilitate natural gas and power reliability.94
The growing interdependence of the natural gas supply and bulk power supply system has focused attention of participants and policy makers in both the gas and electric industries on ways to improve natural gas-‐electricity interactions and coordination. Efforts in some regions of the country (the northeast in particular) and at the national level (at FERC and by NERC) have been made to analyze the problems and to consider fuel supply and transportation adequacy as a formal part of electric reliability assessments and short-‐ and long-‐term planning.95 On the
94 Federal Energy Regulatory Commission, Order No. 787, Communication of Operational Information Between Natural Gas Pipelines and Electric Transmission Operators, 145 FERC ¶61,134, 18 CFR Parts 38 and 284, Docket No. RM13-‐17-‐000, November 22, 2013. 95 For example, see North American Electric Reliability Corporation, 2013 Special Reliability Assessment: Accommodating an Increased Dependence on Natural Gas for Electric Power: Phase II, A Vulnerability and Scenario Assessment for the North American Bulk Power System, May 2013; and Federal Energy Regulatory Commission Staff, Gas-‐Electric Coordination Quarterly Report to the Commission, Docket No. AD12-‐12-‐000, September 19, 2013; and PJM, LLC, Gas Electric Senior Task Force Problem Statement, 2013.
62
market rules have already been made and others likely will have to be made to accommodate the challenges created by gas pipeline inadequacy for non-‐firm users -‐in-‐nature of gas acquisition for power production that can at certain times severely limit operating and planning reserve margins.
5.7.5. Plant Retirements
As shown in Figure 19, about 23,000 MW of coal-‐fired generating capacity retired between 2005 and 2013, and another 37,300 MW is expected to retire over the next decade, mostly during the next four years. The retirements are due to a combination of increasingly stringent environmental regulations, an aging coal fleet, more efficient new generating technologies, low gas prices, modest demand growth, and policies favoring renewable resources.
Figure 19 Actual and Projected Coal-‐Fired Capacity Retirements, 2005 to 202696
Figure 20 shows that coal-‐fired generation retirements are concentrated in the Midwest and mid-‐Atlantic states.
Figure 20 Reported Coal-‐fired Generator Retirements 2012 to 201697
5.7.6. Reliability Issues Arising from Intermittent Resources
Wind-‐ and solar-‐powered resources provide power only when the wind blows or the sun shines. The resulting intermittency of their power output creates system control problems that are
ncreases, there must be other generation readily available to back up these resources when they do not provide power.
Making matters more difficult is the fact that subsidized wind and solar resources can depress energy prices. Consequently, at the same time that intermittent resources create a need for fossil fuel-‐fired generation to compensate for their intermittency, they reduce the energy revenues that fossil fuel-‐fired generation can hope to receive.
The recent and ongoing experience in Germany provides some lessons about the impacts of and unintended consequences of relatively rapid adoption of high penetration levels of wind and solar resources. As should be expected, the significant market shares of wind and solar resources in Germany has driven down German wholesale market prices substantially and created problems in maintaining grid reliability in the face of large swings in intermittent power output roduction 21% of all hours (1,800 hours) in 2011 and 82% of all hours (7,200 hours) in 2012.98 The 97 http://www.eia.gov/todayinenergy/detail.cfm?id=7290 98 The Electricity Journal, November 2013, 26(9): 7-‐8. Also see Bundesnetzagentur, Report on the State of the Grid-‐based Energy Supply in Winter 2011/2012, May 3, 2012.
64
depressed German energy market prices have put resource adequacy at risk because some dispatchable resources, such as natural gas fired turbines, are less economically viable.
6. PROSPECTIVE RELIABILITY IMPACTS OF EVOLVING TECHNOLOGY
Advances in power system technologies will have three general sorts of impacts on power system security and reliability. First, they will increase actual or effective resource capacities. Second, they will improve the control capabilities of power system operators. Third, they will add to the complexities of controlling power systems.
6.1. Increases in Resource Capacities As a general rule, technological improvements reduce the real (inflation-‐adjusted) costs of generation resources and improve the technical efficiencies (output per input) of those resources. Such improvements will therefore increase the supply of resources available at any given cost level.
Improvements in storage technologies in terms of both costs and physical capabilities will improve the competitiveness of intermittent generation technologies. Whether these improvements will be sufficient to make these technologies competitive (without subsidies) with conventional technologies is not yet knowable.
Improvements in transmission technologies such as those that increase the carrying capacities of lines or reduce the costs of transmission equipment reduce the costs of delivering power from resources to consumresource capacity.
6.2. Improvements in Power System Control
Power systems have already derived significant efficiency benefits from the development of regional joint commitment and dispatch of resources and the computerization of this commitment and dispatch. These benefits have come in two major forms: substitution of cheaper resources for more expensive resources; and reduced reserve requirements. Further improvements in computer technologies and further regionalization of power system control promise additional benefits.
So-‐dispatch to micro-‐resources, particularly demand resources and certain distributed generation resources. The effect of such an extension would be to increase the resource capacity that is available to the power system
6.3. Complications to Power System Control
Increasing penetration of intermittent generation resources has created and will create significant security and reliability challenges. The fundamental problem is that electricity supply and demand must be in balance at every moment in time, but the electric power fueled by the wind and the sun changes erratically and unpredictably from moment to moment. Until
65
electrical energy storage becomes sufficiently cheap, power system operators will need to protect the security of power systems through various costly mechanisms for compensating for the intermittency of wind and solar resources. These mechanisms are dispatchable resources with high ramping rates that can, on very short notice, provide the capacity that intermittent resources cannot provide.
7. DIRECTIONS FOR FUTURE REFORM OF METHODS FOR ASSURING ADEQUATE CAPACITY
There are two basic sets of issues in assuring capacity adequacy. The first concerns defining the capacity mandate:
How much capacity is needed?
What qualifies as capacity?
What types of capacity should be built?
The second set of issues concerns how to best meet the mandate:
Who should be responsible for meeting the mandate?
How can markets most efficiently be organized to meet the mandate?
Reform proposals address various aspects of the foregoing questions. This section begins with proposals to reform the capacity mandate, and then looks at proposals to reform the means of meeting the mandate.
7.1. Reforms in Defining the Capacity Mandate
7.1.1. Reformed Pricing of Operating Reserves
William Hogan of Harvard University has for many years promoted the idea of allowing operating reserve prices to signal real-‐time capacity shortages.99 The basic notion is to reward
enhanced operating reserve markets. Operating reserves do, after all, have the primary
an operating reserve demand curve by itself would provide sufficient incentives to support resource adequacy without further developin 100
Operating reserve curves would be downward-‐sloping, indicating that the marginal value of operating reserves falls as the quantity of operating reserves increases.
99 ity Pricing Through
Economics of Energy & Environmental Policy 2(2): 65-‐86, IAEE, September 2013. 100 Id., p. 72.
66
Operating reserve curves would be based upon the value of lost load and the probability of load curtailment. When there is involuntary load curtailment, the price of operating reserves would equal the value of lost load minus energy rents. When there is not involuntary load curtailment, the price of operating reserves would equal the value of lost load times the probability of load curtailment, minus energy rents.
Operating reserve curves would be administratively determined, such as by the system operator.
Hog -‐time price signals, setting operating reserve prices at very high levels when power system security is at risk. These efficient price signals are not limited to operating reserves, however. Because many resources can offer both energy and reserves, arbitrage will cause energy prices to become very high when operating reserve prices become very high. The very high prices for operating reserves and energy would reward resources for being available when they are needed most and would send price signals consistent with the need for voluntary load reductions.
-‐sloping operating reserve curve, with a price based upon the value of lost load when reserves are near zero, and with a price that falls according to estimates of how the probability of load curtailment falls as reserves rise to the level of the reserve requirement. The operating reserve price does not depend upon energy rents as Hogan proposes, however, but is instead depends upon other factors, including the per-‐MWh average cost of committing and running a peaking unit for an hour.101
Hogan provides a theoretically correct approach to the problem of pricing operating reserves; but this approach will not solve the capacity adequacy problem because it will not provide sufficient revenues to cover capacity costs in systems with one-‐event-‐in-‐ten-‐year reliability standards. As Roy Shanker has noted:
erating reserve
would not obviate the need for a capacity market. Indeed, the best solutions are where more efficient real time energy prices are combined with an appropriate capacity mechanism.102
Reformed pricing of operating reserves would improve the efficiency of day-‐ahead and real-‐time markets, and it might help recover some capacity costs that would not otherwise be recovered; but it would not provide sufficient capacity cost recovery.
101 MISO, FERC Electric TariffReserve, and Regu 102 Comments of Roy J. Shanker Ph. D., Centralized Capacity Markets in Regional Transmission Organizations and Independent System Operators, before the Federal Energy Regulatory Commission, Docket No. AD13-‐7-‐000, September 11, 2013, pp. 3-‐4.
67
7.1.2. Capacity Compensation Based on Actual Resource Availability
Power system security depends upon the resources that are actually available during peak periods rather than upon the resources that promise to be available. In particular, security is not enhanced by a generator that is out of service when reserve margins are tight, nor by demand-‐side resources that do not reduce load when needed. Consequently, capacity prices should reward actual availability both as a matter of efficiency (to encourage resources to be available when needed) and as a matter of fairness (so that consumers are paying only for capacity that has real value and not for capacity that does not perform).
Accordingly, Peter Cramton (of the University of Maryland) and Steven Stoft have proposed to
103 Key elements of their proposal include the following:
Capacity prices should be based upon actual capacity rather than bid capacity. This prevents the withholding of capacity that would allow an exercise of market power.
Capacity payments should be based upon the capacity price net of the actual energy rents rather than the theoretical energy rents of a benchmark peaking unit.104
hours when there is an operating reserve shortage. Setting capacity payments in this manner would improve the price signal and would also limit the exercise of market power.
Joseph Bowring, the Independent Market Monitor for PJM, has concerns similar to those expressed by Cramton and Stoft. In particular, he has testified that PJM pays resources for their capacity
105 He further
correctly measure actual forced outage performance because they exclude some forced 106
Having a similar concern, PJM has requested that FERC allow it to change the rules governing its capacity market so that PJM can limit the amount of capacity outside the PJM territory that can
103 Electricity Journal 18: 43-‐54, August/September 2005. 104 Cramton and Stoft acknowledge the difficulty of estimating the energy rents of an actual benchmark peaking unit in practical situations, such as when the unit has startup costs or a minimum start time that make a startup decision non-‐trivial. 105 Comments of the Independent Market Monitor for PJM, Centralized Capacity Markets in Regional Transmission Organizations and Independent System Operators, before the Federal Energy Regulatory Commission, Docket No. AD13-‐7-‐000, January 8, 2014, p. 5. 106 Id., p. 6.
68
bid into its capacity auctions.107 that limit the delivery of capacity within PJM, but not the locational constraints that limit the delivery of capacity to PJM from areas outside of PJM. Indeed, PJM does not recognize capacity import limits in its capacity auctions. With the tripling of capacity imports over the past six years and occasional curtailment of firm transmission service by neighboring power systems, this failure to recognize deliverability constraints attaches too high a value to the reliability benefits of capacity imports. This is yet another instance in which the real value of capacity is less than its nominal value.
ISO New England has recognized the recent proposal to FERC to amend its Forward Capacity Market (FCM) design. As ISO NE states:
When sellers can depend on payment regardless of the quality of the product delivered, quality tends to suffer. When payments reward higher quality, quality tends to improve. While there have been many efforts to refine the FCM over the years, its design has always failed to reflect these most basic principles, and reliability in New England is deteriorating as a result.
The product is poorly defined; while the region requires resources that reliably provide energy and reserves when supply is scarce, the FCM instead buys
The FCM applies different rules and different standards to different types of resources (even though it seeks to buy the same product from all of them), and includes numerous one-‐off provisions and exceptions. And at the end of the day, capacity
ly financial consequences for failing to perform.
Each of these elements of the current FCM is contrary to sound market design. This is not surprising, however, because the core FCM design was not based on any standard market model. Rather, the FCM was built from the ground up, without a blueprint, through a long series of negotiations and compromises. The result is an idiosyncratic design that is failing to meet its most basic objectives ensuring reliability in a cost-‐effective manner. The solution to these problems is assuredly not more of the same. The FCM design must be fixed on a fundamental level.
design with one that is familiar. Pay For Performance is a true, two-‐settlement forward market, following a blueprint that has been tested, refined, and applied
markets. Pay For Performance is built around a well-‐defined product the delivery of energy and reserves when they are needed most. Its rules are much
107 PJM Interconnection, L.L.C., Docket No. ER14-‐503-‐000, November 29, 2013.
69
more simple than the current FCM design, and those rules apply in the same manner to all resource types, without exceptions. With greater transparency and less uncertainty, Pay For Performance will create strong incentives for resource performance consistent with the goals of the capacity market.108
In summary, resources should be compensated for their capacity value only to the extent that they can support power system security when needed. Resource owners will have good incentives to perform only if they are paid for resources that are actually available when needed; and they should be penalized, or at the very least not paid, if their resources are not available when needed. This obvious reform should be undertaken expeditiously in all capacity markets that have a mismatch between rewards, penalties, and performance.
7.1.3. Recognition of the Diversity of Capacity Values
FERC has recently asked the power industry how capacity markets might better recognize the diverse values provided by different types of capacity resources. FERC specifically asked:
Should existing capacity products be modified to reflect various operational characteristics needed to meet system needs? If there is a need for additional capacity products, how should those products be defined and procured in light of the current one day in ten year resource adequacy approach?109
Some parties have asserted that the capacity values of all resources should be recognized. For example, a coalition of thirty publicly owned electric utilities, cooperatively owned electric utilities, consumer advocates, state public utility commissions, investor-‐owned utilities, industrial customers, and independent power producers has urged FERC to recognize the diversity of values provided by different types of resources, the legitimacy of policies that favor some resources over other resources, and the legitimacy of resources procured under long-‐term contracts and self-‐supply.110
Parties representing some particular types of resources have declared that special consideration should be given to the ways in which their resources provide capacity. For example, EnerNOC, which is in the business of developing demand-‐response resources, seeks different capacity market standards for demand-‐side resources than for supply-‐side resources. The basis for these different standards is that demand-‐side resources and supply-‐side resources perform differently than one another and have different business models.
108 ISO New England, ISO New England Inc. and New England Power Pool, Filings of Performance Incentives Market Rule Changes, Docket No. ER14-‐1050-‐000, January 14, 2014, p. 2. 109 Federal Energy Regulatory Commission, Notice Allowing Post-‐Technical Conference Comments, Centralized Capacity Markets in Regional Transmission Organizations and Independent System Operators, Docket No. AD13-‐7-‐000, October 25, 2013, p. 3. 110 AARP et al, Letter to the Federal Energy Regulatory Commission, Centralized Capacity Markets in Regional Transmission Organizations and Independent System Operators, Docket No. AD13-‐7-‐000, February 10, 2014.
70
Demand response resourc-‐offer mechanisms may be a good fit for
generation but are a poor fit for demand response. Generation will choose to be dispatched as often as it is profitable to provide energy, while demand response generally would prefer not to be interrupted.111
As another example, the Energy Storage Association seeks capacity market rules that enable storage to better participate in capacity markets:
Integrating storage resources into the existing capacity markets by the development of rules specific to these resources, as has been done for other alternative resources such as demand response, will send the right market signals for investment.112
Ensuring market rules are developed to enable storage resources to access to the capacity markets would remove a major barrier to investment in new storage resources.113
and yet the capacity markets currently do not allow for this type of resource.114 115
The Maryland Public Service Commission advocates having separate capacity markets for existing resources and new resources:
rgeted at existing resources in the near to mid-‐term, while conducting a separate round of bidding designed and targeted at new resources that would be brought online in the mid to longer term; capacity that could come from upgrades at existing facilities or new generating resources. Surely, in almost every instance the payment necessary to persuade an existing efficient resource to commit to remaining available for a certain
111 Comments of EnerNOC Inc. On behalf of Dan Curran, Principal, Market Strategy, Centralized Capacity Markets in Regional Transmission Organizations and Independent System Operators, before the Federal Energy Regulatory Commission, Docket No. AD13-‐7-‐000, September 10, 2013, p. 3. 112 Statement of the Electricity Storage Assocation [sic], Centralized Capacity Markets in Regional Transmission Organizations and Independent System Operators, before the Federal Energy Regulatory Commission, Docket No. AD13-‐7-‐000, September 10, 2013, p. 3. 113 Id., p. 5. 114 Post-‐Technical Conference Comments Of The Energy Storage Assocation [sic], Centralized Capacity Markets in Regional Transmission Organizations and Independent System Operators, before the Federal Energy Regulatory Commission, Docket No. AD13-‐7-‐000, January 8, 2014, p. 5. 115 Id., p. 6.
71
period into the future will be much less than that necessary to incent construction of a new power plant.116
The Maryland Public Service Commission also advocates capacity products of different durations:
FERC should also look at the desirability of requiring capacity markets to establish capacity payment terms of greater than one year, perhaps using a portfolio of staggered contract terms such as three, five, or ten years for a defined percentage of capacity resources this approach would minimize price volatility and provide long term price signals which would also provide greater revenue certainty to developers of new merchant generation.117
The Maryland Public Service Commission also advocates compensating capacity for its different operational characteristics:
Capacity compensation should vary to reflect the type and value of the capacity services provided to the market. This includes providing quick start, shutdown and load-‐ 118
On the other side, the American Public Power Association opposes the development of multiple capacity products:
Trying to adapt these [capacity] markets to accommodate specific resource types and attributes, while an admirable goal, would make them only more complex and difficult to administer, potentially leading to further unintended negative results and yet more band-‐aid market rule changes and exceptions to attempt to address these unintended results.119
Joseph Bowring and David Patton, the Independent Market Monitors for PJM and New York ISO, respectively, each say that the special operational attributes of certain resources, like quick response, are best rewarded by the energy and ancillary services markets rather than by capacity markets:
characteristics or other attributes. Such character[ist]ics are best dealt with in the energy markets and the ancillary services markets. Subdividing the capacity market into multiple submarkets would add exponential complexity to an
116 Comments of the Maryland Public Service Commission, Centralized Capacity Markets in Regional Transmission Organizations and Independent System Operators, before the Federal Energy Regulatory Commission, Docket No. AD13-‐7-‐000, September 9, 2013, p. 6. 117 Id. 118 Id., p. 7. 119 Written Statement Of Susan N. Kelly On Behalf Of The American Public Power Association, Centralized Capacity Markets in Regional Transmission Organizations and Independent System Operators, before the Federal Energy Regulatory Commission, Docket No. AD13-‐7-‐000, September 9, 2013, p. 16.
72
already complex market and would be likely to exacerbate existing market power issues as there are more dominant positions in the smaller submarkets.120
Capacity markets provide a powerful economic mechanism to facilitate investment in resources with certain operating characteristics. However, the capacity market should only be used to create such signals when the energy and ancillary services markets do not already provide efficient economic signals supporting the operating characteristic in question. For characteristics that are beneficial in operating the system, well-‐designed energy and ancillary services markets should fully and efficiently compensate the supplier for the operating
does not guarantee the characteristic will be available during the operations.121
Patton says that differences in resources operational characteristics should be recognized through adjustments in the capacity values attributed to different resources rather than through creation of multiple capacity products:
f resources contribute differently to
percent forced outage rate is not equivalent to a unit with a 5 percent forced outage rate. Similarly, intermittent resources with an average load factor of 30 percent are not equivalent to conventional generating resources. Hence, the RTOs generally employ a system to account for these differences. For example,
intermittency. While there is room for improvement in how this UCAP translation is implemented, we believe it is far superior to normalize different types of resources into one common product rather than introducing multiple capacity products and corresponding requirements.122
While capacity markets do need to be differentiated by location because of deliverability constraints, there is no need to have separate markets for different types of capacity resources. All resources that can enhance power system reliability can and should be accepted as capacity resources. The differentiation among these resources should not be based upon their technologies or their ages, but should be based solely upon their performance: a higher price can be paid to a more valuable resource while a lower price is paid to a less valuable resource; or, equivalently, a higher capacity value can be assigned to a more available and responsive 120 Comments of the Independent Market Monitor for PJM, Centralized Capacity Markets in Regional Transmission Organizations and Independent System Operators, before the Federal Energy Regulatory Commission, Docket No. AD13-‐7-‐000, January 8, 2014, p. 8. 121 Post-‐Technical Conference Comments of Potomac Economics Ltd. New York ISO Market Monitoring Unit, Centralized Capacity Markets in Regional Transmission Organizations and Independent System Operators, before the Federal Energy Regulatory Commission, Docket No. AD13-‐7-‐000, January 8, 2014, p. 6. 122 Id., p. 5.
73
resource while a lower capacity value is assigned to a less available and responsive resource. Resources that can enhance reliability should not be kept out of capacity markets by virtue of their operational limitations; but if those limitations reduce their reliability value relative to other resources, they should be paid a lower price or be assigned a lower capacity value that reflects the reduced reliability value.
For the purpose of providing efficient incentives for resource investment and resource retirement, we offer the following comments relevant to the foregoing proposals:
If demand-‐side resources are less available than supply-‐side resources, they have less reliability value and should be compensated accordingly.
The value of the quick response of storage resources should be fully compensated in ancillary services markets, not in capacity markets.
Energy-‐limited resources, including some demand-‐side and storage resources, may have less reliability value than resources without this limitation, and should be compensated accordingly.
Existing and new resources should be compensated differently only to the extent that their operational characteristics give them different reliability values.
Resources procured through different institutional arrangements through investment, bilateral contracts, or centralized markets should be compensated differently only to the extent that the operational characteristics of the underlying resources give them different reliability values.
One of the important lessons learned from the polar vortex experience is the value of fuel diversity, which determines the diversity in the fuel mix of capacity available to maintain grid reliability under extreme weather conditions. Donald Schneider, President of FirstEnergy Solutions, speaking at the FERC technical conference on polar vortex issues, stated:
You can't have the backbone of the electric system that is counted on for reliability operated on an essentially just-‐in-‐time interruptible fuel supply. There is a need to maintain diversity in a fuel supply, and it is particularly important to value on-‐site fuel optionality The recent influx of new gas and renewable generation resources has created a challenge for our industry. These new resources do not have the same operational and reliability benefits as essential generation. As market and social forces change the diversity of our fuel mix, it is our responsibility to maintain an even stronger focus on preserving reliability, and this can't be done through planned transmission upgrades alone The near-‐term goals should include a mechanism that adequately compensates resources for the value they provide. The longer term goal should be to enhance the
74
market construct to maintain on a self-‐sustaining basis fuel diversity, ensuring that markets maintain a strong focus on reliability.123
s remarks, John Sturm, Vice President of Corporate and Regulatory Affairs, for the Alliance for Cooperative Energy Services (ACES), urged FERC
additional regulations that might expedite or cause additional coal or nuclear 124
7.2. Reforms in Methods for Meeting Capacity Mandates
7.2.1. Resource Obligations Borne by Distribution Service Providers
Cliff Hamal of Navigant Economics has proposed that capacity resource obligations be borne by distribution wires companies rather than by LSEs.125 The major motivation for this so-‐called
suppliers has made it virtually impossible for LSEs to take on long-‐term obligations to purchase 126
Key elements of the BiCap approach include the following:
Capacity obligations would be the responsibility of distribution companies.
Existing RTO capacity markets would be eliminated. RTOs would no longer play any role in setting capacity prices, developing capacity demand curves, or dealing with market power.
RTOs would continue to determine capacity needs based upon NERC standards, peak loads, and deliverability constraints.
RTOs would assess penalties on distribution companies that fail to meet their obligations.
Hamal claims that placing capacity obligations on distribution companies has the following advantages relative to placing these obligations on LSEs:
Because load in competitive markets can easily migrate among LSEs but can migrate only with great difficulty among distribution service providers, distribution companies
123 Federal Energy Regulatory Commission, In the matter of Technical Conference On Winter 2013-‐2014 Operations and Market Performance In RTOs and ISOs, Docket No. AD14-‐8-‐000, Transcript, pp. 210-‐213. 124 Id., pp. 229-‐230. 125 C. Hamal, Solving the Electricity Capacity Market Puzzle: The BiCap Approach, Navigant Economics, July 4, 2013. 126 Id., p. 3.
75
are in a better position to make long-‐term capacity procurement arrangements than are LSEs.127
-‐term commitments to their local distribution companies, distribution companies can sign long-‐term contracts with generators that will allow them to reduce their financing costs by increasing their ability to borrow money long-‐term.
Distribution companies can tailor capacity resources to meet their particular local network problems.
Distribution companies are better able to compare transmission alternatives.
long-‐term capacity commitments when they lack long-‐term purchase commitments from their customers. BiCap also has some weaknesses that arise from its division of capacity rights ownership and capacity needs: capacity rights would be owned by parties (the distribution companies) who are different than the parties who need to exercise those rights (the LSEs). Ideally, capacity would be purchased by parties who balance the costs of capacity with the values of the energy and ancillary services that the capacity can provide, with due consideration
impacts of capacity procurement decisions are bifurcated: distribution providers choose and bear the costs of the capacity, while LSEs bear the operating cost and availability consequences. Distribution providers would therefore have strong incentives to minimize their capacity costs; and they would have only weak incentives to maximize the net value of the services provided
relative to market values. In other words, distribution providers might buy the cheapest capacity rather than the best capacity.128
The BiCap approach does address a key weakness of existing capacity markets, namely the absence of truly long-‐term commitments. Perhaps further development of this approach can address the incentive problems that arise from the division of capacity ownership and capacity needs.
127 Some commercial and industrial load can migrate among distribution companies by moving production from a
service area. 128 Some of these concerns may also apply to present RTO capacity markets, wherein LSEs pay for capacity while RTOs exercise the capacity rights. As with the present RTO capacity markets, the problem of capacity quality could be addressed by appropriate capacity performance rules.
76
7.2.2. Capacity Options
Several authors have suggested that the adequacy problem can be addressed through the forward procurement of reliability options, also referred to as capacity options.129 These instruments are similar to call options. Whenever the wholesale spot market price exceeds a pre-‐ the contracted capacity supplier must pay the excess to the option owner (such as an LSE). In exchange for writing this option, the capacity supplier receives a fixed capacity payment.
There are three advantages of this capacity option approach. First, the capacity supplier benefits from a stable and predictable income stream. Second, the capacity supplier has a strong incentive for its resource(s) to be available at times of scarcity: if the is not available, the supplier will have to meet the payments under the capacity option contract without receiving any market revenue at a time of high market prices. Third, the buyers of capacity options effectively cap their electricity purchase price at the level of the strike price,
through the payment made by the capacity supplier under the option contract. This provides the buyer with a hedge against spot market price volatility risk.
Capacity options can be designed in a number of ways, depending on whether the scheme is purely financial or also involves an obligation to have and make capacity available when the option is exercised (or otherwise face a penalty). The latter obligation provides assurance that reliability is supported. In such a case, the capacity option becomes similar to a scheme based on capacity obligations. In either case, the capacity option can be priced through a forward auction similar to what the RTOs have in place today.
7.2.3. Treatment of Self-‐Supply Relative to Centralized Capacity Markets
Until the formation of RTOs, LSEs could meet their capacity obligations through direct investment, shared investment, and bilateral purchase contracts. In the hundred years of power industry history up to the creation of the RTOs, there were no centralized capacity markets.
by requirements that LSEs meet their capacity obligations solely through capacity resources that clear the centralized capacity market auctions. Several representatives of consumers and
-‐ that is, direct investment in, shared investment in, and bilateral purchase
of capacity resources. In cases wherein an LSE procures a self-‐supplied capacity resource that does not clear in the centralized capacity market auction, the LSE will not only pay for the self-‐
129 Economics of Energy & Environmental Policy, Vol. 2, No. 2, 2013; and The Agency for the Cooperation of Energy Regulators, Capacity Remuneration Mechanisms and the Internal Market for Electricity, July 30, 2013.
77
supplied resource but will also be forced to pay a substantial penalty to the RTO.130 The
systems in the three Eastern RTOs to self-‐supply their own loads with their own reso 131
satisfy itself that LSEs have a genuine ability to use the capacity resources that they build themselves or acquire in the bilateral market to satisfy th 132 The
maximize LSE self-‐ 133
arkets is partly concerned with the inconsistency between the short-‐term nature of those markets in contrast to the long-‐term nature of capacity itself. As stated by the Maryland Public Service Commission:
FERC must preserve the ability of sophisticated buyers and sellers to engage in mutually beneficial long-‐term transactions. At present, capacity market mechanisms do not provide the signals, nor the opportunity, for developers of new generation to obtain the market assurance they need to commit capital based on a reasonably certain revenue stream required to obtain competitive financing and ensure long-‐term revenue adequacy. This is precisely where ensuring that willing buyers and sellers can enter into mutually beneficial long-‐term contracts for capacity and energy will help to remove one impediment to
134
130 FERC has recently approved a more lenient self-‐supply option for PJM, although it has not yet done so in New England or New York. See Federal Energy Regulatory Commission, 143 FERC ¶61,090 (2013), PJM Interconnection LLC, Order Conditionally Accepting in Part, and Rejecting In Part Proposed Tariff Provisions, Subject to Conditions, May 2, 2013. 131 Written Statement Of Susan N. Kelly On Behalf Of The American Public Power Association, Centralized Capacity Markets in Regional Transmission Organizations and Independent System Operators, before the Federal Energy Regulatory Commission, Docket No. AD13-‐7-‐000, September 9, 2013, p. 8. APPA has also offered a broader and more detailed reform proposal, in addition to its first priority of restor self-‐supply rights. See Section IV (page 61+) of its post-‐technical conference comments at http://www.publicpower.org/files/PDFs/APPA_Post-‐Technical_Conference_Comments_AD13-‐7_Final_1392150690180_2.pdf. 132 Post-‐Technical Conference Comments of the National Rural Electric Cooperative Association, Centralized Capacity Markets in Regional Transmission Organizations and Independent System Operators, before the Federal Energy Regulatory Commission, Docket No. AD13-‐7-‐000, January 8, 2014, p. 4. 133 Post-‐Technical Conference Comments of the Transmission Access Policy Study Group, Centralized Capacity Markets in Regional Transmission Organizations and Independent System Operators, before the Federal Energy Regulatory Commission, Docket No. AD13-‐7-‐000, January 8, 2014, p. 3. 134 Comments of the Maryland Public Service Commission, Centralized Capacity Markets in Regional Transmission Organizations and Independent System Operators, before the Federal Energy Regulatory Commission, Docket No. AD13-‐7-‐000, September 9, 2013, p. 8.
78
Similarly, the Transmission Access Policy Study Group says:
-‐supply, state procurement, and the longer-‐term bilateral market. Only markets that provide the potential for long-‐term commitments to support long-‐lived, capital-‐intensive investments are capable of maintaining resource adequacy and meeting other federal, state, and local energy policies. Residual capacity markets are also fully
135
Referring to
RPM should be recognized as a residual procurement. In fact, the descriptor applied to the principal set of
procured to meet the needs of load after taking account of self-‐supply.136
The APPA also urged the FERC to reform RTO capacity markeresidual procurement mechanisms other, primary methods of procuring capacity (e.g., bilateral contracting or self-‐builds), and to lay off or procure marginal supply 137
Joseph Bowring, head of Monitoring Analytics, that the value of the centralized capacity markets is that they provide price transparency and thereby encourage efficient provision of capacity:
A single central capacity market is clearly preferable to a series of bilateral
supply and demand fundamentals. A bilateral market is opaque to market participants and provides opportunities to exercise market power in the presence of very little information about market fundamentals and likely significant asymmetries in access to information.138
particularly if LSEs finance their self-‐supply through traditional cost-‐of-‐service regulation:
135 Post-‐Technical Conference Comments of the Transmission Access Policy Study Group, Centralized Capacity Markets in Regional Transmission Organizations and Independent System Operators, before the Federal Energy Regulatory Commission, Docket No. AD13-‐7-‐000, January 8, 2014, p. 15. 136 Post-‐Technical Conference Comments of the PJM Industrial Customer Coalition, Centralized Capacity Markets in Regional Transmission Organizations and Independent System Operators, before the Federal Energy Regulatory Commission, Docket No. AD13-‐7-‐000, January 8, 2014, p. 14. 137 Written Statement Of Susan N. Kelly On Behalf Of The American Public Power Association, Centralized Capacity Markets in Regional Transmission Organizations and Independent System Operators, before the Federal Energy Regulatory Commission, Docket No. AD13-‐7-‐000, September 9, 2013, pp. 63-‐64. 138 Comments of the Independent Market Monitor for PJM, Centralized Capacity Markets in Regional Transmission Organizations and Independent System Operators, before the Federal Energy Regulatory Commission, Docket No. AD13-‐7-‐000, January 8, 2014, p. 12.
79
A residual market by definition relies on other mechanisms to acquire capacity. If the other mechanism is cost of service regulation, then the residual market will not result in a price that reflects the fundamentals of supply and demand conditions. Such a residual market is very unlikely to result in incentives adequate for a merchant generator to profitably build new generation.139
cannot properly function if participation in those markets is not mandatory:
The most important point about all the approaches to the net revenue problem is that they are mutually exclusive. If a market chooses the cost of service paradigm based on state regulated cost of service revenue guarantees, it makes it impossible to have a competitive capacity market. It is not possible for a competitive merchant generation developer to compete with such revenue guarantees.140
Again, all resources that can enhance power system reliability can and should be accepted as capacity resources; and the value of those resources should be based solely upon their
markets are problematic because they are so short-‐term: by design, they cannot be expected to support long-‐term investment. Making participation in the centralized markets mandatory has the perverse effect of creating incentives that undermine long-‐term investment and that, in particular, undermine a capacity investment model that has worked well, if imperfectly, for over a century. Mandatory participation also limits LSEs ability to fashion solutions that fit their own individual situations .
7.2.4. Reform of LMP Pricing
Because resource investments depend upon energy and ancillary services prices, those prices need to be efficient. Unfortunately, energy and ancillary services prices are inefficiently reduced by public policies that support particular types of resources (e.g., renewable resources) and by RTO actions to support power system security through out-‐of-‐market purchases of energy and ancillary services. The Electric Power Supply Association explains the latter problem as follows:
e understating the revenue required to reliably meet demand for electricity in wholesale markets. This occurs when grid operators frequently take actions without transparency and accountability to call on resources outside of economic merit order that are compensated other than through LMPs. Instead, these other resources are paid through what is called uplift, a cost that is spread among load outside of the LMP mechanism. By definition, the resulting LMPs when this occurs understate the amount of revenue necessary to serve the
139 Id., p. 12. 140 Id., p. 13.
80
system because the LMPs do not include the cost of taking all of the actions actually taken in the name of reliability but paid via uplift instead. This significantly mutes the price signals including forward prices on which investment decisions are based resulting in muted investment relative to what is required in a competitive market.141
The reductions in energy prices can result in significant revenue loss for generators and reduced incentives for needed investment. As the Electric Power Supply Association states, the determination of LMPs should be reformed so that all resources receive higher energy prices when the RTOs find it necessary to make out-‐of-‐market payments to support reliability.
8. CONCLUSIONS
The U.S. electric power industry has a one-‐hundred-‐year history of providing capacity resources that have been adequate under all but the most extreme conditions. The main contributor to this favorable outcome has been a set of power industry business practices that require resources to exceed peak loads according to certain engineering-‐based analyses or rules of thumb. These industry practices have been supplemented and strengthened by various state proceedings such as integrated resource planning.
While traditionally regulated electricity markets have issues such as contentious prudence determinations, these markets continue to meet resource adequacy requirements under the supervision of state regulators.
The current debate on resource adequacy arises primarily from questions about how to make the restructured markets fundamental causes:
-‐term centralized capacity markets do not provide incentives for long-‐term resource investments. These markets were designed to improve the short-‐term commitment and dispatch of power system resources; and for this short-‐term purpose, they have been very successful.142 But these RTO markets, being short-‐term markets, do not and cannot address long-‐term capacity needs. In the words of one of the
forward procurement with longer-‐term forward contracting. They are not substitutes;
141 Comments of the Electric Power Supply Association, Centralized Capacity Markets in Regional Transmission Organizations and Independent System Operators, before the Federal Energy Regulatory Commission, Docket No. AD13-‐7-‐000, January 8, 2014, p. 12. 142 The engineering-‐economics basis for electricity restructuring in general and for LMP calculations in particular is entirely short-‐term. For one of the original articles describing this basis, see R.E. Bohn, M.C. Caramanis, and F.C. Schweppe, "Optimal Pricing in Electrical Networks Over Space and Time", Rand Journal of Economics, 15(3): 360-‐76, Autumn 1984. A more comprehensive description can be found in F.C. Schweppe, M.C. Caramanis, R.D. Tabors, and R.E. Bohn, Spot Pricing of Electricity, Kluwer Academic Publishers, Boston, 1987. The mathematics of
present energy and ancillary service price determinations are elaborations of the ideas presented in these publications.
81
Bilateral forward contracting remains key under any market design for locking in 143 Contrary to this key necessity,
however, the RTO markets include some design elements that impede long-‐term investments and long-‐term bilateral contracts.
The political process will not allow peak-‐period demand pricing or rationing that is consistent with a market solution. Specifically, prices are capped by politically risk averse regulators; and on the rare occasions when non-‐price rationing (e.g., rolling blackouts) occurs due to capacity shortfall, that rationing does not tend to discriminate between those consumers and retail suppliers who arrange adequate supplies and those who do not.
Electricity customers are generally not willing to pay explicit prices consistent with the high cost of building the resources that are required to avoid peak-‐period demand rationing. In particular, the one-‐event-‐in-‐ten-‐year rule of thumb has an incremental cost that is far above many customers willingness to pay for reliability. Outage costs do
usual planning reserve requirements, markets alone will not support the capacity
, even with a perfectly functioning demand-‐side of electricity markets.
These fundamental causes imply that the resource adequacy problem does not have a market solution. The RTOs, as they struggle to fit a square peg into a round hole, must therefore continually reform their capacity markets, sometimes in major ways, always through contentious proceedings, as they search for a market solution that cannot exist under existing political and regulatory frameworks. While a well-‐functioning market attracts participation because that market provides trades on terms that are comparable to or better than those availabbecause, as many parties have indicated, there are venues in which capacity services are
kets. There are few places in the American economy wherein one can find a free market in which participation is mandatory.
The traditionally regulated markets avoid all the foregoing problems by simply not attempting a market solution, except to the extent that they have competitive bidding procedures to meet identified capacity needs. The RTOs could do the same thing: set capacity requirements according to engineering criteria; impose high penalties on those LSEs who fail to meet their requirements; and attractive.
143 D.B. Patton, Resource Adequacy in Wholesale Electricity Markets: Principles and Lessons Learned, Federal Energy Regulatory Commission Technical Conference on Centralized Capacity Markets in Regional Transmission Organizations and Independent System Operators, Docket No. AD13-‐7-‐000 September 25, 2013, p. 8.
82
There are additional matters that should be, and indeed already are, of great concern to policymakers and all stakeholders in the electric power industry:
The reliability of some portions of the power system has been challenged by a lack of fuel diversity in new generation development. The cold winter of 2013-‐ polar vortex and the accompanying gas price spikes and gas delivery issues highlight the perils of over-‐reliance on any one fuel.
Gas-‐electric coordination has become increasingly important as we rely more on natural gas. Questions arise as to whether generation can be counted as firm capacity if it does not have firm transportation contracts. Again, the polar vortex was a demonstration of the possible implications of insufficient firm transportation.
The planned retirement of coal plants (for both economic and environmental reasons), the retirement of two nuclear plants for economic reasons, and the possible retirement of more nuclear plants will exacerbate the resource adequacy problem in most RTOs, creating significant reliability concerns.
There is reasonable concern about the capacity value of demand-‐side resources. It is risky to over-‐rely on these resources until they have been thoroughly tested by experience.
There is reasonable concern about the capacity value of intermittent resources, and about the power system control and security problems raised by their intermittency.
There have been many proposals made to reform capacity markets or to design new methods to ensure resource adequacy in the restructured markets, but most of these proposals assume that tweaks to the restructured market model will be sufficient. A more comprehensive solution is necessary, however. For example, the restructured markets could be designed to that capacity is procured in ways similar to those used in traditional regulated markets: set capacity requirements according to engineering criteria; impose high penalties on those LSEs who fail to meet their requirements; and offer a centralized market for those parties who find the centralized Generation could be procured through competitive solicitation as it is done successfully in some traditionally regulated markets as well as in some restructured markets. And RTOs could continue to operate energy markets in the same way as they do today.
Our nation needs to continually strive for better regulatory and market rules that ensure resource adequacy at reasonable cost to consumers and the economy. We recommend that regulators and legislators, at both the federal and state levels, closely examine the resource adequacy problem in restructured markets and develop solutions soon. Because of the significant time that is required to develop new resources, we cannot afford to wait until resource adequacy problems become more acute.