62


Oregon State Lottery An Enterprise Fund of the State of Oregon
Comprehensive Annual Financial Report
For the Fiscal Year Ended June 30, 2009
Dale Penn Director
Kathy Ortega, CPA Chief Financial Officer
Report Prepared by:
Finance and Accounting Support Services Division, Oregon State Lottery
Jean Gabriel, CPA Martha Wildfang

i
COMPREHENSIVE ANNUAL FINANCIAL REPORT
For The Fiscal Year Ended June 30, 2009 TABLE OF CONTENTS
Page Introductory Section Letter of Transmittal......................................................................................................................................................... 2
Certificate of Achievement for Excellence in Financial Reporting......................................................................6
Organization Chart with Principal Officials ................................................................................................................... 7
Financial Section Independent Auditor's Report.......................................................................................................................................10
Management’s Discussion and Analysis ....................................................................................................................12
Basic Financial Statements: Balance Sheet ........................................................................................................................................................18
Statement of Revenues, Expenses and Changes in Fund Net Assets...........................................................19
Statement of Cash Flows.......................................................................................................................................20
Notes to the Financial Statements .......................................................................................................................21
Required Supplementary Information:
Schedules of Funding Progress – Other Postemployment Benefit Plans ......................................................38
Supplementary Information:
Budgetary Comparison Schedule.........................................................................................................................40
Statistical Section
Index..............................................................................................................................................................42 Net Assets by Component.............................................................................................................................43 Changes in Net Assets..................................................................................................................................44 Sales by Product ...........................................................................................................................................46 Product Percent of Total Sales......................................................................................................................47 Top Ten Retailers..........................................................................................................................................48 Number of Lottery Retailers and Sales by County ........................................................................................49 Demographic and Economic Data – State of Oregon...................................................................................50 Employment by Industry – State of Oregon ..................................................................................................51 Demographic Profile of Oregon Lottery Players............................................................................................52 Number of Employees...................................................................................................................................54 Operating Indicators and Capital Asset Information......................................................................................55
Other Reports
Report on Internal Control Over Financial Reporting and Compliance..................................................................58

Introductory Section

2
November 19, 2009 To the Honorable Governor Theodore R. Kulongoski and Citizens of the State of Oregon: We are pleased to provide you with the Comprehensive Annual Financial Report of the Oregon State Lottery (Lottery) for fiscal year ended June 30, 2009. This report is published to meet the requirement in state law for an annual accounting of financial activities. Lottery management assumes full responsibility for the completeness and reliability of the information contained in this report, based upon a comprehensive framework of internal controls established for this purpose. Because the cost of internal controls should not exceed anticipated benefits, the objective is to provide reasonable rather than absolute assurance that the financial statements are free of any material misstatements. The Secretary of State Audits Division, the constitutional auditor of public accounts in Oregon, audited the Lottery’s financial statements for the fiscal year ended June 30, 2009. The auditors used generally accepted auditing standards in conducting the engagement. Their unqualified opinion on the financial statements is the first component in the Financial Section of this report. A narrative analysis of the Lottery’s financial performance for the fiscal year can be found in the Management’s Discussion and Analysis (MD&A) immediately following the independent auditor’s report. This letter of transmittal complements the MD&A and should be read in conjunction with it.
Profile of Oregon State Lottery
The Oregon State Lottery was created through the initiative process in November 1984 when voters approved an amendment to the Oregon Constitution that required the establishment and operation of a State Lottery. Initially, Lottery profits were earmarked to create jobs and further economic development. In May 1995, voters approved a Constitutional amendment allowing Lottery profits to be used for the financing of public education. Similarly, voters added state parks and salmon restoration projects to the list of allowable uses of Lottery proceeds in November 1998. Oregonians have voted to use Lottery profits for things that make Oregon a great place to live. The Lottery was established as a state agency to market and sell Lottery products to the public. Its statutory mandate requires it to operate the Lottery to produce the maximum amount of net revenues for the people of Oregon commensurate with the public good. Development of new products and game enhancements is a continual process in the effort to increase long-term revenues, while taking into consideration the potential impact of game decisions on problem gambling. The Lottery strives to promote responsible gambling by providing public information about problem gambling and the treatment available. Through a network of 3,855 retailers, the Lottery offers players a broad mix of traditional games as well as Video LotterySM. Traditional Lottery games include: Scratch-itsSM Instant Tickets, Keno, Powerball®, MegabucksSM, Win for LifeSM, RaffleSM, Lucky LinesSM, and Pick 4SM. Video LotterySM is a product sold on stand-alone Video LotterySM terminals located in bar and tavern retail establishments. The Lottery has approximately 12,365 Video LotterySM terminals deployed throughout the state.

The Lottery, which is accounted for as a single enterprise fund, is entirely self-financed through its sales. Its operations are designed to fulfill its duty to develop, produce, and market Lottery games; pay winners and operating expenses; and remit the remaining net profits to the State. These net profits are transferred to the Oregon Economic Development Fund and are then distributed by the State to finance the various uses allowed by law. Through its business units, the Lottery provides services that are necessary to operate successfully including security, marketing, retailer support, finance, management and information services. Additional information about the Lottery is available on its web site at: http://www.oregon.gov/LOTTERY/. The Lottery is operated under the direction of a five-member commission, with the commissioners appointed by the Governor and confirmed by the Senate. The Commission directs the activities of the Lottery, including the adoption of rules for the security and integrity of operations. The Governor also appoints a Director, who serves as the chief administrator of the Lottery. The Director is responsible for operating the Lottery in accordance with state law and administrative rules and under the guidance of the Commission. For budgeting purposes, the Commission adopts an annual Financial Plan based on activities identified in Lottery’s annual Business Plan. The Financial Plan uses revenue forecasts prepared by the Oregon Department of Administrative Services, Office of Economic Analysis. Budgeted revenues and direct expenses (prizes, commissions, game vendor charges, and tickets) are revised quarterly for changes in revenue forecasts. Revisions to other expense items in the adopted budget must be approved by the Commission. The budget is prepared on the accrual basis of accounting. Actual expenses are monitored throughout the year for compliance with the approved budget and appropriate adjustments are approved if necessary. By law, expenses to operate the Lottery are limited to no more than 16 percent of total annual revenues. Since the Lottery’s first full year of operation in 1986 through fiscal year 2008, Lottery revenues demonstrated strong and consistent growth. Lottery revenues declined in fiscal year 2009 due to the impacts of Oregon’s economic recession and the implementation of a statewide smoking ban in bars and taverns where Lottery products are sold.
-
200
400
600
800
1,000
1,200
1,400
Rev
enue
s (in
mill
ions
)
1986
1987
1988
1989
1990
1991
1992
1993
1994
1995
1996
1997
1998
1999
2000
2001
2002
2003
2004
2005
2006
2007
2008
2009
Fiscal Year
Total Oregon Lottery Revenues1 by Fiscal Year (1986 - 2009)
1Revenues based on gross receipts for traditional games and net receipts (after prizes) for video games.
Economic Condition and Outlook
According to the Oregon Office of Economic Analysis (OEA), Oregon’s employment growth outpaced the national average during calendar year 2004 through 2007. During 2008, employment declined in Oregon by 0.6 percent, slightly more than the national decline of 0.4 percent. The OEA has forecasted Oregon employment for 2009 to decline by 5.1 percent from 2008. Employment is expected to decline by 0.9 percent in 2010, with job losses continuing, but at a slower rate. Job growth in 2011 is estimated to be 2.2 percent, as the economy begins to recover from an economic recession. Oregon’s personal income is projected to decline from calendar year 2008 to 2009 by 1.0 percent. For 2010, OEA estimates that personal income will increase by 2.5 percent while wage and salary income will increase by 1.4 percent. Personal income is projected to increase by 4.0 percent in 2011, which is the same as the
3

projected increase for the nation. Wage and salary income in Oregon is expected to grow at a faster rate than the nation in 2011, with a projected increase of 4.3 percent as compared to 4.0 percent for the nation. To the extent that economic conditions continue to impact discretionary income, net revenues generated through Lottery sales will likely be affected. Factors currently facing Oregon are high unemployment, the housing market downturn, the national credit challenges, and the global economic downturn triggered by the U.S. slowdown.
Long-term Financial Planning
Legislatively adopted smoking restrictions in all public places went into effect January 1, 2009. In the December 2009 Economic and Revenue Forecast, the Office of Economic Analysis (OEA) projected a decrease in lottery earnings from the prior forecast in September of 2009. The OEA lowered projected Video LotterySM earnings for the 2009-2011 biennium to factor in the continued expected impacts of the economic recession and the smoking ban in bars and taverns where Lottery products are sold. The Lottery uses a five-year Strategic Plan in conjunction with an annual Business Plan and annual budget to plan and manage its operations. Lottery’s main strategic objective is to generate optimal revenue for public purposes by offering a wide variety of market-responsive games that will appeal to diverse consumer markets and support the success of a broad retailer base. In support of this objective, the Lottery plans to continue updating its game offerings by introducing three new game sets on select Video LotterySM terminals during fiscal year 2010. In addition, the Lottery will invest approximately $25.3 million to replace outdated terminals with new Spielo ProdiGi VuTM dual-screen terminals, featuring a new set of games. This combination of refreshed games and new terminals will help to maintain the vitality and continued success of Lottery products. In addition, the Lottery plans to expand the existing square footage of its headquarters building in Salem, Oregon. Provision for this expansion is included in the resources committed by the Commission at the end of fiscal year 2009.
Relevant Financial Policies
In order to provide resources for current operations and future investment, the Lottery Commission established a contingency reserve fund. The available cash portion of this reserve fund is $45.0 million, as authorized by the Commission. At fiscal year end, the entire $45.0 million of this contingency reserve was uncommitted. Transfers of earnings to the Economic Development Fund are made quarterly. In order to assist the State with budget challenges, the Lottery transferred an additional $37.8 million of administrative savings during fiscal year 2009 in excess of the required transfer of earnings. Normally, these resources would not have been transferred until the following fiscal year.
Major Initiatives
After a successful launch of its first ever RaffleSM game last year, the St. Patrick’s Day RaffleSM, the Lottery is planning to hold two RaffleSM drawings in fiscal year 2010. One drawing will be a Thanksgiving Day RaffleSM, and the other a St. Patrick’s Day RaffleSM. The Lottery hopes to build on the initial success to generate additional revenue and gain new players. In addition, the Lottery is expanding its distribution network by opening a kiosk at the Portland International Airport which will offer the full complement of traditional products. The anticipated opening of the kiosk is in late calendar year 2009. The Lottery will also research new product offerings in the upcoming year to maintain and/or raise additional revenue.
4


7
Principal Officials of Oregon State Lottery
Steven Ungar Commission Chair
Bill Ihle
Commission Vice Chair
Pamela Fogg LeRon Howland Amy Lowery Commissioner Commissioner Commissioner
Dale Penn
Director
Organization Chart
Lottery Commission
Support Services Larry Niswender Assistant Director
Retail Operations Tim Eaton
Assistant Director
Security Major Craig Durbin Assistant Director
Marketing Carole Hardy
Assistant Director
Department of State Police
Lottery Director
Dale Penn

This page intentionally left blank.
8

Financial Section


12
Oregon State Lottery Management’s Discussion and Analysis
This section of the Oregon State Lottery’s (Lottery) Comprehensive Annual Financial Report presents our discussion and analysis of the Lottery’s financial performance for the fiscal year ended June 30, 2009. This analysis is to be considered in conjunction with information in the transmittal letter of this report. Financial Highlights
Sales of all Lottery products were $1.1 billion, a reduction of 10.8 percent from fiscal year 2008.
Video LotterySM revenue decreased by $108.4 million and Scratch-itsSM Instant Ticket revenue decreased by $12.6 million from fiscal year 2008.
Net assets (equity) decreased by $26.0 million as a result of fiscal year operations.
The Lottery transferred $592.8 million to Oregon’s Economic Development Fund, which is $55.6 million less than the prior year.
Overview of the Financial Statements In addition to this discussion and analysis, the Financial Section of this annual report contains the basic financial statements, which include the fund financial statements and notes to the financial statements; required supplementary information; and an optional budgetary comparison schedule, which is presented as other supplementary information. The basic financial statements offer short-term and long-term financial information about the Oregon State Lottery, which is structured as a single enterprise fund. The required supplementary information contains a Schedule of Funding Progress and accompanying notes for two other postemployment benefit (OPEB) plans in which the Lottery participates: the Public Employees Benefit Board OPEB Plan and the Retiree Health Insurance Premium Account OPEB Plan. The budgetary comparison schedule presents budgeted and actual revenues and expenses for the fiscal year. In addition, a Statistical Section containing information regarding financial trends and revenue capacity as well as demographic, economic, and operating information is presented following the budgetary comparison schedule. The Balance Sheet provides information about the nature and amounts of investments in resources (assets) and obligations (liabilities) at the end of the fiscal year, with the difference between assets and liabilities reported as net assets (equity). All of the current year’s revenues and expenses are accounted for in the Statement of Revenues, Expenses, and Changes in Fund Net Assets. This statement measures the results of the Lottery’s operations over the past year. The primary purpose of the Statement of Cash Flows is to provide information about the Lottery’s cash receipts and cash payments during the reporting period. This statement reports cash receipts, cash payments, and net changes in cash resulting from operations, investing, and financing activities. The financial statements are prepared on the accrual basis of accounting in accordance with accounting principles generally accepted in the United States of America. Thus, expenses are recorded when liabilities are incurred and revenues are recognized when earned, not when received.

Analysis of Financial Position and Operations Total assets at June 30, 2009 were $615.8 million, a decrease of $85.9 million from the prior year. The change in assets consists primarily of a decrease in securities lending cash collateral, a decrease in net capital assets, and a decrease in cash and cash equivalents. Securities lending activity fluctuates based on the extent this activity is used by the Office of the State Treasurer for cash management purposes. The decrease in net capital assets is due primarily to depreciation on Video LotterySM terminals which reduced the carrying value of equipment. In order to assist the State with budget challenges, Lottery transferred additional cash during the fiscal year in excess of the required transfer of earnings to the Economic Development Fund, which resulted in a lower cash balance and a lower liability to the Economic Development Fund at year end. Normally, these resources would not have been transferred until the following fiscal year. Total liabilities decreased by $59.8 million from the prior year. This primarily resulted from a decrease of $35.7 million in the amount due to the Economic Development Fund. The amount owed at year end represents the fourth quarter earnings not yet transferred to the Economic Development Fund plus administrative savings. As previously noted, the amount due for the fourth quarter this year is less than the prior year because transfers were made earlier during the fiscal year to provide resources to the State. In addition, obligations under securities lending decreased by $29.9 million. Lottery’s net assets for the current and prior fiscal year are summarized in Table 1 below:
2009 2008 ChangeCurrent assets 418,914,110$ 491,938,081$ (73,023,971)$ Capital assets 95,689,630 109,501,992 (13,812,362) Other noncurrent assets 101,181,108 100,218,207 962,901 Total assets 615,784,848 701,658,280 (85,873,432) Current liabilities 332,107,649 393,070,738 (60,963,089) Noncurrent liabilities 99,634,123 98,517,742 1,116,381 Total liabilities 431,741,772 491,588,480 (59,846,708) Net Assets:Invested in capital assets, net 95,689,630 109,501,992 (13,812,362) Unrestricted 88,353,446 100,567,808 (12,214,362) Total net assets 184,043,076$ 210,069,800$ (26,026,724)$
Table 1: Oregon State Lottery's Net Assets
A large portion of the Lottery’s net assets (52.0 percent) reflects its investment in capital assets, primarily gaming terminals and ticket vending machines. The Lottery has no outstanding debt associated with its capital assets. Of the $88.4 million in unrestricted net assets, $25.3 million is committed for the deployment of new Video LotterySM terminals along with $2.2 million for new games. An additional $9.3 million is committed for an expansion of the Lottery headquarters building and $890,949 is committed through signed contracts for the purchase of other capital assets during fiscal year 2010.
13

Table 2 below presents a summary of changes in net assets for the current and prior fiscal year:
2009 2008 ChangeOperating revenues:
Video LotterySM game sales, net 786,746,726$ 895,111,696$ (108,364,970)$ Scratch-itsSM instant ticket sales 112,105,703 124,704,686 (12,598,983) Keno sales 99,184,396 109,787,942 (10,603,546) Powerball® sales 51,836,316 55,969,079 (4,132,763) MegabucksSM sales 38,065,424 37,149,930 915,494 All other game sales 12,585,752 11,066,363 1,519,389 Provision for bad debts (128,699) (7,797) (120,902) Other income 579,477 1,042,747 (463,270)
Total operating revenues 1,100,975,095 1,234,824,646 (133,849,551) Operating expenses:
Retailer commissions 213,739,988 240,475,998 (26,736,010) Prizes 211,927,565 231,364,323 (19,436,758) Salaries and wages 37,330,819 33,005,670 4,325,149 Depreciation and amortization 37,080,300 30,843,314 6,236,986 Advertising and market research 11,313,552 9,885,584 1,427,968 Services and supplies 10,519,566 8,767,744 1,751,822 Game vendor charges 7,716,930 9,371,513 (1,654,583) Public information 5,326,746 5,463,575 (136,829) Tickets 4,335,016 4,232,601 102,415 Game equipment parts and maintenance 1,850,765 2,485,770 (635,005) Sales support 1,712,391 1,569,079 143,312
Total operating expenses 542,853,638 577,465,171 (34,611,533) Nonoperating revenues (expenses):
Interest and investment income 12,675,701 28,068,310 (15,392,609) Insurance recoveries 61,973 25,570 36,403 Gain (loss) on disposition of assets (1,767,242) (317,204) (1,450,038) Investment expenses - securities lending (808,660) (5,047,007) 4,238,347
Total nonoperating revenues (expenses) 10,161,772 22,729,669 (12,567,897) Income before transfers 568,283,229 680,089,144 (111,805,915) Transfers to the economic development fund (592,846,506) (648,408,187) 55,561,681 Transfers to the general obligation bond fund (1,463,447) (1,317,079) (146,368) Change in net assets (26,026,724) 30,363,878 (56,390,602) Net assets - beginning 210,069,800 179,705,922 30,363,878 Net assets - ending 184,043,076$ 210,069,800$ (26,026,724)$
Table 2: Oregon State Lottery's Changes in Net Assets
The Lottery’s net assets decreased by $26.0 million as a result of fiscal year operations. This decrease is primarily attributable to Video LotterySM revenue which decreased by $108.4 million from the prior fiscal year, a reduction of 12.1 percent. The national and local economic recession impacted the discretionary income of many people, a pattern which is reflected in fewer dollars being spent on Lottery products. In addition, a statewide smoking ban in bars and taverns went into effect during the fiscal year, contributing to the reduction in Video LotterySM revenue. Revenues from Scratch-itsSM game sales declined by $12.6 million, and Keno sales were $10.6 million less than the prior year. The Lottery introduced its first RaffleSM game during the fiscal year, which contributed to an increase in all other game sales. Interest and investment income decreased by
14

54.8 percent from the prior year as a result of a decrease in the market value of investments held at year end, lower interest earnings on cash balances during the year, more frequent transfers of administrative savings, and less investment income from securities lending activity. Overall, net product sales decreased by $133.4 million, or 10.8 percent. Retailer commissions were 11.1 percent lower than the prior year, generally as a result of decreased sales. Commission rates paid by retailers vary based on the games offered (traditional, video line games, or video poker only) and the retailers’ sales volume. Traditional prize expenses were $19.4 million less than the prior year, reflecting lower sales of traditional games such as Scratch-itsSM and Keno. Since revenues for Video LotterySM are reported net of prizes awarded, the prize expenses in Table 2 include only traditional game prizes. Game vendor charges were 17.7 percent lower, corresponding with decreased sales of traditional products. Depreciation expense was $6.2 million higher than last year. The Lottery began to replace many of its Video LotterySM terminals in retailer establishments with new, more advanced terminals last fiscal year in an effort to stimulate player interest. As a result of this decision, the estimated useful life of Video LotterySM terminals was reduced from seven to five years. Since the change was made mid-year last year, depreciation expense for fiscal year 2009 was higher than the prior year. Despite the impact of economic conditions on sales revenue, the Lottery transferred $592.8 million to Oregon’s Economic Development Fund during the fiscal year. This was $55.6 million less than fiscal year 2008 which was the highest amount transferred in the history of the Lottery. Sales Revenue Figure 1 below shows the major sources and percentages of sales revenue for fiscal year 2009:
Figure 1: Sales Revenue by Product
Keno9.0%
Powerball® 4.7%
Video LotterySM
71.5%
MegabucksSM
3.5%All Other Games
1.1%
Scratch-itsSM
10.2%
Video LotterySM remains the largest source of revenue and represents 71.5 percent of total sales revenue. During fiscal year 2009, approximately 1,300 Video LotterySM terminals were replaced with new terminals to offer players the latest graphics and animation technology. While Video LotterySM remains an excellent source of continuing revenue for the State, the Lottery recognizes its obligation to promote responsible gambling behavior. Consistent with its strategic objectives, the Lottery continued in these efforts by developing an
15

updated responsible gambling training video for Lottery retailers. The video was designed to educate retailers on the treatment available for problem gambling and to teach retailers how to talk to customers who may be in need of help. Sales of Scratch-itsSM were the second largest source of revenue during fiscal year 2009. New features were added to Scratch-itsSM tickets to improve the look of the tickets, increase security, and protect players from potential fraud. The tickets now have a bar code that allows players to check their tickets on a Ticket Scan device to see if they have won. In addition, the Lottery continued to introduce a variety of new games at various price points in its efforts to engage new players and maximize revenues for the State. Capital Assets The Lottery’s investment in capital assets for the current and prior fiscal year is shown in Table 3 below. The majority of capital assets used in operations are equipment such as gaming terminals and ticket vending machines.
2009 2008 ChangeEquipment 77,488,597$ 94,248,972$ (16,760,375)$ Buildings and improvements 8,024,057 8,013,446 10,611 Computer software 7,491,689 5,446,542 2,045,147 Vehicles 2,276,740 1,731,237 545,503 Construction in progress 338,796 60,355 278,441 Leasehold improvements 69,751 1,440 68,311 Total 95,689,630$ 109,501,992$ (13,812,362)$
Table 3: Oregon State Lottery's Capital Assets, Net of Depreciation
During fiscal year 2009, net capital assets decreased by $13.8 million, a 12.6 percent decline. The net change is primarily attributed to the purchase of new gaming equipment and software offset by depreciation expense for the year. The Lottery plans to continue deployment of new Video LotterySM terminals next year and refresh games to stimulate player interest; $25.3 million is committed to finalize the deployment of new terminals along with $2.2 million for new games. Additional information on Lottery’s capital assets can be found in Note 6 of this report. Factors Relevant to Next Year’s Budget On a quarterly basis, the Office of Economic Analysis (OEA) forecasts lottery earnings and distributions. In the December 2009 Economic and Revenue Forecast, the OEA projected a decrease in lottery earnings from the prior forecast in September of 2009. The OEA lowered projected Video LotterySM earnings for the 2009-2011 biennium to factor in the continued expected impacts of the economic recession and the smoking restrictions. The Lottery’s fiscal year 2010 budget, as revised for the OEA December 2009 Economic and Revenue Forecast, takes these expected impacts into consideration. The Lottery’s 2010 budget is conservative due to the issues mentioned above, but does make investments to help reduce the impact of the recession and the smoking ban. Approximately $27.5 million in new Video LotterySM terminals and games will be deployed. In addition to the $2.2 million committed for new games, $4.5 million is included in the fiscal year 2010 budget for the purchase of new game sets. These purchases support the Lottery’s strategy to keep product offerings fresh in order to maximize sales. Over the next two fiscal years, new game features will be investigated that will provide the ability to remotely change game content through automated downloads to terminals, offer progressive games, and implement a player loyalty program for Lottery products. These proactive steps will place Lottery in the best position possible to maximize revenues for the State.
16

Basic Financial
Statements

AssetsCurrent Assets:
Cash and Cash Equivalents 230,140,274$ Investments for Prize Payments 13,343,738 Securities Lending Cash Collateral 147,738,751 Accounts Receivable - Net of Allowance for Doubtful Accounts of $211,020 24,891,287 Ticket Inventory 1,862,646 Prepaid Expenses 937,414
Total Current Assets 418,914,110 Noncurrent Assets:
Prize Reserves with Multi-State Lottery (MUSL) 2,816,579 Investments for Prize Payments 98,364,529 Capital Assets:
Equipment 148,748,157 Computer Software 13,875,065 Building and Improvements 12,002,130 Vehicles 3,796,904 Construction in Progress 338,796 Leasehold Improvements 157,233
Less Accumulated Depreciation and Amortization (83,228,655) Total Noncurrent Assets 196,870,738 Total Assets 615,784,848$ Liabilities and Net AssetsCurrent Liabilities:
Accounts Payable 15,408,494$ Compensated Absences 1,809,330 Unearned Revenue 558,382 Deposit Liability 334,437 Prize Liability 32,583,322 Obligations Under Securities Lending 147,738,751 Due to Economic Development Fund 133,674,933
Total Current Liabilities 332,107,649 Noncurrent Liabilities:
Deferred Prize Liability 98,364,529 Compensated Absences 891,162 Net Other Postemployment Benefits (OPEB) Obligation 378,432
Total Noncurrent Liabilities 99,634,123 Total Liabilities 431,741,772 Net Assets:
Invested in Capital Assets 95,689,630 Unrestricted Net Assets 88,353,446
Total Net Assets 184,043,076 Total Liabilities and Net Assets 615,784,848$
The accompanying notes are an integral part of the financial statements.
OREGON STATE LOTTERYBalance SheetJune 30, 2009
18

Operating RevenuesSales:
Video LotterySM (Net Receipts) 786,746,726$ Scratch-itsSM Instant Tickets (Net of Returns) 112,105,703 Keno 99,184,396 Powerball® (MUSL) 51,836,316 MegabucksSM 38,065,424 Win For LifeSM 6,654,104 RaffleSM 2,499,597 Lucky LinesSM 2,042,237 Pick 4SM 1,389,814 Provision for Bad Debts (128,699)
Other Income 579,477 Total Operating Revenues 1,100,975,095
Operating ExpensesRetailer Commissions 213,739,988 Prizes 211,927,565 Salaries and Wages 37,330,819 Depreciation and Amortization 37,080,300 Advertising and Market Research 11,313,552 Services and Supplies 10,519,566 Game Vendor Charges 7,716,930 Public Information 5,326,746 Tickets 4,335,016 Game Equipment Parts and Maintenance 1,850,765 Sales Support 1,712,391
Total Operating Expenses 542,853,638 Operating Income 558,121,457
Nonoperating Revenues (Expenses)Interest and Investment Income 12,675,701 Insurance Recoveries 61,973 Gain (Loss) on Disposition of Assets (1,767,242) Investment Expenses - Securities Lending (808,660)
Total Nonoperating Revenues (Expenses) 10,161,772 Income Before Transfers 568,283,229 Transfers to the Economic Development Fund (592,846,506) Transfers to the General Obligation Bond Fund (1,463,447) Change in Net Assets (26,026,724) Net Assets - Beginning 210,069,800 Net Assets - Ending 184,043,076$
The accompanying notes are an integral part of the financial statements.
OREGON STATE LOTTERYStatement of Revenues, Expenses, and Changes in Fund Net Assets
For the Year Ended June 30, 2009
19

Cash Flows from Operating Activities:Receipts from Customers 1,103,426,608$ Payments to Employees for Services (36,874,742)Payments to Suppliers (254,178,768)Payments to Prize Winners (202,793,808) Other Income 862,425
Net Cash Provided (Used) by Operating Activities 610,441,715
Cash Flows from Noncapital Financing Activities:Transfers to the Economic Development Fund (634,972,381) Transfers to the General Obligation Bond Fund (1,463,447)
Net Cash Provided (Used) by Noncapital Financing Activities (636,435,828)
Cash Flows from Capital and Related Financing Activities:Acquisition of Capital Assets (25,974,742) Proceeds from Disposition of Capital Assets 939,564 Insurance Recoveries for Capital Assets 61,973
Net Cash Provided (Used) by Capital and Related Financing Activities (24,973,205)
Cash Flows from Investing Activities:Purchases of Investments (7,955,079) Proceeds from Sales and Maturities of Investments 14,047,009 Interest on Investments and Cash Balances 6,096,589 Securities Lending Expenses (808,660)
Net Cash Provided (Used) by Investing Activities 11,379,859 Net Increase (Decrease) in Cash and Cash Equivalents (39,587,459) Cash and Cash Equivalents - Beginning 269,727,733 Cash and Cash Equivalents - Ending 230,140,274$
Reconciliation of Operating Income to Net Cash Provided (Used) by Operating Activities:
Operating Income 558,121,457$ Adjustments to Reconcile Operating Income to Net Cash Provided (Used) by Operating Activities:
Depreciation and Amortization 37,080,300 Net Changes in Assets and Liabilities:
(Increase) / Decrease in Accounts Receivable 2,878,389 (Increase) / Decrease in Ticket Inventory 352,169 (Increase) / Decrease in Prepaid Expenses (28,984) (Increase) / Decrease in MUSL Prize Reserves (122,834) Increase / (Decrease) in Accounts Payable 1,809,479 Increase / (Decrease) in Compensated Absences Liability 268,301 Increase / (Decrease) in Other Postemployment Benefits (OPEB) Obligation 187,775 Increase / (Decrease) in Deposit Liability 203,524 Increase / (Decrease) in Unearned Revenue 558,382 Increase / (Decrease) in Prize Liability 9,133,757
Total Adjustments 52,320,258 Net Cash Provided (Used) by Operating Activities 610,441,715$
Noncash Investing, Capital, and Related Financing Activities:Net Change in Fair Value of Investments 6,579,112$
Total Noncash Investing, Capital, and Related Financing Activities 6,579,112$
The accompanying notes are an integral part of the financial statements.
OREGON STATE LOTTERYStatement of Cash Flows
For the Year Ended June 30, 2009
20

21
OREGON STATE LOTTERY Notes to the Financial Statements
June 30, 2009
1. Summary of Significant Accounting Policies
A. Reporting Entity
The Oregon State Lottery Commission (Commission) was created as an agency of the State of Oregon by enactment of Article XV, Section 4 (3), of the Oregon Constitution, an initiative measure approved by Oregon voters at the November 1984 general election. The Commission established the Oregon State Lottery (Lottery), which is an enterprise fund of the State of Oregon. The Lottery commenced operations to market and sell Lottery products to the public in January 1985. The net profits of the Lottery are transferred to the Oregon Economic Development Fund and are then distributed by the State of Oregon to finance the various public purposes allowed by law.
B. Measurement Focus, Basis of Accounting, and Financial Statement Presentation
The accompanying financial statements of the Lottery have been prepared in conformity with generally accepted accounting principles as prescribed by the Governmental Accounting Standards Board (GASB) and the Financial Accounting Standards Board (FASB). FASB standards of accounting and financial reporting issued prior to December 1, 1989 are followed for the Lottery’s financial statements to the extent that those standards do not conflict with or contradict GASB pronouncements. As allowed by GASB standards, the Lottery has elected not to follow subsequent FASB guidance.
The Lottery uses an enterprise fund, the Oregon State Lottery Fund, with a self-balancing set of accounts to record its assets, liabilities, net assets, revenues, and expenses. Enterprise funds account for activities that are financed and operated in a manner similar to private business enterprises.
Lottery financial statements are reported using the economic resources measurement focus and accrual basis of accounting. Revenues are recorded when earned and expenses are recorded when a liability is incurred, regardless of the timing of related cash flows.
Revenues and expenses are categorized as operating or nonoperating in the Statement of Revenues, Expenses and Changes in Fund Net Assets. Operating revenues and expenses are those that result from selling Lottery games to the public. Operating revenues include the sale of Lottery products and incidental revenues associated with operating the Lottery. Operating expenses include the cost of sales and services, administrative expenses, and depreciation on capital assets. Revenues and expenses that do not result from selling Lottery games, such as investment income and investment expenses, are reported as nonoperating revenues and expenses.
Assets and liabilities are classified on the Balance Sheet as current and noncurrent. Current assets are available, or will become available, within the next fiscal year to pay operating expenses and liabilities of the Lottery. Current liabilities are due in the next fiscal year. Noncurrent assets are not easily liquidated or are restricted for purposes other than payment of normal operations and liabilities. Noncurrent liability amounts are due in periods following the upcoming fiscal year.
Total net assets are segregated into two categories: invested in capital assets and unrestricted net assets. The Lottery has no outstanding debt associated with its capital assets. Article XV of the Oregon Constitution restricts the use of Lottery revenues for payment of prizes and administrative expenses, and remaining revenues are to be used for public purposes allowed in Article XV. Net proceeds not yet transferred are reflected in liabilities as the amount due to the Economic Development Fund. Net assets reported at year end will be used for Lottery operations.

Notes to the Financial Statements (continued) June 30, 2009
C. Sales Revenue
Revenues for MegabucksSM, Powerball®, Keno, Win for LifeSM, RaffleSM, Pick 4SM, and Lucky LinesSM (draw games) are recognized when the draws occur. Revenues for instant scratch ticket games are recognized when retailers activate ticket packs for sale to the public. Revenues for Video LotterySM games are recognized when sales to the public occur and are reported net of prizes awarded (refer to Note 8 for more information on Video LotterySM revenue and prize expense). All revenues are reported net of free plays, discounts, and allowances.
D. Unearned Revenue
All draw games can be purchased in advance of the drawings. When shares are sold in advance of the draw date, sales revenue is not yet earned. Unearned revenue includes revenue associated with shares that have been sold for draw dates after June 30, 2009.
E. Prize Expense
Instant ticket prize expense is recognized when ticket packs are activated and is based on the design of the game. Game designs include certain guaranteed prizes in each pack of tickets and prizes are placed randomly throughout the population of tickets by the gaming vendor. When validations for the game have ended, differences between estimated and actual prizes awarded for the randomly placed tickets are reflected in prize expense and prize liability. Guaranteed prizes not claimed by winners are transferred to the Economic Development Fund.
Prize expense for draw games is recognized as drawings are held, based on the shares sold and the estimated or known cost of the prize payments. Prize expense is adjusted as prizes are claimed and the actual cost of the prize is known. Expense for prizes with long-term payments is recognized at the purchase cost of investments needed to fund future prize payments. Any increase in the fair value of the investments is recognized as investment income and prize expense in the fiscal year it is earned. Video LotterySM prize expense is recognized as game play completes and prizes are known. Detailed information is in Note 8.
The cost of Lottery products distributed through various promotional activities is included in ticket expense and any prizes (actual or estimated) are recorded in prize expense. The sales value of these products for the fiscal year ended June 30, 2009 was $245,450.
F. Prize Liability
Prize liability is recorded when the prize expense is recognized (see Note 1.E.). Estimated and known prize payments due within one year of the financial statement date are recorded as a current liability and payments due later than the upcoming year are classified as a noncurrent liability. Unclaimed prizes (winning shares known to be sold and not presented for payment within one year from the draw date or official end of a game) are reclassified from Prize Liability to Due to Economic Development Fund.
G. Cash and Cash Equivalents
Cash and cash equivalents include cash on hand, test cash held by employees, and cash and investments held in the Oregon Short-Term Fund (OSTF). For purposes of the Statement of Cash Flows, all Lottery moneys held by the Office of the State Treasurer in the OSTF are considered to be cash equivalents. The OSTF is an investment pool that functions as a demand deposit account.
H. Investments
Investments are reported at fair value. The fair value of investments is determined using quoted market prices. Changes in the fair value of investments are recognized as investment income (loss) in the current year.
22

Notes to the Financial Statements (continued) June 30, 2009
I. Securities Lending
Securities lending amounts are reported at the value of the cash collateral received. The security lending liability is reported at the cash amount received as collateral.
J. Accounts Receivable
Accounts receivable is reported net of an allowance for uncollectible accounts. Receivables primarily consist of proceeds due from Lottery retailers. Most retailers selling Lottery products are required to remit weekly proceeds (Sunday through Saturday), less commissions, on the following Wednesday. Corporate accounts, those with multiple establishments, are required to remit proceeds on the second Wednesday following the end of the business week.
K. Inventories
Inventories are valued at cost using the specific identification method. Ticket inventory consists of Scratch-itsSM instant tickets primarily stored in the Lottery warehouse. A small amount of inventory is stored at retail establishments. Ticket inventory held in the warehouse is destroyed and recorded as an expense when distributions to retailers are no longer allowed. Tickets not sold at retail establishments are recorded as an expense when activations are no longer allowed.
L. Prize Reserves
Prize reserves held by the Multi-State Lottery (MUSL) are amounts held to indemnify participating lotteries for prizes that may be won. Should the Lottery decide against participation in MUSL, these amounts would be returned.
M. Capital Assets
Capital assets, which mainly include gaming equipment and related software, are reported at historical cost. Assets with a cost of $5,000 or more and a useful life of more than one year are capitalized. Capital assets are depreciated using the straight-line method over the following estimated useful lives:
Assets YearsBuildings and improvements 10 to 40Video lottery terminals 5Instant ticket vending machines 5Other machinery and equipment 3 to 8Leasehold improvements 5Vehicles 5Computer hardware and software 3
During the fiscal year ended June 30, 2009, the estimated useful life of vehicles was changed from three years to five years based on an analysis of past actual usage.
N. Compensated Absences
Employees earn annual vacation leave of 10 to 19.34 hours per month, depending upon length of service. All Lottery employees may accumulate a maximum of 350 hours per employee. During fiscal year 2009, employees who were subject to furloughs (about 26 percent of Lottery employees) were temporarily allowed to accumulate up to 425 hours of vacation leave from March 1 through June 30, 2009. Accumulated vacation leave and accumulated compensatory time is recorded as an expense and a liability (compensated absences) as the benefits accrue to employees. The compensated absences liability is calculated based upon salary rates in effect at fiscal year end and
23

Notes to the Financial Statements (continued) June 30, 2009
includes taxes and retirement costs. No liability is reported for accumulated sick leave benefits since employees are not paid for unused sick leave benefits when leaving State service.
2. Stewardship and Legal Compliance
A.
compliance with the approved budget and appropriate adjustments, if necessary, are presented to the Commission for approval. A comparison of revenues and expenses to the final
inancial Plan is presented as supplementary information in this report.
B.
venues be returned to the public in the form of prizes, and that no more than 16 percent of total annual revenues may be allocated for the payment of administrative expenses.1 The following table shows that for fiscal
Budgetary Compliance
The Oregon State Lottery is exempt from State of Oregon Budget Laws. For budgeting purposes, the Commission adopts an annual Financial Plan based on activities identified in Lottery’s annual Business Plan and revenue forecasts prepared by the Oregon Department of Administrative Services, Office of Economic Analysis. Quarterly, budgeted revenues and direct expenses (prizes, commissions, game vendor charges, and tickets) are revised for changes to the revenue forecasts. Revisions to other expense items in the adopted budget must be approved by the Commission. The budget is prepared on the accrual basis of accounting. Actual expenses are monitored throughout the year for
revised and approved fiscal year 2009 F
Use of Revenues and Net Revenues
Article XV of the Oregon Constitution requires that all prizes and expenses of the Lottery be paid from Lottery revenues and any remaining proceeds be used to benefit the public purposes of economic development, public education, or restoring and protecting parks, beaches, watersheds and critical fish and wildlife habitats. ORS 461.500 requires that at least 84 percent of the total annual revenues be returned to the public in the form of prizes and net revenues benefiting the public purposes in the Constitution, that at least 50 percent of the total annual re
year 2009 the Lottery operated within the legal limits defined by ORS 461.500:
Traditional Lottery Video LotterySM Total
RevenuesSales (Net of Provision for Bad Debt) 313,762,158$ 10,582,813,231$ 10,896,575,389$ Other Distributable Income 366,432 3,463,087 3,829,519
Total Distributable Revenue 314,128,590$ 10,586,276,318$ 10,900,404,908$
Distribution of RevenuesRevenues Returned to the Public:
Prizes to the Public 199,711,704$ 9,795,408,628$ 9,995,120,332$ 91.69%Unclaimed Prizes Paid/Due to
Economic Development Fund 0.06%Transfers Paid/Due to Economic
Development Fund 5.20%Total Revenues Returned to the Public 259,107,609 10,309,240,398 10,568,348,007 96.95%
Administrative Expenses 55,020,981 277,035,920 332,056,901 3.05%Total Rev nue Distribution 314,128,590$ 10,586,276,318$ 10,900,404,908$ 100.00%
53,759,156 513,060,627 566,819,783
5,636,749 771,143 6,407,892
e
1 Attorney General Opinion No. 8220 advises that ORS 461.548 regarding Video LotterySM proceeds is unconstitutional and is not applicable. It is not included here.
24

Notes to the Financial Statements (continued) June 30, 2009
C. Unclaimed Prizes
ORS 461.500 requires all unclaimed prizes to be allocated to the benefit of public purpose. Lottery administrative rules declare a prize as unclaimed when it is known that winning shares have been sold and have not been redeemed within one year of the end of the game, one year from the draw date, or one year from the date of issue. In fiscal year 2009, prizes in the amount of $6,407,892 were determined to be unclaimed and were either transferred or accrued for transfer to the Economic Development Fund.
D. Contingency Reserve
ORS 461.510 (4) and Administrative Rule 177-010-0045 allows for the creation of a contingency reserve. In June 2005, the Lottery Commission approved a contingency reserve amount such that the cash available for future investment does not exceed $45,000,000. The following table shows the liquidity detail of Unrestricted Net Assets shown on the Balance Sheet at June 30, 2009:
Cash Available for Future Investment (Uncommitted Contingency Reserve) 45,000,000$ Committed by Contract for Asset Purchases (See Note 12.A.) 26,334,400 Committed by Commission for Fiscal Year 2010 Capital Purchases 11,402,407 Inventory, Prepaid Expenses, Prize Reserves 5,616,639 Total Unrestricted Net Assets 88,353,446$
E. Transfers to Economic Development Fund
All income remaining after Transfers to the General Obligation Bond Fund plus an additional $26,026,724 of prior year Unrestricted Net Assets was accrued for Transfer to the Economic Development Fund. Actual cash transferred, including unclaimed prizes, during fiscal year 2009 was $634,972,381. The remaining balance is included on the Balance Sheet in liabilities. The following schedule reconciles the amounts:
Balance Owed at June 30, 2008
Amounts Accrued
Cash Paid to Economic
Development
Balance Remaining at June 30, 2009
Income 167,732,112$ 592,846,506$ 628,578,342$ 132,000,276$ Unclaimed Prizes 1,660,804 6,407,892 6,394,039 1,674,657 Total 169,392,916$ 599,254,398$ 634,972,381$ 133,674,933$
3. Deposits
The Office of the State Treasurer maintains the Oregon Short-Term Fund (OSTF), an investment pool available for use by state agencies and local governments. The Lottery uses the OSTF for all deposits.
The custodial credit risk for deposits is the risk that, in the event of a bank failure, the State Treasurer will not be able to recover deposits or will not be able to recover collateral securities that are in the possession of an outside party. The Lottery does not have a policy regarding custodial credit risk for deposits; however, the insurance and collateral requirements for deposits in the OSTF are established by banking regulations and Oregon law.
A bank depository that holds public fund deposits in excess of amounts insured or guaranteed is required to pledge collateral with a value at least equal to its maximum liability and as otherwise prescribed in Oregon Revised Statute (ORS) 295.001 to 295.108. The maximum liability for a well capitalized bank depository is 10 percent of the greater of: all public funds held by the bank depository as shown on the most recent treasurer report; the average of the balances of public funds held by the bank depository as
25

Notes to the Financial Statements (continued) June 30, 2009
shown on the last four immediately preceding treasurer reports; or an amount otherwise prescribed in ORS 295.001 to 295.108. The maximum liability for an adequately capitalized bank depository is 25 percent of the greater of: all public funds held by the bank depository as shown on the most recent treasurer report; the average of the balances of public funds held by the bank depository as shown on the last four immediately preceding treasurer reports; or an amount otherwise prescribed in ORS 295.001 to 295.108. The maximum liability for an undercapitalized bank depository is 110 percent of the greater of: all public funds held by the bank depository or the average of the balances of public funds held by the bank depository as shown on the last four immediately preceding treasurer reports. In addition, the State Treasurer may require any bank depository that holds public funds to pledge collateral with a value not less than 110 percent of the greater of all public funds held by the bank depository or the average of the balances of public funds held by the bank depository as shown on the last four immediately preceding treasurer reports.
All deposits in the OSTF are with financial institutions participating in the FDIC’s Transaction Account Guarantee Program. Under that program, through December 31, 2009, all noninterest-bearing transaction accounts are fully guaranteed by the FDIC for the entire amount in the account. Coverage under the Transaction Account Guarantee Program is in addition to and separate from the coverage available under the FDIC’s general deposit insurance rules. Consequently, the bank balance of the OSTF at June 30, 2009 is fully insured.
4. Investments
The State Treasurer is the Investment Officer for the State of Oregon. Investment standards are established in ORS 293.726 and require funds to be managed as a prudent investor would do. The Lottery does not have an investment policy.
A. Custodial Credit Risk
The custodial credit risk for investments is the risk that, in the event of the failure of the counterparty to a transaction, the State Treasurer will not be able to recover the value of investment or collateral securities that are in the possession of an outside party. Lottery’s investments with the Office of the State Treasurer are registered in street name and held with the State Treasurer’s agent in the name of the State of Oregon and segregated in the Treasurer’s records in Lottery’s name.
B. Credit Risk and Concentration of Credit Risk
Credit risk is the risk that an issuer or other counterparty to an investment will not fulfill its obligations. The Lottery holds $38,915,095 of investments in the Resolution Funding Corporation (RFC), a U.S. government agency. These investments are not explicitly guaranteed by the U.S. government. As of June 30, 2009, investments in RFC were not rated by the major rating agencies, but the underlying securities were rated Aaa by Moody’s.
Concentration of credit risk is the risk of loss attributed to the magnitude of investments in a single issuer. The $38,915,095 of investments in the RFC represents 34.8 percent of the Lottery’s investment holdings.
C. Interest Rate Risk
Interest rate risk is the risk that changes in interest rates will adversely affect the fair value of an investment. The length of time until maturity affects the exposure of the investment to fair value fluctuations. Lottery’s investments are purchased to closely match the liability stream for prize payouts and are intended to be held until maturity.
26

Notes to the Financial Statements (continued) June 30, 2009
The following table shows the segmented time distribution of the fair value of all Lottery investments at June 30, 2009:
Investm ent TypeLess than 1
Year 1-5 Years 6-10 YearsM ore Than 10
Years Fair ValueU .S . Agency S trips 7,433,926$ 20 ,918,000$ 8 ,995,762$ 1 ,567,407$ 38 ,915,095$ U .S . Treasury S trips 5,909,812 23 ,067,143 19,492,060 24 ,324,157 72 ,793,172 Total Investm ents 13,343,738$ 43,985,143$ 28,487,822$ 25,891,564$ 111,708,267$
Investm ent Maturities in Years
5. Securities Lending
In accordance with State of Oregon (State) investment policies, state agencies may participate in securities lending. The Office of the State Treasurer has authorized its custodian to act as its agent in the lending of the State’s securities pursuant to a form of loan agreement. There were no significant violations of the provisions of securities lending agreements during the fiscal year.
During fiscal year 2009, the State’s securities lending agent lent short-term and fixed income securities from the OSTF and U.S. Government securities segregated to the Lottery and received as collateral U.S. dollar-denominated cash. Borrowers were required to deliver cash collateral for each loan equal to not less than 102 percent of the market value of the loaned securities. The State did not impose any restrictions during the fiscal year on the amount of the loans the securities lending agent made on its behalf. The State did not have the ability to pledge or sell collateral securities absent a borrower default; however, the Lottery and the State, through the State Treasurer’s Securities Lending Agreements, are fully indemnified against losses due to borrower default. There were no losses during the year from the failure of borrowers to return loaned securities.
During the year, the State and borrowers maintained the right to terminate all securities lending transactions on demand. As a consequence, the maturities of investments made with cash collateral generally did not match the maturities of the securities loans. On June 30, 2009, the State and the Lottery had no credit risk exposure to borrowers related to securities on loan.
As of June 30, 2009, the total fair value of securities on loan from the OSTF was $3,843,361,213, the cash collateral received was $3,923,673,246 and the fair value of invested collateral was $3,890,281,485. Collateral received for OSTF and Lottery investments is invested in a securities lending collateral pool and is not exposed to custodial credit risk.
The Lottery’s allocated portion of the OSTF securities on loan and Lottery owned investments on loan at June 30, 2009, is presented in the following schedule:
Fair Value of Securities on Loan
Cash Collateral Received
Fair Value of Invested Collateral
Lottery Share OSTF $ 105,095,798 $ 107,291,911 $ 106,378,821 Lottery Investments 39,681,337 40,446,840 40,102,624 Total $ 144,777,135 $ 147,738,751 $ 146,481,445
Securities Lending Balances
27

Notes to the Financial Statements (continued) June 30, 2009
6. Capital Assets
Capital asset activity for the year ended June 30, 2009, is shown in the schedule below:
Beginning Balance Increases Decreases
Ending Balance
Depreciable Capital AssetsEquipment 145,486,419$ 19,249,174$ (15,987,436)$ 148,748,157$ Vehicles 3,653,571 1,098,134 (954,801) 3,796,904 Building and Improvements 11,592,483 409,647 - 12,002,130 Leasehold Improvements 73,164 84,069 - 157,233 Computer Software 12,037,900 5,056,108 (3,218,943) 13,875,065
Total Assets Being Depreciated 172,843,537 25,897,132 (20,161,180) 178,579,489
Accumulated DepreciationEquipment 51,237,447 33,808,737 (13,786,624) 71,259,560 Vehicles 1,922,334 285,063 (687,233) 1,520,164 Building and Improvements 3,579,037 399,035 - 3,978,072 Leasehold Improvements 71,724 15,758 - 87,482 Computer Software 6,591,358 2,571,707 (2,779,688) 6,383,377
Total Accumulated Depreciation 63,401,900 37,080,300 (17,253,545) 83,228,655
Capital Assets Not Being DepreciatedConstruction in Progress 60,355 278,441 - 338,796
Capital Assets, Net 109,501,992$ (10,904,727)$ (2,907,635)$ 95,689,630$
7. Long-term Liabilities
As of June 30, 2009, there were 77 Oregon Lottery game winners with long-term annual payments and three Multi-State Lottery game winners with long-term annual payments. The estimated number of years remaining for payments ranges from one to 42 years. Current prize liability shown on the Balance Sheet includes $19,239,584 in estimated and actual prizes won that have not yet been claimed.
The following schedule presents changes in long-term liabilities as well as the amounts due in the next fiscal year:
Beginning Balance Increases Decreases
Ending Balance
Due Within One Year
Prizes 128,221,986$ 213,561,673$ (210,835,808)$ 130,947,851$ 32,583,322$ Compensated Absences 2,432,191 555,792 (287,491) 2,700,492 1,809,330 Net OPEB Obligation 190,657 187,775 - 378,432 - Total 130,844,834$ 214,305,240$ (211,123,299)$ 134,026,775$ 34,392,652$
Long-term Liabilities
28

Notes to the Financial Statements (continued) June 30, 2009
8. Video LotterySM Net Revenue
Video LotterySM revenue is reported net of prize expense in the Statement of Revenues, Expenses, and Changes in Fund Net Assets. The following schedule reconciles cash received with actual wagering and prize activity:
Cash Received 2,537,950,774$ Cash Paid Out 1,751,204,048$ Dollars W on and Played 8,044,975,723 Dollars Won and Played 8,044,975,723 Total Revenue 10,582,926,497$ Total Prizes 9,796,179,771$
Net Revenue = 786,746,726$
Revenue Prize Expense
9. Discounts and Allowances
Revenues are reported net of discounts, free plays and allowances in the Statement of Revenues, Expenses and Changes in Fund Net Assets. For the fiscal year ended June 30, 2009, sales revenue is reported net of $1,133,392 in discounts and free plays and net of $128,699 in allowances.
10. Joint Venture
The Multi-State Lottery Association (MUSL) was established September 16, 1987, to coordinate lottery games with larger prizes than the individual states could offer by themselves. The Oregon Lottery has been a participating member since the inception of MUSL. Each participating state sells its choice of MUSL products and keeps all profits earned. Participating states contribute amounts necessary to fund the estimated and actual prizes won, reserve prize pools, and the operating expenses of MUSL. The Oregon Lottery’s share of MUSL’s operating expenses for the fiscal year ended June 30, 2009, was $20,000.
MUSL is governed by a board on which each member lottery is represented. Each member lottery has one vote. The Board’s responsibilities to administer multi-state lottery games are performed through product groups, advisory committees, or panels staffed by officers and independent contractors as appointed by the Board. These officers and consultants serve at the pleasure of the Board and the Board prescribes their powers, duties, and qualifications. The Executive Committee carries out the budgeting and financing of MUSL, and the Board contracts annually with an independent auditor. Upon termination of the MUSL’s existence, if such termination should occur, the member lottery would receive any proceeds determined available for distribution by the Board.
The fiscal year end for MUSL is June 30. Long-term liabilities of MUSL are limited to prize annuities due, which are fully funded through investments in U.S. Government Securities.
The following schedule presents the summarized financial activity of MUSL as of June 30, 2009 and June 30, 2008 (in thousands):
2009 2008Assets 816,490$ 899,702$ Total Assets 816,490$ 899,702$
Liabilities 815,696$ 899,427$ Net Assets - Unrestricted 794 275 Liabilitites and Net Assets 816,490$ 899,702$
Unrestricted Revenues 4,818$ 11,168$ Unrestricted Expenses 4,299 11,090 Change in Unrestricted Net Assets 519$ 78$
29

Notes to the Financial Statements (continued) June 30, 2009
Separate financial statements for MUSL may be obtained from the Multi-State Lottery Association, Attention: Chuck Strutt, 4400 NW Urbandale Drive, Urbandale, Iowa, 50322.
11. Operating Lease Commitments
Operating leases are agreements for the use of property, plant or equipment. As of June 30, 2009, there were two lease agreements in effect that had a noncancelable lease term in excess of one year. The agreements cover video system equipment and equipment for the traditional (instant and draw game) sales processing system.
The original video agreement began in fiscal year 1996, and the most recent contract amendment extended the agreement through October 4, 2010. The agreement includes all necessary equipment for a central and backup video host system and has flat monthly rates of $147,603.
The traditional system agreement was signed on October 3, 2007 and is effective through November 22, 2015. The Lottery is allowed, through one or more amendments, to extend the contract up to ten years from the system conversion date. The Lottery currently leases 430 self-service kiosks for $186.75 per month, per kiosk; and 3,100 monitors for $7.50 per monitor, per month.
Lease expense for fiscal year 2009 for the video and traditional system equipment was $2,496,104. Future minimum lease payments for these two lease agreements as of June 30, 2009 are shown in the schedule below:
Year Ending June 30,Operating
Leases2010 3,013,866$ 2011 1,833,042 2012 1,242,630 2013 1,242,630 2014 1,242,630
2015-2016 1,656,840 Total Future Minimum Lease Payments 10,231,638$
Future Minimum Lease Payments
12. Other Significant Commitments and Contingencies
A. Commitments
At June 30, 2009, the Lottery had contractual commitments of $26,334,400 for the purchase of gaming equipment and software. The purchases are expected to occur in the upcoming fiscal year. In addition, the Lottery contracts for services and the use of software associated with processing transactions for its traditional products. The contractor is paid a commission of 1.6999 percent of net sales for all traditional products. In fiscal year 2009, the Lottery had expenses of $5,342,268 for traditional product commissions. The amount is included in Game Vendor Charges on the Statement of Revenues, Expenses, and Changes in Fund Net Assets.
B. Unemployment Benefits
State employees who qualify are entitled to benefit payments during periods of unemployment. Each state agency is required to reimburse the Employment Department for benefit payments made to former employees. There appears to be no practical method of estimating the amount of future benefit payments that may be made to former employees for wage credits earned prior to fiscal year end. Consequently, this potential obligation is not reported in the accompanying financial statements. Total reimbursements for unemployment benefits for the fiscal year ended June 30, 2009 were $38,979.
30

Notes to the Financial Statements (continued) June 30, 2009
13. Employee Retirement Plans
The Oregon Public Employees Retirement System (PERS) administers retirement plans for eligible Lottery employees. PERS is administered by the Public Employees Retirement Board (Board), as required by Chapters 238 and 238A of the Oregon Revised Statutes. PERS issues a publicly available financial report that includes financial statements and required supplementary information. That report may be obtained by writing to PERS Fiscal Services Division, 11410 SW 68th Parkway, Tigard, Oregon 97223.
A. Public Employees Retirement System Pension (Chapter 238)
Lottery employees who were plan members before August 29, 2003, participate in the Public Employees Retirement System (PERS) Pension, a cost-sharing multiple-employer defined benefit plan. The PERS retirement allowance is payable monthly for life and may be selected from several retirement benefit options. These options include survivorship benefits and lump sum payments. PERS also provides death and disability benefits. The Legislature has authority to establish and amend PERS pension benefits.
The Board establishes employer contributions based on actuarially determined rates. The funding policies provide for monthly employer contributions. The Lottery is required by statute to contribute actuarially computed amounts. The employer rate for a covered employee’s salary for fiscal year 2009 was 6.07 percent. Lottery contributions for the fiscal year ended June 30, 2009, were approximately $1,175,000. Contributions for fiscal year 2008 were approximately $1,036,000 and $1,330,000 for fiscal year 2007. These contributions were equal to the required contributions for each year. Beginning January 1, 2004, plan member contributions were no longer contributed to the PERS plan.
B. Oregon Public Service Retirement Plan (Chapter 238A)
The 2003 Oregon Legislature created the Oregon Public Service Retirement Plan (OPSRP), also a cost-sharing multiple-employer plan. OPSRP is a hybrid pension plan with two components: the Pension Program (defined benefit) and the Individual Account Program (defined contribution). Lottery employees hired after August 28, 2003 participate in OPSRP after completing six months of service. The OPSRP Pension Program provides a monthly pension payable for life as well as death and disability benefits. The Legislature has authority to establish and amend OPSRP pension benefits.
The Board establishes employer contributions based on actuarially determined rates. The funding policies provide for monthly employer contributions. The Lottery is required by statute to contribute actuarially computed amounts. The employer rate for a covered employee’s salary for fiscal year 2009 was 7.74 percent. Lottery contributions for the fiscal year ended June 30, 2009, were approximately $399,000. Contributions for fiscal year 2008 were approximately $261,000 and $151,000 for fiscal year 2007. These contributions were equal to the required contributions for each year.
Beginning January 1, 2004, PERS members became members of the Individual Account Program (IAP) portion of OPSRP. PERS members retain their existing PERS accounts, but member contributions are now deposited in the IAP account rather than into the member’s PERS account. All covered employees are required by state statute to contribute 6.0 percent of their salary to the IAP. Current law permits employers to pay the employee contribution, which the Lottery has elected to do. The amount contributed by Lottery on behalf of employees for the fiscal years ended June 30, 2009, 2008, and 2007 were approximately $1,465,000, $1,304,000, and $1,170,000, respectively. These contributions were equal to the required contributions for each year.
31

Notes to the Financial Statements (continued) June 30, 2009
14. Other Postemployment Benefit Plans
The Public Employees Retirement Board contracts for healthcare insurance coverage on behalf of members of the Public Employees Retirement System (PERS). Retirees who are eligible for PERS healthcare coverage pay their own age-adjusted premiums. PERS administers two separate defined benefit other postemployment benefit (OPEB) plans. The Public Employees Benefit Board (PEBB) also administers an OPEB plan. Lottery retirees may be eligible to participate in any of these three OPEB plans.
A. Retirement Health Insurance Account
Plan Description. The Retirement Health Insurance Account (RHIA) is a cost-sharing multiple-employer defined benefit OPEB plan administered by PERS. As authorized by ORS 238.420, the RHIA plan provides a subsidy payment of up to $60 toward the monthly cost of PERS-sponsored health insurance for eligible PERS members. The Legislature has authority to establish and amend benefit provisions. PERS issues a publicly available report that includes financial statements and required supplementary information. That report may be obtained by writing to PERS Fiscal Services Division, 11410 SW 68th Parkway, Tigard, Oregon 97223. Funding Policy. ORS 238.420 provides that contribution requirements of the participating employers be established and may be amended by the Public Employees Retirement Board (Board). The Board establishes the employer contribution rate based on the annual required contribution (ARC) of the employers, an amount actuarially determined in accordance with the parameters of GASB Statement No. 45. The ARC represents a level of funding that, if paid on an ongoing basis, is projected to cover normal cost each year and amortize any unfunded actuarial liabilities (or funding excess) over a period not to exceed thirty years. For the fiscal year ended June 30, 2009, the Lottery was required by statute to contribute 0.37 percent of PERS covered payroll and 0.26 percent of OPSRP covered payroll to fund the RHIA. Actual employer contributions made by Lottery for the current year were approximately $85,000. Contributions for fiscal year 2008 and 2007 were approximately $77,000 and $99,000 respectively. Contributions were equal to the required contributions for each year. Plan members do not contribute to the RHIA plan.
B. Retiree Health Insurance Premium Account
Plan Description. The Retiree Health Insurance Premium Account (RHIPA) is a single-employer defined benefit OPEB plan administered by PERS. As authorized by ORS 238.415, the RHIPA plan provides for payment of the average difference between the health insurance premiums paid by retired state employees, under contracts entered into by the Public Employees Retirement Board, and health insurance premiums paid by state employees who are not retired. The Legislature has authority to establish and amend benefit provisions. PERS issues a publicly available report that includes financial statements and required supplementary information. That report may be obtained by writing to PERS Fiscal Services Division, 11410 SW 68th Parkway, Tigard, Oregon 97223. Funding Policy. ORS 238.415 provides that employer contributions be established and may be amended by the Public Employees Retirement Board (Board). The Board establishes the employer contribution rate based on the annual required contribution (ARC) of the employer, an amount actuarially determined in accordance with the parameters of GASB Statement No. 45. The ARC represents a level of funding that, if paid on an ongoing basis, is projected to cover normal cost each year and amortize any unfunded actuarial liabilities (or funding excess) over a period not to exceed thirty years. For the fiscal year ended June 30, 2009, the Lottery was required by statute to contribute 0.1 percent of PERS covered payroll and 0.03 percent of OPSRP covered payroll to fund the RHIPA. Plan members do not contribute to the RHIPA plan.
32

Notes to the Financial Statements (continued) June 30, 2009
Annual OPEB Cost. For the fiscal year ended June 30, 2009, the Lottery’s annual OPEB cost (expense) was approximately $21,000 for the RHIPA which was equal to the ARC. Fiscal year 2008 and 2007 OPEB costs were approximately $19,000 and $22,000 respectively, and were equal to the ARC for each year. The State of Oregon’s annual OPEB cost, the percentage of annual OPEB cost contributed to the plan, and the net OPEB obligation for fiscal year 2009 and the two preceding years were as follows:
Fiscal Year Ended
Annual OPEB Cost
Percentage of Annual OPEB
Cost ContributedNet OPEB Obligation
6/30/2007 2,400,000$ 100% -$ 6/30/2008 1,791,000 100% - 6/30/2009 2,005,000 100% -
RHIPA OPEB Plan - Annual OPEB Cost
Funded Status and Funding Progress. The funded status of the RHIPA plan as of December 31, 2008, the most recent actuarial valuation, was as follows (dollars in millions):
Actuarial Accrued Liability (AAL) 21.3$ Actuarial Value of Plan Assets 5.7 Unfunded Actuarial Accrued Liability (UAAL) 15.6$ Funded Ratio (Actuarial Value of Plan Assets/AAL) 26.7%Covered Payroll 2,217.9$ UAAL as a Percentage of Covered Payroll 0.7%
RHIPA OPEB Plan - Funded Status
Actuarial valuations involve estimates of the value of reported amounts and assumptions about the probability of events far into the future. Examples include assumptions about future employment, mortality, and the healthcare cost trend. Amounts determined regarding the funded status of the plan and the annual required contributions of the employer are subject to continual revision as actual results are compared with past expectations and new estimates are made about the future. The schedule of funding progress, presented as required supplementary information following the notes to the financial statements, presents multi-year trend information that shows whether the actuarial value of plan assets is increasing or decreasing over time relative to the actuarial accrued liabilities for benefits. Actuarial Methods and Assumptions. Projections of benefits for financial reporting purposes are based on the substantive plan (the plan as understood by the employer and plan members) and include the types of benefits provided at the time of each valuation and the historical pattern of sharing of benefit costs between the employer and plan members to that point. The actuarial methods and assumptions used include techniques that are designed to reduce short-term volatility in actuarial accrued liabilities and the actuarial value of assets, consistent with the long-term perspective of the calculations. In the December 31, 2008 actuarial valuation, the projected unit credit actuarial cost method was used. The actuarial value of plan assets is equal to the fair market value of assets on the valuation date. The actuarial assumptions include: an 8.0 percent investment rate of return; projected payroll growth of 3.75 percent; an inflation assumption of 2.75 percent; and an annual healthcare cost trend rate graded from 7.0 percent in 2009 to 4.5 percent in 2029. The unfunded actuarial accrued liability for the RHIPA plan is being amortized as a level percentage of payroll using a remaining closed amortization period of 10 years.
33
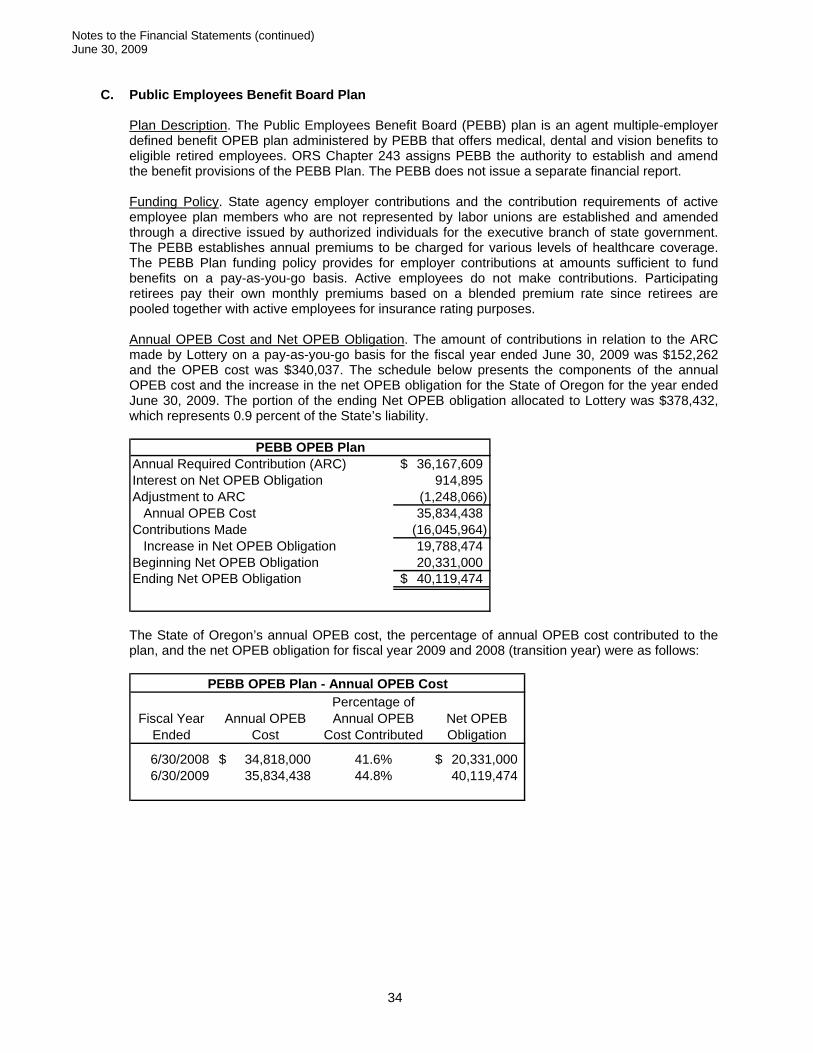
Notes to the Financial Statements (continued) June 30, 2009
C. Public Employees Benefit Board Plan
Plan Description. The Public Employees Benefit Board (PEBB) plan is an agent multiple-employer defined benefit OPEB plan administered by PEBB that offers medical, dental and vision benefits to eligible retired employees. ORS Chapter 243 assigns PEBB the authority to establish and amend the benefit provisions of the PEBB Plan. The PEBB does not issue a separate financial report. Funding Policy. State agency employer contributions and the contribution requirements of active employee plan members who are not represented by labor unions are established and amended through a directive issued by authorized individuals for the executive branch of state government. The PEBB establishes annual premiums to be charged for various levels of healthcare coverage. The PEBB Plan funding policy provides for employer contributions at amounts sufficient to fund benefits on a pay-as-you-go basis. Active employees do not make contributions. Participating retirees pay their own monthly premiums based on a blended premium rate since retirees are pooled together with active employees for insurance rating purposes. Annual OPEB Cost and Net OPEB Obligation. The amount of contributions in relation to the ARC made by Lottery on a pay-as-you-go basis for the fiscal year ended June 30, 2009 was $152,262 and the OPEB cost was $340,037. The schedule below presents the components of the annual OPEB cost and the increase in the net OPEB obligation for the State of Oregon for the year ended June 30, 2009. The portion of the ending Net OPEB obligation allocated to Lottery was $378,432, which represents 0.9 percent of the State’s liability.
Annual Required Contribution (ARC) 36,167,609$ Interest on Net OPEB Obligation 914,895 Adjustment to ARC (1,248,066) Annual OPEB Cost 35,834,438 Contributions Made (16,045,964) Increase in Net OPEB Obligation 19,788,474 Beginning Net OPEB Obligation 20,331,000 Ending Net OPEB Obligation 40,119,474$
PEBB OPEB Plan
The State of Oregon’s annual OPEB cost, the percentage of annual OPEB cost contributed to the plan, and the net OPEB obligation for fiscal year 2009 and 2008 (transition year) were as follows:
Fiscal Year Ended
Annual OPEB Cost
Percentage of Annual OPEB
Cost ContributedNet OPEB Obligation
6/30/2008 34,818,000$ 41.6% 20,331,000$ 6/30/2009 35,834,438 44.8% 40,119,474
PEBB OPEB Plan - Annual OPEB Cost
34

Notes to the Financial Statements (continued) June 30, 2009
Funded Status and Funding Progress. The funded status of the PEBB plan as of July 1, 2007, the most recent actuarial valuation, was as follows (dollars in millions):
Actuarial Accrued Liability (AAL) 323.4$ Actuarial Value of Plan Assets - Unfunded Actuarial Accrued Liability (UAAL) 323.4$ Funded Ratio (Actuarial Value of Plan Assets/AAL) 0.0%Covered Payroll 2,187.2$ UAAL as a Percentage of Covered Payroll 14.8%
PEBB OPEB Plan - Funded Status
Actuarial valuations involve estimates of the value of reported amounts and assumptions about the probability of events far into the future. Examples include assumptions about future employment, mortality, and the healthcare cost trend. Amounts determined regarding the funded status of the plan and the annual required contributions of the employer are subject to continual revision as actual results are compared with past expectations and new estimates are made about the future. The schedule of funding progress, presented as required supplementary information following the notes to the financial statements, presents multi-year trend information that shows whether the actuarial value of plan assets is increasing or decreasing over time relative to the actuarial accrued liabilities for benefits.
Actuarial Methods and Assumptions. Projections of benefits for financial reporting purposes are based on the substantive plan (the plan as understood by the employer and plan members) and include the types of benefits provided at the time of each valuation and the historical pattern of sharing of benefit costs between the employer and plan members to that point. The actuarial methods and assumptions used include techniques that are designed to reduce short-term volatility in actuarial accrued liabilities and the actuarial value of assets, consistent with the long-term perspective of the calculations. In the July 1, 2007 actuarial valuation, the entry age normal actuarial cost method was used. Significant actuarial assumptions include: a 4.5 percent rate of return on the investment of present and future assets; a medical healthcare cost trend rate graded from an average of 11.2 percent in 2008 to an average of 5.0 percent in 2024; and a dental healthcare cost trend rate graded from an average of 5.3 percent in 2008 to an average of 4.0 percent for 2017 and beyond. The unfunded actuarial accrued liability for the PEBB plan is being amortized using the level dollar amortization method and an open amortization period of 30 years.
15. Risk Financing
The State of Oregon administers property and casualty insurance programs covering State government through its Insurance Fund (included in the Central Services Fund). The Insurance Fund services claims for: direct physical loss or damage to state property; tort liability claims brought against the State, its officers, employees, or agents; workers’ compensation; employee dishonesty; and faithful performance coverage for certain positions required by law to be covered and other key positions.
As a state agency, the Lottery participates in the Insurance Fund. The cost of servicing insurance claims and payments is covered by charging an assessment to each state agency based on its share of services provided in a prior period. The total statewide assessment for each coverage type is based on independent biennial actuarial forecasts and administrative costs, less any available equity in the Insurance Fund from the prior biennium. Lottery’s fiscal year 2009 share of the 2007-2009 biennial assessment was $430,119. For the Lottery, the amount of claim settlements did not exceed insurance coverage for each of the past three fiscal years.
35

36
This page intentionally left blank.

Required Supplementary
Information

38
Required Supplementary InformationSchedules of Funding ProgressOther Postemployment Benefit Plans(Dollars in Millions)
Public Employees Benefit Board (PEBB) Plan
Actuarial Valuation
Actua Value of Assets
Unfunded AAL
(UAAL)Funded Ratio
Covered Payroll
Date (a) (b) (b-a) (a/b) (c)
7/1/2007 0$ 323.4$ 323.4$ 0% 2,187.2$ 14.8%
Retiree Health Ins
Actuarial Valuation
ActuaValue of Assets
Covered Payroll
Date (a) (c)
12/31/2003 4.0$ 25.0$ 21.0$ 16.0% 1,711.9$ 1.2%12/31/20041 5.2 28.2 23.0 18.4% 1,851.4 2 1.2%12/31/2005 6.1 27.0 20.9 22.7% 1,827.0 1.1%12/31/2006 7.0 23.4 16.4 30.0% 1,946.8 0.8%12/31/2007 7.8 23.3 15.5 33.6% 2,080.2 0.7%12/31/2008 5.7 21.3 15.6 26.7% 2,217.9 0.7%
Notes to the Required Supplementary Information – Schedules of Funding Progress
1
2
The Public Employees Benefit Board (PEBB) does not issue a financial report.
UAAL as a % of Covered
Payroll((b-a)/c)
Actuarial Accrued
Liability (AAL)
Effective with the 2004 valuation, the cost method was changed from Entry Age Normal to Projected Unit Credit, and the actuarial value of assets was changed from a four-year smoothed value to market value.
Effective with the 2004 valuation, the Oregon Public Service Retirement Plan (OPSRP) payroll was included in the amortization of the UAAL.
The Public Employees Retirement System (PERS) issues a publicly available financial report that includes financial statements and required supplementary information. That report may be obtained by writing to PERS Fiscal Services Division, 11410 SW 68th Parkway, Tigard, Oregon 97223.
UAAL as a % of Covered
Payroll((b-a)/c)
rial
urance Premium Account (RHIPA) Plan
rial Unfunded AAL
(UAAL)Funded Ratio
(b) (b-a) (a/b)
Actuarial Accrued
Liability (AAL)

Supplementary Information

VarianceFavorable/
Actual Budget1 (Unfavorable)Revenue
Video LotterySM (Gross Receipts) $ 10,582,926,497 $ 10,587,167,769 $ (4,241,272)Scratch-itsSM Instant Tickets 112,105,703 114,072,382 (1,966,679)Keno 99,184,396 97,985,679 1,198,717 Powerball® 51,836,316 50,254,973 1,581,343 MegabucksSM 38,065,424 37,260,272 805,152 Win For LifeSM 6,654,104 6,598,255 55,849 RaffleSM 2,499,597 2,500,000 (403)Lucky LinesSM 2,042,237 1,987,604 54,633 Pick 4SM 1,389,814 1,385,000 4,814
Total Revenue 10,896,704,088 10,899,211,934 (2,507,846)Prize Expense 10,001,528,224 10,004,544,769 3,016,545
Net Revenue 895,175,864 894,667,165 508,699 Direct Expenses
Retailer Commissions 213,739,988 213,102,000 (637,988)Game Vendor Charges 7,716,930 8,478,236 761,306 Tickets 4,335,016 4,625,000 289,984 Advertising 10,760,829 11,851,300 1,090,471 Sales Support 1,712,391 2,036,871 324,480 Game Equipment/Parts & Maintenance 1,850,765 1,886,984 36,219 Research 552,723 2,875,113 2,322,390 Depreciation 34,439,845 42,520,628 8,080,783
Total Direct Expenses 275,108,487 287,376,132 12,267,645 Gross Profit 620,067,377 607,291,033 12,776,344
Indirect RevenueOther Income 3,700,819 14,385,002 (10,684,183)
Indirect ExpensesPublic Information 5,326,746 6,275,105 948,359 Personal Services 38,794,266 39,791,587 997,321 Services and Supplies 10,186,947 12,900,250 2,713,303 Depreciation 2,640,455 2,441,075 (199,380)
Total Indirect Expenses 56,948,414 61,408,017 4,459,603 Net Profit $ 566,819,782 $ 560,268,018 $ 6,551,764
1Budget adopted by the Lottery Commission and adjusted by the Department of Administrative Services, Economic and Revenue Forecasts, published throughout the year.
Oregon State Lottery
(Unaudited)
An Enterprise Fund of the State of OregonBudgetary Basis Comparison ScheduleFor the Fiscal Year Ended June 30, 2009
(See Note 2. A., Budgetary Compliance)
40


42
Statistical Section
Index This part of the Oregon State Lottery’s comprehensive annual financial report presents detailed information to provide context for understanding what the information in the financial statements and note disclosures say about the Lottery’s overall financial health. Financial Trends These schedules contain trend information to help the reader understand how the Lottery’s financial performance has changed over time.
Net Assets by Component Changes in Net Assets
Revenue Capacity These schedules contain information to help the reader assess the Lottery’s most significant revenue source, Lottery game sales income. The sales amounts reported for the top ten retailers and sales by county are based on Lottery’s business year, which is slightly different than its fiscal year of July 1 through June 30. The business year begins on the Sunday following the last Saturday in June and ends on the last Saturday in the following June.
Sales by Product Product Percent of Total Sales Top Ten Retailers Number of Lottery Retailers and Sales by County
Demographic and Economic Information These schedules offer demographic and economic indicators to help the reader understand the environment within which the Lottery’s financial activities take place.
Demographic and Economic Data – State of Oregon Employment by Industry – State of Oregon Demographic Profile of Oregon Lottery Players
Operating Information These schedules contain data to help the reader understand how the information in the Lottery’s financial report relates to the products it provides and the activities it performs. There are many factors that impact the level of demand for Lottery products. Game themes, play-styles, price points, and prize payouts typically impact the sales of instant ticket games. For Video LotterySM, the level of demand is generally impacted by variety of game choices, entertaining and sophisticated graphics, and convenience of available retailer locations.
Number of Employees Operating Indicators and Capital Asset Information Note: The Lottery does not issue long-term debt; thus, information on debt capacity is not relevant. Sources: Unless otherwise noted, the information in these schedules is derived from the comprehensive annual financial report or the audited financial statements for the applicable year.

Oregon State LotteryNet Assets by Component
ears
Fiscal YearInvested in
Capital AssetsUnrestricted Net Assets
Total Net Assets1
8,946,079 56,128,228$ 75,074,307$ 2001 15,944,190 78,985,396 94,929,586
8,678,250 45,892,295 74,570,545 2003 25,748,947 49,251,053 75,000,000 2004 33,194,920 51,805,080 85,000,000 2005 47,552,216 80,097,104 127,649,320 2006 71,376,190 95,897,724 167,273,914 2007 96,675,840 83,030,082 179,705,922 2008 109,501,992 100,567,808 210,069,800 2009 95,689,630 88,353,446 184,043,076
The Lottery does not have any outstanding debt associated with its capital assets; thus, the caption ted in Capital Assets, Net of Related Debt is not used.
In fiscal year 2004, net assets of $75,000,000 at June 30, 2003 were restated to $74,170,254 with a prior iod adjustment.
Last Ten Fiscal Y
2000 1$
2002 2
Net Assets
$-
$50
$100
$150
$200
$250
2000 2001 2002 2003 2004 2005 2006 2007 2008 2009
Mill
ions
Invested in Capital Assets Unrestricted Net Assets
1
per
Note: Inves
43

Oregon State LotteryChanges in Net AssetsLast Ten Fiscal Years
2000 2001 2002 2003erating Revenues
Sales:Video LotterySM (Net Receipts) 436,531,650$ 462,398,035$ 480,201,739$ 498,712,314$ Scratch-itsSM Instant Tickets 132,888,825 129,345,971 130,697,042 133,102,008 Keno 105,161,034 104,752,247 106,673,563 111,341,872 Powerball® (MUSL) 35,685,779 38,104,163 44,308,637 45,107,076 MegabucksSM 34,216,269 30,880,654 33,194,216 44,516,150 Sports ActionSM 9,528,148 9,777,530 9,455,680 9,862,974 Win For LifeSM - 3,770,174 6,489,818 5,990,520 RaffleSM - - - - Lucky LinesSM - - Pick 4SM 2,248,679 1,591,390 Breakopen Instant Tic 3,758,870 3,290,487 Cash Quest 908,053 (525) (8) - Scoreboard
Op
- - 778,315 2,406,063
kets 4,536,362 4,229,395
SM - - - - Provision for Bad Debts (120,198) (200,067) (86,908) (154,345) ther Income 322,938 1,373,293 450,565 414,175
tal Operating Revenues 760,437,175 786,836,933 817,391,893 853,774,621 rating Expenses
Retailer Commissions 168,972,877 175,711,399 183,271,609 190,807,938 Prizes 215,023,603 220,472,928 231,498,980 248,666,215 Salaries and Wages 20,987,551 23,014,660 25,383,940 25,607,562 Depreciation and Amortization 6,981,975 5,495,390 4,566,058 5,123,916 Advertising and Market Research 5,260,578 6,629,885 6,052,783 6,294,027 Services and Supplies 11,333,743 15,422,658 15,528,284 11,673,527
ame Vendor Charges 17,728,955 17,284,108 14,887,737 14,140,775 Public Information 2,455,535 2,413,137 2,621,854 2,743,140
ickets 3,857,827 4,444,691 3,981,867 4,372,431 ame Equipment Parts and Maintenance - - - -
Sales Support 3,131,129 1,704,981 1,273,782 1,397,075 tal Operating Expenses 455,733,773 472,593,837 489,066,894 510,826,606
perating Income 304,703,402 314,243,096 328,324,999 342,948,015 noperating Revenues (Expenses)
Interest and Investment Income (Loss) 11,052,175 17,467,649 12,612,329 16,817,879 Insurance Recoveries - - - -
ain (Loss) on Disposition of Assets (47,826) 260,125 97,538 37,825 Investment Expenses - Securities Lending (1,121,646) (1,206,037) (403,595) (483,488) tal Nonoperating Revenues (Expenses) 9,882,703 16,521,737 12,306,272 16,372,216 ome Before Transfers 314,586,105 330,764,833 340,631,271 359,320,231
ansfers to Economic Development Fund (286,974,303) (310,909,554) (360,990,312) (358,890,776) ansfers to General Obligation Bond Fund - - - - ange in Net Assets1 27,611,802$ 19,855,279$ (20,359,041)$ 429,455$
ior to the implementation of GASB Statement No. 34 in fiscal year 2002, Change in Net Assets was reported Net Income (Loss).
Oo
Ope
G
TG
ToONo
G
ToIncTrTrCh
1Pras
T
44

45
2004 2005 2006 2007 2008 2009
530,966,187$ 579,650,266$ 732,888,437$ 853,505,565$ 895,111,696$ 786,746,726$ 132,731,374 133,241,896 127,244,323 127,636,964 124,704,686 112,105,703 116,478,125 122,196,298 116,240,045 113,198,024 109,787,942 99,184,396 45,974,759 35,004,855 59,070,621 48,658,403 55,969,079 51,836,316 46,473,330 48,283,356 37,771,877 40,164,337 37,149,930 38,065,424 10,063,790 11,292,930 12,105,674 14,009,541 - - 5,475,972 5,559,882 5,914,469 5,566,158 6,675,988 6,654,104
- - - - - 2,499,597 - - 1,018,520 2,298,480 2,131,474 2,042,237
1,381,483 1,386,714 1,405,501 1,404,990 1,401,230 1,389,814 2,630,176 2,185,157 1,671,571 1,173,585 857,671 -
- - - - - - 1,087,911 1,022,163 643,913 512,206 - - (133,563) (294,516) (29,002) (56,434) (7,797) (128,699) 332,697 361,798 234,719 1,602,185 1,042,747 579,477
893,462,241 939,890,799 1,096,180,668 1,209,674,004 1,234,824,646 1,100,975,095
200,968,893 195,994,718 218,013,134 239,320,032 240,475,998 213,739,988 232,122,621 245,125,049 236,638,134 240,076,739 231,364,323 211,927,565 24,496,409 23,860,802 25,873,708 29,123,801 33,005,670 37,330,819 4,419,544 6,918,109 11,019,875 19,797,789 30,843,314 37,080,300 6,917,506 7,262,887 7,007,884 10,752,331 9,885,584 11,313,552
11,400,672 10,143,892 10,902,866 8,254,418 8,767,744 10,519,566 11,816,144 10,908,009 10,227,113 10,009,601 9,371,513 7,716,930 3,124,828 3,106,149 3,858,646 5,128,899 5,463,575 5,326,746 4,459,738 4,318,728 4,461,315 4,165,283 4,232,601 4,335,016
- - - 2,606,119 2,485,770 1,850,765 1,332,869 1,215,887 1,772,169 1,320,416 1,569,079 1,712,391
501,059,224 508,854,230 529,774,844 570,555,428 577,465,171 542,853,638 392,403,017 431,036,569 566,405,824 639,118,576 657,359,475 558,121,457
(34,460) 15,862,977 8,357,783 24,392,398 28,068,310 12,675,701 49,867 69,315 34,111 16,655 25,570 61,973 32,123 (64,636) (20,653) (517,562) (317,204) (1,767,242)
(837,276) (1,525,023) (2,998,549) (5,352,243) (5,047,007) (808,660) (789,746) 14,342,633 5,372,692 18,539,248 22,729,669 10,161,772
391,613,271 445,379,202 571,778,516 657,657,824 680,089,144 568,283,229 (380,579,755) (401,581,250) (531,032,111) (644,030,352) (648,408,187) (592,846,506)
(203,770) (1,148,632) (1,121,812) (1,195,464) (1,317,079) (1,463,447) 10,829,746$ 42,649,320$ 39,624,593$ 12,432,008$ 30,363,878$ (26,026,724)$

46
Fiscal Year
Video LotterySM
Instant Products Keno Powerball® MegabucksSM All Other
Games Total
2000 436,531,650$ 137,425,187$ 105,161,034$ 35,685,779$ 34,216,269$ 11,214,516$ 760,234,435$
2001 462,398,035 133,575,366 104,752,247 38,104,163 30,880,654 15,953,242 785,663,707
2002 480,201,739 134,455,912 106,673,563 44,308,637 33,194,216 18,194,169 817,028,236 2003 498,712,314 136,392,495 111,341,872 45,107,076 44,516,150 17,444,884 853,514,791 2004 530,966,187 135,361,550 116,478,125 45,974,759 46,473,330 18,009,156 893,263,107 2005 579,650,266 135,427,053 122,196,298 35,004,855 48,283,356 19,261,689 939,823,517 2006 732,888,437 128,915,894 116,240,045 59,070,621 37,771,877 21,088,077 1,095,974,951 2007 853,505,565 128,810,549 113,198,024 48,658,403 40,164,337 23,791,375 1,208,128,253 2008 895,111,696 125,562,357 109,787,942 55,969,079 37,149,930 10,208,692 1,233,789,696 2009 786,746,726 112,105,703 99,184,396 51,836,316 38,065,424 12,585,752 1,100,524,317
Draw Games
Sales by Product Oregon State Lottery
Last Ten Fiscal Years
Sales by Product Type (In Millions)
Video LotterySM
Instant
Draw
$-
$200
$400
$600
$800
$1,000
$1,200
$1,400
2000 2001 2002 2003 2004 2005 2006 2007 2008 2009

47
Oregon State LotteryProduct Percent of Total Sales Last Ten Fiscal Years
Fiscal Year
Video LotterySM
Instant Products Keno Powerball® MegabucksSM All Other
Games
2000 57.4% 18.1% 13.8% 4.7% 4.5% 1.5%2001 58.9% 17.0% 13.3% 4.9% 3.9% 2.0%2002 58.8% 16.5% 13.1% 5.4% 4.0% 2.2%2003 58.4% 16.0% 13.1% 5.3% 5.2% 2.0%2004 59.4% 15.2% 13.1% 5.1% 5.2% 2.0%2005 61.7% 14.4% 13.0% 3.7% 5.2% 2.0%2006 66.9% 11.8% 10.6% 5.4% 3.4% 1.9%2007 70.6% 10.7% 9.4% 4.0% 3.3% 2.0%2008 72.5% 10.2% 8.9% 4.6% 3.0% 0.8%2009 71.5% 10.2% 9.0% 4.7% 3.5% 1.1%
Draw Games
Draw Game Sales by Product (In Millions)
$-
$50
$100
$150
$200
$250
2000 2001 2002 2003 2004 2005 2006 2007 2008 2009
Keno Powerball Megabucks All Other

48
Oregon State LotteryTop Ten RetailersCurrent Year and Nine Years Prior
Rank Retailer SalesPercent of Total Sales County
1 Deli Store 1,855,552$ 0.17% Columbia2 Dotty's #24 1,779,730 0.16% Multnomah3 Bradley's Bar & Grill 1,771,696 0.16% Multnomah4 Original Joe's 1,742,585 0.16% Multnomah5 Smokehouse Café #4 1,606,596 0.15% Linn6 Dotty's #9 1,565,854 0.14% Washington7 Dotty's #8 1,492,508 0.14% Washington8 Dotty's #11 1,485,102 0.13% Multnomah9 Glass House Tavern 1,483,522 0.13% Multnomah10 Dotty's #17 1,480,445 0.13% Washington
Totals 16,263,590$ 1.47%
Total Lottery Sales 1,100,524,317$
Rank Retailer SalesPercent of Total Sales County
1 Bradley's 1,850,524$ 0.24% Multnomah2 Farmhouse Restaurant 1,736,462 0.23% Multnomah3 Glass House Tavern 1,475,928 0.19% Multnomah4 Joseph's Café & Deli 1,412,684 0.19% Multnomah5 Maverick Restaurant & Lounge 1,411,450 0.19% Multnomah6 Jody's Restaurant & Lounge 1,400,029 0.18% Multnomah7 Lydia's 1,398,353 0.18% Multnomah8 Dotty's #7 1,382,247 0.18% Multnomah9 Purple Parrot #6 1,378,678 0.18% Jackson10 Jasper's Deli 1,370,581 0.18% Lane
Totals 14,816,936$ 1.94%
Total Lottery Sales 760,234,435$
Source: Oregon State Lottery Research Department
2009
2000

49
Oregon State LotteryNumber of Lottery Retailers and Sales by CountyFor Business Year 2009
CountyBusiness Year
Sales
Percent of Total Sales
Number of Lottery
Retailers
Percent of Total
Retailers
Multnomah 308,523,458$ 28.04% 961 24.92%Washington 129,644,448 11.78% 355 9.20%Clackamas 109,173,237 9.92% 337 8.74%Lane 89,968,630 8.17% 352 9.13%Marion 89,667,030 8.15% 316 8.20%Jackson 49,986,715 4.54% 184 4.77%Deschutes 36,624,315 3.33% 127 3.29%Linn 36,444,982 3.31% 132 3.42%Douglas 24,721,854 2.25% 127 3.29%Josephine 22,043,651 2.00% 92 2.39%Columbia 18,867,280 1.71% 55 1.43%Umatilla 18,215,159 1.65% 75 1.95%Clatsop 17,516,819 1.59% 71 1.84%Yamhill 17,433,685 1.58% 72 1.87%Klamath 15,650,675 1.42% 65 1.69%Lincoln 14,779,535 1.34% 75 1.95%Coos 11,487,175 1.04% 56 1.45%Malheur 10,844,109 0.99% 35 0.91%Tillamook 10,367,455 0.94% 40 1.04%Polk 10,146,859 0.92% 49 1.27%Benton 9,112,486 0.83% 44 1.14%Wasco 8,976,100 0.82% 32 0.83%Hood River 6,228,267 0.57% 23 0.60%Union 6,131,508 0.56% 28 0.73%Crook 5,954,931 0.54% 27 0.70%Jefferson 4,774,942 0.43% 20 0.52%Baker 4,702,822 0.43% 21 0.54%Curry 4,157,856 0.38% 25 0.65%Morrow 1,704,308 0.15% 13 0.34%Grant 1,531,259 0.14% 13 0.34%Lake 1,424,906 0.13% 7 0.18%Sherman 1,420,148 0.13% 5 0.13%Wallowa 1,179,745 0.11% 10 0.26%Harney 713,742 0.06% 6 0.16%Gilliam 483,069 0.04% 4 0.10%Wheeler 83,124 0.01% 1 0.03% Total 1,100,686,284$ 100.00% 3,855 100.00%
Source: Oregon State Lottery Research Department
Sales Retailers

50
Oregon State LotteryDemographic and Economic Data - State of OregonLast Ten Calendar Years
Calendar Year Population1
Personal Income1
(in thousands)
Per Capita Personal Income
Annual Unemployment
Rate2
1999 3,393,941 89,873,232$ 26,480$ 5.5%2000 3,430,828 96,401,727 28,099 5.1%2001 3,470,716 99,020,013 28,530 6.4%2002 3,517,982 101,881,884 28,960 7.6%2003 3,551,877 105,160,987 29,607 8.1%2004 3,576,262 109,717,646 30,679 7.3%2005 3,621,939 114,379,155 31,580 6.2%2006 3,680,968 123,857,159 33,648 5.3%2007 3,735,549 131,277,786 35,143 5.1%2008 3,790,060 136,276,807 35,956 6.4%
1Source: U.S. Department of Commerce, Bureau of Economic Analysis2Source: Oregon Employment Department

51
Oregon State LotteryEmployment by Industry - State of OregonCalendar Year 2008 and Nine Years Prior
Number of Employees
Percent of Total
Number of Employees
Percent of Total
Retail trade 248,349 10.62% 238,549 11.64%Health care and social assistance 247,850 10.59% 183,260 8.95%Manufacturing 209,639 8.96% 231,801 11.31%Accommodation and food services 162,608 6.95% 136,203 6.65%Construction 140,008 5.98% 122,729 5.99%Professional, scientific, and technical services 137,468 5.88% 108,521 5.30%Other services 124,700 5.33% 107,206 5.23%Administrative and waste services 123,910 5.30% 106,238 5.19%Real estate, rental, and leasing 110,235 4.71% 71,510 3.49%Finance and insurance 91,339 3.90% 82,790 4.04%Wholesale trade 88,713 3.79% 81,455 3.98%Transportation and warehousing 70,083 3.00% 62,233 3.04%Farm employment 66,102 2.83% 69,093 3.37%Arts, entertainment, and recreation 54,142 2.31% 39,853 1.95%Educational services 51,491 2.20% 31,568 1.54%Information 43,408 1.86% 41,665 2.03%Management of companies 32,679 1.40% 26,017 1.27%Forestry, fishing, and related activities 30,760 1.31% 30,314 1.48%Utilities 5,107 0.22% 5,569 0.27%Mining 4,985 0.21% 3,544 0.17%Local government 185,891 7.95% 167,260 8.16%State government 68,322 2.92% 59,003 2.88%Federal government, civilian 29,542 1.26% 29,706 1.45%Military 12,157 0.52% 12,601 0.62%
Total employment 2,339,488 100.00% 2,048,688 100.00%
Note: Due to confidentiality issues, the names of the ten principal employers are not available.The categories presented are intended to provide alternative information regarding the concentrationof employment in various business sectors.
2008 1999
Source: U.S. Department of Commerce, Bureau of Economic Analysis

52
Oregon State LotteryDemographic Profile of Oregon Lottery PlayersLast Seven Calendar Years1
2002 2003 2004 2005 2006
Number Surveyed 1,001 1,002 1,000 1,000 1,004Player Percentage 47.2% 50.8% 50.9% 52.6% 49.0%
Players Players Players Players PlayersGenderMale 56% 53% 40% 51% 51%Female 45% 47% 60% 49% 49%
Age18 - 24 9% 11% 14% 11% 14%25 - 34 21% 18% 18% 18% 20%35 - 44 23% 24% 17% 21% 19%45 - 54 22% 21% 24% 18% 22%55 - 64 13% 14% 14% 13% 13%65 + 12% 13% 14% 18% 13%
EducationSome High School 3% 5% 3% 2% 6%High School Graduate 23% 22% 32% 25% 33%College/Tech School 38% 42% 34% 39% 37%College Graduate 24% 21% 21% 25% 17%Graduate School/Degree 11% 11% 9% 9% 7%
Marital StatusSingle 22% 21% 23% 21% 22%Married 56% 60% 65% 55% 54%Co-habitating 5% 4% 3% 7% 7%Divorced or Separated 12% 10% 6% 11% 13%Widowed 5% 5% 3% 6% 4%
IncomeLess than $15,000 9% 8% 10% 7% 8%$15,000 - $49,999 45% 45% 50% 49% 44%$50,000 - $74,999 21% 19% 16% 16% 20%$75,000 - $99,999 10% 10% 6% 9% 10%$100,000 + 9% 8% 7% 7% 6%Refused/Don't Know 6% 10% 11% 12% 12%
Sources:Player information from Oregon State Lottery's Tracking Study conducted by Infotek Research GroupState information from U.S. Census Bureau, 2008 American Community Survey1Data for years prior to 2002 is not available.

53
2007 2008
1,001 1,00343.4% 42.2%
Players Players2008 State Population
52% 54% 49.7%48% 46% 50.3%
9% 8% 9.0%19% 19% 13.9%23% 22% 13.5%22% 23% 14.9%15% 18% 12.6%11% 11% 13.3%
7% 8% 8.7%29% 26% 27.5%38% 36% 37.0%16% 20% 17.5%10% 10% 9.3%
21% 17% 28.7%57% 56% 50.9%5% 9% n/a12% 11% 14.6%5% 6% 5.7%
8% 9% 29.7%44% 43% 46.0%17% 15% 14.0%12% 13% 5.0%10% 10% 5.3%9% 10% n/a

54
20001 20011 2002 2003 20042 20052 20062 20073 20084 20095
Retail Operations n/a n/a 211 215 209 202 211 214 222 218
Support Services n/a n/a 152 137 126 121 124 135 148 157
Marketing n/a n/a 28 25 30 26 26 29 29 37
Director's Office n/a n/a 31 31 25 29 29 30 31 32
Security6 n/a n/a 11 8 9 11 11 12 17 19
Total 403 421 433 416 399 389 401 420 447 463
Sources: Oregon State Lottery Business Plans for fiscal year 2000 and 2001; Oregon State Payroll System for fiscal year 2002 through 2009
1Detail by business unit is not available for fiscal year 2000 and 2001.2During fiscal year 2004 through 2006, some vacant positions were eliminated to reduce operating expenses.
6Number of employees for Security excludes employees of the Oregon State Police.
5During fiscal year 2009, vacant positions in Marketing were filled and some temporary employees were hired to assist with promotional Marketing activities.
3Positions were added in fiscal year 2007 to address the growth of the Lottery, to restore some vacant positions previously eliminated, and to build the infrastructure needed to support future growth.4In fiscal year 2008, positions were added to support the Lottery's business that is driven by technology, expand into web-based products, and respond to system growth.
Oregon State LotteryNumber of EmployeesLast Ten Fiscal Years
Employees as of June 30

55
Oregon State LotteryOperating Indicators and Capital Asset InformationLast Ten Fiscal Years
Fiscal Year
Number of Lottery
Retailers1Per Capita
Sales2
2000 3,176 8,776 224.00$ 2001 3,198 8,903 229.00 2002 3,300 9,259 235.41 2003 3,368 9,434 242.61 2004 3,421 10,194 251.49 2005 3,484 10,438 262.79 2006 3,579 11,125 302.59 2007 3,691 11,831 328.21 2008 3,785 12,205 330.28 2009 3,855 12,365 290.37
1Source: Oregon State Lottery Records2Source: Calculated based on population data from U.S. Department of Commerce, Bureau ofEconomic Analysis
Number of Video LotterySM
Terminals Deployed1

56
This page intentionally left blank.

Other Reports


