Organic aerosol and global climatemodelling: a review
M. Kanakidou1, J. H. Seinfeld2, S. N. Pandis3, I. Barnes4, F. J. Dentener5,M. C. Facchini6, R. van Dingenen5, B. Ervens7, A. Nenes8, C. J. Nielsen9,E. Swietlicki10, J. P. Putaud5, Y. Balkanski11, S. Fuzzi6, J. Horth5,G. K. Moortgat12, R. Winterhalter12, C. E. L. Myhre9, K. Tsigaridis1, E. Vignati5,E. G. Stephanou1, and J. Wilson5
1Environmental Chemical Processes Laboratory, Dept. of Chemistry, University of Crete,P.O.Box 1470, 71409 Heraklion, Greece2California Institute of Technology, 210-41, 1200 E. California Blvd., Pasadena, CA 91125,USA3Dept. of Chemical Engineering, University of Patras, Patras, Greece4Bergische University Wuppertal, Physical Chemistry FB C, Gauss Str. 20, 42119 Wuppertal,Germany5Climate Change Unit, Institute for Environment and Sustainability, JRC, Ispra, Italy6Istituto di Scienze dell’Atmosfera e del Clima – CNR, Italy7Cooperative Institute for Research in the Atmosphere, Colorado State University, Fort Collins,Colorado 80523, USA
8 Schools of Earth and Atmospheric Sciences and Chemical and Biomolecular Engineering,Georgia Institute of Technology, Atlanta, Georgia, 30332-0340 Atlanta, USA9 Dept. of Chemistry, University of Oslo, Oslo, Norway10 Div. of Nuclear Physics, Dept. of Physics, Lund University, Lund, Sweden11 LSCE, CNRS/CEA, Orme des Merisiers, 91198 Gif-sur-Yvette, France12 Max Planck Institute for Chemistry, Atmospheric Chemistry Division, Mainz, Germany
Received: 3 August 2004 – Accepted: 16 August 2004 – Published: 28 September 2004
The present paper reviews existing knowledge with regard to Organic Aerosol (OA)of importance for global climate modelling and defines critical gaps needed to reducethe involved uncertainties. All pieces required for the representation of OA in a globalclimate model are sketched out with special attention to Secondary Organic Aerosol5
(SOA): The emission estimates of primary carbonaceous particles and SOA precur-sor gases are summarized. The up-to-date understanding of the chemical formationand transformation of condensable organic material is outlined. Knowledge on thehygroscopicity of OA and measurements of optical properties of the organic aerosolconstituents are summarized. The mechanisms of interactions of OA with clouds and10
dry and wet removal processes parameterisations in global models are outlined. Thisinformation is synthesized to provide a continuous analysis of the flow from the emittedmaterial to the atmosphere up to the point of the climate impact of the produced or-ganic aerosol. The sources of uncertainties at each step of this process are highlightedas areas that require further studies.15
1. Introduction
Atmospheric aerosols can scatter or absorb solar radiation, which modifies thereforethe radiative balance of the atmosphere (IPCC, 2001). Black carbon heats the atmo-sphere by absorption of solar radiation, whereas most organic aerosol componentscool the Earth’s atmosphere. Fine aerosols have sizes close to wavelengths in the20
visible and are thus expected to have a stronger climatic impact than larger particles.In addition fine aerosols are transported far from their source regions and their climaticand environmental impact is, therefore, delocalized compared to the emission areas.Hydrophilic aerosols can act as cloud condensation nuclei (CCN), and thus have anindirect climatic effect through modification of cloud properties (Novakov and Penner,25
1993; Novakov and Corrigan, 1996; IPCC, 2001). A number of studies have indicated
that organic aerosol plays an important role in both the direct as well as the indirectaerosol forcing (Liousse et al., 1996; Cooke et al., 1999; Hansen et al., 1998; Penneret al., 1998; Jacobson, 2001; Chung and Seinfeld, 2002). However, there is an un-certainty of at least of a factor of 3 related to this forcing (IPCC, 2001) that deservesfurther study.5
Organic material significantly contributes ∼20–50% to the total fine aerosol mass atcontinental mid-latitudes (Saxena and Hildemann, 1996; Putaud et al., 2004) and ashigh as 90% in tropical forested areas (Andreae and Crutzen, 1997; Talbot et al., 1988,1990; Artaxo et al., 1988, 1990; Roberts et al., 2001). A substantial fraction of theorganic component of atmospheric particles consists of water-soluble, possibly multi-10
functional compounds (Saxena and Hildemann, 1996; Kavouras et al., 1998; Facchiniet al., 1999a). Model studies (e.g. Pun et al., 2003; Kanakidou et al., 2000; Tsigaridisand Kanakidou, 2003) indicate that under certain circumstances the main fraction of or-ganic aerosol can be of secondary origin, i.e. it is chemically formed in the atmosphere(Fig. 1).15
This applies also to the free troposphere where low temperatures favour conden-sation of semi-volatile compounds forming secondary organic aerosol. This highlightsthe importance of secondary organic aerosol (SOA) for direct and indirect forcing. Inaddition, inclusion of SOA in climate models is needed since verification of aerosolcalculations with remote sensed techniques (e.g. satellite/sun photometers) requires a20
full description of all aerosol components. In-situ measurements are often not able todiscriminate between primary organic aerosol (POA) and SOA.
The processes that have to be considered in climate models to account for theorganic aerosol (OA) and its climatic impact comprise both chemistry and physics.Chemical processes include chemical formation and transformation of the OA by ho-25
mogeneous reactions followed by condensation or/and by heterogeneous reactions onparticle surfaces or/and in clouds. Physical processes that determine OA mass andsize distributions are emissions of primary OA and SOA precursors, followed by trans-port by advection, convection and diffusion, mixing with other particles by coagulation,
evaporation and condensation of organic vapours as well as dry and wet removal (incloud and below cloud scavenging). Emissions of primary organic particles and alsoSOA precursors can occur by various sources in the boundary layer and to a lesser ex-tent in the free troposphere. The dry and wet removal processes of OA depend on thewater solubility and size of the particles containing these compounds. Finally, the sim-5
ulation of the climatic impact of these aerosols will additionally require the descriptioni) of the water uptake by the particles, which depends on their hygroscopic properties,and ii) of the optical properties of the OA that also depend on the state of mixing of OAcomponents with other aerosol components and are needed for the computation of theextinction of solar radiation.10
Therefore, the following questions need to be addressed with regard to the OA andparticularly of the SOA in the atmosphere:
– What are the SOA precursor gases? How important are their emissions into theatmosphere? How important are the emissions of the primary OA?
– What are the main mechanisms of SOA formation? And how much SOA is formed15
in the atmosphere?
– How important is organic nucleation on a global scale?
– How can we simulate the partitioning of semivolatile OA species between the gasand particulate phases? Can we assume thermodynamic equilibrium betweenthe two phases?20
– What are the hygroscopic properties of OA? How is OA involved in the CCN for-mation?
– What are the optical properties of OA? And how are they altered during ageing ofthe aerosols?
– How are aerosols mixed in the atmosphere? And how does this mixing alter their25
– What are the responses of the climate system to changes in organic aerosol?
During the last decade important advances were made in understanding OA and itsbehaviour in the atmosphere. Different studies have shown in the past years that bio-genic hydrocarbons play a significant role in the formation of tropospheric ozone andthat even in urban areas with high anthropogenic emissions they still need to be con-5
sidered in order to develop reliable strategies for the reduction of tropospheric ozone(Chameides et al., 1988; Roselle, 1994; Vogel et al., 1995; Atkinson and Arey, 1998).It has also been known for quite some time that the oxidation of monoterpenes in thetroposphere plays a potentially important role in the generation of secondary organicparticulate matter (Went, 1960; Rasmussen, 1972; Trainer et al., 1987; Jacob and10
Wofsy, 1988; Andreae and Crutzen, 1997). Many biogenic hydrocarbons show muchhigher reactivity towards the important atmospheric oxidants OH, NO3 and ozone thanthe anthropogenically emitted VOCs, which adds further to the significance of VOCsemitted from biogenic sources (BVOCs) as a major potential contributor to global or-ganic particulate mater (PM) formation (Atkinson, 2000).15
In recent years BVOCs have been positively identified as precursor substances tothe formation of SOA in the atmosphere (Kavouras et al., 1999; Pandis et al., 1992;Yu et al., 1999a, b). That BVOCs contribute to aerosol formation has now been amplydemonstrated in different laboratory and outdoor chamber experiments (e.g. Palen etal., 1992; Zhang et al., 1992; Hoffmann et al., 1997; Griffin et al., 1999a; Barnes,20
2004; Hoffmann, 2001; Jaoui and Kamens, 2003a and references therein). In spiteof this there is still a paucity of, data on and understanding of, the composition andthe properties of the aerosol formed from the gas phase photooxidation of biogenichydrocarbons (Christoffersen et al., 1998; Kavouras et al., 1998).
A number of review papers exist that are used as a starting point for the present25
review: In 1996, Saxena and Hildemann (1996) identified and estimated the solubili-ties of an extensive set of water soluble organic compounds that could be present inatmospheric particles. Atkinson et al. (1997) have reviewed VOC gas phase chemicalmechanisms, including those leading to aerosol formation. Seinfeld and Pankow (2003)
summarized kinetic knowledge on SOA formation and appropriate parameterisations.Kulmala (2003) described the procedure of formation and growth of particles in theatmosphere. Jacobson et al. (2000) focused on an extensive presentation and discus-sion of OA measurement techniques.
The present paper aims to build upon these earlier reviews especially by includ-5
ing recently acquired knowledge in the area of Secondary Organic Aerosol. It alsointends to examine the OA problem from the point of view of climate modelling anddefine critical areas where additional knowledge is needed to reduce the involved un-certainties. In the next sections, the state-of-the-art of all the components needed forthe representation of OA in a climate model is outlined: The emission estimates of10
primary carbonaceous particles and SOA precursor gases are summarized. The up-to-date understanding of the chemical formation and transformation of condensableorganic material is outlined together with an overview of the SOA formation represen-tation in global climate models. Measurements of physical and optical properties ofthe organic aerosol are summarized and needs for modelling studies are highlighted.15
The mechanisms of interactions of SOA with clouds are discussed. Dry and wet re-moval parameterisations in global models are outlined. Effort is put into synthesizingthis information to provide a continuous flow from the emitted material to the climaticimpact of the organic aerosol. The sources of uncertainties at each individual step ofthe overall process are highlighted as areas that require further studies.20
2. Emissions of primary carbonaceous aerosols and of SOA precursors
This section evaluates the current knowledge and uncertainties of emissions of primarycarbonaceous aerosol and of the volatile organic compounds (VOC) that can contributeto the chemical formation of organic particulate matter in the atmosphere.
2.1. Primary carbonaceous emissions: global and regional emission estimates
Sources of primary carbonaceous particles include fossil fuel burning (especially trans-portation and energy production), domestic burning (cooking and heating), and uncon-tained burning of vegetation (savannah and deforestation fires) and agricultural waste.There are a number of other types of primary carbonaceous material in the atmo-5
sphere such as viruses, bacteria, and plant debris. Their contribution to aerosol massmay be substantial (Wiedinmyer, 2004, and references therein), but due to their resi-dence in the coarse aerosol fraction, their climate relevance is generally considered tobe relatively low. Unfortunately there are no quantitative estimates of their global andregional emissions, and to our knowledge there are no studies on their potential role10
as condensation sites for SOA. It is currently believed that fine organic particles offersurface and mass, on which SOA precursor gases may preferentially condense. Notethat BC is an operationally defined quantity and the use of BC should be accompaniedby the method used for its measurement. In the present paper we will use the termBC since it is more relevant to climate change. Therefore, the compiled inventories15
are based on emission measurements with all types of sampling and analysis methodsintroducing thus significant inconsistencies between the emission inventories and theobservations. At present most measurement techniques can not discriminate betweenthe organic aerosol formed from biogenic and anthropogenic precursor gases and theprimary carbonaceous particles emitted from, mainly, pyrogenic processes.20
A recent and extensive analysis of regional black carbon (BC) and organic particulatecarbon (OC) emissions is provided by Bond et al. (2004), using energy statistics for theyear 1996. Global emissions of BC are estimated to be 1.6, 3.3 and 3.0 Tg C y−1
for biofuel, vegetation fires, and fossil fuel burning, respectively. For Primary OrganicAerosol these numbers are 9.1, 34.6, and 3.2 Tg POA y−1. Main uncertainties are25
connected to the choice of emission factors that depend on the fuel burnt and the typeof combustion. Biofuel consumption for domestic use is the source category associatedwith the highest uncertainty due to the difficulty in getting reliable statistics. A recent
study by Schaap et al. (2004) suggests that, at least in Europe, the BC emissionsof this inventory may be underestimated by a factor of two. Novakov et al. (2003)estimated historical trends in fossil fuel BC emissions since 1875. These trends showrapid increase in the latter part of the 1800s, levelling off in the first part of 1900s andthe re-acceleration in the past 50 years as China and India have been developing.5
These changes that have caused regionally large temporal modifications in aerosolabsorption might be accompanied by similar trends in OA emissions. These possibleemission changes and their climate impact need to be evaluated.
2.2. SOA precursor emissions
2.2.1. Mechanism and composition of natural SOA precursor emissions10
VOCs are emitted into the atmosphere from natural sources in marine and terrestrialenvironments, as well as from anthropogenic sources. A key study on global naturalemissions was published by Guenther et al. (1995); hereafter called G1995, whichis still the basis for later estimates of natural VOC emissions. On a global basis theemissions of biogenic volatile organic compounds (BVOCs), which are emitted mainly15
by vegetation, are estimated to exceed those from anthropogenic emissions (G1995:Guenther et al., 1999, 2000). Recently, Wiedinmeyer et al. (2004), hereafter W2004,provided an excellent review paper of emissions of organics from vegetation. Here wefocus on those emissions and their uncertainties relevant for SOA formation.
Isoprene accounts for about half of all natural VOC emissions and is, on a mass20
basis, the dominant emitted biogenic VOC component. Estimated global emissionsrange between 250 and 750 Tg C y−1 (W2004). However, isoprene is generally notconsidered as a major producer of SOA. Very recent studies, however, indicate involve-ment of isoprene as source for SOA (Jang et al., 2003a; Claeys et al., 2004). Claeyset al. (2004) proposed that a small (0.2%) fraction of all isoprene may be converted25
into SOA, corresponding to 2 Tg y−1 emissions. Thus far more than 5000 terpeneshave been identified (Geron et al., 2000), such as monoterpenes (C10), sesquiterpenes
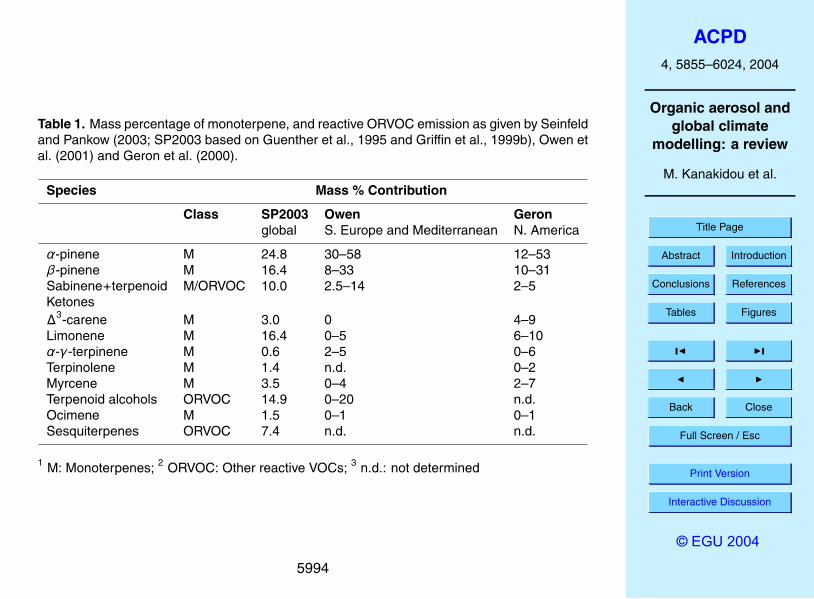
(C15), diterpenes (C20) and higher molecular weight compounds. Most important com-ponents in the group ‘terpenes’ are the mono-terpenes (C10H16)α-pinene, β-pinene,sabinene, and limonene (Table 1), accounting for 40–80% of the overall terpene emis-sion on a global scale. Field measurements have shown that the mono-terpenes repre-sent a significant fraction of the BVOCs emitted from vegetation to the atmosphere with5
contributions ranging from 10 to 50% dependent on the type of vegetation prevailing inthe area (Guenther, 1995; Guenther et al., 2000; hereafter G1995).
Excluding isoprene and methane, VOCs from biogenic sources are often divided(G1995) into the lumped categories i) terpenes, ii) other reactive VOC (ORVOC) andiii) other VOCs (OVOCs). In the widely used GEIA dataset (URL http://geiacenter.org/),10
the latter two are lumped together. ORVOC represent reactive VOCs, with lifetimes<1 day, such as terpenoid alcohols, n-carbonyls, aromatics, sesquiterpenes (C15H24),terpenoid ketones and higher olefins. OVOCs are the less reactive VOCs, with lifetimeslonger than 1 day, typically methanol, various aldehydes and ketones. The latter arebelieved to have little aerosol formation potential, and are not further considered in this15
section. According to Griffin et al. (1995), only 30% of the lumped ORVOC and OVOCshave the potential to form SOA. In contrast, the mono-terpenes, and especially thesesquiterpenes (100%), have large potential for SOA formation. Note also that lumpingof various chemical compounds in the emissions inventories like for instance ORVOCputs together compounds that form aerosols with compounds that are not precursors20
of SOA. This introduces further uncertainties in the SOA modelling.Woods, crops and shrubs contribute by 55%, 15%, and 14%, respectively, to the non-
isoprene biogenic emissions (G1995), whereas oceans emit <1%. Emission amountsand composition are species and thus ecosystem dependent; the main external factorsinfluencing emissions are i) temperature ii) light (for some species) and iii) water stress.25
G1995 describe an algorithm that uses ecosystem input data, emission factors, lightand temperature dependent functions and a canopy radiative transfer model. The mostrecent updates of the algorithms are provided by the GLOBEIS activity (http://www.globeis.com).
Seinfeld and Pankow (2003) use the Griffin et al. (1999b) ORVOC breakdown insmaller chemical categories and classify the SOA forming compounds in a total of 11categories, which encompass on a global scale most of the observed terpenes, andORVOCs emissions. For comparison we also give the fractions obtained in N. America(Geron et al., 2000) and Southern Europe Mediterranean (Owen et al., 2001). As5
becomes apparent in Table 2, the species contributions to the emissions adopted inglobal models is rather similar to those obtained by regional estimates. However, careshould be taken in extrapolating regional results to the global scale, since precursorslike sesquiterpenes that have the largest potential in forming SOA (e.g. Vizuete et al.,2004) have also highly uncertain emissions.10
2.2.2. Anthropogenic SOA precursor emissions
Aromatic components have also the potential to form SOA (Odum et al., 1997). Tsi-garidis and Kanakidou (2003) adopted the EDGAR2.0 database (Olivier et al., 1996,1999) for the anthropogenic emissions of SOA precursor gases. This database is givingglobal emissions of 6.7 Tg y−1 toluene, 4.5 Tg y−1 xylene, 0.8 Tg y−1 trimethylbenzene15
and 3.8 Tg y−1 of other aromatics. These emissions add up to about 10–15% of allanthropogenic NMVOC emissions.
These values were determined for the year 1990; emission factors are highly uncer-tain, and moreover subject to strong temporal changes, e.g. in Europe and USA de-creasing trends of hydrocarbon emissions have been reported in the last 2–3 decades.20
In the USA, reported NMVOC emissions have been decreasing from 35 kT y−1 in 1970to 20 kT y−1 in 2001 (http://www.epa.gov/ttn/chief/trends/index.html). In Europe, re-ported emissions decreased in the EU from 16 kT y−1 in 1989 to 12 kT y−1 in 2000(EMEP, 2003). Latter trends are confirmed by a limited number of measurements(Monks et al., 2003). In contrast, in the period 1970–2000, in South and East Asia25
and China anthropogenic NMVOC emissions may have increased by 50% (IIASA, M.Ammann, personal communication, 2004) from 41 to 63 Tg y−1.
A gridded compilation of the global emissions, divided into two categories, terpenesand the lumped ORVOC and OVOC, has been made by G1995. Table 2 gives the re-gional break-down of the primary organic aerosol (POA) flux estimates by Bond (2004)and terpene and ORVOC emissions. As a rough estimate, assuming that a constant5
fraction of 0.15 of the terpene emissions reacts on a very short timescale to form SOAthen 19.1 Tg y−1 of SOA are calculated to be globally produced by terpenes. This crudeassumption provides an order-of-magnitude comparison of the relative importance ofSOA versus primary organic aerosol emissions on regional and global scales. This es-timate shows that the SOA contribution to OA is likely to be highly variable ranging from10
10–70%, in Eastern Europe, and Canada, respectively. Obviously this approach shouldbe viewed with caution, since as discussed below, SOA formation is a complex and notyet sufficiently understood process. In addition, Tsigaridis and Kanakidou (2003) haveshown that a significant proportion of the SOA formation occurs in the free tropospheredue to enhanced condensation favoured by low temperatures.15
We can make a similar, but even more speculative, analysis of the importance of OR-VOC as precursor for SOA. If 30% of the ORVOC emissions can form SOA (of which5% consist of sesquiterpenes), assuming a 100% aerosol yield for the sesquiterpenes,and 15% for the other components, an additional amount of 15 Tg SOA y−1 could beformed, with regional contributions varying between 10 and 50 %. Following the hy-20
pothesis by Claeys et al. (2004) that a small but significant fraction of isoprene oxida-tion products may lead to SOA, an additional amount of 2 Tg SOA y−1, may be formed,65% of which can be attributed to Africa and S. America. In addition, anthropogenicorganic compounds like aromatics are also forming SOA (see Sect. 3) although theircontribution based on actual understanding of their chemistry has been evaluated to25
be a very small fraction of the global SOA formation in the troposphere (Tsigaridis andKanakidou, 2003).
According to these rough estimates, the chemical formation of SOA may be signifi-
cant when compared to the primary carbonaceous emissions (about 60% on a globalscale and even more regionally).
2.2.4. Uncertainties of estimates
There are large uncertainties associated with the regional and global inventories. Forinstance, using detailed land cover and tree species information Guenther et al. (2000)5
estimated for North America monoterpene emissions of 17.9 and ORVOC emissionsof 31.8 Tg y−1. These can be compared with 13.1 and 17.7 Tg y−1 presented in Table 2(for USA and Canada). A difference of 30 to 80% between these two inventories isdeduced. This can not be generalised since other inventories might compare better.This is the case for the estimate of 6.1 Tg y−1 terpene and OVOC emissions by Simpson10
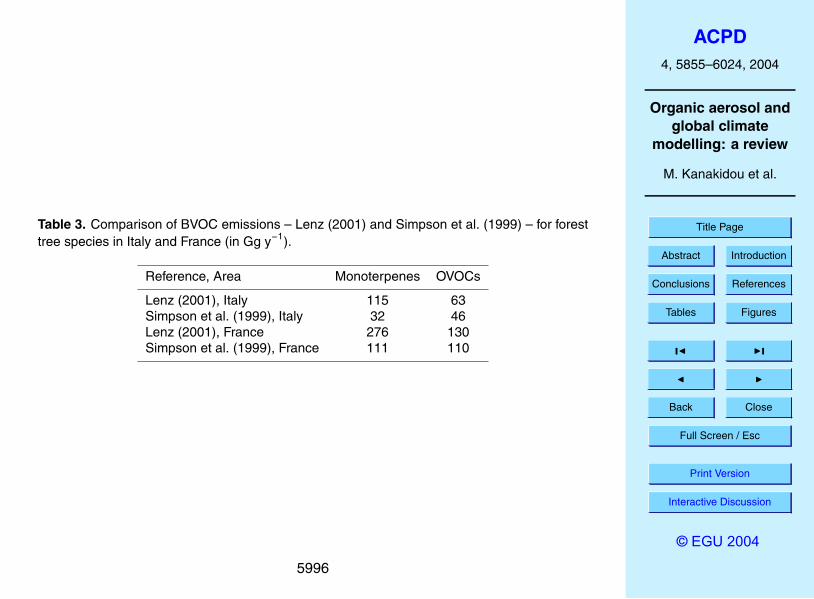
et al. (1999) for OECD Europe that is comparable to the 6.2 Tg y−1 given in Table 2.However, when comparing Simpson et al. (1999) in more detail with country specificdata compiled by Lenz (2001) differences of a factor of 2 show up over Europe ascan be seen from Table 3 where both emission estimates for Italy and for France arecompared.15
These regional differences and uncertainties propagate to the global scale inven-tories. As described before, forests have the largest potential to form SOA. Globalemissions estimates of isoprene have an overall uncertainty of a factor of 3 (250–750 TgC y−1, W2004) whereas those of terpenes and sesquiterpenes that are the mainknown SOA precursors are subject to a factor of 5 uncertainty (W2004). An extensive20
overview of the uncertainties in these emissions and the global uncertainty range isgiven by W2004. The main uncertainties are associated with (W2004):
1. tree specific emissions factors and functions
2. the use of geographical data-bases of land-cover, eco-systems and tree abun-dances25
3. foliar density and phenomenology of these trees
Most emission rates adopted for the construction of the inventories of biogenic emis-sions and in particular those of monoterpenes and sesquiterpenes have not been eval-uated based on measured ambient concentrations. There is a clear need for moredata on emissions chemical speciation since aerosol formation potential largely de-5
pends on the chemical structure of the precursor molecules. This applies particularlyto sesquiterpenes that are known to have the largest potential to form SOA and theiremission factors have been poorly studied.
2.2.5. Change of natural emissions due to land-use and climate change
Global use of land has been changing in the last 2 centuries, and is expected to be10
further modified in the future. The largest recent changes of land-use are in the tropics,mainly due to conversion of tropical forests into crop-lands. For instance from 1970–2000 forest areas in Asia, Latin America and Africa have decreased by 26, 12 and 13%,respectively (source: IMAGE2.2; http://arch.rivm.nl/image/). Global forests decreasedby 2% in this period. According to the FAO 2003 State of the World Forest Report15
(http://www.fao.org/DOCREP/005/Y7581E/Y7581E00.HTM) the decadal deforestationrates for the above mentioned areas were 1, 4, and 8% in the period 1990–2000.
Naik et al. (2004) using a dynamic global ecosystem model calculated that the com-bined fluctuations in climate and atmospheric CO2 during 1971–1990 caused signif-icant seasonal (17–25%) and interannual (2–4%) variability in the simulated global20
isoprenoid fluxes with an increasing trend during this time period.The quantification of the impact of climate change on future biogenic VOC emissions
remains complex. The most important effect might be an increase in emission ratesas a direct result of higher temperatures; however changes in cloudiness, precipitation,and land use may influence emissions as well. Little is known about the final combined25
effect of land-use change and climate change on VOC emissions. An exemplary modelstudy by Sanderson et al. (2002) combining climate change and land-use changes
suggests that global isoprene emissions may increase by 27%.
2.3. Uncertainties
– The overall knowledge of emissions both of primary carbonaceous particles andof gaseous precursors of SOA is far from being satisfactory. The overall uncer-tainties range between a factor of 2 and 5.5
– Significant effort needs to be put in improving the BC and OC inventories howeverprogress can be only achieved via standardizing the BC measurements.
– POA appears to be quite an important part of the carbonaceous aerosol. Howeveraccurate emission estimates received relatively little attention.
– Further studies based on coherent observations are required to construct reli-10
able POA emission inventories not only from the anthropogenic sources that arethe most commonly considered in modelling studies but also from the biogenicsources, the importance of which remains to be determined.
– Although sesquiterpenes are known to be the most efficient SOA precursors (seefurther discussion) their emission rates from vegetation have been poorly studied15
due to their high reactivity and require more attention in the future with targetedexperimental and modelling studies.
– Future studies to improve our knowledge on primary emissions invoke to integratevarious approaches to address these questions such as:
– enclosure measurements20
– above-canopy and deposition flux measurements of gases and aerosols
– ambient concentrations measurements
– both forward and inverse modelling to link emissions with observed concen-trations
– use of satellite observations in models to evaluate/improve emission inven-tories or derive them, see for instance examples by Abbot et al. (2003) andMartin et al. (2003).
– The consistency of emission inventories with the ambient observed concentra-tions can be evaluated by applying chemistry/transport models to simulate the5
observed concentrations based on these emission inventories.
3. Representation of secondary organic aerosol formation in atmospheric mod-els
The processes leading to SOA formation can be viewed as occurring sequentially:10
To represent SOA formation quantitatively requires each of these steps to be mod-elled. At present, although the potential importance of aerosol-phase chemistry15
has been recently established through the identification of oligomeric species (seeSect. 3.1); these reactions are not yet represented in models.
In this section we first summarize actual knowledge on the chemical reactions re-sponsible for SOA formation (Sect. 3.1) and on the involvement of SOA constituents innucleation (Sect. 3.2). Then, the gas-to-particle partitioning parameterisations used in20
atmospheric models (Sect. 3.3) are outlined and finally in Sect. 3.4 the actual repre-sentation of SOA formation in current global models is summarized.
3.1. Chemistry of secondary organic aerosol formation
Since monoterpenes would appear to be the major precursors of secondary organicparticulate matter (SOA) from BVOCs, much work has gone into investigating the re-25
actions of monoterpenes, particularly over the past decade. Summaries, up to 2000,of the gas-phase kinetics of the monoterpene reactions with OH and NO3 radicals andozone, products of these reactions and the pathways leading to their formation can befound in several review articles/books (e.g. Atkinson, 1997; Atkinson and Arey, 1998;Calogirou et al., 1999; Calvert et al., 2000). Seinfeld and Pankow (2003) have summa-5
rized laboratory studies of SOA formation performed over the last decade. The studieshave been categorized according to the experimental conditions employed such asNOx photooxidation, O3 reaction or OH reaction.
As a result of ever increasing information on the nature of the gas-phase productsand the composition of the resulting aerosol from the oxidation of monoterpenes much10
effort is now being spent in developing combined gas-phase kinetics and aerosol par-titioning models to represent secondary organic aerosol formation in ambient models.(e.g. Kamens et al., 1999; Kamens and Jaoui, 2001; Pankow et al., 2001; Seinfeld etal., 2001; Griffin et al., 2002a, b, 2003; Pun et al., 2002).
Most of the experiments on the atmospheric chemistry of monoterpenes, i.e. gas-15
phase kinetic rate coefficients, gas-phase product identification and quantification,quantification of SOA yields and its molecular composition, have been performed insmog chambers using either natural or artificial sunlight. Seinfeld and Pankow (2003)have discussed the pros and cons of the size of the chamber, indoor and outdoor cham-bers with artificial and natural light sources, etc and the arguments will not be pursued20
further here. However, irrespective of the type of chamber, chamber experiments haveinherent difficulties associated with the chemistry of SOA formation when extrapolatingthe results to atmospheric conditions.
– Carefully designed chamber experiments using modern analytical techniquesto allow accurate quantitative detection of organics at low concentrations, are25
needed to investigate SOA formation under atmospheric conditions.
In the case of the NOx photooxidation systems oxidation by the OH radical will initiallydominate, however, as the reaction proceeds, O3 and under some circumstances also
NO3 radicals will be formed in high enough concentration to compete with the OHradical oxidation. This makes assignment of the relative importance of the oxidantsOH, NO3 and O3 in the SOA formation problematic. In the ozonolysis reactions peroxyradicals will be formed which under most normal atmospheric conditions would reactwith NO to form alkoxy radicals. Ozonolysis experiments can not be performed in the5
laboratory in the presence of NOx since the NOx reacts rapidly with O3.
– It is, therefore still an open question as to whether the aerosol yields observed inlaboratory ozonolysis experiments are transferable to atmospheric conditions; inreality the yields could be higher or lower.
Recently, Docherty and Ziemann (2003), Ziemann (2003) and Keywood et al. (2004)10
have shown that the presence of OH scavenger in ozonolysis experiments has signif-icant impact on SOA yields. Keywood et al. (2004) explained this behaviour by theinvolvement of acylperoxyradicals formed via isomerisation of alkoxy radical which inturn are produced from Crieege Intermediates during ozonolysis of endocyclic alkenes.Winterhalter et al. (2000), Koch et al. (2000) and Jenkin et al. (2000) showed that15
acylperoxy radicals from both endo- and exocyclic monoterpenes are involved in theformation of dicarboxylic acids via permutation reactions with HO2 or RO2 radicals.These radical reactions are initiated by the decomposition of the excited Criegee Inter-mediates via the hydroperoxy channel or the ester channel (Calvert et al., 2000). Bonnet al. (2002) have recently shown that the addition of H2O and carbonyl compounds af-20
fects the yield of SOA. This observation was explained by the involvement of stabilizedCriegee Intermediates in the SOA formation processes.
The translation of these results to the real atmosphere requires thorough interpre-tation and further understanding of the corresponding chemical mechanisms. For thereaction of NO3 with monoterpenes this may also be an issue but because the reac-25
tions occur mainly during the night time when NO is low the effect (if any) will not be sofar reaching.
– In NO3 radical chamber chemistry systems, however, reactions of the high levels5872
of NOx often employed can block many reaction pathways, which would otherwisebe important under atmospheric conditions.
3.1.1. Gas phase reactions leading to semivolatile products
Because of the potential importance of monoterpenes to SOA formation much of theresearch related to elucidating the oxidation mechanisms and products of monoter-5
penes known to be emitted into the troposphere in substantial quantities (Atkinson andArey, 1998; Calogirou et al., 1999) has been focussed primarily on α- and β-pinene.Measurements of monoterpenes speciation suggest that these make a particularly sig-nificant contribution to global monoterpenes emissions (Guenther et al., 1994; Geronet al., 2000 and references therein). These monoterpenes are also representative of10
classes of monoterpenes having either an endocyclic double bond (in the case of α-pinene) or an exocyclic double bond (in the case of β-pinene), therefore, the discussionon monoterpenes chemistry leading to SOA will focus on these two compounds and,in particular, on α-pinene.
In the case of α-pinene considerable progress has been made in determining the15
kinetics and elucidating the mechanisms of the early stages of its gas-phase degrada-tion chemistry initiated by reaction with OH radicals (e.g. Arey et al., 1990; Hakola etal., 1994; Hallquist et al., 1997; Vinckier et al., 1997; Aschmann et al., 1998; Noziereet al., 1999a; Orlando et al., 2000; Jaoui and Kamens, 2001; Larsen et al., 2001;Wisthaler et al., 2001; Winterhalter et al., 2003), NO3 radicals (e.g. Wangberg et al.,20
1997; Berndt and Boge, 1997; Hallquist et al., 1997; Jang and Kamens, 1999) andozone (e.g. Hakola et al., 1994; Alvarado et al., 1998a; Kamens et al., 1999; Yu etal., 1999a; Koch et al., 2000; Orlando et al., 2000; Winterhalter et al., 2003). Thefurther oxidation of the major first generation product, pinonaldehyde, has also beenstudied quite extensively (e.g. Glasius et al., 1997; Hallquist et al., 1997; Alvarado et25
al., 1998b; Noziere et al., 1999a, b; Jaoui and Kamens, 2003a). There have also beensome theoretical studies of the oxidation mechanisms (Peeters et al., 2001; Vereeckenand Peeters, 2000).
The reactions with OH, NO3 and O3 lead to a large suite of oxygenated reaction prod-ucts which include aldehydes, oxy-aldehydes, carboxylic acids, oxy-carboxylic acids,hydroxy-carboxylic acids, dicarboxylic acids, organic nitrates etc. In addition, severalpeaks with m/z 187 [M+H]+ observed in the LC-MS analysis of filter samples fromthe oxidation of α-pinene (Hoffmann, 2001; Winterhalter et al., 2003) have been ten-5
tatively assigned to hydroperoxides; 2-hydroperoxy-3-hydroxypinane (2-hydroperoxy-2,6,6-trimethyl-bicyclo [3.1.1] heptan-3-ol) and 3-hydroperoxy-2-hydroxypinane (3-hydroperoxy-2,6,6-trimethyl-bicyclo [3.1.1] heptan-2-ol). Two isomers exist of eachcompound, so in principle four products may be present. Peroxo-pinalic acid (2,2-dimethyl-3-(2-oxo-oxoethyl)-cyclobutane-carboperoxoic acid) is also a possible prod-10
uct candidate. Table 4 gives the structures and IUPAC names of 30 of the productsobserved in the oxidation of a-pinene.
– There is mounting evidence from laboratory studies of monoterpenes oxidation byO3, OH and NO3 radicals that the most important process with regard to aerosolformation is the reaction with ozone (Hoffmann et al., 1997; OSOA project: Hoff-15
mann, 2001).
The contributions of the three major oxidation processes of monoterpenes (OH, NO3and ozone) to new aerosol formation and aerosol yield have been found in laboratorystudies to be very different for the three possible reactions.
– Ozone was found by far to have the highest potential to form new particles at20
similar reactant consumption rates of α-pinene as well as for β-pinene (Bonn andMoortgat, 2002).
– Reactions of the monoterpenes with either OH or NO3 result in remarkably lessnucleation but with minor differences in the new-formed aerosol volume comparedto the ozone reaction. This suggests that products with higher volatility than in the25
ozone experiments may have been formed in OH and NO3 reactions (Hoffmann,2001).
For new particle formation to occur by homomolecular nucleation, an oxygenated prod-uct must be generated in the gas phase at a concentration in substantial excess of itssaturation vapour concentration with respect to the condensed phase. Oxygenatedproducts capable of generating new particles in the atmosphere must of necessity beparticularly non-volatile. Inclusion of polar functional groups with retention of carbon5
number will reduce product volatility quite considerably in comparison with that of theparent hydrocarbon. Experimental evidence indicates that high molecular weight com-pounds containing the −OH, −C=O and, in particular, the carboxylic acid −C(=O)OHfunctionality are particularly important in this respect (e.g. Tao and McMurry, 1989; Yuet al., 1998 and references therein).10
Until recently, dicarboxylic acids were the lowest volatile compounds positively iden-tified in terpenes generated aerosol. Cis-Pinic acid (a C9 dicarboxylic acid) has beenidentified as a condensed product of the ozonolysis of both α- and β-pinene (e.g.Christoffersen et al., 1998; Hoffmann et al., 1998; Glasius et al., 2000; Kamens et al.,1999; Jaoui and Kamens, 2003b, c).15
It has been suggested (Koch et al., 2000; Winterhalter et al., 2000; Jenkin et al.,2000) that cis-pinic acid is the most likely photooxidation product of both α- and β-pinene that will result in prompt formation of new aerosols by nucleation. Pathwaysleading to cis-pinic acid have been suggested from the secondary reactions of the first-generation gas-phase products generated in monoterpenes photooxidation (Jenkin et20
al., 1997) or from their auto-oxidation in the condensed phase (Jang and Kamens,1999). However, as remarked by Jenkin et al. (2000) the observed timescale ofaerosol formation (Koch et al., 1999) appears to require that cis-pinic acid is itself a“1st-generation product”. Winterhalter et al. (2000), Koch et al. (2000) and Jenkin etal. (2000) have suggested a possible mechanism for the formation of cis-pinic acid from25
the ozonolysis of both α- and β-pinene. These mechanisms have been discussed byJenkin (2004). The key intermediate is an acyl radical (see circled intermediate inFig. 2, adopted from Winterhalter et al., 2000), which is formed from exo- and endo-cyclic alkenes, like α- and β-pinene. Two pathways are proposed for this acyl radical.
Either isomerisation of the complex C9-acyloxy radical by an 1,7 H atom shift (seeFig. 2, Pathway A: Jenkin et al., 2000) or reaction with HO2, yielding pinalic peroxoacid, which finally isomerizes to cis-pinic acid (Fig. 2: Pathway B: Winterhalter et al.,2000).
– There is, however, evidence that compounds less volatile than dicarboxylic acids5
are present in the aerosol.
Ziemann (2002) has presented evidence for the possible formation of diacyl perox-ides in the ozonolysis of cyclohexene and homologous compounds and has suggestedthat these compounds may be the major nucleating agent in these systems and arealso responsible for a significant fraction of the aerosol mass.10
Mechanisms have been developed to describe the reaction pathways leading tothese products. For example, explicit or lumped degradation schemes can be foundfor the chemistry of both α- and β-pinene either in the new version of the MasterChemical Mechanism (MCM version 3: Saunders et al., 2003; http://www.chem.leeds.ac.uk/Atmospheric/MCM/mcmproj.html) or SAPRC-97 and SAPRC-99 (Carter, 1997,15
1999). Figure 2 shows a schematic overview of the possible pathways in the ozonolysisof α-pinene leading to products which have been observed experimentally (Winterhal-ter et al., 2003) indicating also the formation of hydroxyperoxides. Recent effort byJenkin (2004) to model the formation and composition of SOA produced during theozonolysis of pinene using the MCM mechanism (v3) is also pointing to the key role20
of multifunctional products of VOC oxidation in SOA formation which contain, for ex-ample, the hydroperoxide functionality. Bonn et al. (2004) have also pointed out theimportance of hydroperoxides in global SOA formation.
3.1.2. Organic polymerisation in the aerosol phase
A long-standing puzzle associated with the analysis of molecular speciation of SOA has25
been the presence in the aerosol of species whose vapour pressures are far too high tosupport significant partitioning into the aerosol phase (Forstner et al., 1997a, b; Yu et
al., 1998, 1999a, b). It was speculated that these relatively small and volatile speciesmight actually be decomposition products of larger, less volatile molecules that werebroken apart by the relatively harsh environment of the mass spectrometric methodstraditionally used for analysis. Very recently, high molecular weight (and therefore lowvapour pressure) products have been identified in the aerosol phase using analytical5
techniques that do not tend to break the molecules apart (Kalberer et al., 2004; Tolockaet al., 2004; Gao et al., 2004). Experimental results are just now emerging, but theexistence of heterogeneous reactions between semi-volatile condensed SOA productsto yield compounds of much lower volatility could play an important role in causing SOAyields to exceed those calculated solely on gas-particle partitioning of the gaseous10
semi-volatile oxidation products.Oligomer and/or polymer formation following both biogenic and anthropogenic VOC
degradation has been proven and may be considered as responsible for an importantfraction of the SOA chemical build up in the troposphere (Tolocka et al., 2004; Kalbereret al., 2004; Gao et al., 2004). Limbeck et al. (2003) have shown that SOA formation of15
atmospheric polymers – humic like substances – occurs by heterogeneous reaction ofisoprenoid and terpenoid emission in the presence of a sulphuric acid aerosol catalyst.Jang et al. (2002, 2003) presented chemical mechanisms leading to the formation oflow volatility organic products from oxidation of aldehydes by acid-catalysed heteroge-neous reactions. Iinuma et al. (2004) and Gao et al. (2004) found that acid catalysis20
can increase by about 40% the particle phase organics produced during ozonolysisexperiments and suggest that condensation of smaller molecules takes place by poly-merization or aldol condensation following the formation of aldehydes from terpenesozonolysis. Tolocka et al. (2004) and Gao et al. (2004) have identified oligomers aslarge as tetramers in chamber experiments during α-pinene ozonolysis using acidic25
inorganic seed aerosol. They conclude that α-pinene ozonolysis in the presence ofan acid catalyst is strongly influenced by oligomerisation reactions of primary ozonoly-sis products, most likely by aldol condensation and/or gem-diol formation (Fig. 3). Anion consistent with the dimer of pinonaldehyde has been also detected on ambient
aerosols (Tolocka et al., 2004). These recent discoveries provide a new point of viewfor SOA formation experimental studies and modelling. The exact mechanisms of theoligomer and/or polymer formation and their significance for the chemical formationand properties of the secondary organic aerosol remain to be determined.
3.1.3. Multiphase oxidation of hydrated gases5
Claeys et al. (2004a) have analysed aerosols from the Amazonian rain forest and iden-tified in the fine size fraction considerable quantities of a mixture of two diastereoiso-meric 2-methyltetrols, the 2-methylthreitol and the 2-methylerythritol, which they pro-posed could be explained by OH-initiated isoprene oxidation. Note that, until recently,isoprene was not considered a significant contributor to SOA.10
The first paper was followed very quickly by a second, Claeys et al. (2004b), in whichthey revise the mechanism postulated in Claeys et al. (2004a) by which 2-methyltetrolsare generated from isoprene. In their latest study they propose the multiphase acid-catalysed oxidation of isoprene, methacrolein and methacrylic acid with hydrogen per-oxide as a new route to SOA formation. They mention that partitioning of isoprene15
into the aqueous phase is expected to be enhanced under acidic conditions since iso-prene is hydrated in aqueous solutions of sulphuric acid (Ryabova et al., 1992). Basedon preliminary kinetic studies, Claeys et al. (2004b) suggest that these SOA formingreactions are more likely to occur in hydrated aerosols or haze droplets rather thanin short-lived cloud droplets. Finally, they suggest that monoterpenes and their gas20
phase oxidation products might undergo similar multiphase reactions leading to SOAformation.
This proposed multiphase mechanism, reaction with hydrogen peroxide under acidicconditions is an analogue to atmospheric sulphate formation and is different from allpreviously mentioned mechanisms. The importance of this new route in the global SOA25
formation requires investigation; however, this will only be possible when an improvedunderstanding of the actual mechanism and the associated kinetic data become avail-able.
Over the past decade significant progress has been made in our understanding of thegas-phase oxidation mechanisms of biogenic hydrocarbons. However, our knowledgeis far from being complete and many gaps exist in the determination
– of all potential gaseous anthropogenic and biogenic precursor molecules of SOA,5
– of the secondary photooxidation processes in the gas phase leading to low volatil-ity compounds and thus to SOA formation,
– of the impact of NOx levels on the final products of the SOA formation chemistry
– of the heterogeneous reactions between particle associated substances andgaseous compounds able to modify the composition and the mass of aerosol,10
– of the aerosol chemistry responsible for the recently reported oligomer formationwhich increases the aerosol mass,
– of the aqueous phase chemistry, which might produce semi-volatile compoundsthat build up aerosol mass,
– of the complete molecular composition of the aerosol produced from the above15
mentioned processes.
A full appreciation of all the processes involved will probably have to await the evolutionof new more powerful analytical probing techniques that are starting to emerge. Furtherexperimental work is also needed in order to translate laboratory results obtained inhigh concentrations of organic precursors and oxidants to atmospheric conditions with20
The ability of SOA compounds to form new particles in the atmosphere is a rathercontroversial issue. In the laboratory, formation of new particles is routinely observedduring oxidation of SOA precursors (Stern et al., 1987; Hatakeyama et al., 1989; Pan-dis et al., 1991; Wang et al., 1992; Hoffmann et al., 1998; Koch et al., 2000; Hoppel et5
al., 2001; Bonn et al., 2002). However, these experiments often use moderate to highconcentrations of VOCs and no pre-existing aerosol. For example, reaction of 20 ppbof α-pinene with 120 ppb of ozone and no pre-existing particles can create 50 000 cm−3
(Hoppel et al., 2001). Nucleation in these systems (even at high concentrations) canbe relatively easily suppressed if a moderate concentration of seed aerosol is present10
(Cocker et al., 2001a, b). In this case the SOA compounds condense on the pre-existing aerosols and nucleation does not take place at the same time. Many studieshave reported rather frequent nucleation events in the boundary layer and free tropo-sphere in a variety of environments (see Kulmala et al., 2004a for a review of fieldobservations). It has been suggested that some of these observed new particle for-15
mation events in remote areas may be due to nucleation of biogenic SOA compounds(Marti et al., 1997; O’Dowd et al., 2002; Kavouras and Stephanou, 2002).
The potential for the formation of new particles during various reactions of α- andβ-pinene was investigated by Bonn and Moortgat (2002). Their experiments indicatedthat the ozonolysis dominates the new particle formation compared to the reactions20
with OH and NO3. The authors argued that ozonolysis is probably the only atmospher-ically relevant organic source for new particle formation, because of the low atmo-spheric concentrations of these biogenic compounds. The formation of new particlesduring the monoterpenes ozonolysis is negatively affected by water vapour (Bonn etal., 2002). Bonn and Moortgat (2002) suggested the involvement of stabilized Criegee25
Intermediates and the formation of secondary ozonides as nucleating species. Bonnand Moortgat (2003) argued that the atmospheric new particle formation observed inremote areas and generally attributed to low-volatility oxidation products of monoter-
penes may be actually initiated by products of sesquiterpenes reactions with ozone.The cyclic alkene ozonolysis experiments of Ziemann (2002) suggested that diacylperoxides and not dicarboxylic acids might be the nucleating agents in SOA systems.Hoppel et al. (2001) concluded that the nucleating species during α-pinene ozonoly-sis must have a saturation mixing ratio lower than 10 ppt at 25◦C and that classical5
nucleation theory is not able to explain their observations.The analysis of all the measurements in a boreal forest site in Southern Finland indi-
cated that the most probable new particle formation mechanism in the area is ternarynucleation of water-sulphuric acid-ammonia (Kulmala et al., 2001; Janson et al., 2001).After nucleation the major part of the growth is probably due to condensation of or-10
ganic vapours. However, there is lack of direct proof of this phenomenon becausethe composition of 1–5 nm size particles is extremely difficult to determine using thepresent state-of-art instrumentation. Similar conclusions have been reached by Martiet al. (1997) about new particle formation in Colorado and by Gaydos et al. (2004)about the nucleation events in the NE US. Gao et al. (2001) also concluded based on15
their smog chamber studies that sulphuric acid is a superb nucleating species, whilesecondary organic compounds probably play a role more confined to growing newlyformed particles. The dominance of sulphuric acid as a nucleating agent over atmo-spheric organics was also suggested by the work of Tobias et al. (2001). The authorsinvestigated the formation of new particles in the exhaust of a diesel engine and con-20
cluded that the results were consistent with a mechanism of nanoparticle formationinvolving nucleation of sulphuric acid and water, followed by particle growth by conden-sation of organic species.
Kulmala et al. (2004a) in their review of the available field observations of nucleationconcluded that organic vapours could, in principle, participate in nucleation, but nucle-25
ation mechanisms that involve organics have not yet been identified. It appears verylikely, however, that organics contribute to the growth of nucleated particles and indi-rectly affect the formation rate of new particles of detectable sizes (Zhang and Wexler,2002; Anttila and Kerminen, 2003; Kulmala et al., 2004b). Boy et al. (2003) estimated
that condensation of monoterpenes oxidation products is able to explain 10–50% ofthe observed growth rates of fresh particles in Southern Finland.
Garman et al. (2004) investigated theoretically the binary homogeneous nucleationof water-succinic acid and water-glutaric acid based on the classical nucleation theory.They concluded that under atmospheric conditions these binary systems would not5
form new particles. Kavouras and Stephanou (2002) measured, by using a minimizingartifacts sampling device, biogenic primary organic polar compounds and monoterpenecarbonyl and acidic photooxidation products in both gas and particles over a Mediter-ranean conifer forest. On the basis of these field measurements they calculated satu-ration concentrations of the acidic and carbonyl photooxidation products for non-ideal10
conditions using a previously developed absorptive model (Pankow, 1994). The resultsof this study suggested that the formation of SOA goes on through a heterogeneousheteromolecular nucleation mechanism, where the effects of both pre-existing organicaerosol (mostly primary) and ambient temperature are crucial.
The absence of nucleation events in the Amazon (Andreae, Swietlicki personal com-15
munication), an environment with very low sulphur concentrations but very high bio-genic VOC concentrations, strongly suggests that nucleation of purely SOA compoundsin the atmosphere may not be that frequent.
Zhang et al. (2004) based on laboratory experiments of mixtures of aromatic acidvapours (benzoic and p- and m-toluic acids) with sulphuric acid (H2SO4) have shown20
that the presence of these organic acids enhance sulphuric acid nucleation. Based onbonding energies theoretical calculations, they explain these finding by the formationof aromatic acid- sulphuric acid complexes via two hydrogen bonds. The organic acidmolecule acts as both a hydrogen bond donor and acceptor (see supporting material inZhang et al., 2004). These new findings on a heteromolecular nucleation mechanism in25
which both sulphuric acid and organic acids are involved could be of crucial importanceto understand formation of new particles of a few (3–4) nm size in polluted areas whereboth sulphuric and organic acids exist at significant levels. Kulmala et al. (2004b)further presented a new theory that explains new particle formation via activation of
– Therefore, based on current knowledge there is no proof that homogeneous nu-cleation of organics occurs and is of any significance for global scale modelling.
– Organics also contribute to the growth of nucleated particles and indirectly affectthe formation rate of new particles of detectable sizes.5
– There is emerging evidence that heteromolecular nucleation involving organicsmight be crucial for understanding new particle formation in polluted areas of theglobe.
– Characterisation of the chemical composition of the aerosol at the very early stageof its formation is critical for identifying the nucleating agents.10
3.3. Gas-particle partitioning
Semi-volatile VOC oxidation products tend to partition between the gas and particulatephases. The ambient atmospheric particulate phase will consist, in general, of a mix-ture of organic and inorganic components, as well as water, and itself may consist ofone or more phases; if more than one phase exists, it has generally been presumed15
that one of the phases is primarily an organic phase and the other is predominantlyan aqueous phase. The basic theory of equilibrium gas-particle partitioning of a con-densable organic species into an aerosol phase consisting, in general, of an organicsub-phase and an aqueous sub-phase can be described as follows (Griffin et al., 2003).
Let the organic aerosol-phase concentrations of each of the partitioning secondary20
organic species be denoted as Oi (µg m−3 air), i=1,2. . . , n, where n is the numberof partitioning species. The equilibrium organic aerosol-phase partitioning coefficient,Kom,i , describes the distribution of each product between the gas phase and an ab-sorbing organic aerosol phase. If Gi denotes the gas-phase concentration of species
i (µg m−3 air) and Mo the total mass concentration (µg m−3 air) of organic aerosolavailable to act as an organic medium into which the n species may partition, then
Kom,i =Oi
MoGi, (1)
where Mo is the sum of all Oi and the mass concentrations of each primary organicaerosol species present. Gi for each species is computed from Eq. (1) once the set of5
Kom,i (m3 air µg−1) values is calculated according to (Pankow, 1994):
Kom,i =RT
106MWomγipoL,i
, (2)
where R is the ideal gas constant (8.2×10⁻⁵ m3 atm mol−1 K−1), T is temperature (K),MWom is the average molecular weight (g mol−1) of the absorbing organics (includingboth primary organic compounds and secondary products), po
L,i is the pure component10
vapour pressure (atm) of species i , and γi is the activity coefficient of species i in theorganic phase. The activity coefficient γi describes the nonideal interaction betweendissolved species i and the other components of the solution. A value of γ above1, for example, means that the compound in question is not easily miscible with theabsorbing aerosol, and the nonideal interactions favour its remaining in the gas phase.15
The factor 106 converts g to µg. The molecular identities of the condensing and primarynon-volatile species must be known in order to calculate the parameters in Eq. (2).These include species-specific molecular weights and vapour pressures as a functionof temperature.
The gas-particle partitioning coefficient Kom,i is inversely proportional to the pure20
component vapour pressure of species i . Thus, uncertainties in the value of vapourpressure translate directly into uncertainties in the predicted gas-particle partitioning.
Species i may also partition to an aqueous particulate phase. If Ai represents theaqueous-phase concentration of species i (µg m−3 air) and Hi the Henry’s law coeffi-
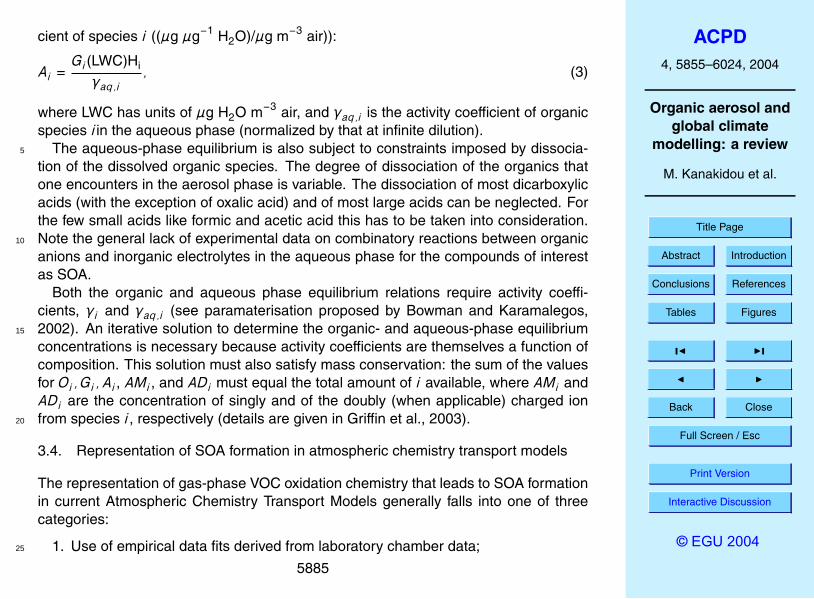
where LWC has units of µg H2O m−3 air, and γaq,i is the activity coefficient of organicspecies i in the aqueous phase (normalized by that at infinite dilution).
The aqueous-phase equilibrium is also subject to constraints imposed by dissocia-5
tion of the dissolved organic species. The degree of dissociation of the organics thatone encounters in the aerosol phase is variable. The dissociation of most dicarboxylicacids (with the exception of oxalic acid) and of most large acids can be neglected. Forthe few small acids like formic and acetic acid this has to be taken into consideration.Note the general lack of experimental data on combinatory reactions between organic10
anions and inorganic electrolytes in the aqueous phase for the compounds of interestas SOA.
Both the organic and aqueous phase equilibrium relations require activity coeffi-cients, γi and γaq,i (see paramaterisation proposed by Bowman and Karamalegos,2002). An iterative solution to determine the organic- and aqueous-phase equilibrium15
concentrations is necessary because activity coefficients are themselves a function ofcomposition. This solution must also satisfy mass conservation: the sum of the valuesfor Oi , Gi , Ai , AMi , and ADi must equal the total amount of i available, where AMi andADi are the concentration of singly and of the doubly (when applicable) charged ionfrom species i , respectively (details are given in Griffin et al., 2003).20
3.4. Representation of SOA formation in atmospheric chemistry transport models
The representation of gas-phase VOC oxidation chemistry that leads to SOA formationin current Atmospheric Chemistry Transport Models generally falls into one of threecategories:
1. Use of empirical data fits derived from laboratory chamber data;25
2. Use of completely explicit gas-phase oxidation for the VOCs in question to predictthe spectrum of condensing products;
3. Use of lumped gas-phase oxidation mechanisms derived from simplification offully explicit mechanisms.
The purpose of the mechanism in (2) and (3) is to predict condensable products from5
gas-phase oxidation of the parent VOC.The formation of SOA from a particular VOC is often described in terms of the frac-
tional mass yield, Y , which relates how much particulate matter is produced when acertain amount of parent gaseous VOC is oxidized:
Y =Mo
∆V OC, (4)
10
where Mo (µg m−3) is the mass concentration of SOA produced from the reaction of∆V OC (µg m−3).
Two product yield method. Odum et al. (1996) utilized the concepts of multicompo-nent gas-particle partitioning to develop a framework for parameterising the trend ofincreasing Y values with increasing Mo for chamber experiments involving water-dry15
aerosols. Assuming that the photooxidation of a parent VOC can be represented asleading to just two overall semi-volatile products P1 and P2, then
where p1 and p2 are molar stoichiometric coefficients. Reaction (9) does not repre-sent a fundamental reaction but rather a convenient way to represent observed data.20
Then α1=p1×MWP1/MWVOC and α2=p2×MWP2
/MWVOC are the mass stoichiometricfactors for the production of P1 and P2 from the parent hydrocarbon (VOC) with MWP1,MWP2 and MWVOC the molecular weights of P1, P2 and VOC, respectively (Seinfeldand Pankow, 2003).
Using the mass-based stoichiometric coefficients, αi , the result for the overall yieldY is:
Y =∑i
Yi =∑i
αi
( Kom,iMo
1 + Kom,iMo
), (6)
where Yi is the individual contribution to the yield from compound i .The above framework has been used extensively in analysing yield data for labora-5
tory smog chamber experiments conducted in the absence of water, for a wide rangeof parent VOC compounds. Each of those experiments has been described by fittingthe Y versus Mo data by assuming that two hypothetical average product compounds,P1 and P2, were formed. Yield data are not generally fit well by assuming a singleproduct, and the assumption of three products does not improve the fits significantly.10
In a two-product fit (i=2), there are four fitting parameters: two αi values and two Kom,ivalues and are used to fit a monotonically increasing curve that goes through zero.This method guarantees a good fit under the studied experimental conditions howeverits applicability to different conditions requires to be carefully checked. The empiricaltwo-product representation of SOA formation has been highly successful in fitting labo-15
ratory SOA yield data at the California Institute of Technology for over 50 parent VOCs(Odum et al., 1997; Griffin et al., 1999a). Even though its simplicity and its basis inactual laboratory data are strong points, the approach suffers disadvantages for usein atmospheric models. It is well established that, even for a single VOC, many morethan two products are involved in SOA formation and, as conditions such as tempera-20
ture and oxidant level change, a different distribution of products might be condensingthan those on which the original correlation was based. Laboratory experiments havegenerally been carried out in a modest temperature range around 298 K. At tempera-tures of the upper troposphere, oxidation products that might otherwise remain largelyor wholly in the gas phase around 298 K may shift to the SOA phase. Such behaviour25
cannot be captured by a two-component model derived on the basis of higher temper-ature chamber data.
Detailed chemical mechanisms. The approach to the gas-phase modelling step ofSOA formation that is at least in principle most chemically rigorous is to represent thegas-phase chemistry with a fully explicit mechanism. An example of such a mech-anism is the University of Leeds Master Chemical Mechanism version 3.0 (MCM3)(http://www.chem.leeds.ac.uk/Atmospheric/MCM/mcmproj.html). The use of a chemi-5
cally explicit mechanism could impart a degree of confidence when all conceivable im-portant chemical paths have supposedly been accounted for and have been carefullyevaluated against measurements. Unfortunately this is not the case of SOA formingchemical mechanisms since the rate constants of many among the involved reactionshave not been determined in the laboratoty. While such a detailed mechanism is im-10
portant for evaluating the extent of agreement of predictions of a chemically explicitmechanism with chamber data, the computations associated with using such a mech-anism in a regional or global atmospheric model render it completely impractical.
Recently, Jenkin (2004) has summarized actual knowledge on the α- and β- pineneozonolysis in the MCM v3 mechanism. He considered equilibrium absorptive parti-15
tioning of a total of about 200 semivolatile products and has been able to reasonablydescribe the SOA accumulation when substantial SOA mass was already present andthe partitioning coefficients of the semivolatiles have been increased by 2 orders ofmagnitude compared with those based on estimated vapour pressures. The consid-eration of the gas phase production and subsequent transfer to the aerosol phase of20
involatile dimers of 22 bi- and multifunctional carboxylic acids in the MCM v3 allowedthe description of the early stages SOA formation i.e. at low mass concentrations. Thismechanism has been evaluated against some chamber experiments with regard to theSOA mass accumulation. The computed SOA mass consists in majority from multi-functional acid products and increasing contributions from more volatile products, like25
pinonaldehyde and nopinone, with increasing aerosol mass.Regional or tropospheric-scale ozone chemistry is typically represented by lumped
mechanisms, those in which reactions of similar type are grouped together or in whichthe chemistry of certain species is used to represent that of a wide spectrum of related
species. The mechanisms have been tested to insure they exhibit the proper responseof calculated O3 concentrations to changes in key variables, such as NOx level. Signif-icant deviations between gas phase chemical mechanisms in the calculated NO2 andorganic peroxy radicals concentrations are encountered when comparing them underhigh NOx conditions due to the different simplification of the organic peroxy radical5
chemistry (Gross and Stockwell, 2003; Poschl et al., 2000). In addition, such evalua-tions are limited by the experimental data on which the chemical mechanisms rely. Asdiscussed in Sect. 3.1 ozonolysis experiments might be biased by OH formation in thechamber and have been performed in the absence of NO, thus neglecting reaction ofproducts with NO that can be of atmospheric relevance. Similarly, NO3 chamber exper-10
iments are performed under very high NOx levels that block ‘clean’ chemistry pathways(like permutation reactions and hydrogenperoxide formation paths).
Although significant advances have been made in understanding the SOA formation,targeted chamber and field experiments are needed to allow evaluation and provideconfidence to chemical mechanisms used in regional and global models that treat both15
gas phase chemistry and SOA formation. Approaches based on lumped mechanismsare just starting to emerge in regional/global modelling of SOA (see, for example, Griffinet al., 2002a), and it is this direction that offers the most promise for development ofchemically realistic models of SOA formation in the next ten years or so. The gas-phase chemical mechanism predicts the amounts of oxidation products; the next step20
is to partition those products between the gas and aerosol phases. First, it is generallyestablished that such products will tend to partition themselves between the gas andparticulate phases in accord with the equilibrium relations discussed in Sect. 3.3. Butseveral questions arise:
1. What is the nature of the particles to which the condensable species are partition-25
ing? Does primary organic aerosol also act as an absorbing medium in additionto the already-condensed SOA? Is liquid water in the particles present as a sep-arate aqueous phase into which gaseous oxidation products may also dissolve?To what extent does the presence of the condensed SOA induce the further con-
2. Is gas-aerosol equilibrium for the condensing organic species established rapidlyor are the kinetics of condensation/evaporation important?
3. Are aerosol-phase reactions occurring involving the condensing SOA products?
SOA in global models. Consideration of the OA in regional modelling has started in the5
80s with pioneering work by Pilinis et al. (1987). Since then a lot of progress has beenmade in regional/urban modelling of SOA whereas only recently a few global mod-elling efforts have emerged. Generally, because of computational considerations, theurban/regional models include a more detailed representation of SOA formation thando the global models. This is reflected both in the size of the gas-phase VOC oxida-10
tion mechanism and in the level of detail in the gas-particle partitioning calculation. Inglobal models, because of the considerably larger time steps, the equilibrium assump-tion appears to be valid (Koo et al., 2003b). This outcome is fortuitous because it isunlikely that global models could accommodate the significant computational burdenassociated with a kinetic calculation of gas-particle partitioning of SOA components.15
There exist two sensitivity studies of SOA modelling, one on regional scale (Pun etal., 2003) and the second on global scale (Tsigaridis and Kanakidou, 2003), both ofwhich illustrate the wide degree of variation in predicted SOA depending on the actualmodel used or on assumptions made about the gas-particle partitioning process. Punet al. (2003) investigated differences among three SOA modules caused by the repre-20
sentation of terpenes, the mechanistic versus empirical representation of SOA-formingreactions, the identities of SOA, and the parameters used in the gas/particle partition-ing calculations. Tsigaridis and Kanakidou (2003) investigated differences caused bythe assumptions in the parameters used for the gas/particle partitioning calculations,in the primary emissions of POA and in the hydrophobic to hydrophilic conversion.25
Table 5 presents a summary of the recent global modelling studies that include SOAand their main assumptions. The models in this table follow rather different approaches;they assume different substrates for the condensation of SOA as well as the surrogate
VOC compounds considered to form SOA precursors and have different treatment ofthe evaporation. They also differ in the consideration or not of primary carbonaceousaerosol and in the amount of it that is being emitted into the atmosphere. To these con-ceptual particularities of the models, more generally applied technical differences areadded. For instance, models differ in the spatial and temporal resolutions, the param-5
eterisations and input data used to represent transport and wet deposition processes.Therefore, global SOA formation estimates vary by almost a factor of 6 between about12 and 70 Tg SOA y−1. This reflects the uncertainty in our current understanding of theSOA occurrence in the global troposphere.
One draws the following conclusions concerning the treatment of SOA in global mod-10
els:
– Use of detailed gas-phase VOC oxidation mechanisms is not currently feasible inglobal atmospheric models. At the other extreme, however, laboratory chamberstudies have not been carried out over a sufficient parameter range to provideentirely empirically-based representations of SOA formation. A need exists to15
develop robust, lumped mechanisms capable of representing the generation ofcondensable products.
– The gas-particle partitioning is among the key processes. It cannot simply be as-sumed that all semi-volatile products condense entirely or that they always con-dense in the same proportion regardless of conditions. Therefore, it is necessary20
to represent the details of gas-particle partitioning in global models. Condens-able SOA products will dissolve in both organic and aqueous aerosol phases, andthe organic phase can consist of primary organic aerosol as well as condensedSOA itself. Since the nature of the aerosol phase is important in this partitioning,it will be necessary to account for the presence of primary organics as well as25
inorganics that govern the amount of condensed water in the global model.
– The extent to which heterogeneous aerosol chemistry is important in SOA forma-tion is currently unknown. The effect of heterogeneous reactions is to form larger
molecules through addition reactions; such molecules have significantly lowervapour pressures than the addition partners, essentially freezing these moleculesin the aerosol phase (i.e. increasing Kom). At present, not enough is known aboutsuch chemistry to include it explicitly in global SOA models; based on recentchamber results it may be possible to estimate its importance through sensitivity5
studies.
4. Aerosol dynamics
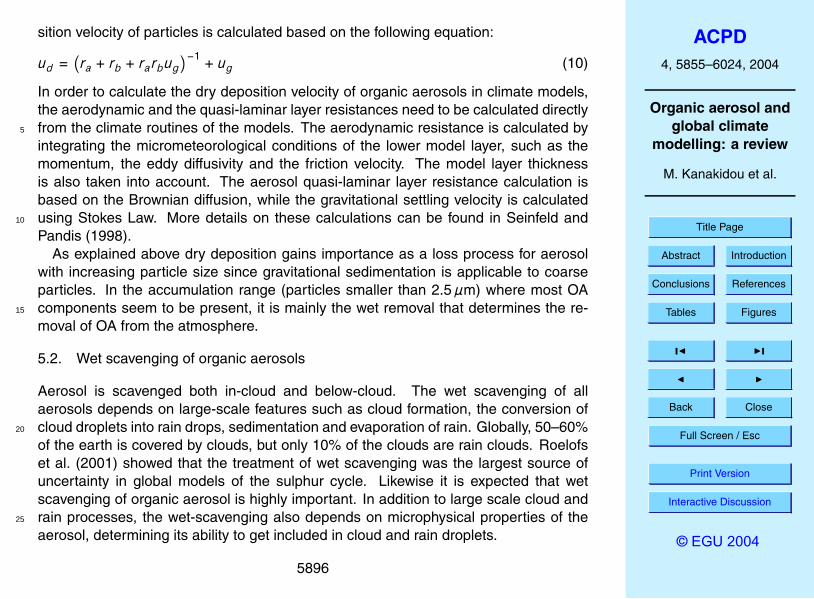
The ageing and removal of particles from the atmosphere as well as their climatic im-pact depends among other parameters on their size distribution that is determined byaerosol dynamics (the description of the aerosol using size distributions, condensa-10
tion/evaporation of material, and coagulation). There are few studies evaluating theseaspects of OA. Therefore there is a high degree of uncertainty in the evaluation of theaerosol dynamics of OA.
4.1. Size distribution
Various approaches have been developed to represent the size distribution of aerosols15
in models:
– the bulk mass approach,
– the sectional approach (e.g. Zhang et al., 2004a; Gelbard and Seinfeld, 1980)where the aerosol are usually assumed internally mixed and properties of theparticles, such as mass and chemical composition, are assumed uniform within20
each size bin (Griffin et al., 2002),
– the modal approach where the size distribution is described by several modes,and usually a log-normal distribution is used to represent the size distribution ineach mode (e.g. Schell et al., 2001; Whitby and McMurry, 1997).
Most of the modelling applications to urban and regional air quality have focused onaerosol mass distributions whereas aerosol number distributions have received a minorattention due to major availability of aerosol mass measurements compared to numberconcentrations. In most cases the only available measurements are the total massof particles smaller than a certain size (PM2.5 and PM10). Furthermore number size5
distributions are more sensitive to dynamic processes such as coagulation than massdistributions. Based on actual knowledge, in global models organic aerosol mass isassumed to be distributed mainly in the accumulation mode.
4.2. Condensation/evaporation
The mass transfer flux (J) of an organic species from the gas phase to the aerosol10
phase is proportional to the difference between its gas-phase concentration, c∞, andequilibrium concentration at the particle surface, ceq, (Seinfeld and Pandis, 1998):
J = 4πRpDi f (Kn, a)(c∞ − ceq
), (7)
where Rp is the particle radius, Di is the gas-phase diffusivity. f (Kn, a) is the correctionto the mass transfer flux due to noncontinuum effects and imperfect accommodation,15
Kn is the Knudsen number and a is the accommodation coefficient.The organic vapour condenses onto the particle phase when c∞>ceq. The equilib-
rium concentration depends not only on the properties of the organic species but alsoon its ability to form solutions with compounds already present in the aerosol phase(see Sect. 3.3). Equilibrium tends to be achieved more quickly for small particles than20
large ones (see, for example, Meng and Seinfeld, 1996) and growth of aerosols occurson a time scale of minutes to hours.
Koo et al. (2003b) using a one-dimensional Lagrangian trajectory model have beenexplored whether gas-particle equilibrium may be assumed to hold instantaneously orwhether gas-particle mass transfer needs to be treated kinetically. They found that the25
equilibrium assumption is valid for the conditions examined. For global climate appli-cations, because of the considerably large time steps used, the dynamic treatment of
condensation/evaporation may be avoided and equilibrium assumed. However, recentstudies show that other processes, e.g. polymerization (Kalberer et al., 2004; Tolockaet al., 2004), have a significant effect on the composition and volatility of SOA, whichmay be more important than classical microphysical processes and requires investiga-tion.5
4.3. Coagulation
Coagulation is a function of both the particle number concentration and particle size(Seinfeld and Pandis, 1998). The rate of change of the number concentration of a poly-disperse aerosol due to (Brownian) coagulation depends on the coagulation coefficientk1,2 that can be expressed by10
k1,2=4π (r1 + r2) (D1 + D2)β, (8)
where D1 and D2 are the particle diffusion coefficients, r1 and r2 the radius of theparticles and β is the Fuchs correction factor (Fuchs, 1964). Coagulation may have animportant impact on particle number concentration when the concentrations are high,i.e. close to emission sources, or may affect particle mass and chemical composition15
by internally mixing particles.In most urban and regional modelling applications that focus on aerosol mass dis-
tributions, coagulation can be ignored (Wexler et al., 1994). However, for studies thatfocus on aerosol number, and that consider fine mode aerosol distribution, coagulationis one of the most important processes that reduce aerosol number. So far no study20
has been done specifically on the importance of coagulation on secondary organicaerosol properties. The importance of coagulation in transforming insoluble particlesinto soluble is discussed in Sect. 6.2.
Dry deposition of aerosols is a significant removal process close to the ground. Modelscalculate the dry deposition flux F by assuming that it is directly proportional to theconcentration C of the deposited species:5
F = −udC (9)
The dry deposition velocity ud , is calculated based on the electrical resistance analogy.According to this, the deposited species has to overcome three resistances connectedin series prior to deposition: the aerodynamic resistance ra, the quasi-laminar layerresistance rb and the canopy resistance rc. The aerodynamic resistance is controlled10
by the turbulent transport of the species from the atmosphere close to the surface, whilethe quasi-laminar resistance depends on the molecular properties of the depositedspecies and the surface characteristics. The canopy resistance is controlled greatlyby the surface characteristics, since the species are assumed deposited only if theycannot escape back to the atmosphere after the direct contact with the surface. For15
aerosol species, the canopy resistance is equal to zero, since it is generally assumedthat whenever a particle reaches the surface it has been deposited. More details of theresistance model can be found elsewhere (e.g. Seinfeld and Pandis, 1998; Wesely andHicks, 2000).
The most critical factor controlling the dry deposition velocity of aerosols is the par-20
ticle size, aerosol mass density being the second factor affecting sedimentation of thelarger particles. Very small particles behave much like gases, making turbulent trans-port and Brownian diffusion the most efficient removal pathways from the atmosphere,while large particles, due to their weight, the settle to the surface due to gravity, witha gravitational settling velocity ug. Medium-sized particles do not have a very efficient25
removal pathway, and have the longest lifetimes concerning dry deposition. The depo-
sition velocity of particles is calculated based on the following equation:
ud =(ra + rb + rarbug
)−1 + ug (10)
In order to calculate the dry deposition velocity of organic aerosols in climate models,the aerodynamic and the quasi-laminar layer resistances need to be calculated directlyfrom the climate routines of the models. The aerodynamic resistance is calculated by5
integrating the micrometeorological conditions of the lower model layer, such as themomentum, the eddy diffusivity and the friction velocity. The model layer thicknessis also taken into account. The aerosol quasi-laminar layer resistance calculation isbased on the Brownian diffusion, while the gravitational settling velocity is calculatedusing Stokes Law. More details on these calculations can be found in Seinfeld and10
Pandis (1998).As explained above dry deposition gains importance as a loss process for aerosol
with increasing particle size since gravitational sedimentation is applicable to coarseparticles. In the accumulation range (particles smaller than 2.5µm) where most OAcomponents seem to be present, it is mainly the wet removal that determines the re-15
moval of OA from the atmosphere.
5.2. Wet scavenging of organic aerosols
Aerosol is scavenged both in-cloud and below-cloud. The wet scavenging of allaerosols depends on large-scale features such as cloud formation, the conversion ofcloud droplets into rain drops, sedimentation and evaporation of rain. Globally, 50–60%20
of the earth is covered by clouds, but only 10% of the clouds are rain clouds. Roelofset al. (2001) showed that the treatment of wet scavenging was the largest source ofuncertainty in global models of the sulphur cycle. Likewise it is expected that wetscavenging of organic aerosol is highly important. In addition to large scale cloud andrain processes, the wet-scavenging also depends on microphysical properties of the25
aerosol, determining its ability to get included in cloud and rain droplets.
The most important process by which organic aerosols are scavenged is formationand removal of cloud condensation nuclei. The Kohler equation describes the aerosolnucleation process (Kohler, 1936; Shulman et al., 1996; Seinfeld and Pandis, 1998).Other processes include diffusion scavenging by activated raindrops and impaction byhydrometeors either in the solid phase (ice and snow) or liquid phase. In addition, cloud5
droplets can be intercepted by larger falling raindrops. All the scavenging processesmentioned above will reduce aerosol number concentrations. This decrease in aerosolnumbers is particularly efficient for the accumulation mode.
The entrainment of air in clouds occurs very differently depending on the cloud type:large scale or convective. In the case of convective clouds, air is either entrained at10
the basis of cloud either between the base and the top through multiple entrainment-detrainment entry points along the tower of the updraft. Whether the aerosol is scav-enged by aerosol nucleation or by impaction below cloud from the falling hydromete-ors, it is relevant to measure whether the aerosol is in the liquid phase in clouds or inthe interstitial air. The partitioning of organics compounds between cloud water and15
interstitial air in cloud was investigated among others by Facchini et al. (1999a) whoconcluded that polar soluble compounds were most likely found in fog droplets whereasinsoluble compounds remained in interstitial air.
Puxbaum and Limbeck (2000) have measured the scavenging efficiency of differentorganic compounds at Mt Sonnblick, Austria. Their measurements stress the impor-20
tant role of the polarity in determining the efficiency with which organic compounds areuptaken in cloud droplets (see also Facchini et al., 1999b). Dicarboxylic acids are themost efficient class of organics to be scavenged, with efficiency comparable to that ofsulphate. The ratio of the concentration in cloud droplets to the sum of the concentra-tions in droplets and in interstitial air was measured as 0.8. For aromatic compounds25
the same ratio was 0.6, intermediate between non-polar alcohols and slightly polarmonocarboxylic acids for which about 40% of the molecules were measured in cloudwater.
Hallberg et al. (1992) studied the unscavenged fraction of aerosol in fog droplets.
The fraction of elemental carbon was found to be significantly more abundant than forsulfate. The study could not determine whether chemical composition or size distribu-tion was the decisive factor in controlling this difference. A further study (Hallberg et al.,1994a) compared, respectively, soluble, insoluble and soluble with insoluble inclusionsaerosol of the same size. Amongst the particles that formed cloud droplets most of5
them were shown to be soluble. When the partitioning of aerosol particles betweencloud droplets and interstitial air was compared during 2 periods of a field experiment,the scavenging efficiency decreased with increasing aerosol loads in the accumula-tion mode, (Hallberg et al., 1994b). Two processes could explain the size partitionningof aerosols between cloud droplets and interstitial air: the speed of the cloud updaft10
and/or the difference in particle chemical composition.The efficiency of aerosol scavenged by snow or ice is particularly uncertain. The
interception of aerosols by snow flakes is linked to their shape (see Slinn, 1984; andHegg et al., 1989). Dendritic shapes and riming snow flakes will efficiently collectaerosols. Capture of aerosols by snow and ice is still poorly described in general15
circulation models. It follows that the column loads and aerosol vertical distributionsat high latitudes are poorly represented in these models. Hegg (2001) discusses theefficient scavenging of aerosols in mixed phase clouds. Since hydrophobic aerosolsare efficient ice nuclei their scavenging by mixed phase clouds is favoured.
In summary, the high uncertainty in the wet-scavenging of organic aerosol in climate20
models is related
– to uncertainties in the description of large scale cloud and rain formation pro-cesses, and
– to intrinsic uncertainties in the detailed description of the role of organic aerosolin micro-physical cloud and rain processes.25
6. Conversion of hydrophobic to hydrophilic aerosol
Both chemical and physical ageing processes can lead to an increase in hygroscop-icity. Chemical ageing is the chemical modification of the aerosol components due toheterogeneous and liquid phase reactions which may change chain length, functionalgroups, thereby modifying the hygroscopicity of the particles. Physical ageing is due to5
mixing processes such as coagulation and condensation adding more soluble materialand thereby increasing the over-all solubility and hygroscopicity of the particles. Theaerosol ageing that converts the hydrophobic to hydrophilic particles is a key processdetermining the wet removal (see Sect. 5) and hence the residence time and atmo-spheric burden of carbonaceous particles in the atmosphere.10
There is evidence, from in-situ measurements (e.g. Ogren et al., 1984) that anthro-pogenic carbonaceous aerosol components typically have a longer residence time inthe atmosphere than water-soluble aerosol components such as sulphate. Additionally,black carbon which is a component of anthropogenic carbonaceous aerosol is insolu-ble and inert, yet it is known to be wet deposited. Finally, wet deposition is the dominant15
process for removing water-soluble aerosols from the entire tropospheric column. Con-sequently, several models of the black carbon aerosol cycle (e.g. Cooke and Wilson,1996; Cooke et al., 1999; Myhre et al., 1998; Wilson et al., 2001) have proposed thatsome or all of the primary emissions of black carbon with associated organic com-pounds to be hydrophobic and thus not wet deposited, but converting to a hydrophilic,20
wet depositing form with time. This approach was found to improve the agreement be-tween modelled and observed black carbon concentrations at remote surface stations.
In this section we discuss first the major mixing processes and their respectivetimescales by which non-hygroscopic particles are converted into hygroscopic onesand then outline actual knowledge on chemical processes that modify the hygroscopic25
properties of the aerosols.The following questions need to be addressed:
– What have we learned from measurements of the hygroscopicity of freshly emit-
ted/formed carbonaceous particles (engine combustion, biomass burning, sec-ondary organic aerosol from anthropogenic / biogenic precursors) and aged (ac-cumulation mode) particles?
– For modelling purposes, can we define a “reference hygroscopicity” which definesthe transition between hydrophobic and hygroscopic particles, the latter being5
affected by wet deposition processes and leading to cloud formation?
– What are the processes and time scales converting hydrophobic to hydrophilicparticles?
6.1. Effect of ageing on hygroscopicity
Fossil fuel as well as biomass burning carbonaceous aerosol immediately after emis-10
sion is more hydrophobic, becoming more hygroscopic with time. The picture emerg-ing from the ‘real-world’ data is that in traffic-dominated conditions (street canyon andurban background), a significant fraction of less hydroscopic particles is quasi per-manently observed. This fraction decreases with increasing particle size for a givenurban site. The fraction of occurrence of these less hygroscopic particles decreases15
when moving from the urban background (0.35–1) to continental sites (0.01–0.35) oftime), down to 0 in remote marine locations. Simultaneously, a population of morehygroscopic particles is always present (Weingartner et al., 1997; Pagels et al., 2003;Marelli et al., 2003). The concept of a single turnover time from hydrophobic to hy-drophilic, can thus describe scale changes from urban to background, or from street20
canyon to urban, while not necessarily being applicable to the entire spatial scale.A key issue is nevertheless to evaluate the turn-over time converting particles into
hygroscopic ones. Presently, models are applying first order conversion kinetics ofhydrophobic to hygroscopic BC and OC with turn over time equal to 0.7–1.2 days (seeTable 6), but are also varying the fraction of primary emissions that are assumed to be25
hydrophobic in order to arrive at realistic BC and OC burdens.
An important question to address is: which soluble fraction in a mixed particle isneeded in order to make a “hydrophobic” particle “hygroscopic”? Applying the Kohlerequations (see Appendix A), Pruppacher and Klett (1980) obtained a relation betweenparticle radius, critical supersaturation and soluble fraction for mixed particles consist-ing of an insoluble core and given fraction of a soluble salt. The equation below is the5
version of the Kohler equation as given by Weingartner et al. (1997):
S = exp[αd
]exp
− βN1(d3 − d3
0
) , (11)
whereS=RH/100%α=2.155 nm10
β=5.712×10⁻² nm3
N1=number of molecules dissociated in the water in the droplet (dimensionless)d=wet particle diameter (nm)d0=dry (soluble + insoluble) particle diameter (nm)
This equation has been used hereafter to derive the amount of soluble mass that15
has to be “acquired” by an insoluble particle in order to become a cloud condensationnucleus at 0.2% and 0.3% supersaturation, respectively. The thus calculated solublefraction (soluble/(soluble+insoluble)) required for an initially insoluble particle to be-come a CCN at 0.2 and 0.3% supersaturation, respectively, is depicted in Fig. 4. Dueto the competing Kelvin and Raoult terms in the Kohler equation, small particles have20
to acquire more soluble material relative to their mass than larger ones. However, therequired soluble mass per particle is relatively insensitive to the diameter of the initialinsoluble particle.
The occurrence of distinct hygroscopicity modes has been investigated and ex-plained by Kerminen (1997), who proposes cloud-processing as the major process25
adding soluble material to cloud-activated particles and creating a ‘more hygroscopic’
particle after as few as 2 cloud cycles. A particle can be considered as ‘more hy-groscopic’ and subject to efficient wet deposition once it has become a CCN. Kermi-nen (1997) argued that coagulation and condensation can not explain the formation ofclearly separated hygroscopicity modes. However, they are the main processes thatcan transform a non-CCN into CCN through the mixing between hydrophobic and sol-5
uble material, heterogeneous reactions onto aerosol surfaces being an alternative ofnot yet quantified importance. Neglecting such reactions, the timescales for mixing bycondensation of soluble species (sulphate, nitrate, MSA) and coagulation of insolublewith soluble particles (sea-salt, aged sulphate-rich accumulation mode particles) arethe ones that will determine the residence time of hydrophobic carbonaceous particles10
in the atmosphere.
6.2. Removal of insoluble aerosol by coagulation
Where fresh hydrophobic carbonaceous particles are formed co-incident with high con-centrations of gaseous precursors and photochemical conversion, Condensation islikely to be efficient, although in sufficiently high concentrations of gaseous precur-15
sors the ageing of hydrophobic particles may also occur through secondary particleformation and coagulation. The presence of a high concentration of pre-existing accu-mulation mode particles however, scavenges an important fraction of the condensablematerial and delays the growth of the hydrophobic particles. Hence, there is com-petition between coagulation, condensation and heterogeneous reactions on aerosol20
surfaces as ageing processes, depending on the magnitude of the accumulation mode,the availability of condensable species, the chemical properties of the particle surfaceand the oxidant levels. These different regimes can be investigated by field and modelstudies.
In the absence of high concentrations of gaseous precursors, coagulation is the25
more important conversion process. Where large concentrations of more-hygroscopicaccumulation mode particles are present, freshly formed carbonaceous particles willbe scavenged by these, without significant changes in the hygroscopicity of the pre-
existing, particles. Where the pre-existing particles are smaller Nucleation or Aitkenmode particles then, the hygroscopicity of the coagulated particles may indeed change.
Modelling studies have focussed on coagulation as a major process leading to mixed,more hygroscopic particles (Strom et al., 1992; Fassi-Fihri et al., 1997). Riemer etal. (2003) modelled explicitly the mixing between soot and soluble salts by coagulation5
and condensation in a 3-D case study over Germany and obtained a 2 hour turn-overtime for soot during day-time (dominated by condensation) and a 20-h turn-over timeduring the night (dominated by coagulation). Wehner et al. (2002) applied a simplemodel with condensation, coagulation and entrainment with background and freshlyemitted urban aerosol to successfully explain the transition of a street canyon aerosol10
size distribution to urban background on a time scale of less than 1 hour.The time scales for mixing between fresh hydrophobic particles and hygroscopic ma-
terial by condensation and coagulation can be investigated relatively simply for variousconditions. Here we examine the coagulation between pre-existing accumulation modeparticles and fresh carbonaceous particles in order to provide an upper limit to the turn15
over time, and compare that with condensation as a lower. The case of coagulationwith smaller freshly formed soluble particles, will fall between these two. According tothe Kohler equation, the critical diameter for an ammonium sulphate particle at 0.2%supersaturation (SS) is equal to 80 nm, coagulation between a hydrophobic particle ofany diameter (Dp) with soluble accumulation mode particles with Dp>80 nm will result20
in a CCN at 0.2% SS. The turn-over time for internal mixing by coagulation is given by:
τCOA =1
k12Nacc(12)
with k12 the effective coagulation coefficient between hydrophobic and hygroscopicaccumulation mode particles, and Nacc the number concentration in the accumulationmode. τCOA is the time needed to coagulate 63% of the hydrophobic particles. We25
assume here that the mixing process reduces the number of hydrophobic particleswithout changing the number of hydrophilic ones. It does not convert hydrophobic tohydrophilic with regard to the aerosol number concentration.
The characteristic time for internal mixing by condensation depends on the sourcerate of the condensing species (e.g. H2SO4), on the scavenging rate by the background(accumulation mode) aerosol, and on the size of the initial hydrophobic particles. As-suming that the partitioning of the condensing soluble species happens proportionallyto the particle surface area, the total mass required by condensation (Mtot) is given by:5
Mtot = Mhf
(1 −
NaccD2acc
NhfD2hf +NaccD
2acc
)−1
(13)
and Mhf the mass of insoluble particles is given by:
Mhf = ρε
1 − επ6NhfD
3hf (14)
hence
Mtot = ρε
1 − επ6NhfD
3hf
(1 −
NaccD2acc
NhfD2hf +NaccD
2acc
)−1
(15)10
withρ=the density of the condensing speciesε=the required soluble fraction to convert an initially insoluble particle of diameter Dhfinto a CCN at a given supersaturation (given by the Kohler equation)Nhf=the number concentration of insoluble (hydrophobic) particles15
Nacc=the number concentration of soluble particles in the accumulation mode of diam-eter Dacc
The (e-folding) time for condensation of 63% of the required mass is then given by:
τCON =0.63Mtot
F(16)
with F the mass source rate for H2SO4 formation.20
The over-all turn-over time τ for bringing insoluble aerosol in the soluble mode bothby coagulation and condensation is then given by
τ =(
1τCOA
+1
τCON
)−1
(17)
The competition between condensation and coagulation is clearly demonstrated inFig. 5: At the given SO2 and OH levels (200 ppt and 2×10⁶ molecules cm−3, respec-5
tively) the maximum turn-over time τ to convert a 50 nm insoluble particle into a CCNat 0.2% SS is 60 h, when Nacc=500 cm−3. For higher and lower values of Nacc, τbecomes lower.
A proper evaluation of τ requires a consistent application of values for SO2 andNacc, which obviously depend strongly on the type of location. Figure 5 shows τ10
as a function of Nacc (hygroscopic accumulation mode) for various SO2 concentra-tions and initial properties of hydrophobic particles with initial diameter Dhf=50 nm andNhf=1000 cm−3. Typical [SO2, Nacc] ranges for marine to urban conditions are indi-cated on the graphs. It appears that, in urban and near-city conditions, τ is completelycontrolled by coagulation, whatever the SO2 concentration, with turn-over times from15
minutes to some hours. Smaller particles have a shorter lifetime for otherwise identicalconditions.
In the coagulation-controlled regime, τ is independent of Nhf . This is the case forall situations in Fig. 6 that shows that this turn-over time could be strongly reduced(condensation-controlled) if higher SO2 concentrations (or other soluble, condensable20
material) prevailed. The turn-over time for marine conditions is of the order of severaldays to weeks. This would, e.g. apply to particles from ship emissions, which cansurvive for long time.
The turn-over times for rural and near-city conditions correspond to the ageing ratesapplied in the models cited above. However, most of the traffic and industrial related25
emissions are confined to the urban environment where a fast initial ageing phasetakes place. Hence, when the urban plume starts to disperse on regional scale, most
As above mentioned, conversion of hydrophobic to hygroscopic particles can also oc-cur via chemical ageing i.e. heterogeneous chemical reactions on the surface of theparticles. These reactions can alter the chemical composition of the particles forming5
for instance more polar, hygroscopic products than the precursor particulate material.The understanding and the documentation of these processes is actually in its infancy.
Rompp et al. (to be submitted, 2004)1 suggested that oxidation of linear dicarboxylicacids (C9-C11) by OH-radicals yields various isomers of oxodicarboxylic acids. The ox-idation occurs in the particle phase. The formed acids are more polar and hygroscopic10
than the parent dicarboxylic acids. The ratio of oxodicarboxylic acids to the parent di-carboxylic acid measured in aerosol field samples at two locations in Europe showedgood correlation with OH-radical concentrations.
Ozone reactions with organic particulate mater in the form of soot or organic acidfilms or organic aerosols have been shown to alter the chemical properties of the15
aerosol surfaces. Chughtai et al. (1999) found that surface oxidation of soot by reac-tion with O3 increases the hydration of the particles. Studies of diesel particles coatedby benzo(a)pyrene (BaP) have demonstrated that during exposure to O3 the particlesbecome more hydrophilic (Weingartner et al., 1997; Kotzick and Niessner, 1999) witha rate (r) that depends on the O3 levels. The presence of H2O serves as an inhibitor by20
competitive adsorption on the soot active sites. Poschl et al. (2001) based on labora-tory experiments have proposed a pseudo-first-order decay rate coefficient (r) for BaPreaction with O3 that depends on ozone concentrations, the adsorption rate coefficientof O3 that serves as the oxidation medium and the adsorption rate coefficient of H2Othat serves as an inhibitor by competitive adsorption.25
1Rompp, A., Winterhalter, R., and Moortgat, G. K.: Oxodicarboxylic acids in atmosphericaerosol, Environ. Sci. Technol., to be submitted, 2004.
Based on that parameterisation, Tsigaridis and Kanakidou (2003) tentatively calcu-lated a chemical turn-over time for the conversion of hydrophobic soot coated by BaPto hydrophilic that varies spatially due to the O3 and water vapour variability from a fewhours to about 10 days with a mean tropospheric value of about a day. This has tobe viewed with caution since not all soot is coated by BaP and other heterogeneous5
reactions might take place on soot and be responsible for chemical conversion of hy-drophobic to hydrophilic aerosol in the atmosphere.
Moise and Rudich (2002) detected aldehydes as the major volatile product of reac-tions of O3 with aerosols with a fatty acid component. Eliason et al. (2003) found thatozonolysis of long chain unsaturated carboxylic (fatty) acids leads to smaller molecules10
of higher hygroscopicity (mainly aldehydes and carboxylic acids) that can stay in theaerosol phase or escape to the atmosphere (Eliason et al., 2003, 2004). However,acid-catalysed heterogeneous reactions of aldehydes on diesel soot might increasethe aerosol mass by making them less volatile but the overall modification of the hygro-scopic properties of the resulting organic material will depend on the oxidation mech-15
anism. Hydration, hemiacetal and acetal formation, polymerization and aldol conden-sation have been proposed as potential mechanisms to explain the observed acid-catalysed heterogeneous reactions of organic mater (Jang et al., 2003; Iinuma et al.,2004).
– These heterogeneous reactions modify the aerosol mass and its hygroscopic20
properties and affect the gas phase chemistry in the atmosphere.
– The consideration of such reactions in global climate models is crucial for thebetter representation of the ageing of aerosols and of their ability to act as CCNbut requires a better than the actual understanding of the mechanisms involved.
In addition to these mechanisms, chemical ageing of aerosols occurs during cloud25
processing of particles, relevant knowledge is summarized in the next section.
7. Chemical interactions with clouds – cloud processing
More than 60% of the total sulphate on a global scale is estimated to be produced inclouds (Langner and Rodhe, 1991; Liao et al., 2003). It has been shown in severalstudies that the production of sulphate in cloud drops can contribute significantly tothe aerosol mass (e.g. Chameides and Stelson, 1992; Hegg et al., 1996; Zhang et al.,5
1999) and may lead either to an enhancement or to a suppression of the cloud dropnumber concentration (Feingold and Kreidenweis, 2000). The dissolution into clouddrops leads to a separation of soluble and insoluble species, respectively, and possiblyto different reaction pathways. Dissolved species will be released to the gas phase af-ter evaporation of the cloud. However, they may undergo chemical conversions in the10
aqueous phase changing their physical properties (e.g. vapour pressure) and/or chem-ical properties (e.g. ability to form low volatility adducts). The importance of chemicalconversions in the tropospheric aqueous phase (i.e. clouds and fogs) leading to inor-ganic secondary aerosol mass production (in particular sulphate) is recognized. Onthe contrary, the significance of such mechanism for SOA production is not yet well15
established and therefore is not included in large scale models.The water soluble fraction of organic carbon can consist on average of 35% of mono-
and dicarboxylic acids (Decesari et al., 2000). In urban environments dicarboxylic acidscontribute 1% of the aerosol mass; in less polluted regions the contributions can behigher, with average values of ∼7–20% and even up to 30–50% (Satsumbayashi et20
al., 1989, 1990). Major components in this group are small dicarboxylic acids (C2-C6) with oxalic acid being the major compound with fractions of about 50–75% of thetotal dicarboxylic acid mass found in rainwater (Sempere and Kawamura, 1996) as wellas aerosol samples in the marine boundary layer (Kawamura and Sakaguchi, 1999).Observations by Baboukas et al. (2000) in the marine boundary layer have revealed25
that at relative humidities around 80% about 30% of oxalic and 46% of pyruvic acid arepresent in the gas phase.
In general, enhanced oxidant concentrations have been detected in the interstitial
parts of clouds which facilitate the efficient oxidation of organic trace gases there whichleads to small aldehydes, alcohols, monocarboxylic acids, and acetone (Blando andTurpin, 2000). Yao et al. (2002) found a clear correlation between the sulphate masssize distribution and those for oxalate, malonate and succinate. Both sulphate anddicarboxylic acids accumulate in the drop mode, i.e. particles which acted as cloud5
condensation nuclei and, thus, were processed by clouds. Similar observations weremade by Mochida et al. (2003a) showing bimodal mass distributions for both C2-C4 di-carboxylic acids and sulphate, respectively. The modification of the larger size aerosolmode was ascribed to mass addition in clouds. Based on correlations of concentrationsin both the gas and particle phase, Mochida et al. (2003b) conclude that the precur-10
sors for these dicarboxylic acids might have anthropogenic origin. Another indicatorfor cloud processing is the presence of hydroxymethanesulfonate (HMS−) in mixed di-carboxylic acid/sulphate particles (Lee et al., 2002, 2003). Since HMS− is exclusivelyformed within the aqueous phase it is likely that other constituents of these particlesalso originate from cloud processing. All these observations suggest that chemical pro-15
cessing within atmospheric aqueous aerosols might contribute to secondary organicaerosol formation.
Kawamura and Sakaguchi (1999) using principal component analysis of individualdiacid, coupled with information on photochemical reactions, suggest that C2 and C3diacids present in aerosols are likely produced by the oxidation of C4 and longer-chain20
diacids, whereas longer-chain (C5-C10) diacids are produced through the oxidation ofsemivolatile fatty acids which are also oxidation products of unsaturated fatty acids.Oxygenated organics have Henry’s law Constants of KH≈100 M atm−1 (alcohols) upto KH≈109 M atm−1 (di-, and ketocarboxylic acids) (Sander, 1999). Thus, the aque-ous phase might represent a significant sink for the few highly water soluble organic25
species that exist in the atmosphere. Aumont et al. (2000) have calculated that difunc-tional organic compounds, which are formed either in the gas or aqueous phase, arepreferable in the gas phase. Only organics with three or more functional groups (e.g.hydroxy and/or carbonyl compounds) have a vapour pressure sufficiently low to en-
able significant partitioning into the aqueous phase. However, the chemical pathwaysin their model cannot predict the high amounts of dicarboxylic acids found in aerosolsamples.
Graedel and Weschler (1981) give a detailed overview of chemical conversions of or-ganics in aqueous atmospheric aerosols. They show that aldehydes in the gas phase5
might act as precursors for organic acid formation in the aqueous phase which is re-flected in similar concentration patterns for both species groups. These oxidation pro-cesses are faster and more efficient in the aqueous phase due to hydration effects,while in the gas phase photooxidation of aldehydes usually leads to the loss of the car-bonyl function. Chebbi and Carlier (1996) suggest that high concentrations of glyoxal10
and methylglyoxal in clouds might act as precursors for oxalic and pyruvic acid for-mation, respectively. Warneck (2003) suggested that in marine environments ethyleneand acetylene may act as gas phase precursors of oxalic acid in the aqueous phase viathe formation of glyoxal that is dissolved and reacts in the aqueous phase. Glyoxal canbe also produced from the oxidation of aromatics. Thus the proposed mechanism of15
oxalic acid formation is also valid under polluted conditions. It seems likely that oxalicand pyruvic acids may be formed in clouds and are released upon evaporation. Up tonow there is no comprehensive mechanism available predicting their formation in thegas phase.
Recently detailed chemical multiphase mechanisms have been suggested in order to20
elucidate oxalate formation in clouds. Herrmann et al. (2000) and Ervens et al. (2003)developed the Chemical Aqueous Phase Radical Mechanism (CAPRAM) for modellingtropospheric multiphase chemistry that contains a detailed treatment of the oxidationof organic compounds with one and two carbon atoms. Possible pathways for theformation of small dicarboxylic acids are included in the chemical mechanism by Ervens25
et al. (2004) where toluene, ethylene, isoprene and cyclohexene are assumed as gasphase precursors. The kinetics of aqueous phase reactions relevant for atmosphericchemistry have been recently reviewed by Herrmann (2003) including spectroscopicdata of a significant number of peroxy-radicals in aqueous solution and kinetic data for
OH and NO3 radical reactions in aqueous solution, for various organic molecules likecarbonylic and carboxylic compounds, phenols and amines. However, the current stateof chemical mechanism development for aqueous phase chemistry is quite limited dueto the lack of appropriate rate constants and, to a greater extent, results of productstudies (Herrmann, 2003).5
Beside the formation of low volatility organics in clouds, and, thus, modification ofthe mass and hygroscopic properties of aerosols, the absorption properties of aerosolsmight also be changed by cloud processing. Keto- and dicarboxylates likely form com-plexes with transition metals, in particular, with iron and copper (Zuo and Hoigne, 1992,1994). In contrast to the ‘free’ dicarboxylates, these complexes absorb light in the visi-10
ble range leading to photo-oxidation of the organics. In addition, it has been shown byGelencser et al. (2003) that hydroxyl substituted aromatic compounds can be oxidizedto humic-like substances in aqueous solution which are light-absorbing in the visiblerange as well. However, these effects are not yet included in complex cloud radiationmodels so that the overall effect of this phenomenon cannot be quantified.15
In summary,
– At the current state of model development the role that cloud chemistry plays withrespect to organic mass production, compared to other processes, cannot yet bedetermined.
– The chemical mass production processes seem to be restricted to dicarboxylic20
acids. Other fractions of the water soluble organic carbon consisting of neutraland polyacidic compounds (Decesari et al., 2000) probably have other sources.
– Processing of organic species in cloud droplets might influence both the direct andindirect effect of aerosols by modifying the mass (i.e. size) and the compositionand thus the physical characteristics (like hygroscopic and radiative properties)25
of the aerosol. This latter might be the most important effect of cloud organicchemistry.
– Despite the potential importance of the tropospheric aqueous phase with respectto organics, this process is not included in global models.
8. Organic aerosol and water interactions
The water uptake by the organic aerosol components and their interactions with theinorganic salts dissolved in the same aqueous solution changes the aerosol water5
concentration and the resulting aerosol properties. At the same time, the extent ofthe partitioning for any individual organic compound between the gas and particulatephases depends not only on the amounts and properties of the compound, but also onthe amount of water present in the atmosphere. Understanding the effects of aerosolwater on SOA formation and vice versa is, therefore, central to understanding the SOA10
formation and role in the atmosphere.The aerosol hygroscopicity is commonly expressed by the growth factor (GF) that
is the ratio between the humidified and dry particle diameter at a reference relativehumidity (RH). Most (but not all) recent studies have been obtained at or convertedto a reference humidity of 90%. For pure substances, the hygroscopic diameter or15
mass growth of aerosol particles can be calculated if the concentration of the solutematerial as function of the water vapour pressure ratio (partial pressure of water vapourdivided by saturation water vapour pressure) over the particle surface is known. Forflat solution surfaces or for large particles, this water vapour pressure ratio is equalto the RH, which can be measured at some distance from the particle. For particles20
smaller than a few hundred nanometres in diameter, the water vapour pressure ratiothat the particles senses – the water activity of the solution – is smaller than the RHaway from the particle. The correction factor is given by the Kelvin term, as describedby the Kohler equation (Appendix A – Eq. A1).
Data on the relation between solute concentration and water activity (or RH) is there-25
fore crucial for these calculations. If all solutions behaved ideally, this would simplybe given by Raoult’s law, and would be quite straightforward to estimate from basic
chemical solute data. Raoult’s law simply states that the water activity (or equilib-rium RH) over the solution is given by the ratio of the moles of water molecules to themoles of all molecules in the solution (water molecules plus all dissolved ions and/ormolecules other than water). Various formulations of Raoult’s law are used in mostcalculations of aerosol particle activation into cloud droplets, since the solutions are5
normally sufficiently diluted at the point of activation. However, since most solutionsdeviate from ideal behaviour empirical data on water activity versus solute concentra-tion are needed. Additional important thermodynamic data needed to describe hygro-scopic growth are densities (dry solute and solution), surface tension, and for somesubstances also solute vapour pressures for aqueous solutions.10
Here, we will review the existing data describing the water activity as a functionof solute concentration for pure organic compounds, their mixtures and mixtures oforganic and inorganic compounds.
The solute concentration is normally given as mole fraction of solute (moles of soluteper moles of solute plus water) or molality (moles of solute per kg of water). Water15
activity data for a wide range of inorganic substances can be found in the literature (forinstance: Robinson and Stokes, 1959; Tang et al., 1997 and references therein), andwill not be discussed here.
Corresponding data for water soluble organic compounds relevant to atmosphericapplications are rather scarce in comparison, partly because organic compounds were20
previously not considered important for the hygroscopic and cloud-forming propertiesof atmospheric aerosols, and also because organic compounds are more difficult tomeasure than inorganic compounds, especially the low-molecular weight organics dueto their high volatility.
8.1. Water activity data for organic compounds: laboratory work on individual com-25
pounds
Instrumentation: Measurements of water activity as function of organic solute concen-tration can be performed either on bulk solutions or on suspended particles. While bulk
measurements, using commercially available and highly accurate water activity me-ters, can only provide data for saturated solutions or more dilute, the methods basedon observations of suspended solution particles are able to quantify the water up-take also for highly supersaturated solutions that would rapidly crystallize in the bulk.Since it is likely that supersaturated solutions are found in atmospheric aerosols, data5
for supersaturated solutions are highly relevant, but these studies involve the use ofnon-commercial instrumentation such as an electrodynamic balance (EDB; Peng etal., 2001) or a Hygroscopic Tandem Differential Mobility Analyzer (HTDMA; Mikhailovet al., 2004). The RH to which the suspended particles are subjected can be var-ied over a wide range in both these instruments (∼0% to ∼99%), and can thus be10
used to study the full RH hysteresis behaviour of a multitude of relevant compoundsand mixtures. The EDB relies on the balancing of gravitational forces and normallyrequires the suspended particles to be larger than a few µm in diameter, while the HT-DMA technique separates particles according to their electrical mobility and is optimalfor sub-micrometer particles. Special-design HTDMA instruments have been used to15
particle sizes down to 10 nm or less. Since the Kelvin curvature correction term issubstantial for these ultra fine particles, the HTDMA can give some additional insightregarding particle surface tension. The scanning EDB is a recent improvement of thetraditional EDB, allowing much faster water activity measurements to be performedover a wide range of RH, and facilitates studies of semi-volatile organic compounds20
(Choi and Chan, 2002b).For both the EDB and HTDMA, a reference state of known composition must be
chosen. There are two possibilities: (1) a dehydrated particle at low RH, and (2) adroplet at high RH for which water activity data is available or can be measured in bulksolution. The choice of reference state can be problematic for compounds for which25
bulk water activity data are not available and for which the particles are suspected toretain water even at very low RH.
The HTDMA instrument is a flow-through system, producing data on the distributionof hygroscopic diameter growth for a large number of aerosol particles for each particle
dry diameter and RH. This instrument is therefore well suited for field studies of thehygroscopic properties of atmospheric aerosol particles, and numerous such studiesusing HTDMA instruments have been carried out in a variety of environments. TheEDB relies on the capture of a single particle in an electric field, and is only suitedfor laboratory studies. The HTDMA and EDB instruments are therefore in many ways5
complementary for studies of particle water uptake.Available data: Bulk data for the water activity and other thermodynamic properties
are available for a large number of organic compounds. References are given in Sax-ena and Hildemann (1997), who point to, in particular, the extensive data compilationof the Dortmund Data Bank DECHEMA (Gmehling et al., 1994). These data will not be10
discussed further here, but nevertheless constitute a valuable resource for water activ-ity data for organic compounds at solute concentrations below saturation. The wateractivity data obtained with EDB and HTDMA instruments are summarized in Table 7.
Table 7 is structured per organic compound studied and includes humic-like sub-stances (HULIS): humic and fulvic acids, organic acids, mostly dicarboxylic acids, and15
some organic compounds that do not dissociate in solution such as sugars, organicsalts, and finally pharmaceutical compounds. This data compilation was limited toinclude only well-defined WSOC or mixtures thereof, also in mixtures with inorganiccompounds of atmospheric relevance. It does not include studies of CCN properties oforganic compounds. The studies in Table 8 present, either water activity as a function20
of solute concentration, or hygroscopic particle growth in some form.Since this field of research is rather new, most of the work cited was published within
the last few years only. The interest in the hygroscopic properties of WSOC startedsomewhat earlier in the pharmaceutical sciences owing to their importance for lungdeposition and drug administration, and was reviewed already in 1993 by Hickey and25
Martonen (1993). Most of the earlier EDB and HTDMA studies focussed on inorganiccompounds such as sulphates and nitrates, and are not discussed here. Several ofthe studies present only qualitative results (Brooks et al., 2002, 2003; Lightstone etal., 2000; Braban et al., 2003; Marcolli et al., 2004). Hansson et al. (1998) used
a TDMA to examine the effect of tetracosane, octanoic acid, and lauric acid on thehygroscopic properties of NaCl aerosol particles at RH between 30 and 95%. A slightlowering of the deliquescence relative humidity, DRH and suppression of hygroscopicgrowth for the NaCl-organic compound mixtures were observed when compared topure NaCl particles. Despite the mixing of the organic material with NaCl, hysteresis5
was observed for decreasing RH histories, suggesting the formation of metastabledroplets. Few parameterisations are given showing that this field is still in its infancy.However, parameterisations are needed for implementation in models of water uptakeby organic compounds, or can be used to test the quality of the published results inrepeat experiments.10
– We strongly recommend efforts to derive parameterisations of water activity ver-sus solute concentration (molality or mole fraction of solute) from the availabledata and in all future studies. HTDMA parameterisations given as hygroscopic di-ameter growth factor as function of relative humidity should preferably be recalcu-lated and presented as water activity versus solute concentration. Error estimates15
should be clearly stated in parameterized form that can easily be incorporated intomodels.
In several of the studies, the applicability of the Zdanovskii-Stokes-Robinson (ZSR)mixing rule was tested to examine the water uptake of well-defined mixtures, and to de-duce interaction terms to be used in models (Chan and Chan, 2003). The ZSR method20
assumes that no interaction occurs between the various compounds of the solution,and is equivalent to adding the amount of water taken up by the individual compounds(relative to their mass or molar fractions) in order to calculate the water uptake of themixture. In most cases, the ZSR mixing rule works fairly in describing the water up-take of both organic-organic and organic-inorganic mixtures and can be used as a first25
approximation. There are however large deviations in some cases, which are difficultto account for. Deviations from the simple water additivity of the ZSR mixing rule havebeen studied and are often discussed in terms of the ability of the organic compounds
for “salting in” or “salting out”, or in other words whether the presence of the organicsincreases or decreases the water uptake of the solution due to interactions betweenthe organic and the inorganic compounds. Organics were observed to decrease thewater uptake by NaCl but increase that of ammonium sulphate (Prenni et al., 2003;Choi and Chan, 2002a; Cruz and Pandis, 2000). The dissociation behaviour of the5
organic compounds needs to be taken into account when studying their water activityand CCN properties.
It can be proven theoretically that the mutual DRH of an aerosol particle consistingof a mixture of compounds is always lower than the DRH of the individual compounds.This was noted by Wexler and Seinfeld (1991) to be valid for inorganic compounds.10
Marcolli et al. (2004) extended this theory to organic compounds and argued that amixture of several organics, as is likely to appear in atmospheric aerosol particles,may remain in the liquid phase and retain water even at very low RH. In other words,the DRH of the organic mixtures or organic-inorganic mixtures is depressed. This isin general agreement with field observations. This behaviour is potentially of great15
importance for atmospheric applications, since it means that a liquid aqueous phasewould nearly always be present, affecting the radiative properties of the aerosol andpossibly also affect the overall aqueous phase reaction rates. This can also explain theobservation that
– Organic compounds contribute to water uptake most significantly at low RH, while20
at high RH, the inorganics dominate see for instance Dick et al. (2000).
– For mixtures of poorly soluble organics and inorganics, the lowering of DRH issmall or negligible (Cruz and Pandis, 2000), while for more soluble organic com-pounds, the effect is clearly noticeable (Brooks et al., 2002).
8.2. Modelling of SOA – water interactions25
Most regional (Binkowski and Roselle, 2003) and global (Liousse et al., 1996; Grif-fin et al., 1999b; Kanakidou et al., 2000; Chung and Seinfeld, 2002; Tsigaridis and
Kanakidou, 2003) models neglect the ability of SOA to influence directly (by absorbingwater) or indirectly (by changing the activity coefficients of the inorganic components)the aerosol water uptake. There are three major barriers that prevent a detailed de-scription of the interactions among organic, inorganic aerosol compounds and water.
– First, there is a lack of fundamental chemical and thermodynamic information5
about organic compounds (Clegg et al., 2001), the identity of which is often un-known. Important thermodynamics data would include Henry’s law constants,equilibrium vapour pressures, dissociation constants of the acidic organic com-pounds, as well as solubilities in water (Anttila et al., 2002).
– Second, a suitable theoretical framework is needed that would allow the prediction10
of the properties of complex mixed (organic and inorganic) particles, based on asparse set of data.
– Third, the theoretical framework developed must be computationally efficient, soit can be included within a typical global model simulation.
Considerable effort has been expended towards achieving these goals. Saxena and15
Hildemann (1997) proposed that the UNIquac Functional-group Activity CoefficientUNIFAC method (Fredeslund et al., 1994) could be a useful first approximation forestimating water activities of aqueous organic solutions. They argued that UNIFACcan reproduce in most cases, water activities to within approximately 15% for a widevariety of compounds (e.g., glycols, dicarboxylic acids, keto acids) and a wide range of20
solute concentrations. The following paragraphs summarise the first efforts to describethe SOA-water interactions and to estimate how much aerosol water is associated withSOA.
Ansari and Pandis (2000) used the UNIFAC method to predict the water uptake ofSOA. Their model assumed that the aerosol consisted of a primarily inorganic and a25
predominantly organic phase, which did not interact with each other. The inorganic con-tained inorganic salts and water while the organic phase contained the organic species
and small amounts of water and semivolatile inorganics (e.g. ammonium nitrate). Themodel predictions were qualitatively consistent with the few available measurementssuggesting that the hygroscopic growth of SOA is significantly less than their inorganiccounterparts. Using lumped SOA species, they reported that SOA accounts for ap-proximately 10% of total aerosol water and increases aerosol nitrate concentrations by5
approximately 10%. At high relative humidity (greater than 85%), the effect of SOA onnitrate partitioning and water uptake was negligible. At low relative humidity (less than50%), SOA could account for 20% of aerosol water.
Seinfeld et al. (2001) considered the interaction of individual SOA compounds withwater vapour; the free energy was calculated using UNIFAC. Their model did explain10
how increasing RH in biogenic hydrocarbon/ozone systems uniformly increases boththe amount of condensed organic mass and the amount of liquid water in the aerosolphase. The presence of inorganic compounds was not considered. The model gaverelatively good agreement with the measurements of Cocker et al. (2001a) for 50%RH but tended to underpredict the water uptake at 85% RH (e.g. predicted volumetric15
growth of 20% versus observed 30%). The study also indicated that it may be a usefulfirst approximation to assume a unity activity coefficient for many compounds makingup SOA mixtures.
In a sensitivity study, Bowman and Karamalegos (2002) estimated that the dissolu-tion of SOA compounds in water could increase the SOA concentration by as much20
as 50%. The SOA species were also increasing the aerosol water concentration byroughly 1µg µg−1 of SOA at 80% RH. The effects were more pronounced during thenighttime high relative humidity periods.
Ming and Russell (2002) proposed a combined Pitzer-UNIFAC approach for the de-scription of the phase equilibria of mixtures of electrolytes and organic species in aque-25
ous solutions. The activity coefficient of each species in solution was explicitly relatedto the chemical composition by treating the (inorganic) ion-water, organic-water andion-organic interactions. The model predicted that the mixing of highly soluble organiccompounds (solubility higher than 4 mol L−1) can decrease the deliquescence RH of
the salt, a phenomenon typically seen in the deliquescence of multicomponent inor-ganic aerosols. This model was used to simulate the hygroscopic behaviour of sea-saltaerosol using twenty insoluble and four soluble organic species (Ming and Russell,2001). The hygroscopic diameter growth factor of a particle consisting of purely inor-ganic sea salt was predicted to be 15% higher than that of a particle consisting of 70%5
inorganic sea salt and 30% organics for moderate and high RH. The effect increasesfor higher organic mass fractions.
Water activity predictions from calculations using the UNIFAC model were found toagree with the measured water activity data for oxalic, malonic, succinic, glutaric, andcitric acid to within 40% but deviations were as large as 100% for malic acid and tartaric10
acid (Peng et al., 2001). After modification of the functional group interaction param-eters of the COOH-H2O-OH-H2O, and OH-COOH pairs by fitting the UNIFAC modelwith the measured data the agreement of predictions and measurements improved towithin 35% for all the acids studied.
Clegg et al. (2001) proposed a thermodynamic framework for the description of the15
aqueous aerosol phase containing both inorganics and organics applicable at mediumto high RH when water is the major component of the solution (solvent). In this ap-proach the ion-water, organic-water, and ion-organic contributions to activity coeffi-cients are calculated independently. Even with this simplification data for aqueoussolutions of the organic molecules are required.20
Koo et al. (2003a) described the interactions between the SOA species and waterby using representative organic species and the UNIFAC method to describe the waterabsorption by the lumped SOA compounds. Comparison between the predictions ofthis model and the few available smog chamber studies suggested a serious underpre-diction (by a factor of 2 to 3) of the water concentration predicted by the models. The25
authors corrected for this bias by using a constant correction factor for each precur-sor. Application of the tool to Southern California suggested that SOA increases theaerosol water concentration by 2–13% depending on the conditions. The effect of thisadditional SOA water on aerosol nitrate was found to be insignificant for all cases.
Pun et al. (2002) classified SOA compounds as either “hydrophobic” or “hydrophilic”.The hydrophobic species are assumed dissolved in a predominantly organic phasetogether with the primary organic aerosol components. Hydrophilic compounds areassumed to dissolve in the aqueous aerosol phase together with inorganic salts; theorganic compounds however were not allowed to affect the activity coefficients of the5
inorganic salts. The activity coefficients of the organic solutes were calculated usingUNIFAC and the aerosol water content was estimated using the Zdanovskii-Stokes-Robinson (ZSR) approach (with the basic assumption that the quantities of water as-sociated with each solute are additive). Three anthropogenic and two biogenic hy-drophilic SOA species were used as surrogates in the model to represent the individ-10
ual SOA compounds. The properties of these surrogate compounds were reasonableestimates based on assumed structures of these molecules.
Most SOA-water modelling studies have relied on arbitrarily chosen model com-pounds for the representation of the hygroscopic properties of the SOA mixture. Fuzziet al. (2001) proposed a complimentary conceptual approach based on functional15
group analysis. The method relies on the construction of model compounds basedon experimental information (chromatographic analysis and carbon analysis of eachfraction and HNMR analysis).
8.3. Hygroscopicity of SOA and multicomponent carbonaceous aerosol: laboratorystudies20
The hygroscopic behaviour of freshly formed carbonaceous particles (primary as wellas secondary) has been studied in the laboratory for a number of biogenic and an-thropogenic model compounds. Table 8 gives some examples of recent studies andresults. It shows that freshly formed carbonaceous particles (soot as well as secondaryorganics) have very low to low growth factors GF: diesel soot can be considered as hy-25
drophobic whereas oxidation products of toluene, a model compound for anthropogenicSOA, are moderately hygroscopic. Also water soluble organic compounds, as humicand fulvic acid, as well as ‘isolated organic matter’, have very low hygroscopicity, LH
(Gysel et al., 2004). On the other hand, the few available laboratory studies on thehygroscopicity of biomass burning aerosol show that, unlike the previous classes ofcarbonaceous particles, they have a hygroscopic behaviour comparable to inorganicsalts.
Virkkula et al. (1999) measured the hygroscopic properties of aerosol formed by ox-5
idation of three monoterpenes, limonene, alpha-pinene, and beta-pinene, using a tan-dem differential mobility analyzer (TDMA). The experiments included ozonolysis andphotooxidation with and without ammonium sulphate seed aerosol. Pure organic par-ticles, formed by oxidation of the terpenes in the absence of the seed aerosol, provedto be slightly hygroscopic. The diameter growth factor was close to 1.1 at RH 85%. In10
the experiments with ammonium sulphate seed aerosol the growth factor decreasedfrom approximately 1.5 before the start of terpene oxidation to approximately 1.1 asthe oxidation products condensed on the particles. Their analysis showed that in theinternally mixed particles, ammonium sulphate and the organic products take up waterindependently of one another.15
The majority of laboratory investigations of SOA formation have been carried outin the absence of water. A roughly 10% increase in the overall aerosol yield of thea-pinene/ozone system was observed by Cocker et al. (2001a) when the RH of theexperiments was increased from less than 2% to around 50%. The observed changein the overall aerosol yield during pinene ozonolysis in the presence of water vapour20
includes the effects of water vapour on gas-phase chemistry, the water uptake of theparticles, and the change in the partitioning of the SOA compounds. Further anal-ysis indicated that most of this increase was due to the water uptake by the SOA.The presence of aqueous salt particles in the system was found to reduce the overall(organic material plus associated water) aerosol yield relative to the no seed experi-25
ments by 15–35%. The effect differed according to the salt, with ammonium sulphatecausing the greatest reduction in yield. The authors argued that the presence of theelectrolytes reduces the fraction of the organic aerosol partitioning from the gas to theaerosol phase.
Edney et al. (2000) irradiated toluene/propylene/NOx/air mixtures in the presenceof submicron ammonium sulphate aerosol. The generated aerosols contained organicand inorganic constituents with liquid water concentrations ranging from 4 to 65µg m−3.They concluded the presence of aerosol liquid water did not significantly change theamount of the SOA that formed from the oxidation of toluene. The amount of SOA5
generated during the photooxidation of m-xylene and 1,3,5-trimethylbenzene in thepresence of ammonium sulphate aerosol was also unaffected by the presence of waterat RH up to 50% (Cocker et al., 2001b). The water uptake by SOA produced duringthe photooxidation of toluene, p-xylene, and 1,3,5-trimethylbenzene in the presenceof NOx and ammonium sulphate aerosol was negligible compared to the water due10
to the inorganics (Kleindienst et al., 1999). Cocker et al. (2001b) observed that thehygroscopicity of the aerosol formed during the photooxidation of m-xylene and 1,3,5-trimethylbenzene at 85% RH increased with the extent of the reaction, indicating thatthe first-generation oxidation products undergo further oxidation.
Kleindienst et al. (2002) investigated the SOA formation from the irradiation of sim-15
ulated automobile exhaust. The hygroscopic potential of the aerosol was determinedwith the use of a liquid water content analyzer, and the analysis indicated that theaerosol uptake of water was minor at relative humidities less than 70%. Organic anal-ysis of the collected aerosol from this complex system indicated that the identifiedoxidation products were identical to those found in the toluene oxidation system.20
Jang and Kamens (1998) investigated the humidity effects on the gas/particle par-titioning of twenty different semivolatile organic compounds (primary and secondary)in the organic layer of wood soot, diesel soot, and SOA. A model based on the UNI-FAC approach was used to estimate the activity coefficients. It was concluded thatthe humidity effect on partitioning of semivolatile compounds is most significant for25
Numerous field studies have been conducted in the past decades to document thehygroscopicity of atmospheric particles under a variety of conditions. In many casesparticles with clearly distinct hygroscopic properties have been observed in a singleair sample. These hygroscopicity classes are usually classified as “near hydrophobic”,5
“less hygroscopic” (LH) and “more hygroscopic” (MH). However, depending on the en-vironment, the actual GF corresponding to each of these classes (in particular the LHand MH) can show large variation. Table 10 gives an overview of recent studies fromwhich we have extracted frequency of occurrence and number fraction of particles withGF<1.2 and those with GF>1.2. Without claiming to be exhaustive, we have tried to10
compile studies that give typical results for a range of atmospheric conditions, fromthe street canyon to the remote marine environment. More data compilations can befound in Cocker et al. (2001) and Baltensperger et al. (2002). The separation of the twoclasses at GF 1.2 is rather arbitrary, but has been made in the first place to evaluatethe trend in the LH aerosol fraction to the total population when moving away from the15
source areas (urban background) to remote sites. The column “fraction of occurrence”is the product of the “fraction of time” LH particles occur and “number fraction” whenLH particles occur, which allows to rank the importance of these particles.
As can be seen in the studies mentioned in Table 10, the GF of these particles tendsto increase with particle size. Hence, the data indicates that mixing of the initially less20
hygroscopic particles with soluble secondary aerosol, increases the hygroscopicity ofthe particles.
Biomass burning plumes measured in the Amazonian basin are strongly dominatedat all sizes by LH particles, even when they are relatively aged. Also here, inspec-tion of the GF values shows an increase of the GF with particle size (Vestin, 2003).25
African biomass burning plumes aged over the Atlantic show all particles in the morehygroscopic class, indicating the presence of (secondary) soluble components, possi-bly originating from marine dimethylsulfide (DMS) oxidation products, or anthropogenic
pollutants co-transported with the plume.Also in conditions where secondary organic aerosol is being formed (Boreal, Amazon
and Mediterranean forests) the LH fraction remains high, although also here decreas-ing with particle size. This indicates an internal mixing between soluble salts and thein-situ formed organic components.5
The picture emerging from the ‘real-world’ data is the following:
– Under traffic-dominated conditions (street canyon and urban background), a sig-nificant fraction of LH particles is quasi permanently observed. This fraction de-creases with increasing particle size for a given urban site.
– The time fraction of occurrence of these less hygroscopic particles decreases pro-10
gressively when moving from the urban background to continental and to remotemarine locations. Simultaneously, a population of more hygroscopic particles isalways present.
Analysis of the results of the following studies has led to a series of valuable insightsregarding the role of organics in the hygroscopic growth of particles. The study of15
the hygroscopic behaviour of atmospheric particles collected above the North AtlanticOcean by Posfai et al. (1998) suggested that organic films on the particles may beresponsible for the observed relatively large water uptake at low relative humidities.
Swietlicki et al. (1999) combined measurements of hygroscopic diameter growth fac-tors and aerosol composition in Northern England to investigate the role of organics20
in the aerosol water uptake. For particles in the 0.17–0.53µm size range they wereable to reproduce the observed growth that agreed with the theoretical estimate withinexperimental error for all cases but one. They proposed that the discrepancy for this airmass for which the aerosol had undergone extensive photochemical processing wasdue to organics.25
Lowenthal et al. (2003) examined the ability of organic aerosols to absorb water asa function of relative humidity (RH) using data collected during the 1999 Big BendRegional Aerosol and Visibility Observational Study (BRAVO). On average, organics
accounted for 22% of PM2.5 mass. Hourly RH exceeded 80% only 3.5% of the timeand averaged 44%. BRAVO aerosol chemical composition and dry particle size distri-butions were used to estimate PM2.5 light scattering at low and high ambient RH. Liquidwater growth associated with inorganic species was sufficient to account for measuredlight scattering for RH between 70 and 95%. Analysis of visibility measurements in the5
Great Smoky Mountain (Eastern US) and Grand Canyon (Western US) suggested thatorganics were weakly to non hygroscopic (Malm and Day, 2001).
Dick et al. (2000) found that the water content of sub-0.4 micrometer particles mea-sured by TDMA in Great Smoky Mountains was higher than the sulphate-associatedwater modelled using laboratory data for binary aqueous solutions and the method of10
Zdanovskii-Stokes-Robinson (ZSR) for multi-component solutions over a wide rangeof humidities (RH=5–85%). Furthermore, excess water was observed to increase inproportion to the organic fraction of mass. Organic-associated water content was con-siderably less than that of sulphate compounds, on a volume basis, for high RH, butcomparable or greater for low RH.15
Speer et al. (2003) used a beta gauge to measure the change in PM2.5 mass on afilter as a function of relative humidity in a humidity-controlled environmental chamber.For six of the eight samples collected in North Carolina, the measured liquid water con-centrations exceeded those predicted from the presence of the inorganic constituents.A relationship between the excess liquid water and the measured organic carbon mass20
was found, although the standard deviations associated with the measurements werelarge. Through modelling studies it was determined that, on average, about 20% ofthe aerosol water could be associated with organic compounds. These results wererelatively consistent with the measurements and analysis of Khlystov et al. (2004) inthe Northeastern US. The authors concluded that as much as 30% of the aerosol water25
during the summer could be due to the organics.The study of the hygroscopic behaviour of atmospheric particles collected above
the North Atlantic Ocean by Posfai et al. (1998) suggested that organic films on theparticles may be responsible for the observed relatively large uptake at low relative hu-
midities. On the other hand, it has been hypothesized that the presence of organic filmson the surface of aerosols can strongly inhibit condensational growth. Chuang (2003a)measured the timescale for condensational growth of ambient particles with diametersof 50 and 100 nm in Mexico City. He showed that almost all the particles (more than98%) during both wet and dry conditions exhibit timescales of less than 3 s.5
9. Organic aerosol-cloud interactions
It was originally assumed that cloud condensation nuclei (CCN) concentration at agiven supersaturation is mainly a function of aerosol number concentration and theability of an aerosol particle to become cloud droplet is mainly controlled by the aerosolparticle radius (e.g. Feingold, 2003). Recently, studies which use new data on aerosol10
chemical composition (e.g. Shulman et al., 1996; Facchini et al.,1999b; Mircea et al.,2002; Nenes et al., 2002b) show that chemical composition of the aerosol can alsoinfluence the CCN number concentrations.
– Understanding of the processes by which the particles containing organic com-pounds are transformed into drops is a necessary requirement for improving the15
certainty of climate change predictions (Charlson et al., 2001).
– This need for understanding organic aerosol will become even more important inthe future, where carbonaceous aerosol emissions from developing economiesare expected to dramatically increase (IPCC, 2001).
Cloud droplet activation is a key process for the indirect effect, since it is the direct20
microphysical aerosol-cloud link. Although the basic theory of aerosol activation iswell established, inclusion of numerical activation models (e.g. Jensen and Charlson,1984; Flossmann et al., 1985; Pruppacher and Klett, 1980; Seinfeld and Pandis, 1998;Nenes et al., 2001) is in itself computationally challenging, so activation needs to beparameterized. Numerous such parameterisations have appeared over the years (e.g.25
Twomey, 1959; Squires and Twomey, 1960; Feingold and Heymsfield, 1992; Cohardet al., 1998, 2000; Ghan et al., 1993, 1995; Abdul-Razzak et al., 1998; Abdul-Razzakand Ghan, 2000; Chuang and Penner, 1995; Rissman et al., 2004; Nenes and Seinfeld,2003). Very few of these relationships can explicitly account for the effect of organicaerosol. This is because5
– the properties of potentially CCN active organics in aerosols are not sufficientlyknown and thus
– the resulting modified Kohler equation for CCN containing organics cannot besolved explicitly for their critical supersaturation, Sc, a requirement for most extantparameterisations.10
9.1. Organic species and their effect on cloud droplet formation
Organic species, accounting from 10 to 70% of the total ambient aerosol mass (Saxenaand Hildemann, 1996; Zappoli et al., 1999; Turpin et al., 2000) are an important class ofcompounds and are at present poorly characterized (Jacobson et al., 2000). Novakovand Penner (1993), Novakov and Corrigan (1996), Facchini et al. (1999b) and others15
have proved that the more water soluble organic compounds in particular influence theability of an aerosol particle to act as CCN. However, the interactions of organic specieswith water vapour are largely unknown. Kohler theory has been shown to apply for CCNcomposed of simple organic molecules (Cruz and Pandis, 1997), but fails to describemore complex organic species (e.g. Raymond and Pandis, 2003). Organic compounds20
can introduce competing effects on the activation behaviour of CCN by:Alteration of surface tension: The presence of organic surface active species, i.e.
reductions in solution surface tension relative to pure water, promotes CCN activationby decreasing the critical supersaturation (Shulman et al., 1996; Facchini et al., 1999a).Inorganic salts do not appreciably increase surface tension in CCN (Pruppacher and25
Klett, 1980). Facchini et al. (2000) have shown that humic-like compounds have a morepronounced surface-active behaviour, when compared to other class of compounds like
mono- and di-carboxylic acids. Another important factor determining surface tensionreduction is related to the amount of dissolved organic among the CCN size distributionand hence is connected to the concentration and solubility properties of surfactants indeliquescent particles (Rissman et al., 2004; Decesari et al., 2003).
Contribution of solute: Organic compounds can contribute soluble material to the5
growing particle and affect its growth. Those with limited solubility can lead to a grad-ual dissolution of solute; this increases the amount of dissolved material in the particlephase. The added soluble material will eventually facilitate the formation of a clouddroplet (e.g. Shulman et al., 1996; Laaksonen et al., 1998). This results in equilib-rium curves with multiple maxima if the solubility limits of the slightly soluble aerosol10
constituents are gradually exceeded, which can lead to large but stable drops that aretypically assumed to be activated (Laaksonen et al., 1998). Hori et al. (2003) pointedout that the critical supersaturations for slightly water-soluble compounds could dependsignificantly on the initial particle phase (solid or liquid) that appears a key factor to bedetermined in order to evaluate the actual CCN ability for these compounds. In addi-15
tion, the interaction between inorganic and organic compounds is not well understood.Current approaches predict either profound (Clegg et al., 2001) or negligible effects(Ming and Russell, 2001) on the water activity within the aerosol. At present, thermo-dynamic data for more realistic aerosol chemical composition are sparse. It should benoted however that the presence of some highly soluble material in the aerosol (such20
as sulphate) can dominate the water uptake enough to diminish the aforementionedcomplexities; nevertheless the contribution of slightly soluble salts to the activationproperties of the aerosol needs to be considered (Raymond and Pandis, 2003).
Affecting wettability: Recent work (Raymond and Pandis, 2002) shows that a pureorganic compound, even with solubility less than 0.01 g cm−3, could be an efficient CCN25
if its contact angle with water is close to zero. It may be that liquid water, because of thesmall contact angle, does not effectively come into contact with the soluble material todissolve it; therefore the material never gets incorporated into a droplet that may formon its surface and affect subsequent water uptake. The effect of wettability may not be
an issue for ambient multi-component aerosol, which almost always contains wettablematerial, and thus can always form a film of liquid water that would dissolve substancesof any contact angle.
Affecting growth kinetics: It is known that film monolayer of certain compounds(called “film-forming compounds – FFC” by Feingold and Chuang, 2002) can inhibit5
the rate of condensation and evaporation (Barnes, 1986; Rubel and Gentry, 1984;Chuang, 2003). This inhibition is expressed through the water accommodation coef-ficient (Eq. A3). The accepted value of the condensation coefficient for water vapouronto cloud droplets is ∼0.045, although the values range considerably between studies(Pruppacher and Klett, 1980; Mozurkewich, 1986). The degree to which this inhibition10
occurs in ambient aerosol is highly uncertain, although there is evidence for the exis-tence of FFC compounds in ambient aerosol with a water accommodation coefficientas low as 10−5 (Chuang, 2003).
Slow growth kinetics can also arise from the presence of compounds of limited solu-bility (Shulman et al., 1996; Shantz et al., 2003). The existence of slowly-growing CCN,15
depending on how the material is distributed among the particle size distribution, caneither decrease (Feingold and Chuang, 2002) or increase droplet number (Nenes et al.,2002b). There is increasing evidence that such hydrophobic films (e.g. fatty acids) canhave both biogenic and anthropogenic sources. In addition to these water-insoluble,hydrophobic films, there are indications, using dynamic surface tension measurements20
that also water-soluble organics accumulate at the air-water-interface (Decesari et al.,2003).
Quite often, an organic compound may exhibit many of the aforementioned prop-erties, leading to complex CCN behaviour. This complexity most likely explains thediversity of conclusions with regard to the role of organics found in the published lit-25
erature (e.g. Mircea et al., 2002; Feingold 2003; Nenes et al., 2002b; Ervens et al.,2004b; Rissman et al., 2004). Understanding the effect of organics on CCN propertiesis important to assess their effect on cloud droplet number. Nevertheless, the rela-tive influence of organic species on cloud droplet formation strongly depends on the
mass size distribution of the organic aerosol, on the number size distribution and thedynamical conditions of cloud formation (Nenes et al., 2002a, b; Rissman et al., 2004).
9.2. Representation of the water soluble organic compounds (WSOC) in models
In the absence of chemical composition information, aerosol WSOC is often assumedto be composed of compounds which are not representative of ambient particulate5
matter. This can clearly bias modelling studies that utilize an incomplete description oforganic aerosol. For example, observations of surface tension depression in ambientcloud water samples (Facchini et al., 1999a) show completely different behaviour fromaqueous solutions of monocarboxylic (Seidl, 2000) and dicarboxylic acids (Shulman etal., 1996) which are typically used to represent ambient WSOC. Even if a complete10
chemical characterization of aerosol was available, the complexity and large number ofcompounds typically found in aerosols would render it an almost intractable modellingproblem. Hence, there is the need for an appropriate simplification of the WSOC by as-suming a mixture of a few compounds that could capture most of the physicochemicalproperties of the real organic mixture.15
Several authors have speculated on the nature and origin of the WSOC (e.g. Sax-ena and Hildemann, 1996; Pun et al., 2000; Ervens et al., 2004a), but observationson speciation of WSOC in ambient aerosol are sparse (Likens et al., 1983; Kiss et al.,2001; Mayol-Bracero et al., 2002; Zappoli et al., 1999; Facchini et al., 1999b). Histori-cally, the speciation of organic carbon is done by identification of individual compounds.20
However, this approach is labour-intensive and can account for only a small fraction ofthe total aerosol mass. Most importantly, such methods do not identify most of thepolar oxygenated organic fraction, which are the more water-soluble species and thus,possibly CCN active (e.g. Rogge et al., 1993).
An alternative approach to characterization of WSOC is based on functional group25
analysis (Decesari et al., 2000; Russell et al., 2002), which aims to characterize therelative abundance of functional groups that are responsible for the WSOC chemicalproperties. Recently a procedure based on functional group analysis (Decesari et al.,
2000) to derive a simplified model of WSOC fraction has been proposed (Fuzzi etal., 2001). Quantitative measurements of organic carbon concentration and protonconcentration of the main functional groups contained in the aerosol WSOC mixtureare used to formulate a set of a few model compounds (acidic, basic, neutrals), whichcan be used to simulate the chemical and physical properties of water soluble organic5
aerosol. The same conceptual method to derive model compounds applied to Po Valleyaerosol (Fuzzi et al. 2002) can be used for other aerosol populations.
10. Optical properties of organics
To quantify the direct aerosol influence on the atmospheric radiative balance the fun-damental parameters to investigate are the optical depth, τ, and the single scattering10
albedo (SSA), ω (Hansen et al., 1997). The optical depth is the extinction resultingfrom absorption and scattering of radiation by the aerosols in a column and is directlydependent on the aerosol amount. The spectral characteristics of τ are required tomodel the radiative effects of aerosols, to retrieve aerosol parameters from satelliteremote sensing, and to correct for aerosol effects in remote sensing of the earth’s sur-15
face. In a more detailed understanding of the influence of different aerosol types onthe radiative balance, the key parameter to be explored is the single scattering albedo(Hansen et al., 1997). The single scattering albedo is defined as:
$ =Qscat
Qscat +Qabs(18)
where Qscat and Qabs are the scattering and absorption efficiencies of the aerosol,20
commonly calculated by Mie theory assuming spherical aerosols and adopting theaerosol complex index of refraction and a size distribution. The single scattering albedoof aerosols is thus determined by the aerosol size and its composition, that is by itscomplex index of refraction, N(λ)=n(λ)+ik(λ); k(λ) is the wavelength dependent ab-sorption index and n(λ) is the corresponding refractive index. The interpretation of the25
single scattering albedo is that for ω=1 the aerosol investigated is totally scattering andlower the global mean surface temperature; low values of ω indicate that the aerosolswill increase the global mean surface temperature. Several climate and radiative modelstudies have investigated the turnover value and critical values in the range from 0.85–0.91 are reported (Hansen et al., 1997; Haywood and Shine, 1995).5
10.1. The optical properties of organic compounds present in tropospheric aerosols
The single scattering albedo is strongly dependent on the refractive and particularlythe absorption index in the UV and visible region. Until now, only soot (with high blackcarbon content) aerosols are known to have a positive direct aerosol forcing, increasingthe surface temperature. Only a single study exists on the complex index of refraction10
of various organic aerosol components and mixtures at concentrations representativeof atmospheric conditions in the tropospheric particulate matter (Myhre and Nielsen,2004). Consequently, the effect of the individual organic compounds in the aerosols onthe incoming solar radiation is characterized by a large uncertainty.
Whereas data on the complex index of refraction of mixtures of organic components15
relevant to atmospheric aerosols is sparse, there are several studies of pure organicliquids and their absorption index and/or refractive index in the short wavelength regionat a single selected wavelength or in a wider region (Bertie and Lan, 1995; El-Kashef,1998; Jacobson, 1999; Li et al., 1994; Marsh, 1987; Raty et al., 1999). Figures 7a andb summarize the absorption and refractive indices, respectively, of organic components20
relevant to the troposphere. These figures include the optical constants of some pureorganic liquid components (Bertie and Lan, 1995; El-Kashef, 1998; Jacobson, 1999;Li et al., 1994; Marsh, 1987; Raty et al., 1999), the absorption and refractive index oflignin dissolved in water (Raty et al., 1999), and selected optical constants of aqueousorganic acids present in tropospheric aerosols, and fog samples (Myhre and Nielsen,25
2003; Myhre and Nielsen, 2004). Finally, a typical literature value of soot (Liu et al.,2002) is indicated by solid star in this figure to show the optical constants of an aerosolcomponent, which is known to strongly absorp in the atmosphere.
Jacobson (1999) investigated the influence of nitrated and aromatic aerosols andgases on the extinction processes responsible for the reductions in the downward solarirradiance in the Los Angeles region. The absorption index of the aerosol componentswas derived at the wavelength of strongest absorption from molar absorption spectraand reported along with corresponding available refractive index data. Table 11 con-5
tains a selection of the optical constants reported by Jacobson (1999). All the compo-nents listed are observed in the atmospheric particulate matter (Jacobson, 1999, andreferences therein), in particular in polluted regions. The components with the highestabsorption index in each class of the organic compounds listed in Table 11 are includedin Fig. 7. As mentioned, Jacobson (1999) reported only the absorption index at one10
wavelength – the one with the maximum absorption index. Several of the componentswill certainly have absorption tails in the 400–500 nm range; such as nitrobenzene andnitro phenols (Jacobson, 1999), and the very strong absorbers like Benzo[e]pyrene,observed by Rogge et al. (1993) in Los Angeles. Pure liquid nitro phenol has an ab-sorption index close to 0.1 at 400 nm (Jacobson, 1999); this value is also included in15
Fig. 7a. The work of Jacobson (1999) clearly demonstrates that more laboratory datais needed as many of the components observed in the tropospheric aerosols have highabsorption indices in the UV-region and with absorption tails in the visible region.
Raty et al. (1999) investigated the complex index of refraction of 2 solutions, red foodcolour and lignin, in the range from 250–450 nm. Their study of lignin has relevance to20
atmospheric aerosols, and the results at selected wavelengths are included in Fig. 7.Raty et al. (1999) presents the data of lignin exclusively in graphical form showing max-imum absorption at ∼290 nm. The samples were prepared by diluting 40 g lignin L−1
water and further concentrated by evaporating the initial volume to the half. They reportan absorption index at 300 nm estimated to 0.005 decreasing to 0.002 at 350 nm. The25
corresponding values of n(λ) are 1.38 and 1.37, respectively; the values are includedin Fig. 7 by solid squares.
A series of studies report only the refractive index, n(λ), of pure organic liquids.Marsh (1987) measured the refractive index at 293 K of 1-Methylnaphthalene, toluene,
and 2.2.4-trimethylpentane at 7 selected wavelengths in the UV and visible range.All the values are included in Fig. 7b as different symbols connected with lines. Liet al. (1994) have measured the refractive index of liquid n-hexane and toluene at632.8 nm at 7 temperatures ranging from 15–45◦C. Their results for toluene are in ex-cellent agreement with those of Marsh (1987) and their value for n-hexane is shown5
in the figure by an open start. Bertie and Lan (1995) calculated the refractive index ofpure acetic acid, methanol, acetone, dichloromethane, benzene, chlorobenzene andmethylbenzene in the UV-Visible region by extending the Kramers-Kronig transforma-tion of absorption indices obtained in the infrared region. The results are presented inFig. 7 as solid and dotted lines. Unfortunately, they did not present absorption indices10
in the UV-region, only in the infrared region. El-Kashef (1998) measured the refractiveindex of cyclohexane in the range from 400–800 nm at 293 K; the results are only pre-sented in graphical form and selected values are included in Fig. 7 by solid circles. Thetemperature dependence of the refractive index in this wavelength range is reported tobe in the order of dn/dT=−5×10−4 K for all the investigated pure organic components15
(Bertie and Lan, 1995; El-Kashef, 1998; Li et al., 1994). Various other studies of the re-fractive index, n(λ), of organic liquids report values at one single wavelength, 590 nm,and some of them are relevant to atmospheric conditions (Aminabhavi et al., 1996;Cases et al., 2001; De Lorenzi et al., 1997; Gomez-Diaz et al., 2001; Ritzoulis and Fi-dantsi, 2000; Segade et al., 2003). The results from these studies are consistent with20
the values presented in Fig. 7b. Several of these studies investigate the refractive indexof binary organic liquids (Aminabhavi et al., 1996; Cases et al., 2001; Gomez-Diaz etal., 2001; Segade et al., 2003). Cases et al. (2001) investigated mixtures of formamidand 3 carboxylic acids and Segade at al. (2003) investigated the properties of octanemixed with 7 alkanols. The studies show that the deviation from a linear mixing rule is25
less than 5×10⁻³ and that the largest deviations are observed in the region around 0.5mole fraction.
Recently Myhre and Nielsen (2004) reported the complex index of refraction of sev-eral aqueous organic acids. They investigated the absorption and refractive indices
of aliphatic dicarboxylic acids and aromatic acids. The concentrations of the inves-tigated samples ranged from highly diluted samples up to saturation concentrations.The organic acids investigated were the low molecular weight dicarboxylic acids: ox-alic, malonic, succinic, glutaric, hydroxymalonic acid, in addition they investigated ben-zoic, phthalic and pinonic acid. The results show that all the aliphatic acids have their5
absorption bands in the UV-region below 300 nm, except for pyruvic acid. Of the aro-matic acids, phthalic acid is the one with the highest absorption index. Pyruvic acid hasan absorption band at 328 nm and the absorption index for a 25 weight percent (wt%)solution in water is reported as 1.2×10⁻⁴. In the visible and near infrared region theabsorption indices of all the acids are nearly identical to that of ammonium sulphate10
and essentially determined by the water band at 980 nm. The results of 0.5 weightpercent (wt%) phthalic acid and 25 wt% pyruvic acid are included in Fig. 7a. Regard-ing the refractive index of the aqueous organic acids it is essentially determined by theamount acid present, and not by any molecular characteristics of the components. Therefractive index changes linearly with the total acid weight percent in the investigated15
concentration range; 0–60 wt% and the results of 50 wt% glutaric acid and 5 wt%pyruvic acid are shown in Fig. 7b as fat solid and dotted grey lines.
10.2. The optical properties of mixtures of organic compounds
In addition, Myhre and Nielsen (2004) calculated the single scattering albedo, SSA,of some binary mixtures as well as one complex mixture adopting the same size dis-20
tribution as normally used in modelling studies of sulphate aerosols. The conclusionfrom these calculations was that all the investigated organic acids have a pure scat-tering effect. They scatter solar radiation similar to sulphate aerosols and they havesimilar cooling effect on the climate. Nevertheless, in the interpretation of the results itis important to remember that at tropospheric conditions the saturation concentrations25
may well be much higher than in the binary water/acid solutions due to the other com-ponents present in the aerosol. This will affect the absorption indices and in turn theSSA.
The content of organic components in fog water exhibits a clear similarity to thatobserved for the water-soluble fraction of the fine mode aerosols collected in pollutedareas as the Po Valley, Italy (Fuzzi et al., 2002). Fog samples may thus be consideredas diluted aerosols samples. Myhre and Nielsen (2003) have investigated the absorp-tion index of fog samples collected in the Po Valley and the results of the most polluted5
sample is included in Fig. 7a. The results show that the absorption index has a verybroad tail into the visible region. However, the observed difference between the ab-sorption index of water and the fog samples from the Po Valley has negligible effect inthe reduction of the single scattering albedo of clouds and fog droplets. Consequently,the scattering and absorption properties of fog and clouds can be treated as pure water10
in radiation calculations, even in polluted regions. This is in line with the conclusion ofLiu et al. (2002), who investigated the presence of black carbon, BC, in cloud droplets.They concluded that the observed BC mass concentrations are usually too low to re-duce the cloud albedo in any significant way and their conclusion is in agreement withthe results of Twohy et al. (1989).15
Schnaiter et al. (2003) investigated the impact of coating of soot with organic materialformed during ozonolysis of a-pinene. They found strong increases of both the SSAand the absorption cross section of the soot particles due to the coating by SOA andconcluded that global forcing by black carbon aerosols should be revised to include theabsorption enhancement effect as suggested by Jacobson (2001).20
11. Direct climatic impact of organic aerosol
The most simplified way to evaluate the radiative forcing of the atmosphere resultingfrom OA in global models has been the use of a constant extinction coefficient for OAand the assumption that OA and the other aerosol components are externally mixed.This is the approach that has been followed in the first global study by Liousse et25
al. (1996), who assumed a constant extinction coefficient of OA within each one of 3considered wavelength bands and allowed modification of the optical properties of OA
by the presence of aerosol associated water similar to that for sulphate aerosols.Since then a lot of progress has been made (IPCC, 2001, and references therein).
A relatively limited number of studies has investigated the direct radiative forcing re-sulting from organic aerosol (IPCC, 2001 and references therein; Myhre et al., 2001;Takemura et al., 2001; Chung and Seinfeld, 2002) and among them only one (Chung5
and Seinfeld, 2002) has explicitly treated the occurrence of SOA in the troposphere.In these studies of radiative forcing, the required optical properties of the aerosols
i.e. extinction coefficient, single scattering albedo (SSA) and asymmetry factors aredetermined by Mie theory calculations that require wavelength and size dependentrefractive indices of aerosols. For these calculations the refractive indices of the indi-10
vidual aerosol components are needed as well as the assumed dry mass density andsize distribution of aerosols. The wavelength bands used for the radiative calculationsvary, in number and size, from one model to the other. Kinne et al. (2003) presenta very comprehensive evaluation of 7 global models considering at least 5 aerosolcomponents including OA, by comparison with satellite and AERONET ground-based15
data. The reader is referred to Kinne et al. (2003) for an overview of the major dif-ferences that can exist between models with regard to the above mentioned param-eters that determine the overall aerosol optical properties on which replies the calcu-lated climatic impact of aerosols. The ongoing AEROCOM intercomparison exercise(http://nansen.ipsl.jussieu.fr/AEROCOM) is expected to go a step further and quantify20
the contribution of the various factors to the overall uncertainty in the latest radiativeforcing calculations.
Hereafter we aim to provide a summary of how different models are treating theOA for direct forcing calculations. When comparing the extinction coefficients at aspecific wavelength used for OA in global models (when this information is available),25
one can notice a factor of 3–4 difference in the adopted values. For instance, Liousseet al. (1996) assumed a specific extinction coefficient of 4 m2 g−1 (at 550µm) for dryOA that was considered to be purely scattering, whereas Cooke et al. (1999) adopted aslightly lower value of 3.6 m2 g−1 (at 500µm), SSA of 0.98 (slightly absorbing OA from
fossil fuel) and effective radius of 0.02µm. Koch et al. (2001) used a specific extinctioncoefficient for OA of 8 m2 g−1 (at 550µm) to account for neglecting the water uptake byorganics, SSA of 0.96 and effective radius of 0.5µm. Chung and Seinfeld (2002) usedan extinction coefficient of 2.53 m2 g−1 for dry OA, SSA of 0.94 and effective radius of0.5µm. These assumptions affect the calculated direct radiative global forcing of OA5
since they apply to the OA distributions computed on the basis of emissions, chemistry,transport and deposition processes as discussed in the previous sections.
Another important source of differences in the radiative forcing calculations for OA isthe consideration or not of the water associated to that aerosol. Although, there is notalways sufficient information on whether and how the water uptake by OA has been10
taken into account in the models. Chung and Seinfeld (2002) calculated an increaseby −0.09 Wm−2 in the radiative forcing at the top of the atmosphere since preindustrialtime produced by wet OA compared with that calculated for the dry OA (−0.09 Wm−2).This difference seems to apply also when mixtures (external or internal) of aerosols areconsidered and points to the importance of understanding the interactions between OA15
and water in the atmosphere as described above. Note that there is important spatialand temporal variability in this forcing. In addition, the consideration of internally mixedaerosol (ammonium sulphate, and carbonaceous) is lowering the calculated coolingdirect climate effect of aerosols compared with the externally mixed aerosol case (from−0.78 to −0.48 Wm−2).20
Indeed, the consideration of internal mixing of aerosols has been recently showncritical for forcing estimates (Jacobson, 2001a; Lesins et al., 2002). Recent observa-tional data show the drastic enhancement of BC absorption when it is coated by solublematerial (Schaiter et al., 2003). Lesins et al. (2002) estimated that for specific internalmixing assumptions nearly all of the cooling effect predicted for the external mixture is25
counterbalanced by the BC absorption enhancement.This points to the importance of consideration of the mixing state of the aerosol.
However, significant gaps exist in the knowledge of the optics and the hygroscopicbehaviour of internally mixed aerosols, especially the involvement of organic aerosol
compounds.Future model investigations, forcing estimates and atmospheric chemistry simula-
tions need to consider the physical mixing of its individual components and the inter-actions between them.
12. Indirect climatic impact of organic aerosol5
Indirect effects of aerosols on climate refer to the various mechanisms by whichaerosols can perturb the albedo of the Earth’s clouds. In this section we first give a gen-eral description of the indirect effect and then focus on the role of OA. Twomey (1959,1977) identified what is generally referred to as the first indirect effect, in which in-creased cloud condensation nucleus (CCN) concentrations result in increased cloud10
drop concentrations, smaller drop radii, and more reflective clouds. Albrecht (1989)noted that a decrease in cloud drop effective radius may lead to lower coalescencerates, hence reduced precipitation and a longer cloud lifetime and greater spatial ex-tent, a phenomenon that is sometimes referred to as the second indirect effect. Boersand Mitchell (1994) and Pincus and Baker (1994) noted that changes in cloud micro-15
physics and precipitation alter the radiative cooling and latent heating within a cloud.Hansen et al. (1997) identified a so-called “semi-direct” effect, in which changes inthe thermal structure of the atmosphere resulting from aerosol solar absorption (princi-pally by black carbon) suppress cloud formation. Black carbon heating can also affectcloud albedo through an alteration of the cloud condensation nucleus (CCN) spectrum20
during cloud formation (Conant et al., 2002; Nenes et al., 2002b). Changes in coldice-cloud microphysical and radiative properties in response to changing atmosphericaerosol concentrations have also been postulated (Jensen and Toon, 1992; DeMott etal., 1994, 1997), although in this case ice nucleating (IN) particles, rather than CCN,are the relevant aerosol particles. Relative to present-day understanding of aerosol-25
CCN-cloud linkages, much less is known about the nature of IN, their sources, andtheir indirect effects on cold clouds (IPCC, 2001).
The number of CCN is a critical link between aerosols, clouds, and precipitation.Since clouds are effective reflectors of incoming solar radiation, even small perturba-tions in their properties can significantly impact the amount of solar radiation absorbedby the planet, and thus affect climate. It is currently thought that aerosol-cloud interac-tions have a net cooling effect; quantitative estimates are highly uncertain, of the order5
of the greenhouse warming effect itself (IPCC, 2001).There are two reasons for the large uncertainty associated with the indirect effect.
– The first originates from the wide range of length scales involved in cloud-aerosolinteractions: from hundreds of kilometres (that of the largest cloud systems) downto tens of meters (that of individual updrafts responsible for production of new10
drops).
– The other reason is our poor understanding of the distribution of global CCN.
General Circulation Models (GCMs) are far from being able to resolve the scales in-volved in cloud formation. Much of the properties of warm clouds can be estimated ifthe relationship between aerosol and cloud droplet number is known. The first global15
climate modelling studies used an empirical approach, with cloud droplet number con-centration being linked to a property available in a global aerosol model, such as totalaerosol sulphate mass (e.g. Boucher and Lohmann, 1995), or total aerosol number(e.g. Gultepe and Isaac, 1996). Relating one bulk aerosol characteristic to cloud dropletnumber is subject to significant uncertainty. For example, in the RACE subset of the20
Gultepe and Isaac (1996) observations, the cloud droplet number concentration mayrange from 50 to 400 cm−3, for an aerosol number concentration of 800 cm−3. Thisvariability in cloud droplet concentration leads to a significant uncertainty in the pre-diction of cloud radiative properties. This is illustrated by the Kiehl et al. (2000) study,in which several different empirical relationships yield estimates of the global annual25
average indirect forcing ranging between −0.40 and −1.78 Wm−2. The scatter in em-pirical aerosol-cloud droplet number correlations indicates that cloud droplet numbercan be strongly influenced by factors other than e.g. aerosol number or sulphate mass.
One factor contributing to this scatter can be the presence of organics as discussed insection 8.
Recently, first-principles approaches to predicting cloud droplet number haveemerged (e.g. Ghan et al., 1997; Lohmann et al., 1999), in which a cloud droplet num-ber balance in each GCM grid cell is established. Lohmann et al. (2000) have used5
this approach in a GCM. They evaluated the 1st and 2nd indirect effect due to sulphateand carbonaceous aerosols between −1.1 W m−2 for an internally-mixed aerosol and−1.5 Wm−2 for an externally-mixed aerosol. They attributed this difference mainly tothe increased climatic impact of carbonaceous aerosol when externally mixed aerosolis considered, due to higher atmospheric loadings and smaller particle sizes. These10
estimates do not include the impact of BC absorption in clouds on the first indirecteffect.
Chuang et al. (2002) estimated the impact of BC absorption in clouds to glob-ally change the first indirect effect by less than 0.07 Wm−2, whereas locally it coulddecrease the forcing by as much as 0.7 Wm−2 in regions where BC emissions are15
pronounced. However, this estimate does not include the recently discovered en-hancement of BC absorption due to coating by organics (Schnaiter et al., 2003).Chuang et al. (2002) estimated the total first indirect forcing to be −1.85 Wm−2, with−0.30 Wm−2 associated with anthropogenic sulfate, −1.16 Wm−2 associated with car-bonaceous aerosols from biomass burning, and 0.52 Wm−2 associated with carbona-20
ceous aerosols from fossil fuel combustion. They also found that the first indirect forc-ing of aerosols was also sensitive to the loading of natural SOA. They found that thefirst indirect forcings for suphate and for carbonaceous are reduced from −0.31 to−0.26 Wm−2 and from −1.67 to −1.27 Wm−2, respectively, when the SOA source isincreased by a factor of 5 from 8.4 to 42 Tg y−1. This study assumed that all SOA25
is formed in the boundary layer, although as discussed in the introduction, significantpart of SOA is formed in the free troposphere. Therefore, this assumption introducesadditional uncertainties since Penner et al. (2003) have shown that climate forcingdepends significantly on the altitude of the injections of the aerosols since higher in-
jections increase the aerosol lifetimes and subsequently their burden. They found thathigher-altitude injections of biomass burning carbonaceous aerosols tend to enhancethe negative longwave forcing and BC aerosols injected at high altitudes can increasecloudiness at lower altitudes, where temperature may decrease. Moreover, Chuanget al. (2002) showed that indirect forcing is overestimated when some of natural or5
anthropogenic aerosols are omitted.
– Few global climate modelling studies evaluated the indirect climatic impact of car-bonaceous aerosols.
– It has been found that when neglecting the other types of aerosols, the climaticimpact of carbonaceous aerosols is overestimated.10
– The calculated first indirect forcing is sensitive to the SOA global chemical pro-duction as well as to the other natural aerosol components.
– The evaluation of the impact of SOA on the indirect effect calculations relies onour understanding of the involvement of organic aerosol compounds in the hy-groscopic behaviour of internally mixed aerosols and requires improvement (see15
Sect. 9).
– The effect of enhanced absorption by BC on cloud properties when BC is coatedby organics has to be considered in the indirect forcing calculations as well as theinvolvement of SOA on CCN formation and growth and thus on cloud occurrenceand properties.20
13. Datasets of particulate organic carbon for evaluation of global models
The following discusses the ‘traditional’ ground based observations that can provide in-formation on specific aerosol component. As stated and well documented in the reviewpaper by Jacobson et al. (2000), the sampling, extraction, and analysis techniques in
use influence what we know about atmospheric organic aerosols, since what we findin the organic fraction is to a large extent determined by how we look. The reader isdirected to this earlier review for an extensive discussion on these topics. The presentwork focuses the discussion mainly on the major sources of uncertainties that influenceglobal modeling results and their evaluation.5
13.1. Ground based observations of OC
About 10 years ago, the world wide distribution of organic aerosols was poorly knownbecause of the lack of long term datasets. One of the first particulate organic carbon(OC) data compilation by Liousse et al. (1996) relied on OC measurements from a quitelarge number of sampling sites (21) but most of them (14) covered only a period of 1–210
months. This was nevertheless enough to show that organic matter is a ubiquitous andsignificant constituent of the aerosol. During the last decade, organic (and elemental)carbon started to be more commonly measured over longer time periods. In a recentcompilation of long term aerosol chemistry data sets produced in Europe (Putaud etal., 2003, 2004) OC measurements were included in 10 of the 16 compiled data sets.15
Recently, OC measurements have been added to the EMEP monitoring program, for alimited amount of the EMEP super-sites only though (http://www.nilu.no/projects/ccc/).
In the USA a number of measuring networks provide OC data. Organic carbonand chemical speciation measurements have been included in the measurements pro-gram of the EPA super sites. One of the oldest continuous ones is the IMPROVE20
(Interagency Monitoring at Protected Visual Environments) data set with measure-ments in background sites (http://vista.cira.colostate.edu/improve). The network hascurrently 150 sites and collects information about aerosol composition and opticalproperties. Some of the sites have collected more than 15 years of data. Figure 8shows the estimated spatial patterns of OC and the locations of PM monitoring sites25
(Malm, 2000). The map was produced using data from only the background sites soit does not include the major industrial areas. Concentrations of OC and elementalcarbon (EC or as used in this document black carbon: BC, see discussion below)
in mainly urban and sub-urban areas in the US are measured by the Speciation andTrends Network (STN). The measurements started in 2001 and include around 200stations around the country. PMEL Atmospheric Chemistry Data Server contains OC(and BC) data for most cruises in the Atlantic, Pacific, Antarctic and Indian Oceansince 1997. To our knowledge, long term OC (and EC/BC) measurements have also5
been performed in South America (de Almeida Azevedo et al., 2002; Tsapakis et al.,2002) and South East Asia (Kim et al., 2000; Sau and Khalil, 1993). The WMO-WDCA (http://rea.ei.jrc.it/netshare/wilson/WDCA) is currently aiming at compiling allthese long term aerosol data sets in a common format to make them available to thecommunity. This should increase the number of available extensive OC data sets in10
the next future.A difficult task is to separate the SOA from primary OC based on observations. The
EC tracer method is the main direct approach. Cabada et al. (2004) identified periodsdominated by primary emissions and periods of probable SOA production in the areabased on measurements of gaseous tracers of combustion sources (CO, NOx) and of15
O3, respectively. The observations of OC and EC during the first period have beenused to establish the relationship between primary OC and EC, a tracer for primarycombustion-generated carbon. During the second period, the deviations of the ob-served OC from that relationship have been used to evaluate the SOA contribution tothe ambient OC levels. An upper limit of the SOA can be estimated based on the unex-20
plained OC during the use of the CMB approach and organic speciation measurements(Zheng et al., 2002).
13.2. Definition problem
A possible source of systematic error in particulate OC determination arises from thedifficulty of separating OC and EC/BC. Actually, the border between these two “species”25
is only instrumentally defined. For Chow et al. (1993), OC evolves at up to 520◦C ininert career gas, and EC/BC from 520 to 650◦C in an oxidant career gas. The twomajor protocols for OC and BC split (in US) are the NIOSH and IMPROVE protocols
(see references in Chow et al., 1993). There are also variations of these protocols us-ing different temperature profiles. Charring, the transformation of OC to BC during thethermal analysis which is dependent on analytical condition and sampling substratenature, can also strongly affect the reported OC/BC partitioning. Several intercompar-isons showed that differences in OC/BC split definition and in charring amplitude and/or5
correction lead to large interlaboratory variability in EC/BC determination of up to a fac-tor of 3 (Turpin et al., 1990; Schmid et al., 2001). As a consequence, the difference inOC determination from two different techniques can be as high as a factor of 2. TheOC averages determined with various methods and normalized to the thermo-opticalreflectance method are shown in Table 12. Differences in averages can reach >50%. It10
is surprising that methods accounting for charring could lead to lower OC values thanother methods in the intercomparison described by Countess (1990), contrary to whatwas observed in a previous intercomparison (Groblicki et al., 1983). The intercompar-isons based on sample collected in Europe (Schmid et al., 2000; Ten Brink et al., 2004)showed in contrast that methods correcting for charring all lead to higher OC values.15
– The definition (if possible) of an international standard for ambient particulate BCmight allow adjustment and homogenisation of observations that should also beapplied to the emission factors that are adopted for the construction of emissioninventories.
13.3. Analytical problems20
OC measurements may be seriously affected by various artifacts at the sampling andanalysis stages (Turpin et al., 2000). Sampling artifacts have been extensively stud-ied in the USA. Several sampling methods (filtration, adsorption- corrected filtration,impaction) compared in Hering et al. (1990) showed up to 70% differences in singlesamples. Also Eatough et al. (1993) showed that sampling in Utah (USA) with pre-fired25
quartz fiber filters may lead to 20–80% negative artifacts and up to 50% positive ar-tifacts in single samples. The OC averages (over 18 samples) obtained by Hering et
al. (1990) with various sampling methods and normalized to the results obtained fromsampling with a plain undenuded quartz fiber filter at a face velocity of ca. 38 cm/s arecompared in Table 12. Normalized concentrations ranged from 0.49 to 1.34 in the LosAngeles Basin. These results may not be valid for other locations, since sampling arti-facts are expected to depend on the aerosol (gaseous and particulate) carbonaceous5
species mixture and on meteorological conditions. Indeed, Mader et al. (2003) and TenBrink et al. (2004) found different results for positive artifact corrected quartz filter datain Easten Asia and impactors in Europe, respectively (Table 13).
The artifact-free wet annular denuder – steam jet aerosol collector combination(WAD-SJAC) with on-line analysis of total OC is a promising method for OC mea-10
surement. Such an instrument was tested during the Intercomp2000 experiment inGermany (Ten Brink et al., 2004) and led to results, which tend to indicate that positiveOC sampling artifacts on filters were predominant at this site. However, such a kindof artifact free combination is not very suited for long term monitoring programs, anddoes not permit to collect enough organic material for speciation. Various filter-based15
devices have nevertheless been proposed to limit and/or assess positive and negativesampling artifacts when using quartz fiber filters. Positive artifacts were addressedthrough the back-to-back filter technique (Fitz, 1990; Novakov et al., 1997), the Teflon+ quartz/quartz simultaneous sampling method (Mc Dow and Huntzicker, 1990; Chowet al., 1996), or the use of diffusion denuders, in which sorbents were quartz (Fitz,20
1990) or carbon impregnated paper strips (Eatough et al., 1989, 1993, 1996; Tang etal., 1994), activated Al2O3 (Appel et al., 1989), or XAD-4 (Mader et al., 2001, 2003; Fanet al., 2003). The use of a denuder shifts the gas/particle equilibrium of semi-volatileorganic compounds, and renders the assessment of negative artifacts essential. Neg-ative artifacts were determined by trapping the organic molecules volatilized from the25
particles upstream quartz fiber filter in sorbent like carbon impregnated glass fiber fil-ters (Eatough et al., 1993, 1996, 2001; Tang et al., 1994), XAD-4 impregnated quartzfiber filters (Fan et al., 2003), or poly-urethane foams (Kavouras et al., 1999). How-ever, these combinations do not always solve completely the problem. First of all, the
denuder efficiency is sometimes not 100%, and may vary with time and meteorolog-ical conditions. Their efficiency should therefore be continuously monitored, thoughparallel monitoring of particle-free ambient air, which makes this approach quite laborintensive. Second, none of these sorbents can withstand temperatures higher than450◦C for a few tens of seconds.5
Although, volatile or semi-volatile species trapped in the sorbents are expected tohave a relatively low boiling point (<300◦C), this temperature limitation might preventthe evolution of the whole trapped OC. Indeed, analysis of quartz back up filter withthe EGA method (20◦C min−1 ramp from 50 to 650◦C in oxygen career gas) shows thata large fraction of non particulate OC is evolved in the 300–500◦C temperature range10
(Kirchstetter et al., 2001). Another approach to tackle OC sampling artifacts consistsin using particle concentrators like a simple virtual impactor with a low 50% cut-off ora more complex device based on the same aerodynamic particle segregation principle(Sioutas et al., 1999). Without eliminating sampling artifacts, particle concentrationcan considerably lower them, by discarding >70% of the air stream while keeping most15
particles in the sample flow. Particle concentrators have been used in combination withdiffusion denuders and sorbents to increase their efficiency (e.g. Tang et al., 1994).
Unfortunately, despite the demonstrated occurrence of significant sampling artifactsand the description of remedies in the literature, numerous OC measurements pub-lished up to now have been performed without accounting for possible artifacts. This is20
perhaps due to the fact that artifact free sampling systems are complicated, not com-mercially available, and above all not always well characterized in various environments(Turpin et al., 2000). Such devices are not widely available and have to be used as ref-erence techniques. However, as sampling artifacts are expected to depend on the OCmixture, filter type, temperature and relative humidity, it seems difficult to correct older25
Mass closure experiment can increase our confidence on the overall accuracy in or-ganic aerosol concentrations. On the top of providing an opportunity of determining thesources and amplitude of random uncertainties, mass closure experiments can indeedconstrain OC measurements when (1) overall random uncertainties in aerosol mass5
and component concentrations are small enough and (2) aerosol mass and componentconcentrations are determined independently. However, assessing the aerosol massconcentration from the sum of its components necessitates accounting for the non-carbon atoms contained in the particulate organic matter. This is usually done by usingan OC-OM conversion factor, expected to represent the mean molecular mass -to- car-10
bon mass ratio of the particulate organic matter. Values ranging from 1.2 to 1.7 havebeen used in the past. Turpin and Lim (2001) concluded that ratios of 1.6±0.2 for urbanaerosol and 2.1±0.2 for non-urban aerosol appear more accurate, but Russell (2003)found a mean ratio of 1.4±0.2 for samples collected in Asia and the Caribbean (Ta-ble 14). Actually, to really constrain OC measurements, each mass closure experiment15
should include a precise and independent determination of the aerosol mass concen-tration, of all the aerosol components’ concentration, and of the OC-OM conversionratio to be applied. Such a work is quite demanding, but necessary to demonstrateexperimental OC data quality.
A laborious task in atmospheric aerosol modeling is to evaluate the accuracy of the20
models and identify and quantify their uncertainties. A first step in evaluation of themodel results can be achieved by comparison with data of total organic particulatemass.
In addition:
– Chemical speciation may provide valuable information on the major sources con-25
tributing to the observed aerosol (by using appropriate tracer compounds) andtherefore can indicate model deficiencies and improve parameterisations.
– Chemical characterisation of organics based on functional group analysis5949
(Sect. 9.2) and allowing the description of the total organic aerosol based on aset of few compounds (acid, basic, neutral) is a promising measuring approachthat can allow the evaluation of models, especially with regard to cloud formationproperties, when appropriately designed.
Size resolved aerosol mass, number and chemical composition information will allow5
evaluation of the calculated aerosol distributions. Additional information on absorp-tion and scattering of the radiation is required to evaluate the optical properties of theaerosol mixtures computed by the models. The last years a lot of effort concentratedon comparison of model results with satellite observations that provide a ‘global’ viewof the atmosphere. However, although critical for understanding atmospheric chem-10
istry, satellite data cannot be used to evaluate the accuracy of the model simulationsof one aerosol component like the organic aerosol since they provide aerosol opticalthickness data that integrate all aerosol constituents in the tropospheric column.
– It is the synergistic use of ground based, aircraft and remote sensing observationsthat will allow optimal evaluation of global model capabilities in simulating global15
organic aerosol distributions (see example by Kinne et al., 2003).
14. Conclusions
Our understanding of the organic aerosols in the atmosphere has been significantlyimproved during the last decade although significant gaps remain. The present paperdid not aim to refer to all the experimental and modelling studies on organic aerosol20
(OA) but to i) summarize the recent understanding of the occurrence and behaviourof OA in the atmosphere with focus on the secondary organic aerosol (SOA), ii) pointout the uncertainties related to the relevant extra simplified parameterisations used inthe global chemistry transport and climate models and iii) identify areas where furtherresearch is needed.25
– The major SOA precursors are biogenic VOC. The anthropogenic contribution tothe SOA formation is small on a global scale, although it can be important inpolluted regions.
– At the global scale chemical formation of SOA could be at least 50% of the primary5
OA emissions.
– The known chemical mechanisms that form SOA are
– Gas phase OH, NO3, O3 reactions. There is ample evidence that the ozono-lysis reactions are the most important for SOA formation.
– Heterogeneous reactions that result in the decrease of the volatility of the10
semi- volatile compounds that are portioned between aerosol and gas phase.
– Aqueous phase reactions can be a significant source of dicarboxylic acids.
– The major aerosol compounds resulting from a-pinene and b-pinene gas phaseoxidation have been identified and there is knowledge on the chemical mecha-nisms leading to non-volatile products.15
– Few global climate modelling studies evaluated the indirect climatic impact of car-bonaceous aerosols comparable to sulphate that has been extensively studied.
– It has been found that when neglecting the other types of aerosols, the climaticimpact of carbonaceous aerosols is overestimated.
Of what do we have only a qualitative, not sufficient understanding?20
– The nature and the role of products less volatile than pinic acid (“the nucleatingspecies”) remains unclear although they are expected not to be among the majoraerosol constituents.
– The emissions of sesquiterpenes that have very high aerosol potential and thechemical composition of aerosol particles produced from them, remains poorlyknown.
– Large uncertainties exist in the emission inventories of primary carbonaceousaerosols. These uncertainties are mostly due to temporal-regional-sectorial attri-5
bution of emission factors to activities, but also due to differences in measurementtechiniques used to determine these emission factors.
– The emission inventories of the gaseous organics that have been identified asprecursors of SOA, are also subject to serious uncertainties dominated by thosein the emission rates and the missing pieces of information on chemical speciation10
of the emissions (e.g. the fast reacting sesquiterpenes).
– Although the thermodynamics involved in the partitioning between the gas andparticulate phase are understood, there is a need for experimental data on the en-thalphy of evaporisation of the semi-volatile organics that partition on the aerosolphase.15
– The removal of carbonaceous aerosols from the atmosphere depends largely onthe conversion of the hydrophobic to hydrophilic aerosols that is not satisfactorilyknown and parameterised in the models. Like for all other aerosol componentsit is expected that the wet deposition parameterisation used in models is a majorsource for uncertainty in the amount of SOA residing in the atmosphere.20
– Actual estimates of global SOA formation range from 12 to 70 Tg SOA y−1. Thereduction of this uncertainty requires improved and chemically speciated emissioninventories, better understanding of the chemical processes forming SOA anddescription of the size distribution of the aerosols in the global models.
– Some knowledge on the hygroscopicity and optical properties of individual organ-25
ics exists and requires further measurements. Additional data are needed on the
optical properties of internally mixed aerosols and their hygroscopic behaviour,especially of organic aerosol compounds.
– At low relative humidities (below about 50%) SOA could account for 20% of theaerosol water. Data on the interactions between inorganic and organic com-pounds and their impact on water activity within the aerosol are missing.5
– The role of organic aerosol in micro-physical cloud and rain processes is qualita-tively understood but requires further understanding. The thermodynamic proper-ties of potentially CCN active organics in aerosols are not sufficiently documented.
– The calculated climatic forcing seems to be sensitive to the SOA global chemicalproduction as well as to the other natural aerosol components.10
What are the emerging topics?
– Recent developments both on aerosol sampling and chemical analysis resultedin new findings that show the formation of low volatility oligomers and polymers.These findings may lead to significant changes in the current SOA modelling ap-proaches. The separation between the primary and secondary organic aerosol15
components becomes more difficult after the recent detection of oligomers in SOAsince compounds that have been considered of primary origin might be chemicallyproduced.
– Compounds that were previously not considered as aerosol precursors have beensuggested to contribute significantly to the SOA mass in the atmosphere (e.g.20
isoprene). More examples will probably be identified in the near future.
– Aqueous phase chemistry-cloud processing of aerosols identified as a possiblyimportant source of SOA, the strength of which requires evaluation.
– The coating of BC by SOA results in a strong increase of both the Single Scatter-ing Albedo and the absorption cross section of the soot particles that has to be25
What is the consequence for (future) climate modelling?
– It has been found that the neglect of the other types of aerosols leads to an over-estimate in the impact of carbonaceous aerosols. The consideration of internalmixing of aerosols has been recently shown critical for forcing estimates, in gen-eral smaller effects are calculated when the internally mixed aerosol is considered5
since internal mixing affects both aerosol lifetime and properties.
– The evaluation of the climatic impact of OA (both primary and secondary) relies onour understanding of the involvement of organic aerosol compounds in the hygro-scopic behaviour of internally mixed aerosols that has to be improved. It requiresconsideration of OA interactions with the other aerosol constituents and aerosol10
associated water. Such interactions are altering the absorptive and scatteringproperties of the aerosol, their hygroscopicity and their ability to form CCN.
– Appropriate parameterisations need to be developed to allow incorporation of in-formation about the direct (optical properties) and indirect effect (CCN activity) ofOA in the global models that are actually treating OA in a very simplified way.15
– The development of SOA precursor gas emissions under future climate regimesand land-use is probably important, but up-to-date only a few speculative studiesare available.
What are the key priorities for research?
– There is an open question whether the laboratory studies of SOA with relatively20
high concentrations of precursor molecules and oxidants are also valid under realatmospheric conditions or not. Recent laboratory studies have pointed out theinfluence of OH-scavenger and Criegee-intermediate scavenger (e.g. water) onaerosol yieds during ozonolysis experiments. These observations have to beconsidered to carefully translate chamber experiment results to atmospheric con-25
ditions. In this perspective, the impact of NOx levels on the aerosol yields and thefinal products of the photooxidation reactions has to be investigated.
– Most modeling studies rely on arbitrary chosen model compounds to representthe hygroscopicity or optical properties of the (S)OA-inorganic aerosol mixture.The use of model compounds constructed based on experimental informationcould provide more realistic representation of the properties of the OA mixture.
– The involvement of organics in the new particle formation deserves further studies5
to determine its importance on regional and global scales. The nature of productsless volatile than pinic acid (“the nucleating species”) remains an open questionalthough they are expected not to be among the major aerosol constituents.
– More studies on sesquiterpenes-temperature dependence of aerosol yields andproduct identification are needed since these compounds seem to have a large10
SOA froming potential.
– Appropriately designed chamber experiments have to be performed to developand validate chemical reference schemes for aerosol for subsequent simplificationbased on understanding of chemical processes.
– The importance of multiphase chemistry in SOA formation has determined.15
– Better measuring techniques are needed for carbonaceous aerosols especiallywith regard to the understanding of the chemical composition and the ageing pro-cesses of OA. Particular attention is needed to avoid artifacts in sampling andanalysis of OA compounds. Since the distinction between black and organic car-bon is not clear, observations have to be accompanied by the definition of the20
measured quantity. Effort has to be put into avoiding inconsistencies betweenmeasurements of carbonaceous aerosols.
– Homogeneisation of observations of carbonaceous aerosols is needed thatshould also be applied to the emission factors that are adopted for the construc-tion of chemical speciated emission inventories. This will allow a better compari-25
– The synergistic use of ground based, aircraft and remote sensing observationswill allow optimal evaluation of global model capabilities in simulating global or-ganic aerosol distributions.
– The effect of enhanced absorption by BC on cloud properties when BC is coatedby organics has to be considered both in the direct and in the semi-direct forcing5
calculations.
– Feedback-climate mechanisms involving organics have to be investigated sinceSOA from biogenic volatile organics is estimated to be the major contributor tothe SOA mass. Thus significant biosphere-climate feedbacks are expected to beinvolved with SOA existence in the atmosphere.10
Appendix A: Theory of hygroscopic growth of particles and of cloud formation
The interaction of inorganic species with supersaturated water vapour is appropriatelydescribed by traditional Kohler theory (Kohler, 1936), in which thermodynamic argu-ments provide the water vapour supersaturation needed to form a droplet, as a func-tion of its dry radius and chemical composition. The equilibrium condition is equality15
of the chemical potential of water between the aqueous phase and the vapour phaseadjacent to the droplet surface. This relation is typically expressed in terms of the equi-librium ambient water saturation ratio Seq (relative humidity divided by 100%) and thedroplet diameter, Dp:
Seq = exp
[4σMw
ρwRTDp−
MwνΦm1000
], (A1)
20
where σ is the droplet solution surface tension, ρw is the density of water, R is theuniversal gas constant, T is temperature, Mw is the molecular weight of water, ν isthe total number of ions produced by dissociation of one molecule of solute, Φ is the
practical osmotic coefficient of the solution, and m is the solution molality. The productνΦ is also known as the “effective van’t Hoff factor”. An approximation frequently madeis that the solution is dilute (Φ=1), although this assumption does introduce someerror (Brechtel and Kreidenweis, 2000). This error primarily affects the larger nuclei,since their molalities are higher at activation than smaller nuclei, but often does not5
significantly affect the number of CCN.The droplet curvature (first term in Eq. A1) tends to increase the water vapour pres-
sure, while the presence of solute (second term in Eq. A1) acts to lower it. ExpressingSeq as a function of droplet diameter for a given initial particle, one obtains an equi-librium (or “Kohler”) curve that increases steeply when Seq<1 and goes through a10
maximum at some Seq above unity, the critical supersaturation, Sc. If the ambient Sexceeds Sc, there is always a gradient of water vapour causing water to diffuse to andcondense on the droplet, resulting in unconstrained growth. When this happens, thedroplet is said to be “activated”; atmospheric cloud formation takes place when S startscrossing the critical supersaturation of particles in the air.15
Inside a cloud, the driving force for the increase of S is cooling caused usually by ex-pansion of rising air, mixing or radiation. Condensational depletion of water vapour andrelease of latent heat of condensation slow down the increase of S, and at some point,S reaches a maximum. In principle, all droplets with critical supersaturations below themaximum value of S achieved can activate to cloud droplets, although the diffusional20
growth of droplets may be sufficiently slow that all droplets with critical supersatura-tions below the maximum S will not have time to activate (Nenes et al., 2001). Themaximum value of S achieved in rising air, as well as the number of activated dropletsresults from a competition between the ambient cooling rate and condensational deple-tion of water vapour from the growing CCN. Thus, anything that can affect the growth25
rate of droplets would potentially affect cloud droplet number. Droplet growth can be
where po is the saturation vapour pressure of water, ∆Hv is the heat of vaporization ofwater, D′
v is the diffusivity of water vapour to the droplet, and, ka is the heat conductivityof air, modified for non-continuum effects (Seinfeld and Pandis, 1998).5
Based on Eq. (A2), the maximum value of S is affected by the number concentra-tion, size distribution, and composition of the aerosol particles present. Compositionaleffects are not only expressed in Seq (Eq. A1); they can also affect D′
v . This is becausethe size of CCN is comparable to the mean free path of air molecules; thus, the prob-ability, α, of a water vapour molecule “sticking” upon the growing droplet will influence10
D′v (Seinfeld and Pandis, 1998):
D′v =
Dv
1 + 2DvαDp
√2πMwRT
, (A3)
where Dv is the diffusivity of water vapour in air. α, also known as “mass accommo-dation coefficient”, is affected by the chemical nature of the droplet-gas interface. Thepresence of surfactants may lower the value of α from the commonly accepted value of15
∼0.045 (Pruppacher and Klett, 1980) and affect the microphysical evolution of clouds(e.g. Feingold and Chuang, 2002; Nenes et al., 2002a).
Appendix B: List of abbreviations
AEROCOM Global Aerosol Model IntercomparisonBC Black carbon20
BRAVO Big Bend Regional Aerosol and Visibility Observational StudyCCN Cloud Condensation Nuclei
DMS Dimethyl SulfideDRH Deliquescence Relative HumidityEC Elemental CarbonEDB Electrodynamic balanceEMEP Co-operative Programme for Monitoring and Evaluation of the Long-Range5
Transmission of Air Pollutants in EuropeEPA Environmental Protection AgencyFFC film-forming compoundsGCM General Circulation ModelGF Growth Factor10
HMS− HydroxymethanesulfonateHNMR Proton Nuclear Magnetic Resonance SpectroscopyHTDMA Hygroscopic Tandem Differential Mobility AnalyzerIMPROVE Interagency Monitoring at Protected Visual EnvironmentsIN Ice Nuclei15
IUPAC International Union of Pure and Applied ChemistryLH Low HygroscopicityMCM Master Chemical MechanismMH Medium HygroscopicityNMVOC Non Methane Volatile Organic Compounds20
OA Organic AerosolOM Organic Particulate MaterORVOC Other reactive volatile organic compoundsOSOA Origin and Formation of Secondary Organic AerosolOVOC Other volatile organic compounds25
POA Primary Organic AerosolRH Relative HumiditySAPRC Statewide Air Pollution Research Center chemical mechanismSOA Secondary Organic Aerosol
SSA Single Scatering AlbedoTDMA Tandem Differential Mobility AnalyzerUNIFAC UNIquac Functional-group Activity Coefficient methodUV Ultra VioletVOC Volatile Organic Compounds5
WMO-WDCA World Meteorological Organization – World Data Centre for AerosolWSOC Water Soluble Organic CompoundsZSR Zdanovskii-Stokes-Robinson approach
Acknowledgements. This work has been supported by the EU project PHOENICS: EVK2-CT2001-00098. We thank all participants of the PHOENICS workshop on Organic Aerosol10
in Belgirate in Sept. 2003 for communication of their results and fruitful discussions. B. Ervensacknowledges support by the NOAA Office of Global programs. The authors are looking forwardto constructive comments on the manuscript during the interactive phase of ACPD discussion.
References
Abbot, D. S., Palmer, P. I., Martin, R. V., Chance, K. V., Jacob, D. J., and Guenther, A.: Seasonal15
and interannual variability of isoprene emissions as determined by formaldehyde columnmeasurements from space, Geophys. Res. Lett., 30 (17), 1886, doi:10.1029/2003GL017336,2003.
Abdul-Razzak, H. and Ghan, S.: A parameterisation of aerosol activation 2., Multiple aerosoltypes, J. Geophys. Res., 105, 6837–6844, 2000.20
Abdul-Razzak, H. and Ghan, S.: A parameterisation of aerosol activation 3., Sectional repre-sentation, J. Geophys. Res., 107, (D3), doi:10.1029/2001JD000483, 2002.
Abdul-Razzak, H., Ghan, S., and Rivera-Carpio, C.: A parameterisation of aerosol activation,Part I: Single aerosol type, J. Geophys. Res., 103, 6123–6132, 1998.
Albrecht, B. A.: Aerosols, cloud microphysics, and fractional cloudiness, Science, 245, 1227–25
1230, 1989.Alvarado, A., Arey, J., and Atkinson, R.: Kinetics of the gas phase reactions of OH and NO3
radicals and O3 with the monoterpene reaction products pinonaldehyde, caronaldehyde andsabinaketone, J. Atmos. Chem., 31, 281–297, 1998a.
Alvarado, A., Tuazon, E. C., Aschmann, S. M., Atkinson, R., and Arey, J.: Products of the gasphase reactions of O(3P) atoms and O3 with a-pinene and 1,2-dimethyl-1-cyclohexene, J.Geophys. Res., 103 (D19), 25 541–25 552, doi:10.1029/98JD00524, 1998b.
Aminabhavi, T. M., Patil, V. B., Aralaguppi, M. I., and Phayde, H. T. S.: Density, Viscosity,and Refractive Index of the Binary Mixtures of Cyclohexane with Hexane, Heptane, Octane,5
Nonane, and Decane at (298.15, 303.15, and 308.15) K, J. Chem. En. D., 41 (3), 521–525,1996.
Andersson-Skold, Y. and Simpson, D.: Secondary organic aerosol formation in northern Eu-rope: A model study, J. Geophys. Res., 106 (D7), 7357–7374, 2001.
Andreae, M. O. and Crutzen, P. J.: Atmospheric aerosols: biogeochemical sources and role in10
atmospheric chemistry, Science, 276, 1052–1058, 1997.Ansari, A. S. and Pandis, S. N.: Water absorption by secondary organic aerosol and its effect
on inorganic aerosol behavior, Environ. Sci. Technol., 34, 71–77, 2000.Anttila, T., Kerminen, V. M., and Kulmala, M.: A tool for estimating the contribution of water-
soluble organic compounds to the particle mass and condensational growth in the atmo-15
sphere, Atmos. Envir., 36, 5897–5908, 2002.Anttila, T. and Kerminen, V. M.: Condensational growth of atmospheric nuclei by organic
vapours, J. Aerosol Sci., 34, 41–61, 2003.Appel, B. R., Cheng, W., and Salaymeh, F.: Sampling of carbonaceous particles in the atmo-
sphere – II, Atmos. Envir., 23, 2167–2175, 1989.20
Arey, J., Atkinson, R., and Aschmann, S. M.: Product study of the gas phase reactions ofmonoterpenes with the OH radical in the presence of NOx, J. Geophys. Res., 95, 18 539–18 546, 1990.
Aschmann, S. M., Reissel, A., Atkinson, R., and Arey, J.: Products of the gas phase reaction ofthe OH radical with alpha- and beta-pinene in the presence of NOx, J. Geophys. Res., 103,25
25 553–25 561, 1998.Atkinson, R.: Gas-phase Tropospheric chemistry of organic compounds, 1, Alkanes and
alkenes, J. Phys. Chem. Ref. Data Monogr., 2, 1–216, 1997.Atkinson, R.: Atmospheric Chemistry of VOCs and NOx , Atmos. Envir., 34, 2063–2101, 2000.Atkinson, R. and Arey, J.: Atmospheric chemistry of biogenic organic compounds, Acc. Chem.30
Res., 31, 574–583, 1998.Aumont, B., Madronich, S., Bey, I., and Tyndall, G. S.: Contribution of Secondary VOC to the
Composition of Aqueous Atmospheric Particles: A Modelling Approach, J. Atmos. Chem.,
35, 59–75, 2000.Baboukas, E. D., Kanakidou, M., and Mihalopoulos, N.: Carboxylic acids in gas and particulate
phase above the Atlantic Ocean, J. Geophys. Res., 105, D11, 14 459–14 471, 2000.Baltensperger, U., Streit, N., Weingartner, E., Nyeki, S., Prevot, A. S. H., Van Dingenen, R.,
Virkkula, A., Putaud, J. P., Even, A., ten Brink, H., Blatter, A., Neftel, A., and Gaggeler, H. W.:5
Urban and rural aerosol characterisation of summer smog events during the PIPAPO fieldcampaign in Milan, Italy, J. Geophys. Res., 107, 8193, doi:10.1029/2001JD001292, 2002.
Barnes, G. T.: The effects of monolayers on the evaporation of liquids, Adv. Colloid InterfaceSci., 25, 89–200, 1986.
Barnes, I. (Ed.): The European Photoreactor EUPHORE, 4th Report 2001, http://www.10
physchem.uni-wuppertal.de/PC-WWW Site/Publications/Publications.html, 2004.Berndt, T. and Boge, O.: Products and mechanism of the gas-phase reaction of NO3 radicals
with α-pinene, J. Chem. Soc., Faraday Transactions, 93, 3021–3027, 1997.Bertie, J. E. and Lan, Z.: The refractive index of colorless liquids in the visible and infrared:
Contributions from the absorption of infrared and ultraviolet radiation and the electronic molar15
polarizability below 20 500 cm−1, J. Chem. Phys., 103 (23), 10 152-10 161, 1995.Binkowski, F. S. and Roselle, S. J.: Models-3 community multiscale air quality (CMAQ) model
aerosol component – 1. Model description, J. Geophys. Res., 108, no. 4183, 2003.BIOVOC: Final report on the EU project on Degradation Mechanisms of Biogenic VOC &
Blando, J. D. and Turpin, B. J.: Secondary organic aerosol formation in cloud and fog droplets:a literature evaluation of plausibility, Atmos. Envir., 34, 1623–1632, 2000.
Boers, R. and Mitchell, R. M.: Absorption feedback in stratocumulus clouds, Influence on cloudtop albedo, Tellus-A, 46, 229–241, 1994.
Bond, T. C., Streets, D. G., Yarber, K. F., Nelson, S. M., Woo, J. H., and Klimont, Z.: A25
technology-based global inventory of Black and Organic Carbon emissions from Combus-tion, J. Geophys. Res., accepted, 2004.
Bonn, B. and Moortgat, G. K.: New particle formation during alpha- and beta-pinene oxidationby O3, OH and NO3, and the influence of water vapour: particle size distribution studies,Atmos. Chem. Phys., 2, 183–196, 2002.30
Bonn, B. and Moortgat, G. K.: Sesquiterpene ozonolysis: Origin of atmospheric new particleformation from biogenic hydrocarbons, Geophys. Res. Lett., 30, 1585–1588, 2003.
Bonn, B., Schuster, G., and Moortgat, G. K.: Influence of water vapor on the process of new par-
ticle formation during monoterpene ozonolysis, J. Phys. Chem. A, 106, 2869–2881, 2002.Bonn, B., von Kuhlmann, R., and Lawrence, M. G.: High contribution of biogenic hy-
Boucher, O. and Lohmann, U.: The sulfate-CCN-cloud albedo effect – A sensitivity study with5
2 general-circulation models, Tellus B, 47, 281–300, 1995.Bowman, F. M. and Karamalegos, A. M.: Estimated effects of composition on secondary or-
ganic aerosol mass concentrations, Environ. Sci. Technol., 36, 2701–2707, 2002.Boy, M., Rannik, U., Lehtinen, K. E. J., Tarvainen, V., Hakola, H., and Kulmala, M.: Nucleation
events in the continental boundary layer: Long-term statistical analyses of aerosol relevant10
characteristics, J. Geophys. Res., 108, 4667–4680, 2003.Braban, C. F., Carroll, M. F., Styler, S. A., and Abbatt, J. P. D.: Phase Transitions of Malonic and
Oxalic Acid Aerosols, J. Phys. Chem. A, 107, 6594–6602, 2003.Brechtel, F. J. and Kreidenweis, S. M.: Predicting particle critical supersaturation from hygro-
scopic growth measurements in the humidified TDMA, Part I: Theory and sensitivity studies,15
J. Atmos. Sci., 57, 1854–1871, 2000.Brooks, S. D., Wise, M. E., Cushing, M., and Tolbert, M. A.: Deliquescence Behavior of Or-
ganic/Ammonium Sulfate Aerosol, Geophys. Res. Lett., 29, 23-1–23-4, 2002.Brooks, S. D., Garland, R. M., Wise, M. E., Prenni, A. J., Cushing, M., Hewitt, E., and Tolbert, M.
A.: Phase changes in internally mixed maleic acid/ammonium sulfate aerosols, J. Geophys.20
Res., 108, 4487–4497, 2003.Brooks, S. D., DeMott, P. J., and Kreidenweis, S. M.: Water Uptake by Particles Containing
Humic Materials and Mixtures of Humic Materials with Ammonium Sulfate, Atmos. Envir.,38, 1859–1868, 2004.
Busch, B., Kandler, K., Schutz, L., and Neusuß, C.: Hygroscopic properties and water-soluble25
volume fraction of atmospheric particles in the diameter range from 50 nm to 3.8µm duringLACE 98, J. Geophys. Res., 107, doi:10.1029/2000JD000228, 2002.
Cabada, J. C., Pandis, S. N., Subramanian, R., Robinson, A. L., Polidori, A., and Turpin, B.: Es-timating the Secondary Organic Aerosol Contribution to PM2.5 Using the EC Tracer Method,Special Issue of Aerosol Science and Technology on Findings from the Fine Particulate Mat-30
ter Supersites Program, 140–155, 2004.Cachier, H., Bremond, M. P., and Buat-Menard, P.: determination of atmospheric soot carbon
with a simpler thermal method, Tellus, 41B, 379–380, 1989.
Cadle, S. H. and Mulawa, P. A.: Atmospheric carbonaceous species measurement methodscomparison study: GM results, Aerosol Sci. Technol., 12, 128–141, 1990.
Calogirou, A., Larsen, B. R., and Kotzias, D.: Gas-phase terpene oxidation products: a review,Atmos. Envir., 33, 1423–1439, 1999.
Calvert, J. G., Atkinson, R., Kerr, J. A., Madronich, S., Moortgat, G. K., Wallington, T. J., and5
Yarwood, G.: The mechanisms of atmospheric oxidation of the alkenes, Oxford UniversityPress, London, 2000.
Carter, W. P. L.: SAPRC-99, available via ftp: http://helium.ucr.edu/∼carter/, 1997.Carter, W. P. L.: SAPRC-99, available via ftp: http://helium.ucr.edu/∼carter/, 1999.Cases, A. M., Marigliano, A. C. G., Bonatti, C. M., and Solimo, H. N.: Density, Viscosity, and10
Refractive Index of Formamide, Three Carboxylic Acids, and Formamide + Carboxylic AcidBinary Mixtures, J. Chem. En. D., 46 (3), 712–715, 2001.
Chameides, W. L. and Stelson, A. W.: Aqueous Phase Chemical Processes in DeliquescentSea-Salt Aerosols: A Mechanism That Couples the Atmospheric Cycles of S and Sea-Salt,J. Geophys. Res., 97, 20 565–20 580, 1992.15
Chameides, W. L., Lindsay, R. W., Richardson, J., and Kiang, C. S: The Role of BiogenicHydrocarbons in Urban Photochemical Smog: Atlanta as a Case Study, Science, 241, 1473–1475, 1998.
Chan, M. N. and Chan, C. K.: Hygroscopic properties of two model humic-like substancesand their mixtures with inorganics of atmospheric importance, Environ. Sci. Technol., 37,20
5109–5115, 2003.Chan, C. K., Kwok, C. S., and Chow, A. H. L.: Study of hygroscopic properties of aqueous mix-
tures of disodium fluorescein and sodium chloride using an electrodynamic balance, Pharm.Res., 14, 1171–1175, 1997.
Charlson, R., Seinfeld, J. H., Nenes, A., Kulmala, M., Laaksonen, A., and Facchini, M. C.:25
Reshaping the theory of cloud formation, Science, 292, 2025–2026, 2001.Chebbi, A. and Carlier, P.: Carboxylic Acids in the Troposphere, Occurrence, Sources, and
Sinks: A Review, Atmos. Envir., 30, 24, 4233–4249, 1996.Christoffersen, T. S., Hjorth, J., Horie, O., Jensen, N. R., Kotzias, D., Molander, L. L., Neeb,
P., Ruppert, L., Winterhalter, R., Virkkula, A., Wirtz, K., and Larsen, B. R.: Cis-Pinic Acid,30
a Possible Precursor for Organic Aerosol Formation from Ozonolysis of a-Pinene, Atmos.Envir., 32, 1657–1661, 1998.
Choi, M. Y. and Chan, C. K.: The effects of organic species on the hygroscopic behaviors of
inorganic aerosols, Environmental Science and Technology, 36, 2422–2428, 2002a.Choi, M. Y. and Chan, C. K.: Continuous Measurements of the Water Activities of Aqueous
Droplets of Water-Soluble Organic Compounds, J. Phys. Chem. A, 106, 4566–4572, 2002b.Chow, J. C., Watson, J. G., Pritchett, L. C., Person, W. R., Frazier, C. A., and Purcell, R.
application in the US air quality studies, Atmos. Envir., 27A, 1185–1201, 1993.Chow, J. C., Watson, J. G., Lu, Z., Lowenthal, D. H., Frazier, C. A., Solomon, P. A., Thuillier, R.
H., and Magliano, K.: Descriptive analysis of PM2.5 and PM10 at regionally representativelocations during SJVAQS/AUSPEX, Atmos. Envir., 30, 2079–2112, 1996.
Chuang, C. C. and Penner, J. E.: Effects of anthropogenic sulfate on cloud drop nucleation and10
optical properties, Tellus B, 47, 566–577, 1995.Chuang, P. Y.: Measurement of the Timescale of Hygroscopic Growth for Atmospheric
Aerosols, J. Geophys. Res., 108 (D9), 4282, doi:10.1029/2002JD002757, 2003.Chughtai, A. R., Williams, G. R., Atteya, M. M. O., Miller, N. J., and Smith, D. M.: Carbonaceous
Chung, S. H. and Seinfeld, J. H.: Global distribution and climate forcing of carbonaceousaerosols, J. Geophys. Res., 107 (D19), 4407, doi:10.1029/2001JD001397, 2002.
Claeys, M., Graham, B., Vas, G., Wang, W., Vermeylen, R., Pashynska, V., Cafmeyer, J.,Guyon, P., Andreae, M. O., Artaxo, P., and Maenhaut, W.: Formation of Secondary Organi-cAerosols Through Photooxidation of Isoprene, Science, 303, 1173–1176, 2004.20
Clegg, S. L., Seinfeld, J. H., and Brimblecombe, P.: Thermodynamic modelling of aqueousaerosols containing electrolytes and dissolved organic compound, J. Aerosol Sci., 32, 713–738, 2001.
Cocker, D. R., Clegg, S. L., Flagan, R. C., and Seinfeld, J. H.: The effect of water on gas-particlepartitioning of secondary organic aerosol, I: alpha-pinene/ozone system, Atmos. Envir., 35,25
6049–6072, 2001a.Cocker, D. R., Mader, B. T., Kalberer, M., Flagan, R. C., and Seinfeld, J. H.: The effect
of water on gas-particle partitioning of secondary organic aerosol, II. m-xylene and 1,3,5-trimethylbenzene photooxidation systems, Atmos. Envir., 35, 6073–6085, 2001b.
Cocker III, D. R., Withlock, N. E., Flagan, R. C., and Seinfeld, J. H.: Hygroscopic properties of30
Pasadena, California aerosol, Aerosol Sci. Technol., 35, 637–647, 2001.Cohard, J., Pinty, J., and Bedos, C.: Extending Twomey’s analytical estimate of nucleated cloud
droplet concentrations from CCN spectra, J. Atmos. Sci., 55, 3348–3357, 1998.
Cohard, J., Pinty, J., and Suhre, K.: On the parameterisation of activation spectra from cloudcondensation nuclei microphysical properties, J. Geophys. Res., 105, 11 753–11 766, 2000.
Conant, W. C., Nenes, A., and Seinfeld, J. H.: Black carbon radiative heating effects on cloudmicrophysics and implications for aerosol indirect forcing, 1, Extended Kohler theory, J. Geo-phys. Res., 107 (D21), 4604, doi:10.1029/2002JD002094, 2002.5
Cooke, W. F. and Wilson, J. J. N.: A global black carbon aerosol model, J. Geophys. Res., 101,19 395–19 409, 1996.
Cooke, W. F., Liousse, C., Cachier H., and Feichter, J.: Construction of a 1◦×1◦ fossil fuelemission data set for carbonaceous aerosol and implementation and radiative impact in theECHAM4 model, J. Geophys. Res., 104, 22 137–22 162, 1999.10
Countess, R. J.: Interlaboratory analyses of carbonaceous aerosol samples, Aerosol Sci. Tech-nol., 12, 114–121, 1990.
Cruz, C. N. and Pandis, S. N.: A study of the ability of pure secondary organic aerosol to actas cloud condensation nuclei, Atmos. Envir., 31 (15), 2205–2214, 1997.
Cruz, C. N. and Pandis, S. N.: Deliquescence and hygroscopic growth of mixed inorganic-15
organic atmospheric aerosol, Env. Sci. Tech., 34, 4313–4319, 2000.de Almeida Azevedo, D., Yara Moreira dos Santos, C., and Radler de Aquino Neto, F.: Identifi-
cation and seasonal variation of atmospheric organic pollutants in Campos dos Goytacazes,Brazil, Atmos. Envir., 36, 14, 2383–2395, 2002.
Decesari, S., Facchini, M. C., Fuzzi, S., and Tagliavini, E.: Characterization of water-soluble20
organic compounds in atmospheric aerosol: A new approach, J. Geophys. Res., 105, 1481–1489, 2000.
Decesari, S., Facchini, M. C., Matta, E., Lettini, F., Mircea, M., Fuzzi, S., Tagliavini, E., andPutaud, J. P.: Chemical features and seasonal trend of water soluble organic compounds inthe Po valley fine aerosol, Atmos. Envir., 35, 3691–3699, 2001.25
Decesari, S., Facchini, M. C., Mircea, M., Cavalli, F., and Fuzzi, S.: Solubility properties ofsurfactants in atmospheric aerosol and cloud/fog water samples, J. Geophys. Res., 108,(D21) 4685, doi:10.1029/2003JD003566, 2003.
De Lorenzi, L., Fermeglia, M., and Torriano, G.: Density, Refractive Index, and Kinematic Vis-cosity of Diesters and Triesters, J. Chem. En. D., 42(5), 919–923, 1997.30
DeMott, P. J, Meyers, M. P., and Cotton, W. R.: Parameterisation and impact of ice initiationprocesses relevant to numerical model simulations of cirrus clouds, J. Atmos. Sci., 51, 77–90, 1994.
DeMott, P. J., Rogers, D. C., and Kreidenweis, S. M.: The susceptibility of ice formation in uppertropospheric clouds to insoluble aerosol components, J. Geophys. Res., 102, 19 575–19 584,1997.
Derwent, R. G., Collins, W. J., Jenkin, M. E., Johnson, C. E., and Stevenson, D. S.: The globaldistribution of secondary particulate matter in a 3-D Lagrangian chemistry transport model,5
J. Atmos. Chem., 44, 57–95, 2003.Dick, W. D., Saxena, P., and McMurry, P. H.: Estimation of water uptake by organic compounds
in submicron aerosols measured during the Southeastern Aerosol and Visibility Study, J.Geophys. Res., 105, 1471–1479, 2000.
Docherty, K. S. and Ziemann, P. J.: Effects of Stabilized Criegee Intermediate and OH Rad-10
ical Scavengers on Aerosol Formation from Reactions of β-Pinene with O3, J. Aeros. Sci.Technol., 37, 877–891, 2003.
Eatough, D. J., Sedar, B., Lewis, L., Hansen, L. D., Lewis, E. A., and Farber, R. J.: Determina-tion of semivolatile organic compounds in particles in the Grand Canyon area, Aerosol Sci.Technol., 10, 438–449, 1989.15
Eatough, D. J., Wadworth, A., Eatough, D. A., Crawford, J. W., Hansen, L. D., and Lewis, A.D.: A multi-system, multi-channel diffusion denuder sampler for the determination of fine-particulate organic material in the atmosphere, Atmos. Envir., 27A, 1213–1219, 1993.
Eatough, D. J., Eatough, D. A., Lewis, L., and Lewis, A. D.: Fine particulate chemical com-position and light extinction at Canyonlands National Park, J. Geophys. Res., 101, 19 515–20
19 531, 1996.Eatough, D. J., Eatough, N. L., Obeidi, F., Pang, Y., Modey, W., and Long, R.: Continuous
determination of PM2.5 mass, including semi-volatile species, Aerosol Sci. Technol., 34,1–8, 2001.
Edney, E. O., Driscoll, D. J., Speer, R. E., Weathers, W. S., Kleindienst, T. E., Li, W., and25
Smith, D. F.: Impact of aerosol liquid water on secondary organic aerosol yields of irraddiatedtoluene/propylene/NOx/(NH4)2SO4/air mixtures, Atmos. Envir., 34, 3907–3919, 2000.
Eliason, T. L., Aloisio, S., Donaldson, D. J., Cziczo, D. J., and Vaida, V.: Processing of unsatu-rated organic acid films and aerosols by ozone, Atmos. Envir., 37, 2207–2219, 2003.
Eliason, T. L., Gilman, J. B., and Vaida, V.: Oxidation of organic films relevant to atmospheric30
aerosols, Atmos. Envir., 38, 1367–1378, 2004.El-Kashef, H.: Measurement of the physical properties of cyclohexane using a laser interfero-
metric technique, II, Optical Materials (Amsterdam), 10 (4), 305–312, 1998.
EMEP: Review and Revision, Emission Data reported to CLTRAP, edited by Vestreng, V.,EMEP/MSC-W Note 1/2003, 2003.
Ervens, B., George, C., Williams, J. E., Buxton, G. V., Salmon, G. A., Bydder, M., Wilkinson, F.,Dentener, F., Mirabel, P., Wolke, R., and Herrmann, H.: CAPRAM2.4 (MODAC mechanism):An extended and condensed tropospheric aqueous phase mechanism and its application, J.5
Geophys. Res., 108, D14, 4426, doi:10.1029/2002JD002202, 2003.Ervens, B., Feingold, G., Frost, G. J., and Kreidenweis, S. M.: A modelling study of aqueous
production of dicarboxylic acids, Part 1: Chemical pathways and organic mass production,J. Geophys. Res., 109, D15205, doi:10.1029/2003JD004387, 2004a.
Ervens, B., Feingold, G., Clegg, S. L., and Kreidenweis, S. M.: A modelling study of aqueous10
production of dicarboxylic acids, Part 2: Impact on cloud microphysics, J. Geophys. Res.,109, D15206, doi:10.1029/2003JD004575, 2004b.
Facchini, M. C., Fuzzi, S., Zappoli, S., Andracchio, A., Gelencser, A., Kiss, G., Krivacsy, Z.,Meszaros, E., Hansson, H. C., Alsberg, T., and Zebuhr, Y.: Partitioning of the organic aerosolcomponent between fog droplets and interstitial aerosol, J. Geophys. Res., 104, 26 821–15
26 832, 1999a.Facchini, M. C., Mircea, M., Fuzzi, S., and Charlson, R. J.: Cloud albedo enhancement by
surface-active organic solutes in growing droplets, Nature, 401, 257–259, 1999b.Facchini, M. C., Decesari, S., Mircea, M., Fuzzi, S., and Loglio, G.: Surface tension of atmo-
spheric wet aerosol and cloud/fog droplets in relation to their organic carbon content and20
chemical composition, Atmos. Envir., 33, 4853–4857, 2000.Fan, X., Brook, J. R., and Mabury, S. A.: Sampling atmospheric carbonaceous aerosols using
an integrated gas and particle sampler, Environ. Sci. Technol., 37, 3145–3151, 2003.Fassi-Fihri, A., Suhre, K., and Rosset, R.: Internal and external mixing in atmospheric aerosols
by coagulation: impact on the optical and hygroscopic properties of the sulphate-soot sys-25
tem, Atmos. Envir., 10, 1393–1402, 1997.Feingold, G.: Modelling of the first indirect effect: Analysis of measurement requirements,
Geophys. Res. Lett., 30 (19), doi:10.1029/2003GL017967, 2003.Feingold, G. and Chuang, P. Y.: Analysis of the infuence of film-forming compounds on droplet
growth: Implications for cloud microphysical processes and climate, J. Atmos. Sci., 59, 2006–30
2018, 2002.Feingold, G. and Heymsfield, A.: Parameterisations of condensational growth of droplets for
use in general circulation models, J. Atmos. Sci., 49, 2325–2342, 1992.
Feingold, G. and Kreidenweis, S. M.: Does cloud processing of aerosol enhance droplet con-centrations?, J. Geophys. Res., 105, D19, 24 351–24 361, 2000.
Fitz, D. R.: Reduction of positive organic artifact on quartz filters, Aerosol Sci. Technol., 12,142–148, 1990.
Flossmann, A., Hall, W., and Pruppacher, H.: A theoretical study of the wet removal of atmo-5
spheric pollutants: Part I: The redistribution of aerosol particles capture through nucleationand impaction scavenging by growing cloud drops, J. Atmos. Sci., 42, 583–606, 1985.
Forstner, H. J. L., Seinfeld, J. H., and Flagan, R. C.: Secondary organic aerosol formation fromthe photooxidation of aromatic hydrocarbons, Molecular composition, Environ. Sci. Technol.,31, 1345–1358, 1997a.10
Forstner, H. J. L., Seinfeld, J. H., and Flagan, R. C.: Molecular speciation of secondary organicaerosol from the higher alkenes: 1-Octene and 1-decene, Atmos. Envir., 31, 1953–1964,1997b.
Fredeslund, A. and Sorensen, J. M.: Model for Thermodynamic and Phase Equilibrium Calcu-lations, edited by Sandler, S. I., Marcel Dekker, N.Y., chapter 4, 287–361, 1994.15
Fuchs, N. A.: The Mechanics of Aerosols, Pergamon Press, Oxford, 1964.Fuzzi, S., Decesari, S., Facchini, M. C., Matta, E., Mircea, M., and Tagliavini, E.: A simplified
model of the water soluble organic component of atmospheric aerosols, Geophys. Res. Lett.,28, 4079–4082, 2001.
Fuzzi, S., Facchini, M. C., Decesari, S., Matta, E., and Mircea, M.: Soluble organic compounds20
in fog and cloud droplets: what have we learned over the past few years?, Atmos. Res., 64(1–4), 89–98, 2002.
Gaman, A. I., Kulmala, M., Vehkamaki, H., Napari, I., Mircea, M., Facchini, M. C., and Laak-sonen, A.: Binary homogeneous nucleation in water-succinic acid and water-glutaric acidsystems, J. Chem. Phys., 120, 282–291, 2004.25
Gao, S., Hegg, D. A., Frick, G., Caffrey, P. F., Pasternack, L., Cantrell, C., Sullivan, W., Am-brusko, J., Albrechcinski, T., and Kirchstetter, T. W.: Experimental and modelling studies ofsecondary organic aerosol formation and some applications to the marine boundary layer, J.Geophys. Res., 106, 27 619–27 634, 2001.
Gao, S., Ng, N. L., Keywood, M., Varutbangkul, V., Bahreini, R., Chung, S. H., Nenes, A., He,30
J., Yoo, K. Y., Beauchamp, J. L., Hodyss, R. P., Flagan, R. C., and Seinfeld, J. H.: ParticlePhase Acidity and Oligomer Formation in Secondary Organic Aerosol, Environ. Sci. Technol.,in press, 2004.
Gaydos, T., Stanier, C. O., and Pandis, S. N.: Modelling new particle formation events duringthe Pittsburgh Air Quality Study, J. Geophys. Res., in press, 2004.
Gelbard, F. and Seinfeld, J. H.: Simulation of multicomponent aerosol dynamics, J. Coll. I. Sc.,78, 485–501, 1980.
Gelencser, A., Hoffer, A., Kiss, G., Tombasz, E., Kurdi, R., and Bencze, L.: In-situ formation of5
Light-Absorbing Organic Matter in Cloud Water, J. Atmos. Chem., 45, 25–33, 2003.Geron, C., Rasmussen, R., Arnts, R. R., and Guenther, A.: A review and synthesis of monoter-
pene speciation from forests in the United States, Atmos. Envir. 34, 1761–1781, 2000.Ghan, S., Chuang, C., and Penner, J.: A parameterisation of cloud droplet nucleation, Part I:
Single aerosol species, Atmos. Res., 30, 197–222, 1993.10
Ghan, S., Chuang, C., Easter, R., and Penner, J.: A parameterisation of cloud droplet nucle-ation, 2. Multiple aerosol types, Atmos. Res., 36, 39–54, 1995.
Ghan, S., Leung, L., Easter, R., and Abdul-Razzak, H.: Prediction of cloud droplet number in ageneral circulation model, J. Geophys. Res., 102, 21 777–21 794, 1997.
Glasius, M., Calogirou, A., Jensen, N. R., Hjorth, J., and Nielsen, C. J.: Kinetic study of gas-15
phase reactions of pinonaldehyde and structurally related compounds, Int. J. Chem. Kinet.,29, 523–533, 1997.
Glasius, M., Lahaniati, M., Calogirou, A., Di Bella, D., Jensen, N. R., Hjorth, J., Kotzias, D., andLarsen, B. R.: Carboxylic acids in secondary aerosols from the oxidation of cyclic monoter-penes by ozone, Environ. Sci. Technol., 34, 1001–1010, 2000.20
Gmehling, J., Onken, U., Arlt, W., Gronzheuser, P., Weldlich, U., Kolbe, B., and Rarey, J.:DECHEMA Chemistry Data Series, Volume 1. Vapor-liquid Equilibrium Data Collection;DECHEMA (Deutsche Gesellschaft fur Chemisches Apparatewesen, Chemische Technikund Biotechnologie e.V.), Frankfurt, Germany, 1994.
Gomez-Diaz, D., Mejuto, J. C., and Navaza, J. M.: Physicochemical Properties of Liquid Mix-25
tures, 1. Viscosity, Density, Surface Tension and Refractive Index of Cyclohexane + 2,2,4-Trimethylpentane Binary Liquid Systems from 25 DegC to 50 DegC, J. Chem. En. D., 46 (3),720–724, 2001.
Graedel, T. E. and Weschler, C. J.: Chemistry Within Aqueous Atmospheric Aerosols andRaindrops, Rev. Geophys. Space Phys., 19, 505–539, 1981.30
Griffin, R. J., Cocker III, D. R., and Seinfeld, J. H.: Incremental Aerosol Reactivity: Applicationto Aromatic and Biogenic Hydrocarbons, Environ. Sci. Technol., 33, 2403–2408, 1999a.
Griffin R. J., Dabdub, D., and Seinfeld, J. H.: Estimate of global atmospheric organic aerosol
from oxidation of biogenic hydrocarbons, Geophys. Res. Lett., 26, 2721–2724, 1999b.Griffin, R. J., Dabdub, D., and Seinfeld, J. H.: Secondary organic aerosol: I. Atmospheric
chemical mechanism for production of molecular constituents, J. Geophys. Res., 107 (D17),4332, doi:10.1029/2001JD000541, 2002a.
Griffin, R. J., Dabdub, D., Kleeman, M. J., Fraser, M. P., Cass, G. R., and Seinfeld, J. H.: Sec-5
ondary organic aerosol: III. Urban/Regional scale model of size- and composition-resolvedaerosols, J. Geophys. Res., 107 (D17), 4334, doi:10.1029/2001JD000544, 2002b.
Griffin, R. J., Nguyen, K., Dabdub, D., and Seinfeld, J. H.: A coupled hydrophobic-hydrophilicmodel for predicting secondary organic aerosol formation, J. Atmos. Chem., 44, 171–190,2003.10
Groblicki, P. J., Cadle, S. H., Hang, C. C., and Mulawa, P. A.: Interlaboratory comparison ofmethods for the analysis of organic and elemental carbon in atmospheric particulate matter,General Motors Research 4054, General Motors Research Laboratories, Warren, MI, 1983.
Gross, A. and Stockwell, W. R.: Comparison of the EMEP, RADM2 and RACM mechanisms, J.Atmos. Chem., 44, 151–170, 2003.15
Guenther, A.: Modelling biogenic volatile organic compounds emissions to the atmosphere,edited by Hewitt, C. N., Reactive hydrocarbons in the Atmosphere, Academic Press, SanDiego, CA, 97–118, 1999.
Guenther, A., Zimmerman, P., and Wildermuth, M.: Natural volatile organic compound emissionrate estimates for US woodland landscapes, Atmos. Envir. 28, 1197–1210, 1994.20
Guenther, A., Hewitt, C. N., Erickson, D., Fall, R., Geron, C., Graedel, T., Harley, P., Klinger, L.,Lerdau, M., McKay, W. A., Pierce, T., Scholes, B., Steinbrecher, R., Tallamraju, R., Taylor,J., and Zimmerman, P.: A Global Model of Natural Volatile Organic Compound Emissions, J.Geophys. Res., 100, 8873–8892, 1995.
Guenther, A., Archer, S., Greenberg, J., Harley, P., Helmig, D., Klinger, L., Vierling, L., Wil-25
dermuth, M., Zimmerman, P., and Zitzer, S.: Biogenic hydrocarbon emissions and land-cover/climate change in a subtropical savannah, J. Phys. Chem. Earth, 24, 659–667, 1999.
Guenther, A., Geron, C., Pierce, T., Lamb, B., Harley, P., and Fall, R.: Natural emissions of non-methane volatile organic compounds, carbon monoxide, and oxides of nitrogen from NorthAmerica, Atmos. Envir., 34, 2205–2230, 2000.30
Gultepe, I. and Isaac, G.: The relationship between cloud droplet and aerosol number concen-trations for climate models, Int. J. Climatol., 16, 941–946, 1996.
Gysel, M., Weingartner, E., Nyeki, S., Paulsen, D., Baltensperger, U., Galambos, I., and Kiss,
G.: Hygroscopic properties of water-soluble matter and humic-like organics in atmosphericfine aerosol, Atmos. Chem. Phys., 4, 35–50, 2004.
Hameri, K., Vakeva, M., Aalto, P. P., Kulmala, M., Swietlivki, E., Zhou, J., Seidl, W., Becker, E.,and O’Dowd, C. D.: Hygroscopic and CCN properties of aerosol particles in boreal forest,Tellus, 53B, 359–379, 2001.5
Hameri, K., Charlson, R., and Hansson, H.-C.: Hygroscopic properties of mixed ammoniumsulfate and carboxylic acids particles, American Institute of Chemical Engineers Journal, 48,1309–1316, 2002.
Hakola, H., Arey, J., Aschmann, S. M., and Atkinson, R.: Product formation from the gas phasereactions of OH radicals and O3 with a series of monoterpenes, J. Atmos. Chem., 18, 75–10
102, 1994.Hallberg, A., Ogren, J. A., Noon, K. J., and Heintzenberg, J.: Phase partioning for different
aerosol species in fog, Tellus, 44B, 545–555, 1992.Hallberg, A., Ogren, J. A., Noon, K. J., Okada, K., Heintzenberg, J., and Svenningsson, I. B.:
The influence of aerosol particle composition on cloud droplet formation, J. Atmos. Chem.,15
153–171, 1994a.Hallberg, A., Noon, K. J., Ogren, J. A., Svenningsson, I. B., Flossmann, A., Wiedensohler, A.,
Hannson, H.-C., Heintzenberg, J., Anderson, T. L., Ardens, B. G., and Maser, R.: Phasepartitioning of aerosol particles in clouds at Kleiner Feldberg, J. Atmos. Chem., 107–1271,1994b.20
Hallquist, M., Wangberg, I., and Ljungstrom, E.: Atmospheric fate of carbonyl oxidation prod-ucts originating from a-pinene and d3-carene: Determination of rate of reaction with OH andNO3 radicals, UV adsorption cross section and vapor pressures, Environ. Sci. Technol., 31,3166–3172, 1997.
Hansen, J., Sato, M., and Ruedy, R.: Radiative forcing and climate response, J. Geophys. Res.,25
102, 6831–6864, 1997.Hansen, J., Sato, M., Lacis, A., Ruedy, R., Tegen, I., and Matthews, E.: Climate forcings in the
Industrial Era, Proc. Natl. Acad. Sci., 95, 12 753–12 758, 1998.Hansson, H. C., Rood, M. J., Koloutsou-Vakakis, S., Hameri, K., Orsini, D., and Wiedensohler,
A.: NaCl aerosol particle hygroscopicity dependence on mixing with organic compounds, J.30
Atmos. Chem., 31, 321–346, 1998.Hatakeyama, S., Katsuyuki, I., Fukuyama, T., and Akimoto, H.: Reactions of ozone with a-
pinene and b-pinene in air: Yields of gaseous and particulate products, J. Geophys. Res.,
94, 13 013–13 024, 1989.Haywood, J. M. and Shine, K. P.: The effect of anthropogenic sulfate and soot aerosol on the
clear sky planetary radiation budget, Geophys. Res. Lett., 22 (5), 603–606, 1995.Hegg, D. A.: The impact of clouds on aerosol populations, IGAC Newsletter, 23, 2001.Hegg, D. A., Rutledge, S. A., Hobbs, P. V., Barth, M. C., and Hertzman, O.: The chemistry of a5
mesoscale rainband, Q. J. R. Meteorol. Soc., 115, 867–886, 1989.Hegg, D. A., Majeed, R., Yuen, P. F., Baker, M. B., and Larson, T. V.: The impact of SO2
oxidation in cloud droplets and in haze particles on aerosol light scattering and CCN activity,Geophys. Res. Lett., 23, 2613–2626, 1996.
Hering, S., Appel, D. R., Cheng., W., Salaymeh, F., Cadle, S. H., Mulawa, A., Cahill, T. A.,10
Eldred, R. A., Surovik, M., Fitz, D., Howes, J. E., Knapp, K. T., Stockburger, L., Turpin, B.J., Huntzicker, J. J., Zhang, X. Q., and McMurry, P. H.: Comparison of sampling methods forcarbonaceous aerosol in ambient air, Aerosol Sci. Technol., 12, 200–213, 1990.
Herrmann, H.: Kinetics of Aqueous Phase Reactions Relevant for Atmospheric Chemistry,Chem. Rev., 103, 12, 4691–4716, 2003.15
Herrmann, H., Ervens, B., Jacobi, H.-W., Wolke, R., Nowacki, P., and Zellner, R.: CAPRAM2.3:A Chemical Aqueous Phase Radical Mechanism for Tropospheric Chemistry, J. Atmos.Chem., 36, 231–284, 2000.
Hickey, A. J. and Martonen, T. B.: Behavior of hygroscopic pharmaceutical aerosols and theinfluence of hydrophobic additivities, Pharm. Res., 10, 1–7, 1993.20
Hoffmann, T. (Ed.): Final Report of the 5th Framework Programme of the EU project OSOA (Ori-gin and Formation of Secondary Organic Aerosol), contract EVK2-CT-1999-00016, availablevia the ftp: http://www.isas-dortmund.de/2002/e/staff/hoffmann/osoa/index.html, 2001.
Hoffmann, T., Odum, J. R., Bowman, F., Collins, D., Klockow, D., Flagan, R. C., and Seinfeld, J.H.: Formation of Organic Aerosols from the Oxidation of Biogenic Hydrocarbons, J. Atmos.25
Chem., 26, 189–222, 1997.Hoffmann, T., Bandur, R., Marggraf, U., and Linscheid, M.: Molecular composition of organic
aerosols formed in the a-pinene/O3 reaction: implications for new particle formation pro-cesses, J. Geophys. Res., 103, 25 569–25 578, 1998.
Hoppel, W., Fitzgerald, J., Frick, G., Caffrey, P., Pasternack, L., Hegg, D., Leaitch, R., Shantz,30
N., Cantrell, C., Albrechcinski, T., Ambrusko, J., and Sullivan, W.: Particle formation andgrowth from ozonolysis of α-pinene, J. Geophys. Res., 106, 27 603–27 618, 2001.
Hori, M., Ohta, S., Murao, N., and Yamagata, S.: Activation capability of water soluble organic
substances as CCN, J. Aeros. Sci., 34 (4), 419–448, 2003.Iinuma, Y., Boge, O., Gnauk, T., and Hermann, H.: Aerosol-chamber study of the a-pinene/O3
reaction: influence of particle acidityon aerosol yields and products, Atmos. Envir., 38, 761–773, 2004.
Intergovernmental Panel on Climate Change (IPCC): Climate Change: The Scientific Basis,5
Cambridge University Press, UK, 2001.Jacob, D. and Wofsy, S.: Photochemistry of biogenic emissions over the Amazon forest, J.
Geophys. Res., 93, 1477–1486, 1988.Jacobson, M. Z.: Isolating nitrated and aromatic aerosols and nitrated aromatic gases as
sources of ultraviolet light absorption, J. Geophys. Res., 104, 3527–3542, 1999.10
Jacobson, M. Z.: Strong radiative heating due to the mixing state of black carbon in atmosphericaerosols, Nature, 409, 695–697, 2001a.
Jacobson, M. Z.: Global direct radiative forcing due to multicomponent anthropogenic andnatural aerosols, J. Geophys. Res., 106, 1551–1568, 2001b.
Jacobson, M. C., Hansson, H. C., Noone, K. J., and Charlson, R. J.: Organic atmospheric15
aerosols: Review and state of the science, Rev. Geophys., 38, 267–294, 2000.Jang, M. and Kamens, R. M.: A thermodynamic approach for modelling partitioning of
Jang, M. and Kamens, R. M.: Newly characterized products and composition of secondary20
aerosols from reaction of a-pinene with ozone, Atmos. Envir., 33, 459–474, 1999.Jang, M. and Kamens, R. M.: Atmospheric secondary aerosol formation by heterogeneous
reactions of aldehydes in the presence of a sulfuric acid aerosol catalyst, Environ. Sci. Tech-nol., 35, 4758–4766, 2001.
Jang, M., Czoschke, N. M., Lee, S., and Kamens, R. M.: Heterogeneous atmospheric aerosol25
production by acid-catalyzed particle-phase reactions, Science, 298, 814–817, 2002.Jang, M., Carroll, B., Chandramouli, B., and Kamens, R. M.: Particle growth by acid-catalyzed
heterogeneous reactions of organic carbonyls on preexisting aerosols, Environ. Sci. Tech-nol., 37, 3828–3837, 2003.
Janson, R., Rosman, K., Karlsson, A., and Hansson, H. C.: Biogenic emissions and gaseous30
precursors to forest aerosols, Tellus B, 53, 423–440, 2001.Jaoui, M. and Kamens, R. M.: Mass balance of gaseous and particulate products analysis
from a-pinene/NOx/air in the presence of natural sunlight, J. Geophys. Res.-A, 106, 12 541–
12 558, 2001.Jaoui, M. and Kamens, R. M.: Photolysis study of gas phase pinonaldehyde in the presence of
natural sunlight, Atmos. Envir., 37, 1835–1851, 2003a.Jaoui, M. and Kamens, R. M.: Mass balance of gaseous and particulate products from b-
pinene/O3/air in the absence of light and b-pinene/NOx/air in the presence of natural sunlight,5
J. Atmos. Chem., 43, 101–141, 2003b.Jaoui, M. and Kamens, R. M.: Gaseous and Particulate Oxidation Products Analysis of a Mix-
ture of α-pinene + β-pinene/O3/Air in the Absence of Light and α-pinene + β-pinene/NOx/Airin the Presence of Natural Sunlight, J. Atmos. Chem., 44, 259–297, 2003c.
Jenkin, M. E.: Modelling the formation and composition of secondary organic aerosol from10
α- and β-pinene ozonolysis using MCM v3, Atmos. Chem. Phys. Discuss., 4, 2905–2948,2004.
Jenkin, M. E., Saunders, S. M., and Pilling, M. J.: The tropospheric degradation of volatileorganic compounds: a protocol for mechanism development, Atmos. Envir., 31, 81–104,1997.15
Jenkin, M. E., Shallcross, D. E., and Harvey, J. N.: Development and application of a possiblemechanism for the generation of cis-pinic acid from the ozonolysis of a- and b-pinene, Atmos.Envir., 34, 2837–2837, 2000.
Jensen, J. and Charlson, R.: On the efficiency of nucleation scavenging, Tellus B, 36, 367–375,1984.20
Jensen, E. J. and Toon, O. B.: The potential effects of volcanic aerosols on cirrus cloud micro-physics, Geophys. Res. Lett., 19, 1759–1762, 1992.
Kalberer, M., Paulsen, D., Sax, M., Steinbacher, M., Dommen, J., Prevot, A. S. H, Fisseha, R.,Weingartner, E., Frankevich, V., Zenobi, R., and Baltensperger, U.: Identification of Polymersas Major Components of Atmospheric Organic Aerosols, Science, 303, 1659–1662, 2004.25
Kamens, R. M. and Jaoui, M.: Modelling aerosol formation from a-pinene + NOx in the pres-ence of natural sunlight using gas-phase kinetics and gas-particle partitioning theory, Envi-ron. Sci. Technol., 35, 1394–1405, 2001.
Kamens, R. M., Jang, M., Chien, C. J., and Leach, K.: Aerosol formation from the reactionof α-pinene and ozone using a gas-phase kinetics-aerosol partitioning model, Environ. Sci.30
Technol., 33, 1430–1438, 1999.Kanakidou, M., Tsigaridis, K., Dentener, F. J., and Crutzen, P. J.: Human-activity-enhanced
formation of organic aerosols by biogenic hydrocarbon oxidation, J. Geophys. Res., 105,
9243–9254, 2000.Kavouras, I. G. and Stephanou, E. G.: Direct evidence of atmospheric secondary organic
formation in forest atmosphere through heteromolecular nucleation, Environ. Sci. Technol.,36, 5083–5091, 2002.
Kavouras, I. G., Mihalopoulos, N., and Stephanou, E. G.: Formation of atmospheric particles5
from organic acids produced by forests, Nature, 395, 683–686, 1998.Kavouras, I. G., Mihalopoulos, N., and Stephanou, E. G.: Secondary organic aerosol formation
vs primary organic aerosol emission: In situ evidence for the chemical coupling betweenmonoterpene acidic photooxidation products and new particle formation over forests, Envi-ron. Sci. Technol., 33, 1028–1037, 1999.10
Kavouras, I. G., Lawrence, J., Koutrakis, P., Stephanou, E. G., and Oyola, P.: Measurementof particulate aliphatic and polynuclear aromatic hydrocarbons in Santiago de Chile: sourcereconciliation and evaluation of sampling artifacts, Atmos. Envir., 33, 4977–4986, 1999.
Kawamura, K. and Sakaguchi, F.: Molecular distributions of water soluble dicarboxylic acids inmarine aerosols over the Pacific Ocean including tropics, J. Geophys. Res., 104, D3, 3501–15
3509, 1999.Kerminen, V. M.: The effect of particle chemical character and atmospheric processes on par-
ticle hygroscopic properties, J. Aerosol Sci., 28, 121–132, 1997.Khlystov, A., Stanier, C. O., and Pandis, S. N.: Water content of ambient aerosol during the
Pittsburgh Air Quality Study, J. Geophys. Res., in press, 2004.20
Kiehl, J. T., Schneider, T. L., Rasch, P. J., Barth, M. C., and Wong, J.: Radiative forcing due tosulfate aerosols from simulations with the National Center for Atmospheric Research Com-munity Climate Model, Version 3, J. Geophys. Res., 105, 1441–1457, 2000.
Kim, Y. P., Moon, K.-C, and Lee, J. H.: Organic and elemental carbon in fine particles at Kosan,Korea, Atmos. Environ., 34, 3309–3317, 2000.25
Kirchstetter, T. W., Corrigan, C. E., and Novakov, T.: Laboratory and field investigation of theadsorption of gaseous organic compounds onto quartz filters, Atmos. Environ., 35, 1663–1671, 2001.
Kiss, G., Varga, B., Gelencser, A., Krivanscy, Z., Molnar, A., Alsberg, T., Persson, I., Hansson,H. C., and Facchini, M. C.: Characterization of polar organic compounds in fog water, Atmos.30
Environ., 35, 2193–2200, 2001.Kleindienst, T. E., Smith, D. F., Li, W., Edney, E. O., Driscoll, D. J., Speer, R. E., and Weathers,
W. S.: Secondary organic aerosol formation from the oxidation of aromatic hydrocarbons in
the presence of dry submicron ammonium sulfate aerosol, Atmos. Envir., 33, 3669–3681,1999.
Kleindienst, T. E., Corse, E. W., Li, W., McIver C. D., Conver, T. S., Edney, E. O., Driscoll, D. J.,Speer, R. E., Weathers, W. S., and Tejada, S. B.: Secondary organic aerosol formation fromthe irradiation of simulated automobile exhaust, JAWMA, 52, 259–272, 2002.5
Koch, D.: The transport and direct radiative forcing of carbonaceous and sulfate aerosols in theGISS GCM, J. Geophys. Res., 106, 20 311–20 332, 2001.
Koch, S., Winterhalter, R., Kolloff, A., Neeb, P., and Moortgat, G. K.: Organic aerosol forma-tion processes in the photooxidation of VOCs, Contribution to the EUROTRAC-2, ChemicalMechanism Development (CMD) Subproject Annual Report, 1998, pp 189-192. Published by10
Koch, S., Winterhalter, R., Uherek, E., Kolloff, A., Neeb, P., and Moortgat, G. K.: Formation ofnew particles in the gas-phase ozonolysis of monoterpenes, Atmos. Envir., 34, 4031–4042,2000.15
Kohler, H.: The nucleus in the growth of hygroscopic droplets, Trans. Faraday Soc., 32, 1152–1161, 1936.
Koo, B. Y., Ansari, A. S., and Pandis, S. N.: Integrated approaches to modelling the organicand inorganic atmospheric aerosol components, Atmos. Envir., 37, 4757–4768, 2003a.
Koo, B., Gaydos, T. M., and Pandis, S. N.: Evaluation of the equilibrium, dynamic, and hybrid20
aerosol modelling approaches, Aerosol Sci. Technol., 37, 53–64, 2003b.Kotzick, R. and Niessner, R.: The effects of aging processes on critical supersaturation ratios
of ultrafine carbon aerosols, Atmos. Envir., 33, 2669–2677, 1999.Kulmala, M.: How Particles Nucleate and Grow, Science, 302, 1000–1001, 2003.Kulmala, M., Hameri, K., Aalto, P. P., Makela J. M., Pirjola, L., Nilsson, E. D., Buzorius, G.,25
Rannik, U., Dal Maso, M., Seidl, W., Hoffman, T., Janson, R., Hansson, H. C., Viisanen, Y.,Laaksonen, A., and O’Dowd, C. D.: Overview of the international project on biogenic aerosolformation in the boreal forest (BIOFOR), Tellus B, 53, 324–343, 2001.
Kulmala, M., Vehkamaki, H., Petaja, T., Dal Maso, M., Lauria, A., Kerminen, V.-M., Birmili, W.,and McMurry, P. H.: Formation and growth rates of ultrafine atmospheric particles: a review30
of observations, J. Aeros. Sci., 35, 143–176, 2004a.Kulmala, M., Kerminen, V.-M., Anttila, T., Laaksonen, A., and O’Dowd, C. D.: Or-
ganic aerosol formation via sulphate cluster activation, J. Geophys. Res., 109, D04205,
doi:10.1029/2003JD003961, 2004b.Laaksonen, A., Korhonen, P., Kulmala, M., and Charlson, R.: Modification of the Kohler equa-
tion to include soluble trace gases and slightly soluble substances, J. Aerosol Sci., 155,853–862, 1998.
Lack, D. A., Tie, X. X., Bofinger, N. D., Wiegand, A. N., and Madronich, S.: Seasonal variability5
of secondary organic aerosol: A global modelling study, J. Geophys. Res., 109, D03203doi:10.1029/2003JD003418, 2004.
Larsen, B. R., Di Bella, D., Glasius, M., Winterhalter, R., Jensen, N. R., and Hjorth, J.: Gas-phase OH oxidation of monoterpenes: Gaseous and particulate products, J. Atmos. Chem.,38, 231–276, 2001.10
Lee, S., Murphy, D. M., Thomson, D. S., and Middlebrook, A. M.: Chemical components of sin-gle particles measured with Particle Analysis by Laser Mass Spectrometry (PALMS) duringthe Atlanta Super Site Project: Focus on organic/sulfate, lead, soot, and mineral particles, J.Geophys. Res., 107, D1, doi:10.1029/2000JD000011, 2002.
Lee, S., Murphy, D. M., Thomson, D. S., and Middlebrook, A. M.: Nitrate and oxidized organic15
ions in single particle mass spectra during the 1999 Atlanta Supersite Project, J. Geophys.Res., 108, D7, 8417, doi:10.1029/2001JD001455, 2003.
Lenz, R.: Final report to the Institute for Environment and Sustainability, JRC report, Ispra,2001.
Lesins, G., Chylek, P., and Lohmann, U.: A study of internal and external mixing scenarios and20
its effect on aerosol optical properties and direct radiative forcing, J. Geophys. Res.-A, 107,D10, 4094–4106, 2002.
Li, W. B., Segre, P. N., Gammon, R. W., Sengers, J. V., and Lamvik, M.: Determination ofthe temperature and concentration dependence of the refractive index of a liquid mixture, J.Chem. Phys., 101 (6), 5058–5069, 1994.25
Liao, H., Adams, P. J., Seinfeld, J. H., Mickley, L. J., and Jacob, D. J.: Interactions betweentropospheric chemistry and aerosols in a unified GCM simulation, J. Geophys. Res., 108,D1, 4001, doi:10.1029/2001JD001260, 2003.
Lightstone, J. M., Onasch, T. B., Imre, D., and Oatis, S.: Deliquescence, efflorescence, andwater activity in ammonium nitrate and mixed ammonium nitrate/succinic acid microparticles,30
J. Phys. Chem., 104, 9337–9346, 2000.Likens, G. E., Edgerton, E. S., and Galloway, G. N.: The composition and deposition of organic
carbon in precipitation, Tellus, 35B, 16–24, 1983.
Limbeck, A. and Puxbaum, H.: Dependence of in-cloud scavenging of polar organic aerosolcompounds on the water solubility, J. Geophys. Res., 105, 19 857–19 867, 2000.
Limbeck, A., Kulmala, M., and Puxbaum, H.: Secondary organic aerosol formation in the atmo-sphere via heterogeneous reaction of gaseous isoprene on acidic particles, Geophys. Res.Lett., 30 (19), 1996, doi:10.1029/2003GL017738, 2003.5
Liousse, C., Penner, J. E., Chuang, C., Walton, J. J., Eddleman, H., and Cachier, H.: A globalthree-dimensional model study of carbonaceous aerosols, J. Geophys. Res., 101, 19 411–19 432, 1996.
Liu, L., Mishchenko, M. I., Menon, S., Macke, A., and Lacis, A.: The effect of black carbon onscattering and absorption of solar radiation by cloud droplets, J. Quantitative Spectroscopy10
& Radiative Transfer, 74 (2), 195–204, 2002.Lohmann, U., Feichter, J., Chuang, C., and Pennner, J. E.: Predicting the number of cloud
droplets in the ECHAM GCM, J. Geophys. Res., 104, 9169–9198, 1999.Lowenthal, D. H., Kumar, N., Hand, J., Day, D., Kreidenweis, S., Collett, J., Lee, T., and Ash-
Mader, B. T., Flagan, R. C., and Seinfeld, J. H.: Sampling atmospheric carbonaceous aerosolusing a particle trap/denuder sampler, Environ. Sci. Technol., 35, 4857–4867, 2001.
Mader, B. T, Schauer, J. J., Seinfeld, J. H., Flagan, R. C., Yu, J. Z., Yang, H., Lim, H. J.,Turpin, B. J., Deminter, J. T., Heidemann, G., Bae, M. S., Quinn, P., Bates, T., Eatough, D.J., Huebert, B. J., Berttram, T., and Howell, S.: Sampling methods used for the collection of20
particle-phase organic and elemental carbon during ACE-Asia, Atmos. Environ., 37, 1435–1449, 2003.
Malm, W. C.: Spatial and seasonal patterns and temporal variability of haze and its constituentsin the United States, Report III, CIRES, Colorado State University, Fort Collins, Colorado,2000.25
Malm, W. C. and Day, D. E.: Estimates of aerosol species scattering characteristics as a func-tion of relative humidity, Atmos. Envir., 35, 2845–2860, 2001.
Marcolli, C., Luo, B., and Peter, T.: Mixing of the organic aerosol fractions: liquids as thethermodynamically stable phases, J. Phys. Chem. A, 108, 2216–2224, 2004.
Maria, S. F., Russell, L. M., Turpin, B. J., and Porcja, R. J.: FTIR measurements of functional30
groups and organic mass in aerosol samples over Caribbean, Atmos. Envir., 36, 5185–5196,2002.
Marsh, K. N.: International Union of Pure and Applied Chemistry: Recommended Reference
Materials for the Realization of Physicochemical Properties, in Section Optical Refraction,pp. 500, Blackwell Scientific Publications, Oxford, UK, 1987.
Marti, J. J., Weber, R. J., McMurry, P. H., Eisele, F., Tanner, D., and Jefferson, A.: New parti-cle formation at a remote continental site: Assessing the contributions of SO2 and organicprecursors, J. Geophys. Res., 102, 6331–6339, 1997.5
Massling, A., Wiedensohler, A., Busch, B., Neusuß, C., Quinn, P., Bates, T., and Covert, D.:Hygroscopic properties of different aerosol types over the Atlantic and Indian Oceans, Atmos.Chem. Phys., 3, 1377–1397, 2003.
Mayol-Bracero, O. L., Guyon, P., Graham, B., Roberts, G. C., Andreae, M. O., Decesari, S., Fac-chini, M. C., Fuzzi, S., and Artaxo, P.: Water-soluble organic compounds in biomass burning10
aerosols over Amazonia: 2. Apportionment of the chemical composition and importanceof the polyacidic fraction, J. Geophys. Res., 107 (D20), 8091, doi:10.1029/2001JD000522,2002.
Mc Dow, S. R. and Huntzicker, J. J.: Vapor adsorption artifact in the sampling of organic aersol:face velocity effects, Atmos. Envir., 24, 2563–2571, 1990.15
Meng, Z. and Seinfeld, J. H.: Time scales to achieve atmospheric gas-aerosol equilibrium forvolatile species, Atmos. Envir., 30, 2889–2900, 1996.
Mikhailov, E., Vlasenko, S., Niessner, R., and Poschl, U.: Interaction of aerosol particles com-posed of protein and salts with water vapor: hygroscopic growth and microstructural rear-rangement, Atmos. Chem. Phys., 4, 323–350, 2004.20
Ming, Y. and Russell, L. M.: Predicted hygroscopic growth of sea salt aerosol, J. Geophys.Res., 106, 28 259–28 274, 2001.
Ming, Y. and Russell, L. M.: Thermodynamic equilibrium of organic-electrolyte mixtures inaerosol particles, AIChE J., 48, 1331–1348, 2002.
Mircea, M., Facchini, M. C., Decesari, S., Fuzzi, S., and Charlson, R. J.: The influence of25
the organic aerosol component on CCN supersaturation spectra for different aerosol types,Tellus, Ser. B, 54, 74–81, 2002.
Mochida, M., Umemoto, N., Kawamura, K., and Uematsu, M.: Bimodal size distributionof C2-C4 dicarboxylic acids in the marine aerosols, Geophys. Res. Lett., 30, 13, 1672,doi:10.129/2003GL017451, 2003a.30
Mochida, M., Kawabata, A., Kawamura, K., Hatsushika, H., and Yamazaki, K.: Seasonal vari-ation and origins of dicarboxylic acids in the marine atmosphere over the western NorthPacific, J. Geophys. Res., 108, 4193, doi:10.1029/2002/D002355, 2003b.
Moise, T. and Rudich, Y.: Reactive uptake of ozone by aerosol-associated unsaturated fattyacids: Kinetics, mechanism, and products, J. Phys. Chem. A, 106, 6469–6476, 2002.
Monks, P., Rickard, A. R., Dentener, F. J., Jonson, J. E., Lindskog, A., Roemer, M., Schup-bach, E., Friedli, T. K., and Solberg, S.: Trotrep: tropospheric ozone and precursors, trends,budgets, and policy, Project Report of TROTREP, EVK2-CT-1999-00043, 2003.5
Mozurkewich, M.: Aerosol Growth and the Condensation Coefficient for Water: A Review, Aer.Sci. Tech., 5, 223–236, 1986.
Myhre, C. E. L. and Nielsen, C. J.: Optical properties of atmospheric fog and cloud dropletscollected in the Po Valley, Italy, Asian Chemistry Letters, 7(2 & 3), 113–118, 2003.
Myhre, C. E. and Nielsen, C. J.: Optical properties in the UV and visible spectral region of10
Myhre, G., Stordal, F., Restad, K., and Isaksen, I. S. A.: Estimation of the direct radiative forcingdue to sulfate and soot aerosol, Tellus, 50B, 463–477, 1998.
Na, H. S., Arnold, S., and Myerson, A. S.: Water activity in supersaturated aqueous-solutions15
of organic solutes, J. Cryst. Growth, 149, 229–235, 1995.Naik, V., Delire, Ch., and Wuebbles, D. J.: Sensititvity of global biogenic isoprenoid
emissions to climate variability and atmospheric CO2, J. Geophys. Res., 109, D06301,doi:10.1029/2003JD004326, 2004.
Nenes, A. and Seinfeld, J. H.: Parameterization of cloud droplet in global climate models, J.20
Geophys. Res., 108 (D7), 4415, doi:10.1029/2002JD002911, 2003.Nenes, A., Ghan, S., Abdul-Razzak, H., Chuang, P., and Seinfeld, J. H.: Kinetic limitations on
cloud droplet formation and impact on cloud albedo, Tellus B, 53, 133–149, 2001.Nenes, A., Charlson, R. J., Facchini, M. C., Kulmala, M., Laaksonen, A., and Seinfeld, J. H.:
Can chemical effects on cloud droplet number rival the first indirect effect?, Geophys. Res.25
Lett., 29 (17), doi:10.1029/2002GL015295, 2002a.Nenes, A., Conant, W., and Seinfeld, J. H.: Black carbon radiative heating effects on cloud
microphysics and implications for the aerosol indirect effect: 2. Cloud microphysics, J. Geo-phys. Res., 107, doi:10.1029/2002JD002101, 2002b.
Novakov, T. and Corrigan, C. E.: Cloud condensation nucleus activity of the organic component30
of biomass smoke particles, Geophys. Res. Lett., 23, 2141–2144, 1996.Novakov, T. and Penner, J. E.: Large contribution of organic aerosols to cloud-condensation-
Novakov, T., Hegg, D. A., and Hobbs, P. V.: Airborne measurements of carbonaceous aerosolson the East coast of the United States, J. Geophys. Res., 102, 30 023–30 030, 1997.
Novakov, T., Ramanathan, V., Hansen, J. E., Kirchstetter, T. W., Sato, M., Sinton, J. E., andSathaye, J. A.: Large historical changes of fossil-fuel black carbon aerosols, Geophys. Res.Lett., 30, 6, 1324, doi:10.1029/2002GL016345, 2003.5
Noziere, B., Barnes, I., and Becker, K. H.: Product study of the reactions of a-pinene and ofpinonaldehyde with OH radicals, J. Geophys. Res., 31 (4), 291–301, 1999a.
Noziere, B., Spittler, M., Ruppert, L., Barnes, I., Becker, K. H., Pons, M., and Wirtz, K.: Kineticsof the reactions of pinonaldehyde with OH radicals and with Cl atoms, Int. J. Chem. Kinetics,104 (D19), 23 645–23 656, 1999b.10
Odum, J. R., Hoffmann, T., Bowman, F., Collins, D., Flagan, R. C., and Seinfeld, J. H.:Gas/Particle partitioning and secondary organic aerosol yields, Environ. Sci. Technol., 30,2580–2585, 1996.
Odum, J. R., Jungkamp, T. P. W., Griffin, R. J., Flagan, R. C., and Seinfeld, J. H.: The atmo-spheric aerosol-forming potential of whole gasoline vapor, Science, 276, 96–99, 1997.15
O’Dowd, C. D., Aalto, P., Hameri, K., Kulmala, M., and Hoffmann, T.: Aerosol formation –Atmospheric particles from organic vapours, Nature, 416, 497–498, 2002.
Ogren, J., Groblicki, A., and Charlson, R. J.: Measurement of the removal rate of elementalcarbon from the atmosphere, Sci. Total Environ., 36, 329–338, 1984.
Olivier, J., Bouwman, A. F., Van der Maas, C. W. M., Berdowski, J. J. M., Veldt, C., Bloos, J. P. J.,20
Visschedijk, A. J. H., Zandveld, P. Y. J., and Haverlag, J. L.: Description of EDGAR Version2.0: a set of emission inventories of greenhouse gases and ozone depleting substances forall anthropogenic and most natural sources on a per country basis and on 1◦×1◦ grid, RIVMReport no. 771060002 and TNO-MEP Report no. R96/119, 1996.
Olivier, J. G. J., Bouwman, A. F., Berdowski, J. J. M., Veldt, C., Bloos, J. P. J., Visschedijk,25
A. J. H., van de Maas, C. W. M., and Zandveld, P. Y. J.: Sectoral emission inventories ofgreenhouse gases for 1990 on a per country basis as well as on 1◦×1◦, Environ. Science &Policy, 2, 241–264, 1999.
Orlando, J. J., Noziere, B., Tyndall, G. S., Orzechowska, E., Paulson, S. E., and Rudich, Y.:Product studies of the OH- and ozone-initiated oxidation of some monoterpenes, J. Geophys.30
Res., 105 (D9), 11 561–11 572, 2000.Owen, S. M., Boissard, C., and Hewitt, C. N.: Volatile organic compounds (VOCs) emitted from
40 Mediterranean plant species: VOC speciation and extrapolation to habitat scale, Atmos.
Environ., 35, 5393–5409, 2001.Pagels, J., Strand, M., Rissler, J., Szpila, A., Gudmundsson, A., Bohgard, M., Lillieblad, L.,
Sanati, M., and Swietlicki, E.: Characteristics of aerosol particles formed during grate com-bustion of moist forest residue, J. Aerosol Sci., 34, 1043–1059, 2003.
Palen, E. J., Allen, D. T., Pandis, S. N., Paulson, S. E., Seinfeld, J. H., and Flagan, R. C.:5
Fourier transform infrared analysis of aerosol formed in the photo-oxidation of isoprene anda-pinene, Atmos. Envir., 26, 1239–1251, 1992.
Palmer, P. I., Jacob, D. J., Fiore, A. M., Martin, R. V., Chance, K., and Kurosu, T.: Mapping iso-prene emissions over North America using formaldehyde column observations from space,J. Geophys. Res., 108, 4180, doi:10.1029/2002JD002153, 2003.10
Pandis, S. N., Paulson, S. E., Seinfeld, J. H., and Flagan, R. C.: Aerosol formation in thephotooxidation of isoprene and b-pinene, Atmos. Envir., 25, 997–1008, 1991.
Pandis, S. N., Harley, R. H., Cass, G. R., and Seinfeld, J. H.: Secondary organic aerosolformation and transport, Atmos. Environ., 26, 2269–2282, 1992.
Pankow, J. F.: An absorption model of gas/particle partitioning of organic compounds in the15
atmosphere, Atmos. Envir., 28, 185–188, 1994.Pankow, J. F., Seinfeld, J. H., Asher, W. E., and Erdakos, G. B.: Modelling the formation of sec-
ondary organic aerosol, 1. Application of theoretical principles to measurements obtained inthe α-pinene/, β-pinene/, sabinene/, d3-carene/, and cyclohexane/ozone systems, Environ.Sci. Technol., 35, 1164–1172, 2001.20
Peeters, J., Vereecken, L., and Fantechi, G.: The detailed mechanism of the OH-initiated atmo-spheric oxidation of α-pinene: a theoretical study, Phys. Chem. Chem. Phys., 3, 5489–5504,2001.
Peng, C. and Chan, C. K.: The water cycle of water-soluble organic salts of atmospheric im-portance, Atmos. Envir., 35, 1183–1192, 2001.25
Peng, C., Chow, A. H. L., and Chan, C. K.: Study of the Hygroscopic Properties of SelectedPharmaceutical Aerosols Using Single Particle Levitation, Pharmaceutical Research, 17, 9,2000.
Peng, C., Chan, M. N., and Chan, C. K.: The hygroscopic properties of dicarboxylic and multi-functional acids: measurements and UNIFAC predictions, Environ. Sci. Technol., 35, 4495–30
4501, 2001.Penner, J. E., Chuang, C. C., and Grant, K.: Climate forcing by carbonaceous and sulfate
Piccot, S. D., Watson, J. J., and Jones, J. W.: A global inventory of volatile organic compoundemissions from anthropogenic sources, J. Geophys. Res., 97, 9897–9912, 1992.
Pilinis, C., Seinfeld, J. H., and Seigneur, C.: Mathematical modelling of the dynamics of multi-component atmospheric aerosols, Atmos. Envir., 21, 943–955, 1987.
Pincus, R. and Baker, M.: Effect of precipitation on the albedo susceptibility of clouds in the5
marine boundary layer, Nature, 372, 250–252, 1994.Pitchford, M. L. and McMurry, P. H.: Relationship between measured water vapor growth and
chemistry of atmospheric aerosol for Grand Canyon, Arizona, in winter 1990, Atmos. Envir.,28, 827–839, 1994.
Poschl, U., von Kuhlmann, R., Poisson, N., and Crutzen, P. J.: Development and Intercom-10
parison of Condensed Isoprene Oxidation Mechanisms for Global Atmospheric Modelling, J.Atmos. Chem., 37, 29–52, 2000.
Poschl, U., Letzel, T., Schauer, C., and Niessner, R.: Interaction of ozone and water vapor withspark discharge soot aerosol particles coated with benzo[a]pyrene: O3 and H2O adsorption,benzo[a]pyrene degradation, and atmospheric implications, J. Phys. Chem. A, 105, 4029–15
4041, 2001.Posfai, M., Xu, H. F., Anderson, J. R., and Buseck, P. R.: Wet and dry sizes of atmospheric
aerosol particles: An AFM-TEM study, Geophys. Res. Lett., 25, 1907–1910, 1998.Prenni, A. J., DeMott, P. J., Kreidenweis, S. M., Sherman, D. E., Russell, L. M., and Ming, Y.:
The effects of low molecular weight dicarboxylic acids on cloud formation, J. Phys. Chem. A,20
105, 11 240–11 248, 2001.Prenni, A. J., DeMott, P. J., and Kreidenweis, S. M.: Water uptake of internally mixed particles
containing ammonium sulfate and dicarboxylic acids, Atmos. Envir., 37, 4243–4251, 2003.Pruppacher, H. R. and Klett, J. D.: Microphysics of Clouds and Precipitation, Kluwer Academic
Publishers, Dordrecht, Netherlands, 1980.25
Pun, B. K., Seigneur, C., Grosjean, D., and Saxena, P.: Gas-phase formation of water solubleorganic compounds in the atmosphere: a retrosynthetic analysis, J. Atmos. Chem., 35, 199–223, 2000.
Pun, B. K., Griffin, R. J., Seigneur, C., and Seinfeld, J. H.: Secondary organic aerosol: II.Thermodynamic model for gas/particle partitioning of molecular constituents, J. Geophys.30
Res., 107 (D17), 4333, doi:10.1029/2001JD000542, 2002.Pun, B. K., Wu, S. Y., Seigneur, C., Seinfeld, J. H., Griffin, R. J., and Pandis, S. N.: Uncer-
tainties in modelling secondary organic aerosols: Three-dimensional modelling studies in
Nashville/West Tennessee, Environ. Sci. Technol., 37, 3647–3661, 2003.Putaud, J.-P., Raes, F., van Dingenen, R., et al.: A European aerosol phenomenology; physical
and chemical characteristics of particulate matter at kerbside, urban, rural and backgroundsites in Europe, European Commission, Report # EUR 20411 EN, (http://ccu.ei.jrc.it/ccu),2003.5
Putaud, J. P., Raes, F., Van Dingenen, R., Bruggemann, E., Facchini, M. C., Decesari, S., Fuzzi,S., Gehrig, R., Huglin, C., Laj, P., Lorbeer, G., Maenhaut, W., Mihalopoulos, N., Muller,K., Querol, X., Rodriguez, S., Schneider, J., Spindler, G., Ten Brink, H., Tørseth, K., andWiedensohler, A.: A European aerosol phenomenology – 2: chemical characteristics ofparticulate matter at kerbside, urban, rural and background sites in Europe, Atmos. Envir.,10
38, 2579–2595, 2004.Puxbaum, H. and Limbeck, A.: Observation of Atmospheric Organic Acids and Implications
for Secondary Formation, Proceedings of the workshop “Chemical Behaviour of AromaticHydrocarbons in the Troposphere”, Valencia, Spain, February 27–29, 2000.
Rasmussen, R. A.: What do the hydrocarbons from trees contribute to air pollution?, J. Air15
Pollut. Contr. Assoc., 22, 537–543, 1972.Raty, J. A., Vartiainen, E. M., and Peiponen, K.-E.: Resolving optical constants from reflectance
of liquids in the UV-visible range, Applied Spectroscopy, 53 (1), 92–96, 1999.Raymond, T. M. and Pandis, S. N.: Cloud activation of single-component organic aerosol parti-
cles, J. Geophys. Res., 107, 4787, doi:10.1029/2002JD002159, 2002.20
Raymond, T. M. and Pandis, S. N.: Formation of cloud droplets by multicomponent organicparticles, J. Geophys. Res., 108 (D15), 4469, doi:10.1029/2003JD003503, 2003.
Riemer, N., Vogel, H., and Vogel, B.: Modelling the ageing processes of soot, Abstracts of theEuropean Aerosol Conference 31 August–5 September, Madrid, J. Aerosol Sci., S131–S132,2003.25
Rissman, T., Nenes, A., and Seinfeld, J. H.: Chemical amplification (or dampening) of theTwomey effect: Conditions derived from droplet activation theory, J. Atmos. Sci., 61 (8), 919–930, 2004.
Ritzoulis, G. and Fidantsi, A.: Relative Permittivities, Refractive Indices, and Densities for theBinary Mixtures N, N’-Dimethylacetamide with Methanol, Ethanol, 1-Butanol, and 2-Propanol30
at 298.15 K, J. Chem. En. D., 45 (2), 207–209, 2000.Roberts, G. C., Andreae, M. O., Zhou, J., and Artaxo, P.: Cloud condensation nuclei in the
Amazon Basin: “Marine” conditions over a continent?, Geophys. Res. Lett., 28, 14, 2807–
2810, 2001.Robinson, R. A. and Stokes, R. H.: Electrolytic Solutions, 2nd Edition, Butterworth, London,
1959.Roelofs, G.-J., Kasibhatla, P., Barrie, L., Bergmann, D., Bridgeman, C., Chin, M., Christensen,
J., Easter, R., Feichter, J., Jeuken, A., Kjellstrom, E., Koch, D., Land, C., Lohmann, U., and5
Rasch, P.: Analysis of regional budgets of sulfur species modelled for the COSAM exercise,Tellus, 53B, 673–694, 2001.
Rogge, W. F., Mazurek, M. A., Hildemann, L. M., Cass, G. R., and Simoneit, B. R. T.: Quantifi-cation of urban organic aerosols at a molecular level: Identification, abundance and seasonalvariation, Atmos. Envir., 27A, 1309–1330, 1993.10
Roselle, S. J.: Effects of biogenic emission uncertainties on regional photochemical modellingof control strategies, Atmos. Envir., 28, 1757–1772, 1994.
Rubel, G. O. and Gentry, J. W.: Measurement of the kinetics of solution droplets in the pres-ence of adsorbed monolayers – determination of water accommodation coefficients, J. Phys.Chem., 88, 3142–3148, 1984.15
Russell, L. M.: Aerosol organic-mass to organic-carbon ratio measurements, Environ. Sci.Technol., 37, 2982–2987, 2003.
Russell, L. M., Maria S. F., and Myneni S. C. B.: Mapping organic coatings on atmosphericparticles, Geophys. Res. Lett., 29 (16), art. no. 1779, 2002.
Sander, R.: Compilation of Henry’s Law Constants for Inorganic and Organic Species of Po-20
tential Importance in Environmental Chemistry, (version 3), http://www.mpch-mainz.mpg.de/∼sander/res/henry.html, 1999.
Sanderson, M. G., Collins, W. J., Johnson, C. E., Derwent, R. G, and Garnier, B.: Effect of veg-etation changes on isoprene emissions and surface ozone levels in future climates, posterpresented at IGAC 2002 conference, 2002.25
Satsumbayashi, H., Kurita, H., Yokouchi, Y., and Ueda, H.: Mono- and Dicarboxylic Acids underLong-Range Transport of Air Pollution in Japan, Tellus, 41B, 219–229, 1989.
Satsumbayashi, H., Kurita, H., Yokouchi, Y., and Ueda, H.: Photochemical Formation of Par-ticulate Dicarboxylic Acids under Long-Range Transport in Japan, Atmos. Environ., 24A,1443–1450, 1993.30
Sau, J. A. and Khalil, M. A. K.: Anthropogenic contributions to the carbonaceous content ofaerosols over the Pacific Ocean, Atmos. Envir., 27, 8, 1297–1307, 1993.
Saunders, S. M., Jenkin, M. E., Derwent, R. G., and Pilling, M. J.: Protocol for the develop-
ment of the Master Chemical Mechanism, MCM v3 (Part A): tropospheric degradation ofnon-aromatic volatile organic compounds, Atmos. Chem. Phys., 3, 161–180, 2003; MCM isassessable via the ftp (http://www.chem.leeds.ac.uk/Atmospheric/MCM/mcmproj.html)
Saxena, P. and Hildemann, L. M.: Water-Soluble Organics in Atmospheric Particles: A CriticalReview of the Literature and Application of Thermodynamics to Identify Candidate Com-5
pounds, J. Atmos. Chem., 24, 57–109, 1996.Saxena, P. and Hildemann, L. M.: Water absorption by organics: Survey of laboratory evidence
and evaluation of UNIFAC for estimating water activity, Environ. Sci. Technol., 31, 3318–3324, 1997.
Saxena, P., Hildemann, L. M., McMurry, P. H., and Seinfeld, J. H.: Organics alter hygroscopic10
behavior of atmospheric particles, J. Geophys. Res., 100, D9, 18 755–18 770, 1995.Schaap, M., Denier Van Der Gon, H. A. C., Visschedijk, A. J. H, Van Loon, M., ten Brink, H. M.,
Dentener, F. J., Putaud, J.-P., Guillaume, B., Liousse, C., and Builtjes, P. J. H.: AnthropogenicBlack Carbon and Fine Aerosol Distribution over Europe, J. Geophys. Res., accepted, 2004.
Schell, B., Ackermann, I. J., Hass, H., Binkowski, F. S., and Ebel, A.: Modelling the formation15
of secondary organic aerosol within a comprehensive air quality model system, J. Geophys.Res., 106, D22, 28 275–28 293, 2001.
Schmid, H., Laskus, L., Abraham, H. J., Baltensperger, U., Lavanchy, V., Bizjak, M., Burba,P., Cachier, H., Crow, D., Chow, J., Gnauk, T., Even, A., ten Brink, H. M., Giesen, K.-P.,Hitzenberger, R., Hueglin, C., Maenhaut, W., Pio, C., Carvalho, A., Putaud, J.-P., Toom-20
Sauntry, D., and Puxbaum, H.: Results of the “carbon conference” international aerosolcarbon round robin test stage 1, Atmos. Environ., 35, 2111–2121, 2001.
Schnaiter, M., Horvath, H., Moehler, O., Naumann, K.-H., Saatho, H., and Schoeck, O. W.: UV-VIS-NIR spectral optical properties of soot and soot-containing aerosols, J. Aerosol Science,34, 1421–1444, 2003.25
Segade, L., Jimenez de Llano, J., Dominguez-Perez, M., Cabeza, O., Cabanas, M., andJimenez, E.: Density, Surface Tension, and Refractive Index of Octane + 1-Alkanol Mixturesat T = 298.15 K, J. Chem. En. D., 48 (5), 1251–1255, 2003.
Seidl, W.: Model for a surface film of fatty acids on rain water and aerosol particles, Atmos.Envir., 34, 4917–4932, 2000.30
Seinfeld, J. H. and Pandis, S. N.: Atmospheric Chemistry and Physics: from Air Pollution toClimate Change, John Wiley, New York, 1998.
Seinfeld, J. H. and Pankow, J. F.: Organic atmospheric particulate material, Annu. Rev. Phys.
Chem., 54, 121–140, 2003.Seinfeld, J. H., Erdakos, G. B., Asher, W. E., and Pankow, J. F.: Modelling the formation of sec-
ondary organic aerosol (SOA), 2. The predicted effects of relative humidity on aerosol forma-tion in the alpha-pinene/, beta-pinene/, sabinene/, delta 3-carene/, and cyclohexane/ozonesystems, Environ. Sci. Technol., 35, 1806–1817, 2001.5
Sempere, R. and Kawamura, K.: Low Molecular Weight Dicarboxylic Acids and Related PolarCompounds in the remote marine Rain Samples collected from Western Pacific, Atmos.Envir., 30, 10/11, 1609–1619, 1996.
Shantz, N. C., Leaitch, W. R., and Caffrey, P. F.: Effect of organics of low solubility on the growthrate of cloud droplets, J. Geophys. Res., 108 (D5), 4168, doi:10.1029/2002JD002540, 2003.10
Shulman, M. L., Jacobson, M. C., Charlson, R. J., Synovec, R. E, and Young, T. E.: Dissolutionbehaviour and surface tension effects of organic compounds in nucleating cloud droplets,Geophys. Res. Lett., 23, 277–280, 1996.
Simpson, D., Winiwarter, W., Borjesson, G., Cinderby, S., Ferreiro, A., Guenther, A., Hewitt,C., Janson, R., Khalil, M. A., Owen, S., Pierce, T. E., Puxbaum, H., Shearer, M., Skiba,15
U., Steinbrecher, R., Tarrason, L., and Oquist, M.: Inventorying emissions from nature inEurope, J. Geophys. Res., 104, 8113–8152, 1999.
Sioutas, C., Kim, S., and Chang, M.: development and evaluation of an ultrafine particle con-centrator, J. Aerosol Sci., 30, 1001–1017, 1999.
Slinn, W. G. N.: Precipitation scavening, in Atmospheric Science and Power Production, edited20
by Randerson, D., U.S. Dept of Energy, Technical Information Center, Oak Ridge, Tenn.,466–532, 1984.
Speer, R. E., Edney, E. O., and Kleindienst, T. E.: Impact of organic compounds on the con-centrations of liquid water in ambient PM2.5, J. Aeros. Sci., 34, 63–77, 2003.
Squires, P. and Twomey, S.: The relation between cloud droplet spectra and the spectrum of25
cloud nuclei, in: Physics of Precipitation, Geoph. Monogr. Ser., 1960.Stern, J. E., Flagan, R. C., Grosjean, D., and Seinfeld, J. H.: Aerosol formation and growth in
of sub-micrometer aerosol particle hygroscopic behaviour, Atmos. Res., 50, 205-240, 1999.Swietlicki, E., Zhou, J., Covert, D. S., Hameri, K., Busch, B., Vakeva, M., Dusek, U., Berg, O.H.,
Wiedensohler, A., Aalto, P., Makela, J., Martinsson, B. G., Papaspiropoulos, G., Mentes, B.,Frank, G., and Stratmann, F.: Hygroscopic properties of aerosol particles in the north-easternAtlantic during ACE-2, Tellus, 52B, 201–207, 2000.5
Tang, H., Lewis, E. A., Eatough, D. J., Burton, R. M., and Farber, R. J.: Determination ofthe particle size distribution and chemical composition of semi-volatile organic compoundsin atmospheric fine particles with a diffusion denuder sampling system, Atmos. Envir., 28,939–947, 1994.
Tang, I. N.: Thermodynamic and optical properties of mixed-salt aerosols of atmospheric im-10
portance, J. Geophys. Res., 102, 1883–1893, 1997.Tang, I. N. and Munkelwitz, H. R.: Water activities, densities, and refractive indices of aque-
ous sulfates and sodium nitrate droplets of atmospheric importance, J. Geophys. Res., 99,18 801–18 808, 1994.
Tang, I. N., Tridico, A. C., and Fung, K. H.: Thermodynamic and optical properties of sea salt15
aerosols, J. Geophys. Res., 102, 23 269–23 275, 1997.Tao, Y. and McMurry, P. M.: Vapor pressures and surface free energies of C14-C18 mono-
carboxylic acids and C5 and C6 dicarboxylic acids, Environ. Sci. Technol., 23, 1519–1523,1989.
Ten Brink, H., Maenhaut, W., Gnauk, T., Hitzenberger, R., Spindler, G., Chi, X., Putaud, J. P.,20
Bauer, H., Puxbaum, H., Turstic, J., Berner., A., Even, A., and Mueller, K.: Comparability ofmethods in use in Europe for measuring the carbon content of fine particulate matter, Atmos.Envir., in press, 2004.
Tobias, H. J., Beving, D. E., Ziemann, P. J., Sakurai, H., Zuk, M., McMurry, P. H., Zarling, D.,Waytulonis, R., and Kittelson, D. B.: Chemical analysis of diesel engine nanoparticles using25
a nano-DMA/thermal desorption particle beam mass spectrometer, Environ. Sci. Technol.,35, 2233–2243, 2001.
Tolocka, M. P., Jang, M., Ginter, J., Cox, F., Kamens, R., and Johnston, M.: Formation ofOligomers in Secondary Organic Aerosol, Environ. Sci. Technol., 38, 1428–1434, 2004.
Trainer, M., Williams, E., Parrish, D., Burhr, M., Allwine, E., Westberg, H., Fehsenfeld, F., and30
Liu, S.: Models and observations of the impact of natural hydrocarbons on rural Ozone,Nature, 705–707, 1987.
Tsapakis, M., Lagoudaki, E., Stephanou, E. G., Kavouras, I. G., Koutrakis, P., Oyola, P., and
von Baer, D.: The composition and sources of PM2.5 organic aerosol in two urban areas ofChile, Atmos. Envir., 36, 3851–3863, 2002.
Tsigaridis, K.: 3-d simulations of the impact of organic aerosol on the chemistry and the radia-tive forcing of the atmosphere, PhD thesis, University of Crete, Greece, 2003.
Tsigaridis, K. and Kanakidou, M.: Global modelling of secondary organic aerosol in the tropo-5
sphere: A sensitivity analysis, Atmos. Chem. Phys., 3, 2879–2929, 2003.Turpin, B. J. and Lim, H. J.: Species contributing to PM2.5 mass concentrations: revisiting com-
mon assumptions for estimating organic mass, Aerosol Sci. Technol., 35, 602–610, 2001.Turpin, B. J., Saxena, P., and Andrews, E.: Measuring and simulating particulate organics in
the atmosphere: problems and prospects, Atmos. Envir., 34, 2983–3013, 2000.10
Twohy, C. H., Clarke, A. D., Warren, S. G., Radke, L. F., and Charlson, R. J.: Light-absorbingmaterial extracted from cloud droplets and its effect on cloud albedo, J. Geophys. Res., 94,8623–8631, 1989.
Twomey, S.: The nuclei of natural cloud formation, II. The supersaturation in natural clouds andthe variation of cloud droplet concentration, Geofisica pura e applicata, 43, 243–249, 1959.15
Twomey, S.: Pollution and the Planetary Albedo, Atmos. Envir., 8, 1251–1256, 1974.Twomey, S.: The influence of pollution on the shortwave albedo of clouds, J. Atmos. Sci., 34,
1149–1152, 1977.Vakeva, M., Kulmala, M., Stratmann, F., and Hameri, K.: Field measurements of hygroscopic
properties and state of mixing of nucleation mode particles, Atmos. Chem. Phys., 2, 55–66,20
2002.Vereecken, L. and Peeters, J.: Theoretical study of the formation of acetone in the OH-initiated
atmospheric oxidation of α-pinene, J. Phys. Chem. A, 104, 11 140–11 146, 2000.Vestin, A.: Size distribution and cloud nucleating properties of biomass burning aerosol in the
Amazon Basin, Master’s Thesis, Dept. of Physics, Lund Inst. of Technology, Lund University,25
Sweden, 2003.Vinckier, C., Compernolle, F., and Saleh, A. M.: Qualitative determination of the non-volatile
reaction products of the α-pinene reaction with hydroxyl radicals, Bull. Aos. Chim. Belg.,106, 501–513, 1997.
Virkkula, A., Van Dingenen, R., Raes, F., and Hjorth, J.: Hygroscopic properties of aerosol30
formed by oxidation of limonene, α-pinene and β-pinene, J. Geophys. Res., 104, 3569–3579, 1999.
Vizuete, W., Junquera, V., and Allen, D. T.: Sesquiterpene emissions and secondary organic
Vogel, B., Fiedler, F., and Vogel, H.: Influence of topography and biogenic volatile compoundsemissions in the State of Baden-Wurttemberg on ozone concentrations during episodes ofhigh air temperatures, J. Geophys. Res., 100, 22 907–22 928, 1995.5
Wang, S. C., Paulson, S. E., Grosjean, D., Flagan, R. C., and Seinfeld, J. H.: Aerosol formationand growth in atmospheric organic NOx systems, 1. Outdoor smog chamber studies of C7and C8 hydrocarbons, Atmos. Envir., 26, 403–420, 1992.
Wangberg, I., Barnes, I., and Becker, K. H.: Product and mechanistic study of the reaction ofNO3 radicals with a-pinene, Environ. Sci. Technol., 31, 2130–2135, 1997.10
Warneck, P.: In-cloud chemistry opens pathway to the formation of oxalic acid in the marineatmosphere, Atmos. Envir., 37, 2423–2427, 2003.
Wehner, B., Birmili, W., Gnauk, T., and Wiedensohler, A.: Particle number size distributions ina street canyon and their transformation into the urban-air background: measurements anda simple model study, Atmos. Envir., 36, 2215–2223, 2002.15
Weingartner, E., Burtscher, H., and Baltensperger, U.: Hygroscopic properties of carbon anddiesel soot particles, Atmos. Envir., 31, 2311–2327, 1997.
Went, F. W.: Blue hazes in the atmosphere, Nature, 187, 641–643, 1960.Wesely, M. L. and Hicks, B. B.: A review of the current status of knowledge on dry deposition,
Atmos. Environ., 34, 2261–2282, 2000.20
Wexler, A. S. and Seinfeld, J. H.: Second-generation inorganic aerosol model, Atmos. Environ.,25A, 2731–2748, 1991.
Wexler, A. S., Lurmann, F. W., and Seinfeld, J. H.: Modelling urban and regional aerosols – I.Model development, Atmos. Environ., 28, 3, 531–546, 1994.
Whitby, E. R. and McMurry, P. H.: Modal aerosol dynamics modeling, Aerosol Sci. Technol., 27,25
673–688, 1997.Wiedinmyer, C., Guenther, A., Harley, P., Hewitt, N., Geron, C., Artaxo, P., Steinbrecher, R., and
Rasmussen, R.: Global Organic Emissions from Vegetation, in: Emissions of AtmosphericTrace Compounds, edited by Granier, C., Artaxo, P., and Reeves, C., Kluwer Academic Pub-lishers, Dordrecht, The Netherlands, 544, 115–170, 2004.30
Wilson, J., Cuvelier, C., and Raes, F.: A modelling study of global mixed aerosol fields, J.Geophys. Res., 106, 34 081–34 108, 2001.
Winterhalter, R., Neeb, P., Grossmann, D., Kolloff, A., Horie, O., and Moortgat, G. K.: Products
and mechanism of the gas phase reaction of ozone with b-pinene, J. Atmos. Chem., 35,165–197, 2000.
Winterhalter, R., Van Dingenen, R., Larsen, B. R., Jensen, N. R., and Hjorth, J.: LC-MS anal-ysis of aerosol particles from the oxidation of α-pinene by ozone and OH radicals, Atmos.Chem. Phys. Discuss., 3, 1–39, 2003.5
Wise, M. E., Surratt, J. D., Curtis, D. B., Shilling, J. E., and Tolbert, M. A.: Hygroscopic growthof ammonium sulfate/dicarboxylic acids, J. Geophys. Res., 108, 4638–4642, 2003.
Wisthaler, A., Jensen, N. R., Winterhalter, R., Lindinger, W., and Hjorth, J.: Measurementsof acetone and other gas phase product yields from the OH-initiated oxidation of terpenesby proton-transfer-reaction mass spectrometry (PTR-MS), Atmos. Envir., 35, 6181–6191,10
2001.Yao, X., Fang, M., and Chan, C. K.: Size distributions and formation of dicarboxylic acids in
atmospheric particles, Atmos. Envir., 36, 2099–2107, 2002.Yu, J. Z., Flagan, R. C., and Seinfeld, J. H.: Identification of products containing –COOH, -OH,
and –C=O in atmospheric oxidation of hydrocarbons, Environ. Sci. Technol., 32, 2357–2370,15
1998.Yu, J., Cocker III, D. R., Griffin, R. J., Flagan, R. C., and Seinfeld, J. H.: Gas-phase ozone
oxidation of monoterpenes: Gaseous and particulate products, J. Atmos. Chem., 34, 207–258, 1999a.
Yu, J., Griffin, R. J., Cocker III, D. R., Flagan, R. C., Seinfeld, J. H., and Blanchard, P.: Obser-20
vation of gaseous and particulate products of monoterpene oxidation in forest atmospheres,Geophys. Res. Lett., 26, 1145–1148, 1999b.
Zappoli, S., Andracchio, A., Fuzzi, S., Facchini, M. C. A., Gelencser, A., Kiss, G., Krivacsy, Z.,Molnar, A., Meszaros, E., Hansson, H. C., Rosman, K., and Zebuhr, Y.: Inorganic, organicand macromolecular components of fine aerosol in different areas of Europe in relation to25
their water solubility, Atmos. Envir., 33, 2733–2743, 1999.Zhang, K. M. and Wexler, A. S.: A hypothesis for growth of fresh nuclei, J. Geophys. Res., 107,
art. no. 4577, 2002.Zhang, R., Suh, I., Zhao, J., Zhang, D., Fortner, E. C., Tie, X., Molina, L. T., and Molina, M. J.:
Atmospheric New Particle Formation Enhanced by Organic Acids, Science, 304, 1487–1490,30
2004.Zhang, S.-H., Shaw, M., Seinfeld, J. H., and Flagan, R. C.: Photochemical Aerosol Formation
from alpha-Pinene and beta-Pinene, J. Geophys. Res., 97, 20 717–20 729, 1992.
Zhang, Y., Kreidenweis, S. M., and Feingold, G.: Stratocumulus processing of gases and cloudcondensation nuclei 2. Chemistry sensitivity analysis, J. Geophys. Res., 104, D13, 16 061–16 080, 1999.
Zhang, Y., Pun, B., Vijayaraghavan, K., Wu, S., Seigneur, C., Pandis, S. N., Jacobson, M.Z, Nenes, A., and Seinfeld, J. H.: Development and application of the Model of Aerosol5
Dynamics, Reaction, Ionization, and Dissolution (MADRID), J. Geophys. Res., 109, D01202,doi:10.1029/2003JD003501, 2004.
Zheng, M., Cass, G. R., Schauer, J. J., and Edgerton, E. S.: Source Apportionment of PM2.5 inthe Southeastern United States Using Solvent-Extractable Organic Compounds as Tracers,Environ. Sci. Technol., 36, 2361–2371, 2002.10
Zhou, J., Swietlicki, E., Hansson, H. C., and Artaxo, P.: Submicrometer aerosol particle size dis-tribution and hygroscopic growth measured in the Amazon rain forest during the wet season,J. Geophys. Res., 107, 8055–8064, 2002.
Ziemann, P. J.: Evidence for low-volatility diacyl peroxides as a nucleating agent and majorcomponent of aerosol formed from reactions of O3 with cyclohexane and homologous com-15
pounds, J. Phys. Chem. A, 106, 4390–4402, 2002.Ziemann, P. J.: Formation of Alkoxyhydroperoxy Aldehydes and Cyclic Peroxyhemiacetals from
Reactions of Cyclic Alkenes with O3 in the Presence of Alcohols, J. Phys. Chem. A, 107,2048–2060, 2003.
Zuo, Y. and Hoigne, J.: Formation of Hydrogen Peroxide and Depletion of Oxalic Acid in At-20
mospheric Water by Photolysis of Iron(III)-Oxalato-Complexes, Environ. Sci. Technol., 26,1014–1022, 1992.
Zuo, Y. and Hoigne, J.: Photochemical Decomposition of Oxalic, Glyoxalic and Pyruvic AcidCatalysed by Iron in Atmospheric Waters, Atmos. Envir., 28, 7, 1231–1239, 1994.
Table 1. Mass percentage of monoterpene, and reactive ORVOC emission as given by Seinfeldand Pankow (2003; SP2003 based on Guenther et al., 1995 and Griffin et al., 1999b), Owen etal. (2001) and Geron et al. (2000).
Species Mass % Contribution
Class SP2003 Owen Geronglobal S. Europe and Mediterranean N. America
α-pinene M 24.8 30–58 12–53β-pinene M 16.4 8–33 10–31Sabinene+terpenoid M/ORVOC 10.0 2.5–14 2–5Ketones∆3-carene M 3.0 0 4–9Limonene M 16.4 0–5 6–10α-γ-terpinene M 0.6 2–5 0–6Terpinolene M 1.4 n.d. 0–2Myrcene M 3.5 0–4 2–7Terpenoid alcohols ORVOC 14.9 0–20 n.d.Ocimene M 1.5 0–1 0–1Sesquiterpenes ORVOC 7.4 n.d. n.d.
1 M: Monoterpenes; 2 ORVOC: Other reactive VOCs; 3 n.d.: not determined
Table 5. Representation of Secondary Organic Aerosol Formation in Global Atmospheric Mod-els. (POA: primary organic aerosol); * Volatile Organic Species (VOC) used in the model torepresent all VOC compounds forming SOA during their oxidation.
14 Terpenes None. OH, O3, Two-product fits of chamber Chung and Seinfeld (2002)NO3 from global data, imposed T dependence;CTM absorption into POA + SOA
aerosol
α-pinene STOCHEM + 20 species/ 1st order scavenging Derwent et al. (2003)48 reactions of condensable
oxidation products
α- and β-pinene C1-C5 chemistry Two-product model; Kanakidou et al. (2000)and highly simplified absorption into POApinene chemistry + SOA aerosols
α- and β-pinenes Modified CB4 + 12 Two-product model, Tsigaridis and Kanakidou (2003)toluene and xylene species/12 total reactions imposed T dependence;
absorption possible intoall aerosols
Biogenic C10H16 C1-C5 and C10H16 1. Bulk yield method Lack et al. (2004)Anthropogenic C4H10 chemistry 2. two product model
α-pinene C1-C5 and a-pinene when saturation vapour Bonn et al. (2004)chemistry pressure of species is
ff: Cooke and Wilson (1996) 7.1×10⁻⁶ 39 100%bb: Cooke and Wilson (1996) 7.1×10⁻⁶ 39 100%ff: Cooke et al. (1999) 7.1×10⁻⁶ 39 80%ff: Wilson et al. (2001)* 8.7×10−6 32 100%bb: Wilson et al. (2001) 7.1×10⁻⁶ 39 50%
* Annual average. Used a size resolving aerosol model and a varying aging rate dependentupon the SO4 condensation rate onto the hydrophobic BC, monthly average ageing rates variedbetween 7.7×10⁻⁶ and 1.1×10⁻⁵. Myhre et al. (1998) used the Cooke and Wilson (1996)scheme; Lohmann et al. (1999) used the Cooke et al. (1999) scheme.$ The turn-over time is calculated as the inverse of the ageing rate constant and correspondsto the time needed to convert 63% of the fresh-hydrophobic aerosol hygroscopic.
1 Svenningsson, B., Rissler, J., Swietlicki, E., Mircea, M., Bilde, M., Facchini, M. C., Decesari, S., Fuzzi, S., Zhou, J., Mønster, J., and Rosenørn, T.: Hygroscopic Growth and Critical Supersaturations for Mixed Aerosol Particles of Inorganic and Organic Compounds of Atmospheric Relevance, Atmos. Chem. Phys. Discuss., to be submitted, 2004.
* set % of occurrence =100% when info missing; # the discontinuity between Aitken and accumulation mode caused by the artificial separation at GF 1.2 ; Aitken mode particles have the LH GF only slightly <1.2, accumulation mode particles have a GF=1.22-1.32; $ Taking into account periods of internal mixing with diurnal cycle of being <1.2 for about 50% of the time
Table 11. A selection of the optical constants reported by Jacobson (1999). All the componentslisted are observed in the tropospheric particulate matter.
Chemical name λpeak/nm k(λ) n(λ) Solubility in water
Table 12. Normalized OC concentrations determined with different techniques in samples col-lected at various sampling sites.
OC determination method types Los Angeles Basin Berlin city centre (D) Melpitz rural site (D)Countess et al., 1990 Schmid et al., 2000 Ten Brink et al., 2004
1- TOR T<500–650◦C in He 1.00 (0.99–1.01) 1.002- TOT T<600–900◦C in He 1.19 1.11 (0.99–1.31) 1.313- T<525–620◦C in He 1.18 (1.11–1.21) 0.76 (0.66–0.93) 0.564- T<400◦C in O2 (gradient) 1.04 (1.00–1.08) 0.625- T<340◦C in O2 (flash heating) 0.79 0.726- T<650◦C in He + charred OC 1.03
1- Thermo-optical reflectance. OC evolved at up to 500–600◦C in He, EC at up to 700–800◦C in He+O2. Charringcorrected by sample reflectance measurement;2- Thermo-optical transmission. OC evolved at up to 600–900◦C in He, EC at up to 600–900◦C in He+O2. Charringcorrected by sample transmission measurement;3- Thermo-oxidation methods. OC evolved at up to 525–620◦C in He, EC at up to 600–750◦C in He+O2. No charringassessment;4- Thermal method. Sample heated at 20◦C min−1 in O2. No charring expected. OC/EC split difficult to define;5- Thermal. OC evolved at up to 340◦C in He+O2, EC at up to 650◦C in O2. No charring assessment;6- Thermo-oxidation method similar to (3). Charring assessed by measuring EC in a sample aliquot immersed in anoxidant career gas at 340◦ for 2 h.
Fig. 1. Ratio of concentrations of the secondary organic aerosol (SOA) to the total organicaerosol (OA) as computed by a 3-D global chemistry transport model for surface (upper panel)and zonal mean distribution (lower panel) for the month of July (Tsigaridis, 2003; Tsigaridis andKanakidou, 2003).
Fig. 2. Reaction mechanism for the ozonolysis of α-pinene (adopted from Winterhalter et al.,2003). The two Criegee Intermediates and the main decomposition channel (Hydroperoxydechannel) are highlighted with square boxes. One channel leads to the formation of an acyl-typeradical (circle), which can also be formed in case of β-pinene. Consecutive reactions of thisacyl radical then lead to cis-pinic acid (also highlighted by circles) via two possible pathways(A: Jenkin et al., 2000; B: Winterhalter et al., 2000).
Fig. 3. Dimerisation of pinonaldehyde via aldol condensation (upper panel) and by gem-diolformation with subsequent dehydration (lower panel)(Tolocka et al., 2004).
�Fig. 4. Soluble fraction to be acquired by initially insoluble particles in order to become CCNat 0.2% and 0.3% supersaturation, respectively, as a function of the insoluble particle diameter(applying the Kohler equations).
�Fig. 5. Turn-over time to convert hydrophobic particles with initial concentration of 1000 cm−3
and diameter 50 nm CCN (0.3%) by coagulation (dashed line) and condensation (fullgray line), as a function of accumulation mode concentration (Dacc=150 nm). Condensa-tion is assumed to be controlled by the formation rate of H2SO4 with SO2=200 ppt andOH=2×10⁶ molecules cm−3.The combined turn-over time is indicated in the full black line (ap-plying Eqs. 12–17).
Fig. 6. Turn-over time to convert hydrophobic particles to CCN in clean and polluted conditionsfor different initial conditions of the hygrophobic mode. ε is the required soluble fraction forthe particles in order to activate at 0.3% SS. Condensation is assumed to be controlled by theformation rate of H2SO4 with SO2=200 ppt and OH=2×10⁶ molecules cm−3.
Fig. 7. Optical constants of pure organic liquids relevant to tropospheric aerosols, organic acidsidentified in the aerosol WSOC fraction and polluted fog samples. (a) Upper panel: Absorptionindices, k(λ)(b) Lower panel: Refractive index, n(λ).
Fig. 8. Estimated spatial patterns of OC (in µm/m3 based on OM to OC ratio of 1.4) and thelocations of PM monitoring sites. The map was produced using data from only the backgroundsites so it does not include the major industrial areas (from Malm et al., 2000).