Page 1
15
Table 2. Review of research works done by different workers on vermiculture and reproductive aspects of different earthworms using different
organic matters.
Earthworms used
Organic materials used
Aspects studied
Author(s)
E. fetida Sludge Role of moisture on the rate of feeding Mitchell et al.(1977)
L.mauritii
D.willsi
O.surensis
Cow dung Cocoon morphology, hatching and emerging
pattern
Dash and Senapati
(1980)
E.fetida Activated sludge and horse manure Influence of temperature, moisture and pH on
growth, survival and development Kaplan et al. (1980)
E.fetida Sewage sludges, animal and human
excreta, low N organic materials Production of biomass Hutha (1981)
L.mauritii
Ragi and paddy hay, leaves of cashew,
mango, guava and eucalyptus
Feed preference
Kale and
Krishnamoorthy (1981)
E.fetida Cow manure Role of moisture on the growth
Reinecke and Kriel
(1981)
P.excavatus
Fresh dung of cow, sheep and horse and
poultry manure
Survival, feeding and defecation, respiration,
growth and maturation, and fecundity
Kale et al. (1982)
Table 2: Contd….
Page 2
16
Earthworms used
Organic materials used
Aspects studied
Author(s)
E.fetida
E.eugeniae
Amynthas sp.
Allolobophora longa
Allolobophora
chlorotica
Aporrectodea turgida
Lumbricus rubellus
Lumbricus terrestris
Octolasion sp.
Horse manure
Rate of weight loss/gain in relation to species and
size
Hartenstein (1984)
P.excavatus
P.hawayana Sewage sludge
Role of temperature and moisture on
vermicomposting Loehr et al. (1985)
E.fetida
E.eugeniae
Agricultural residues, urban wastes and
sludge
Growth and productivity, and efficiency of
vermicomposting
Reviewed by Lee
(1985)
E.fetida Cow manure Influence of moisture on the growth and
reproduction
Reinecke and Venter
(1985)
E.fetida Mixed miscellaneous wastes and
activated sewage sludge Biomass and cocoon production
Haimi and Huhta
(1986)
E.fetida Cow manure Moisture preferences, growth and reproduction Reinecke and Venter
(1987)
L.terrestris
L.rubellus
Leaves of alfalfa, red clover, corn and
brome grass
Effect of diet on feeding, mortality, growth, food
uptake and casting activity
Shipitalo et al. (1988)
Table 2: Contd….
Page 3
17
Earthworms used
Organic materials used
Aspects studied
Author(s)
E.fetida Urine free cattle droppings Life cycle Venter and Reinecke
(1988)
P.excavatus Urine free cattle droppings Growth rate, maturation and cocoon production Reinecke and Hallatt
(1989)
E.fetida Cattle manure Role of feeding patterns on growth and
reproduction
Reinecke and Viljoen
(1990)
E.fetida Cow manure Rate of growth and cocoon production Bouwman and
Reinecke (1991)
E.fetida
D.veneta
E.eugeniae
P.excavatus
Animal and vegetable wastes
Role of temperature on the growth, cocoon
production and cocoon viability
Edwards and Bater
(1992)
P.excavatus Cattle manure Moisture requirements for better growth and
reproduction
Hallatt et al. (1992)
Millsonia anomala
Savanna soils, leaves and roots of
Loudetia simplex, legume leaves and
wheat roots
Growth rate Martin and Lavelle
(1992)
Eisenia andrei Pig manure Influence of population densities on the growth
and reproduction Ulrik Reeh (1992)
Aporrectodea longa
L. terrestris
Octolasion cyaneum
Paper pulp Growth, cocoon and hatchlings production,
incubation time and hatching success
Butt (1993)
Table 2: Contd….
Page 4
18
Earthworms used
Organic materials used
Aspects studied
Author(s)
E.fetida Cattle manure Role of selective breeding on the improvement of
growth and reproductive parameters
Meyer and Bouwman
(1995)
E.eugeniae
Maize stover, rice straw, residues of
Acioa, Gliricidia and Leucaena
prunings
Efficiency of vermicomposting
Tian et al. (1995)
E.andrei Solid paper mill sludge, sewage sludge,
pig and poultry slurry Growth rate and mortality Elvira et al. (1997)
E.andrei Grasses, garden and municipal prunings
and river weeds
Cocoon and hatchling production, hatching
success and growth rate of hatchlings
Frederickson et al.
(1997)
L.mauritii
E.eugeniae
Coir waste, press mud, water hyacinth,
farm wastes, farm yard manure, biogas
slurry of press mud and cattle dung
Life cycle, growth and population dynamics Ramalingam (1997)
E.andrei Cattle manure, paper-mill sludge and
dairy sludge Growth and reproduction Elvira et al. (1998)
E.fetida Animal dung, agricultural residues,
urban wastes and sludge
Growth, productivity and efficiency of
vermicomposting
Reviewed by Edwards
(1998b)
Table 2: Contd….
Page 5
19
Earthworms used
Organic materials used
Aspects studied
Author(s)
E.fetida
A mixture of anaerobically digested
sewage sludge from paper mill factory
and aerobically digested municipal
sludge
Changes in total biomass, non- clitellated
biomass, clitellated biomass and semi clitellated
biomass and loss of reproductive potential of adult
earthworms
Benitez et al. (1999)
E.eugeniae Dried areca nut leaves, cocoa leaves and
cocoa pod husk
Efficiency of vermicomposting and biomass
production
Chowdappa et al.
(1999)
L.mauritii Vegetable market wastes To assess a suitable method among methods used
in green waste decomposition
Logakanthi et al.
(2000)
E.fetida Bio solids and paper mulch Biomass change during vermicomposting Ndegwa et el.(2000)
P.excavatus Sugarcane trash and cow dung Biomass change, delay in maturation, survival and
hatchlings production
Ramalingam and
Thilagar (2000)
E.eugeniae Cattle waste solids Growth rate and reproductive potentials of
hatchlings
Dominguez et al.
(2001)
E.eugeniae Paper waste with varied ratios of cow
dung
Vermicast production, survival, growth and
reproduction of adult earthworms
Gajalakshmi et al.
(2001)
P.excavatus Sugarcane trash and press mud Change in biomass, delay in maturation, survival
and hatchlings production
Ramalingam (2001)
Table 2: Contd….
Page 6
20
Earthworms used
Organic materials used
Aspects studied
Author(s)
P. excavatus
L. mauritii
P.elongata
P.corethrurus
Eutyphoeus gammiei
Dichogaster
modiglianii
D.nepalensis
Cow dung, leaf litter and pasture
Morphology, cocoon production, fecundity,
incubation period and hatching pattern
Bhattacharjee and
Chaudhuri (2002)
E. fetida
Wheat straw with or without Pleurotus
sajor-caju , Trichoderma harzianum,
Aspergillus niger and Azotobactor
chroococcum
Growth and cocoon production
Singh and Sharma
(2002)
L. mauritii Farm yard manure, neem seed and neem
cake
Cocoon and hatchling production, hatching
success and hatchlings growth rate
Bakthavathsalam
(2003b)
E. fetida
L. mauritii Municipal solid waste
Change in growth rate, earthworm number,
cocoon number and body weight
Kaviraj and Sharma
(2003)
E. fetida
P. excavatus
Dichogaster bolaui
Forest litters of Tectona grandis (teak)
Madhuca indica (mahua) and Butea
monosperma (palas)
To assess the earthworms efficiency through their
growth rate and population increase Manna et al. (2003)
L.mauritii Paddy chaff and weed plants materials Cocoon production, incubation period, hatching
ability, growth and survival
Bakthavathsalam and
Geetha (2004a)
Table 2: Contd….
Page 7
21
Earthworms used
Organic materials used
Aspects studied
Author(s)
L.mauritii Paddy chaff and weed plants materials Growth and reproduction of F1 hatchlings Bakthavathsalam and
Geetha (2004b)
L.mauritii Cow dung, press mud, paddy chaff
powder and paddy chaff ash
Survival, cocoon production, incubation time,
hatching ability and hatchlings growth rate
Bakthavathsalam and
Ramakrishnan (2004)
E.eugeniae Coconut leaves Efficiency of vermicomposting and production of
earthworm biomass Gopal et al. (2004)
E.eugeniae Press mud Growth rate and biomass production Ramalingam (2004)
E.andrei Pine saw dust, poultry litter, cotton
industry waste and horse manure Biomass and cocoon production Castillo et al. (2005)
P.excavatus Sago wastes and press mud Growth and reproduction Christy and
Ramalingam (2005a)
E.fetida
E.andrei
Cow manure Selection of good species for vermiculture based
on growth and reproduction
Dominguez et al.
(2005)
E.fetida Waste (faeces+urine) of cow, buffalo,
horse, donkey, sheep, goat and camel Growth, sexual maturity and cocoon production Garg et al. (2005a)
Table 2: Contd….
Page 8
22
Earthworms used
Organic materials used
Aspects studied
Author(s)
E.fetida Municipal solid waste Influence of temperature, pH and C/N ratio on the
growth and survival Hou et al. (2005)
E.fetida Cattle and goat manures Growth and reproduction Loh et al. (2005)
Octolasion tyrtaeum Grass, maize and wheat leaves Feeding and casting activities Bisht et al. (2006)
E.fetida
Allolobophora
parva
Putranjiva roxburghii, Pongamia
pinnata, neem leaves, cow dung, biogas
slurry, neem and mustard cake
Biomass and cocoon production Garg et al. (2006a)
L.mauritii Cow dung Sublethal effect of nimbecidine on growth and
reproduction
Ramalingam and
Kavitha (2006)
Hyperiodrilus
euryaulos
Soil substrate, cellulose substrate and
dry neem leaves Growth and reproductive performance
Sogbesan and
Ugwumba (2006)
E.andrei Cow manure Effect of inbreeding and out breeding on cocoon
production
Velando et al.
(2006)
L.mauritii Press mud and cow dung Reproductive influence and hatchlings growth rate Bakthavathsalam
(2007a)
L.mauritii Cow dung Influence of annual rhythm on the cocoon
production under different media
Bakthavathsalam and
Birmanandhi (2007)
L.mauritii Vegetable market wastes Influence of time on the rate of cocoon production
under different media
Bakthavathsalam and
Uthayakumar (2007)
Metaphire posthuma Cow manure and poultry droppings Reproductive potential
Bisht et al. (2007)
Table 2: Contd….
Page 9
23
Earthworms used
Organic materials used
Aspects studied
Author(s)
P.excavatus Paper mill sludge with cow dung and
press mud Growth rate and hatchlings production
Chandran and
Ramalingam (2007a,b)
E.fetida
E.eugeniae
P.excavatus
Cattle manure Growth and reproduction
Meena and Renu
(2007)
Octodrilus
complanatus Cow manure
Weight change, sexual maturation, cocoon
production, incubation period and hatching
success
Monroy et al. (2007)
P.excavatus Press mud Influence of moisture on growth rate, cocoon and
hatchling production Parthasarathi (2007)
E.eugeniae
Cashew leaves, gram waste, urea,
lignolytic fungi and cellulolytic fungi
with cow dung and press mud
Efficiency of growth and reproductive
performance
Raja and Ramalingam
(2007a,b)
E.eugeniae
P.excavatus
P.sansibaricus
Jowar straw, bajra straw, sheep manure,
farm yard manure, kitchen waste and
leaf litter of Magifera indica
Growth and reproductive performance Suthar (2007a)
L.mauritii Cow dung Sublethal effect of monocrotophos on growth and
reproduction Kavitha et al. (2008)
E.fetida
Duck weed from municipal waste water
treatment plant and cattle manure
Total biomass and cocoon production
Kostecka and
Kaniuczak (2008)
Table 2: Contd….
Page 10
24
Earthworms used
Organic materials used
Aspects studied
Author(s)
D.nepalensis
M.houlleti
P.excavatus
Cow manure and oak litter Different modes of cocoon production and life
cycle
Namita and
Madhuri (2008)
P.excavatus
P.sansibaricus Domestic waste (house hold waste) Biomass production and rate of cocoon production
Suthar and Singh
(2008)
E.eugeniae Sheep droppings and paddy straw waste Rate of vermicast production Bakthavathsalam et al.
(2009)
E.eugeniae Green gram waste
Cocoon and hatchling production, incubation
time, hatching success, growth rate of hatchlings
and time of sexual maturity
Jayaseelan and
Bakthavathsalam
(2009a)
E.eugeniae Paddy straw waste
”
Subramaniyan and
Bakthavathsalam
(2009)
P.excavatus Horse manure with bedding materials
(saw dust and shredded news paper) Growth and reproduction Latifah et al. (2009)
E.fetida Lignite fly ash, cow dung and press mud
” Sarojini et al. (2009)
E.eugeniae Coir waste, Eichhornia crassipes, cow
dung and poultry excreta
Rate of cocoon, hatchlings and vermicast
production, incubation time and biomass
production
Bakthavathsalam et al.
(2010c)
Table 2: Contd….
Page 11
25
Earthworms used
Organic materials used
Aspects studied
Author(s)
E.eugeniae Coir waste, water lily, goat droppings
and poultry excreta
Rate of cocoon, hatchlings and vermicast
production, incubation time and biomass
production
Bakthavathsalam et al.
(2010d)
E.eugeniae Polyalthia longifolia Rate of vermicast production
Umamaheswari and
Bakthavathsalam
(2010)
Page 12
Table 30. Measurements of different parameters of chilli plants raised in different PSR doses of water hyacinth vermicompost.
113
PSR
Total
leaves
1
Shoot
height (cm)
2
Total
flowers
3
Total
fruits
4
Fruit
length
(cm)
5
Fruit
perimeter
(cm)
6
Fruits
dry
weight (gm)
7
PWCOS
8
0
40 16.1 6.0 3.5 8.5 2.9 2.233 –
43 27.3 7.5 4.0 8.5 2.9 2.336 4.6
41 16.3 7.5 4.0 8.5 2.9 2.329 4.3
2.5
64 17.8 8.0 3.5 8.5 2.9 2.253 0.9
70 29.2 8.5 4.0 8.6 2.9 2.341 4.9
66 17.9 8.0 4.0 8.5 2.9 2.338 4.7
5
77 18.1 9.0 4.5 8.9 3.2 3.338 49.5
81 30.4 10.0 6.0 9.6 3.3 3.624 62.3
78 18.3 9.5 5.0 9.4 3.2 3.509 57.1
7.5
82 18.2 12.0 7.0 9.5 3.3 4.878 118.5
87 31.8 16.5 10.0
000
9.7 3.3 6.650 197.8
86 18.7 16.0 8.0 9.7 3.3 5.245 134.9
10
115 20.7 14.5 9.5 9.7 3.3 6.692 199.7
122 32.9 19.5 11.0 9.9 3.3 6.975 212.4
119 20.9 18.0 10.0 9.8 3.3 6.778 203.5
15
120 21.5 18.5 10.5 9.8 3.3 6.842 206.4
144 35.8 24.0 11.0 9.9 3.4 7.975 257.1
136 22.2 23.5 11.0 9.9 3.4 7.357 229.5
Table 30 : Contd …
Page 13
Upper, middle and lower row values represent the mean of two plants raised in earthworm unexposed, L.mauritii exposed and P.excavatus
exposed media respectively; 0 - Soil alone; PWCOS = Per cent Weight Change Over Soil.
114
PSR 1 2 3 4 5 6 7 8
20
133 23.1 23.0 13.5 10.0 3.4 8.533 282.1
180 41.0 32.0 20.0 10.1 3.4 13.486 503.9
170 23.9 25.0 15.0 10.0 3.4 9.610 330.4
25
138 24.8 28.0 14.5 10.1 3.4 9.610 330.4
189 42.3 40.5 21.5 10.1 3.4 14.585 553.2
181 26.4 35.5 20.5 10.1 3.4 14.135 533.0
30
220 26.9 30.0 16.0 10.1 3.4 10.080 351.4
236 45.3 55.0 22.5 10.2 3.4 16.153 623.4
220 28.2 40.0 22.0 10.1 3.4 15.760 605.8
40
272 29.4 35.5 19.5 10.2 3.4 12.736 470.4
284 47.0 64.5 27.5 10.4 3.5 19.680 781.3
278 31.3 45.0 24.0 10.2 3.4 16.921 657.8
50
327 36.6 48.0 22.5 10.3 3.4 15.504 594.3
344 49.8 73.0 40.0 10.5 3.5 28.362 1170.1
337 39.0 54.0 30.0 10.4 3.5 21.924 881.8
75
354 47.6 53.5 34.5 10.5 3.4 25.189 1028.0
380 54.0 91.5 46.0 10.7 3.5 34.967 1465.9
363 52.0 89.0 38.0 10.5 3.5 27.555 1133.9
Page 14
Table 31. Measurements of different parameters of chilli plants raised in different PSR doses of paddy waste vermicompost.
115
PSR
Total
leaves
1
Shoot
height (cm)
2
Total
flowers
3
Total
fruits
4
Fruit
length
(cm)
5
Fruit
perimeter
(cm)
6
Fruits
dry
weight (gm)
7
PWCOS
8
0
37 15.5 7.5 3.0 7.9 2.5 1.730 –
41 19.3 10.0 4.0 8.2 2.7 2.313 33.7
41 16.3 8.0 3.5 8.2 2.6 2.150 24.3
2.5
63 15.7 9.0 3.5 8.1 2.6 2.150 24.3
69 20.3 11.0 4.5 8.3 2.7 2.629 51.9
65 16.8 10.5 3.5 8.2 2.7 2.170 25.4
5
70 16.3 10.0 3.5 8.1 2.7 2.187 26.4
74 21.0 14.0 5.5 8.3 2.7 3.260 88.4
71 17.4 12.0 4.0 8.3 2.7 2.314 33.8
7.5
78 16.9 13.0 4.0 8.2 2.7 2.510 45.1
80 22.3 16.5 5.5 8.4 2.7 3.421 97.7
79 18.0 14.5 5.0 8.4 2.7 3.300 90.8
10
85 18.1 16.0 5.0 8.3 2.7 3.165 82.9
91 24.1 19.5 6.5 8.4 2.7 3.932 127.3
89 19.1 18.0 6.5 8.4 2.7 3.375 95.1
15
121 19.3 17.0 5.0 8.3 2.7 3.305 91.0
129 25.0 23.0 8.5 8.5 2.7 5.530 219.7
123 20.3 20.0 7.0 8.5 2.7 4.237 144.9
Table 31 : Contd …
Page 15
Upper, middle and lower row values represent the mean of two plants raised in earthworm unexposed, L.mauritii exposed and P.excavatus
exposed media respectively; 0 - Soil alone; PWCOS = Per cent Weight Change Over Soil.
116
PSR 1 2 3 4 5 6 7 8
20 131 21.6 20.0 8.0 8.3 2.7 5.270 204.6
145 25.8 26.0 11.5 8.6 2.8 7.475 332.1
137 21.9 25.5 10.0 8.6 2.7 6.351 267.1
25 139 23.2 25.5 10.5 8.7 2.7 6.636 283.6
156 28.6 30.5 17.0 8.9 2.8 11.355 556.4
151 24.2 27.5 12.5 8.9 2.8 8.536 393.4
30 179 27.9 30.0 13.5 8.8 2.8 8.782 407.6
207 33.7 33.0 18.0 8.9 2.9 12.045 596.2
183 30.7 31.0 15.0 8.9 2.8 10.215 490.5
40 216 32.3 35.0 18.0 9.0 2.9 12.560 626.0
260 41.9 36.5 24.0 9.4 3.0 16.040 827.2
249 35.2 36.0 21.5 9.1 3.0 14.362 730.2
50 251 37.0 42.0 26.5 9.2 3.0 19.225 1011.3
276 49.4 48.0 33.0 9.4 3.1 23.430 1254.3
256 39.3 43.0 31.0 9.4 3.1 22.018 1172.7
75 278 40.2 46.5 32.0 9.3 3.0 22.590 1205.8
326 52.2 62.5 38.5 9.9 3.2 27.720 1502.3
313 45.7 53.0 35.0 9.7 3.2 25.202 1356.8
Page 16
Table 32. Measurements of different parameters of chilli plants raised in different PSR doses of cow dung vermicompost.
117
PSR
Total
leaves
1
Shoot
height (cm)
2
Total
flowers
3
Total
fruits
4
Fruit
length
(cm)
5
Fruit
perimeter
(cm)
6
Fruits
dry
weight (gm)
7
PWCOS
8
0
38 16.4 8.5 2.5 7.3 2.4 1.660 –
41 19.8 11.0 4.0 7.5 2.5 2.429 46.3
40 16.4 10.0 3.5 7.4 2.5 2.340 40.9
2.5
66 17.7 11.0 4.0 7.5 2.5 2.293 38.1
78 20.4 15.5 4.5 7.8 2.6 2.792 68.2
71 18.0 13.5 4.0 7.7 2.6 2.493 50.2
5
75 17.3 11.5 4.5 7.6 2.6 2.842 71.2
88 20.7 18.5 5.5 8.0 2.6 3.354 102.0
82 18.2 14.5 5.0 7.9 2.6 3.175 91.3
7.5
94 18.1 13.5 6.5 7.7 2.6 4.035 143.1
113 22.4 20.0 7.5 8.1 2.6 4.805 189.5
98 18.3 16.0 6.5 7.9 2.6 4.172 151.3
10
117 18.8 19.0 9.0 7.8 2.6 5.892 254.9
131 24.0 22.0 11.0 8.4 2.7 6.823 311.0
122 19.0 19.0 10.5 8.2 2.7 6.728 305.3
15
126 19.0 22.0 10.5 7.9 2.7 6.783 308.6
149 25.6 25.5 12.5 8.8 2.9 7.875 374.4
139 19.1 23.5 11.0 8.4 2.8 7.162 331.4
Table 32 : Contd …
Page 17
Upper, middle and lower row represent the mean of two plants raised in earthworm unexposed, L.mauritii exposed and P.excavatus
exposed media respectively; 0 - Soil alone; PWCOS = Per cent Weight Change Over Soil.
118
PSR 1 2 3 4 5 6 7 8
20
146 19.3 25.0 13.0 8.1 2.7 8.255 397.3
175 27.7 27.0 14.5 9.1 3.0 9.464 470.1
162 19.9 26.0 13.5 8.6 2.8 8.778 428.8
25
166 19.4 26.0 14.5 8.1 2.8 9.570 476.1
188 29.6 32.0 16.0 9.4 3.2 10.454 529.8
179 19.9 28.0 15.5 9.0 3.0 9.889 495.7
30
182 25.6 31.0 20.0 8.2 3.0 13.358 704.7
211 34.8 34.0 21.0 9.7 3.4 15.987 863.1
199 25.9 34.0 20.5 9.4 3.2 13.440 709.6
40
196 26.5 38.0 23.0 8.9 3.2 14.835 793.7
233 43.4 39.0 23.5 9.9 3.7 23.790 1333.1
224 26.9 39.0 23.5 9.7 3.4 15.755 849.1
50
235 26.8 44.0 30.0 9.4 3.4 19.858 1096.3
258 51.0 51.0 33.5 10.1 3.8 23.790 1333.1
253 26.9 47.0 30.5 10.1 3.6 21.269 1181.3
75
375 32.8 53.0 33.3 9.8 3.5 22.114 1232.2
384 53.7 63.0 37.0 10.4 3.8 24.840 1396.4
375 35.3 56.0 34.5 10.2 3.6 24.495 1375.6
Page 18
Table 33. Measurements of different parameters of chilli plants raised in different PSR doses of organic mixture vermicompost.
119
PSR
Total
leaves
1
Shoot height
(cm)
2
Total
flowers
3
Total
fruits
4
Fruit
length
(cm)
5
Fruit
perimeter
(cm)
6
Fruits
dry
weight (gm)
7
PWCOS
8
0
37 16.1 8.5 3.5 8.4 2.9 2.050 –
42 16.8 13.5 3.5 8.5 2.9 2.410 17.6
44 16.2 10.5 3.5 8.5 2.9 2.147 4.7
2.5
59 16.7 11.0 4.0 8.5 2.9 2.269 10.7
76 17.0 21.5 4.0 8.6 2.9 2.420 18.0
66 16.9 15.5 4.0 8.5 2.9 2.410 17.6
5
71 17.6 17.0 5.0 8.6 3.0 3.081 50.3
89 17.9 28.0 6.0 8.8 3.1 3.425 67.1
80 17.8 19.0 5.0 8.7 3.1 3.275 59.8
7.5
87 18.4 18.0 6.5 9.0 3.1 3.694 80.2
118 19.3 32.5 11.5 9.3 3.2 7.592 270.3
109 18.5 23.5 7.0 9.2 3.2 4.560 122.4
10
121 19.0 23.5 9.0 9.4 3.2 5.955 190.5
137 22.3 33.0 11.5 9.5 3.3 7.707 275.9
134 20.0 26.0 10.0 9.4 3.2 6.325 208.5
15
164 19.2 26.5 10.0 9.5 3.3 6.500 217.1
172 23.4 51.5 13.0 9.6 3.3 8.712 324.9
170 23.4 40.0 11.5 9.5 3.3 7.705 275.9
Table 33 : Contd . . .
Page 19
Upper, middle and lower row values represent the mean of two plants raised in earthworm unexposed, L.mauritii exposed and P.excavatus
exposed media respectively; 0 - Soil alone; PWCOS = Per cent Weight Change Over Soil.
120
PSR 1 2 3 4 5 6 7 8
20
196 19.9 28.0 12.5 9.5 3.3 8.180 299.0
219 25.4 50.0 18.0 9.7 3.4 12.240 497.1
218 24.2 40.0 13.0 9.6 3.3 8.720 325.4
25
239 21.0 32.5 16.0 9.6 3.4 10.585 416.3
259 32.8 54.5 18.0 9.8 3.4 12.243 497.2
249 27.6 46.0 17.5 9.7 3.4 12.171 493.7
30
269 21.8 39.0 16.5 9.8 3.4 10.755 424.6
283 40.1 60.5 18.5 10.1 3.4 12.592 514.2
272 31.2 54.0 18.0 9.9 3.4 12.494 509.5
40
293 25.0 47.0 21.0 9.9 3.5 14.070 586.3
310 42.6 67.0 29.0 10.2 3.5 20.155 883.2
305 35.9 55.0 29.0 10.0 3.5 14.837 623.8
50
327 31.5 54.0 28.5 9.9 3.5 19.095 831.5
344 47.0 70.5 33.0 10.3 3.6 23.180 1030.7
340 43.0 58.0 31.0 10.2 3.6 22.015 973.9
75
378 37.5 56.0 33.0 10.3 3.6 22.112 978.6
395 50.1 76.5 37.0 10.5 3.7 26.642 1199.6
386 45.7 62.0 34.0 10.3 3.6 24.122 1076.7
Page 20
103
Table 26. Levels of macro and micronutrients present in the samples of partly
decomposed (PD), L.mauritii exposed (LME) and P.excavatus exposed (PEE)
water hyacinth materials.
Mean S.D. of 6 samples; a - Significant (P<0.01) over PD sample;
b - Significant (P< 0.05) over PD sample; c - Not significant (P> 0.05) over PD sample.
Parameters PD LME PEE
pH 8.23 0.31 7.61 0.21
a 7.15 0.38
a
EC(dSm-1
) 0.34 0.04 0.22 0.02 a 0.12 0.02
a
OC (%) 15.16 1.97 16.38 1.44 c 15.85 1.85
c
TN (%) 0.80 0.03 0.96 0.01 a 0.92 0.01
a
TP (%) 0.70 0.04 0.78 0.02 a 0.76 0.02
a
TK (%) 0.64 0.02 0.70 0.02 a 0.67 0.04
c
TNa (%) 0.07 0.02 0.08 0.02 c 0.07 0.01
c
TCa (%) 0.39 0.02 0.39 0.03 c 0.35 0.02
a
C:N ratio 18.92 2.13 17.05 1.43 c 17.22 2.03
c
Fe (ppm) 2.35 0.24 2.55 0.16 c 1.48 0.16
a
Mn (ppm) 1.58 0.01 1.68 0.02 a 1.38 0.04
c
Zn (ppm) 1.36 0.03 1.66 0.06 a 1.53 0.05
a
Cu (ppm) 1.28 0.03 1.46 0.02 a 1.42 0.08
a
Page 21
102
Table 25. Levels of macro and micronutrients present in the samples of earthworm
unexposed (EU), L.mauritii exposed (LME) and P.excavatus exposed (PEE) soil used in
chilli cultivation.
Mean S.D. of 6 samples; a - Significant (P<0.01) over EU sample;
b - Significant (P< 0.05) over EU sample; c - Not significant (P> 0.05) over EU sample.
Parameters EU LME PEE
pH 8.43 0.12 7.70 0.23
a 7.48 0.06
a
EC(dSm-1
) 0.48 0.13 0.23 0.02 a 0.13 0.01
a
OC (%) 0.85 0.03 1.24 0.03 a 1.16 0.04
a
TN (%) 0.57 0.04 0.70 0.04 a 0.67 0.02
a
TP (%) 0.37 0.05 0.45 0.03 a 0.26 0.04
a
TK (%) 0.24 0.03 0.33 0.03 a 0.28 0.03
b
TNa (%) 0.05 0.01 0.07 0.01 a 0.06 0.01
c
TCa (%) 0.13 0.01 0.31 0.03 a 0.29 0.01
a
C:N ratio 1.48 0.10 1.76 0.11 a 1.69 0.06
a
Fe (ppm) 2.65 0.09 2.70 0.12 c 2.66 0.01
c
Mn (ppm) 1.23 0.20 1.46 0.02 b 1.40 0.02
b
Zn (ppm) 1.25 0.12 1.59 0.11 a 1.42 0.13
b
Cu (ppm) 1.14 0.01 1.29 0.01 a 1.20 0.02
a
Page 22
104
Table 27. Levels of macro and micronutrients present in the samples of partly
decomposed (PD), L.mauritii exposed (LME) and P.excavatus exposed (PEE) paddy waste
materials.
Mean S.D. of 6 samples; a - Significant (P<0.01) over PD sample;
b - Significant (P< 0.05) over PD sample; c - Not significant (P> 0.05) over PD sample.
105
Parameters PD LME PEE
pH 7.95 0.22 7.38 0.25
a 7.01 0.35
a
EC(dSm-1
) 0.28 0.04 0.16 0.02 a 0.09 0.01
a
OC (%) 12.65 1.00 15.66 0.94 a 14.70 0.68
a
TN (%) 0.65 0.02 0.77 0.01 a 0.71 0.03
a
TP (%) 0.45 0.03 0.54 0.02 a 0.50 0.01
a
TK (%) 0.45 0.03 0.48 0.02 b 0.48 0.02
b
TNa (%) 0.05 0.01 0.04 0.01 b 0.03 0.01
a
TCa (%) 0.25 0.01 0.34 0.02 b 0.30 0.01
a
C:N ratio 19.50 2.01 20.20 1.14 c 20.68 1.19
c
Fe (ppm) 2.44 0.17 2.48 0.13 c 2.46 0.13
c
Mn (ppm) 1.37 0.02 1.54 0.07 a 1.46 0.01
a
Zn (ppm) 1.44 0.03 1.70 0.02 a 1.59 0.08
a
Cu (ppm) 1.38 0.01 1.62 0.02 a 1.54 0.03
a
Page 23
105
Table 28. Levels of macro and micronutrients present in the samples of partly
decomposed (PD), L.mauritii exposed (LME) and P.excavatus exposed (PEE) cow dung.
Mean S.D. of 6 samples; a - Significant (P<0.01) over PD sample;
b - Significant (P< 0.05) over PD sample; c - Not significant (P> 0.05) over PD sample.
Parameters PD LME PEE
pH 8.26 0.35 7.56 0.36
a 7.16 0.26
a
EC(dSm-1
) 0.32 0.03 0.19 0.05 a 0.10 0.02
a
OC (%) 17.68 0.84
19.18. 1.15 b 18.82 0.89
b
TN (%) 0.81 0.01 0.92 0.01 a 0.90 0.01
a
TP (%) 0.65 0.01 0.70 0.02 a 0.68 0.02
a
TK (%) 0.63 0.02 0.68 0.01 a 0.64 0.02
c
TNa (%) 0.05 0.01 0.04 0.01 a 0.03 0.01
a
TCa (%) 0.30 0.03 0.42 0.01 a 0.36 0.01
a
C:N ratio 21.64 0.80 20.84 1.24 c 20.91 1.03
c
Fe (ppm) 2.65 0.07 2.72 0.07 c 2.68 0.06
c
Mn (ppm) 1.51 0.05 1.59 0.02 a 1.49 0.02
c
Zn (ppm) 2.50 0.15 2.55 0.04 c 2.48 0.06
c
Cu (ppm) 1.41 0.02 1.66 0.03 a 1.58 0.02
a
Page 24
106
Table 29. Levels of macro and micronutrients present in the samples of partly
decomposed (PD), L.mauritii exposed (LME) and P.excavatus exposed (PEE)
organic mixtures .
Mean S.D. of 6 samples; a - Significant (P<0.01) over PD sample;
b -Significant (P< 0.05) over PD sample; c - Not significant (P> 0.05) over PD sample.
Parameters PD LME PEE
pH 8.20 0.00 7.21 0.06
a 7.28 0.06
a
EC(dSm-1
) 0.34 0.01 0.23 0.02 a 0.10 0.05
a
OC (%) 14.23 0.75 17.32 1.05 a 16.12 0.67
a
TN (%) 0.70 0.04 0.80 0.03 a 0.78 0.01
a
TP (%) 0.53 0.01 0.60 0.02 a 0.58 0.02
c
TK (%) 0.58 0.06 0.56 0.01 c 0.56 0.00
c
TNa (%) 0.06 0.01 0.06 0.01 c 0.03 0.01
a
TCa (%) 0.30 0.04 0.38 0.02 a 0.38 0.02
a
C:N ratio 20.20 1.50 21.71 1.89 c 20.59 1.02
c
Fe (ppm) 2.48 0.04 2.56 0.04 a 2.48 0.06
c
Mn (ppm) 1.40 0.03 1.50 0.03 a 1.44 0.00
a
Zn (ppm) 1.87 0.05 2.22 0.13 a 2.07 0.20
b
Cu (ppm) 1.40 0.03 1.62 0.02 a 1.56 0.02
a
Page 25
Table 13. Measurements of length (mm), body weight (mg) and growth rate (mg/day) of F1 hatchlings of L.mauritii kept in different PSR doses of partly
decomposed water hyacinth upto their clitellum formation.
The first value of PSR columns represents the length (Mean S.D.) of 12 worms; Values in parenthesis indicate mean weight of 12 worms; Values in bold
letters indicate growth rate arrived on the basis of previous body weight values; AC = Appearance of Clitellum; OGR = Overall Growth
Rate;*Measurements were made only in 8 hatchlings.
80
Days
0 PSR*
10 PSR
20 PSR
30 PSR
40 PSR
50 PSR
75 PSR
100 PSR
0 9 0 (18) 16 1 (16) 13 2 (17) 13 1 (18) 13 1 (20) 14 1 (20) 13 2 (21) 14 2 (24)
10 23 1 (84) 6.6 25 1 (38) 2.2 24 2 (79) 6.2 25 1 (98) 8.0 25 1 (150) 13.0 25 2 (166) 14.6 26 2 (166) 14.5 27 2 (187) 16.3
20 30 2 (197) 11.3 35 2 (236) 19.8 37 4 (243) 16.4 37 3 (260) 16.2 38 3 (308) 15.8 38 3 (333) 16.7 40 2 (350) 18.4 41 2 (356) 16.9
30 12 4 (94) –10.3 46 3 (291) 5.5 46 2 (363) 12.0 47 4 (368) 10.8 47 2 (412) 10.4 48 2 (483) 15.0 49 1 (500) 15.0 52 1 (533) 17.7
40 Died 54 2 (416) 12.5 57 3 (490) 12.7 59 3 (596) 22.8 61 3 (601) 18.9 61 2 (633) 15.0 63 2 (672) 17.2 67 3 (683) 15.0
50 – 61 1 (520) 10.4 61 1 (625) 13.5 63 2 (750) 15.4 67 3 (750) 14.9 70 3 (800) 16.7 72 2 (833) 16.1 82 3 (851) 16.8
60 – 73 2 (708) 18.8 79 2 (741) 11.6 80 2 (825) 7.5 82 2 (825) 7.5 85 2 (848) 4.8 86 5 (933) 10.0 92 5 (950) 9.9
70 – 86 4 (733) 2.5 86 3 (781) 4.0 90 5 (862) 3.7 – – – –
AC(days) – 70 – 73
70 – 73
70 – 73 63 – 68 63 – 68 63 – 68 60 – 63
OGR – 10.24
10.91 12.06 13.41 13.80 15.2 15.43
Page 26
Table 19. Measurements of length (mm), body weight (mg) and growth rate (mg/day) of F1 hatchlings of L.mauritii kept in different PSR doses of partly
decomposed organic mixture upto their clitellum formation.
The first value of PSR columns represents the length (Mean S.D.) of 12 worms; Values in parenthesis indicate mean weight of 12 worms; Values in bold
letters indicate growth rate arrived on the basis of previous body weigh values; AC = Appearance of Clitellum; OGR = Overall Growth Rate.
86
Days 0 PSR
10 PSR
20 PSR
30 PSR
40 PSR
50 PSR
75 PSR
100 PSR
0 11 1 (13) 14 1 (16) 13 1 (19) 13 1 (19) 13 1 (20) 14 1 (20) 14 8 (20) 14 1 (21)
10 14 3 (90) 7.7
20 1 (166) 15.0 21 1 (175) 15.6 21 1 (183) 16.4 22 2 (191) 17.1 23 1 (191) 17.1 25 1 (201) 18.1 25 1 (208) 18.7
20 18 3 (178) 8.8 33 2 (266) 10.0 35 0 (291) 11.6 35 1 (316) 13.3 36 2 (333) 14.2 37 4 (350) 15.9 38 3 (370) 16.9 45 5 (375) 16.7
30 7 2 (6) – 17.2 43 2 (350) 8.4 45 1 (416) 12.5 45 2 (445) 12.9 47 3 (475) 14.2 49 1 (501) 15.1 49 2 (516) 14.6 56 4 (541) 16.6
40 Died 47 1 (416) 6.6 50 3 (625) 20.9 50 1 (641) 19.6 54 2 (666) 19.1 55 2 (691) 19.0 57 1 (708) 19.2 60 4 (733) 19.2
50 – 52 1 (483) 6.7 56 2 (775) 15.0 56 2 (816) 17.5 60 4 (833) 16.7 63 1 (850) 15.9 64 3 (858) 15.0 65 3 (875) 14.2
60 – 68 2 (550) 6.7 69 2 (833) 5.8 70 2 (858) 4.2 74 2 (866) 3.3 74 2 (916) 6.6 77 2 (925) 6.7 79 3 (950) 7.5
70 – 74 1 (750) 20.0 76 3 (916) 8.3 78 2 (933) 7.5 – – – – AC(days) – 70 – 78 70 – 76 70 – 74 63 – 68 63 – 68 60 – 66 60 – 65
OGR – 10.48 12.31 13.05 14.10 14.93 15.08 15.48
Page 27
Table 15. Measurements of length (mm), body weight (mg) and growth rate (mg/day) of F1 hatchlings of L.mauritii kept in different PSR doses of
partly decomposed paddy waste upto their clitellum formation.
The first value of PSR columns represents the length (Mean S.D.) of 12 worms; Values in parenthesis indicate mean weight of 12 worms; Values in
bold letters indicate growth rate arrived on the basis of previous body weight values; AC = Appearance of Clitellum; OGR = Overall Growth Rate.
82
Days
0 PSR 10 PSR 20 PSR 30 PSR 40 PSR 50 PSR 75 PSR 100 PSR
0 1 1 (13) 13 1 (16) 13 1 (16) 13 1 (17) 13 1 (16) 13 1 (16) 13 1 (17) 14 2 (18)
10 22 2 (61) 4.8 21 1 (166) 15.0 13 1 (166) 15.0 22 1 (160) 14.3 23 1 (60) 14.4 24 1 (183) 16.7 25 1 (190) 17.3 25 1 (204) 18.6
20 33 2 (93) 3.2 32 2 (266) 10.0 34 1 (266) 10.0 35 1 (275) 11.5 36 2 (281) 12.1 38 2 (291) 10.8 38 4 (308) 11.8 45 3 (333) 12.9
30 17 5 (14) –7.9 42 1 (437) 17.1 44 1 (441) 17.5 44 2 (454) 17.9 47 3 (462) 18.1 50 2 (483) 19.2 52 2 (508) 20.0 55 3 (516) 18.3
40 Died 46 2 (626) 18.9 51 3 (633) 19.2 50 1 (645) 19.1 56 2 (666) 20.4 56 2 (666) 18.3 57 1 (691) 18.3 61 4 (708) 19.2
50 – 46 3 (741) 11.5 55 1 (750) 11.7 56 2 (764) 11.9 61 4 (785) 11.9 64 1 (808) 14.2 63 3 (833) 14.2 66 3 (858) 15.0
60 – 65 1 (833) 9.2 69 2 (841) 9.1 70 2 (858) 9.4 74 2 (866) 8.1 76 2 (891) 8.3 79 3 (958) 12.5 79 3 (960) 10.2
70 – 73 1 (883) 5.0 74 2 (900) 5.9 78 3 (916) 5.8 – – – –
AC(days) – 72 – 78 70 – 75 70 – 75 60 – 67 60 – 67 60 – 67 60 – 63
OGR – 12.38 12.62 12.84 14.16 14.58 15.68 15.70
Page 28
Table 17. Measurements of length (mm), body weight (mg) and growth rate (mg/day) of F1 hatchlings of L.mauritii kept in different PSR doses of
partly decomposed cow dung upto their clitellum formation.
The first value of PSR columns represents the length (Mean S.D.) of 12 worms; Values in parenthesis indicate mean weight of 12 worms; Values in
bold letters indicate growth rate arrived on the basis of previous body weight values; AC = Appearance of Clitellum; OGR = Overall Growth Rate.
84
Days
0 PSR
10 PSR
20 PSR
30 PSR
40 PSR
50 PSR
75 PSR
100PSR
0 9 1 (14) 13 1 (17) 13 1 (18) 14 1 (18) 14 1 (18) 14 1 (20) 14 1 (18) 15 1 (18)
10 15 2 (128) 11.4 24 1 (166) 14.9 22 1 (166) 14.8 23 1 (191) 17.3 24 2 (200) 18.2 25 1 (208) 18.8 24 1 (191) 17.3 23 1 (175) 15.7
20 19 2 (178 ) 5.0 33 2 (233) 6.7 33 2 (250) 8.4 44 1 (266) 7.5 43 4 (283) 8.3 46 3 (325) 11.7 42 2 (291) 10.0 33 1 (266) 9.1
30 0. 8 1 (6) – 17.2 41 1 (375) 14.2 46 3 (423) 17.3 51 1 (433) 16.7 53 3 (458) 17.5 57 3 (491) 16.6 46 5 (450) 15.9 41 2 (433) 16.7
40 Died
47 2 (458) 8.3 55 2 (583) 16.0 58 2 (600) 16.7 63 2 (620) 16.2 66 2 (633) 14.2 61 3 (610) 16.0 56 3 (608) 17.5
50 – 55 1 (566) 10.8 62 1 (683) 10.0 69 2 (791) 19.1 74 1 (812) 19.2 77 3 (816) 18.3 70 5 (800) 19.0 63 2 (787) 17.9
60 – 65 1 (633) 6.7 67 2 (833) 15.0 73 2 (916) 12.5 77 2 (933) 12.1 78 2 (941) 12.5 75 4 (925) 12.5 72 2 (920) 13.3
70 – 74 2 (741) 10.8 73 2 (908) 7.5 77 2 (920) 0.4 – –
–
–
80 – 78 1 (791) 5.0 –
–
–
–
–
–
AC(days) – 71 – 80 70 – 73
70 – 72 63 – 69 62 – 67 62 – 67 62 – 67
OGR – 9.67 12.71 12.88 15.25 15.35 15.11 15.03
Page 29
Table 20. Measurements of length (mm), body weight (mg) and growth rate (mg/day) of F1 hatchlings of P.excavatus kept in different PSR doses of
partly decomposed organic mixture upto thier clitellum formation.
The first value of PSR columns represents the length (Mean S.D.) of 12 worms; Values in parenthesis indicate mean weight of 12 worms; Values in
bold letters indicate growth rate arrived on the basis of previous body weight values; AC = Appearance of Clitellum; OGR = Overall Growth Rate; *
Measurements were made only in 11 hatchlings.
87
Days 0 PSR* 10 PSR 20 PSR 30 PSR 40 PSR 50 PSR 75 PSR 100 PSR
0 10 1 (4) 14 1 (5) 14 1 (5) 13 1 (5) 14 1 (6) 14 1 (5) 13 1 (6) 12 1 (6)
10 14 2 (14) 1.0 24 1 (150) 14.5 25 1 (175) 17.0 23 1 (191) 18.6 24 2 (200) 19.4 25 1 (200) 19.5 25 0 (225) 21.9 24 2 (237) 23.1
20 21 3 (152) 13.8 32 1 (358) 20.8 33 1 (358) 18.3 36 2 (375) 18.4 35 3 (391) 19.1 38 4 (416) 21.6 48 1 (470) 24.5 48 1 (483) 24.6
30 9 2 (25) – 12.7 42 1 (391) 3.3 45 1 (400) 4.2 47 1 (416) 4.1 56 2 (433) 4.2 57 1 (458 ) 4.2 77 4 (641) 17.1 79 3 (658) 17.5
40 Died
57 1 (450) 5.9 64 2 (458 ) 5.8 70 2 (608) 19.2 71 3 (625) 19.2 74 3 (641) 18.3 – –
50 – 68 1 (600) 15.0 68 1 (600) 14.2 – – – – –
AC(days) – 50 – 55 50 – 55 40 – 47 40 – 45 40 – 45 30 – 38 30 – 35
OGR OGR – 11.90 11.90 15.07 15.47 15.90 21.16 21.73
Page 30
Table 16. Measurements of length (mm), body weight (mg) and growth rate (mg/day) of F1 hatchlings of P.excavatus kept in different PSR doses of
partly decomposed paddy waste upto thier clitellum formation.
The first value of PSR columns represents the length (Mean S.D.) of 12 worms; Values in parenthesis indicate mean weight of 12 worms; Values in
bold letters indicate growth rate arrived on the basis of previous body weight values; AC = Appearance of Clitellum; OGR = Overall Growth Rate; *
Measurements were made only in 7 hatchlings.
83
Days 0 PSR* 10 PSR 20 PSR 30 PSR 40 PSR 50 PSR 75 PSR 100 PSR
0 7 1 (2)
11 1 (3) 11 1 (3) 11 1 (3) 11 1 (3) 11 1 (3) 11 1 (4) 13 1 (4)
10 16 1 (8) 0.6
20 1 (116) 8.0 22 1 (118) 11.5 23 1 (120) 11.7 24 1 (125) 12.2 25 1 (133) 13.0 27 1 (133) 12.9 28 1 (141) 13.7
20 24 1 (12) 0.4
31 1 (175) 5.9 34 1 (191) 7.3 40 3 (216) 9.6 47 1 (233 ) 10.8 53 2 (258) 12.5 53 3 (300) 16.7 56 5 (316) 17.5
30 7 1 (4) – 0.8
43 2 (416) 24.1 46 2 (450) 25.9 53 1 (466) 25.0 57 2 (558 ) 32.5 75 1 (600) 34.2 75 3 (616) 31.6 75 3 (625) 30.9
40 Died 48 3 (466) 5.0 52 2 (479) 2.5 72 2 (491) 2.5 74 2 ( 583 ) 2.5 – – –
50 – 59 3 (479) 1.3
68 1 (483 ) 4.0 – – – – –
AC(days) – 50 – 5 8 50 – 55 40 – 45 40 – 45 30 – 35 30 – 35 30 – 35
OGR – 9.52 9.60 12.20 14.50 19.90 20.40 20.70
Page 31
Table 14. Measurements of length (mm), body weight (mg) and growth rate (mg/day) of F1 hatchlings of P.excavatus kept in different PSR doses of
partly decomposed water hyacinth upto their clitellum formation.
The first value of PSR columns represents the length (Mean S.D.) of 12 worms; Values in parenthesis indicate mean weight of 12 worms; Values in
bold letters indicate growth rate arrived on the basis of previous body weight values; AC = Appearance of Clitellum; OGR = Overall Growth Rate.
81
Days 0 PSR
10 PSR
20 PSR
30 PSR
40 PSR
50 PSR
75 PSR
100 PSR
0 13 0 (3) 13 1 (5) 14 1 (5) 14 1 (5) 15 1 (5) 14 1 (7) 14 1 (7) 15 1 (7)
10 17 2 (4) 0.1
23 2 (91) 8.6 21 1 (110) 10.5 21 2 (112) 10.7 21 1 (120) 11.5 22 1 (120) 11.3 26 2 (133) 12.6 26 2 (150) 14.3
20 20 5 (40) 3.6
32 1 (141) 5.0 32 2 (175 ) 6.5 33 2 (191) 7.9 35 1 (208) 8.8 34 1 (233) 11.3 45 2 (316) 18.3 51 5 (333) 18.3
30 13 13 5 (14) – 2.6
45 2 (229) 8.8 44 3 (250) 7.5 47 1 (275) 8.4 51 3 (291) 8.3 55 1 (291) 5.8 72 4 (625) 30.9 74 2 (650) 31.7
40 Died 61 1 (470) 24.1 58 3 (500) 25.0 65 5 (591) 31.6 70 3 (604) 31.3 70 4 (616) 32.5 – –
50 –
-- 63 1 (533) 6.3 65 2 (541) 4.1 –
–
–
–
–
CF( AC(days) – 50 – 55 50 – 55 40 – 46 40 – 46 40 – 46 30 – 35 30 – 35
OGR – 10.56 10.72 14.65 14.97 15.22 20.60 21.43
Page 32
Table 18.Measurements of length (mm), body weight (mg) and growth rate (mg/day) of F1 hatchlings of P.excavatus kept in different PSR doses of
partly decomposed cow dung upto thier clitellum formation.
The first value of PSR columns represents the length (Mean S.D.) of 12 worms; Values in parenthesis indicate mean weight of 12 worms; Values
in bold letters indicate growth rate arrived on the basis of previous body weight values; AC = Appearance of Clitellum; OGR = Overall Growth Rate;
* Measurements were made only in 11 hatchlings.
85
Days 0PSR* 10 PSR 20 PSR 30 PSR 40 PSR 50 PSR 75 PSR 100 PSR
0 11 1 (4) 13 1 (5) 13 1 (5) 13 1 (5) 13 1 (6) 14 1 (5) 14 1 (6) 13 1 (6)
10 21 1 (10) 0.6 22 1 (120) 11.5 23 2 (145) 14.0 22 1 (162) 15.7 23 1 (166) 16.0 25 1 (176) 17.1 25 1 (183) 17.7 27 1 (186) 18.0
20 31 2 (15) 0.5 32 2 (208) 8.8 32 1 (231) 8.6 35 1 (291) 12.9 35 2 (316) 15.0 47 1 (350) 17.4
47 1 (370) 18.7 48 1 (375) 18.9
30 12 2 (9) – 0.6 41 1 (391) 18.3 43 2 (420) 18.9 55 3 (516) 22.5 55 1 (525) 20.9 77 1 (616) 26.6 77 3 (633) 26.3 78 2 (650) 27.5
40 Died 5 59 1 (470) 10.5 63 2 (490) 7.0 71 3 (587) 7.1 73 4 (600) 7.5 – – –
50 – 66 1 (576) 10.5 67 1 (583) 9.3 – – – – –
AC(days) – 50 – 58 50 – 56 40 – 47 40 – 45 30 – 35 30 – 35 30 – 35
OGR – 11.42 11.56 14.55 14.85 20.36 20.90 21.46
Page 33
67
Table 5. Rate of cocoon and hatchling production, hatching success, incubation time (IT) and the body weight (gm) change of adult L.mauritii kept in
different per cent substrate ratio (PSR) doses of partly decomposed water hyacinth for 30 days.
Period 0 PSR 10 PSR 20 PSR 30 PSR 40 PSR 50 PSR 75 PSR 100 PSR
Initial – (0) 65 – (0) 67 – (0) 65 – (0) 66 – (0) 71 – (0) 66 – (0) 65 – (0) 69
After 6 day 0 (0) 66 0 (0) 67 0 (0) 65 0 (0) 66 0 (0) 74 0 (0) 67 0 (0) 62 0 (0) 68
After12 day 0.5 0.3 (3) 68 1.1 0.5 (7) 69 1.5 0.6 (9) 67 2.1 1.3 (13) 68 2.5 0.9 (15) 73 3.8 1.3 (23) 68 4.1 1.3 (25) 67 4.6 1.3 (28) 80
After18 day 0.8 0.6 (5) 67 3.6 0.9 (21) 69 4.1 0.9 (25) 69 6.6 2.9 (40) 75 7.3 1.4 (44) 76 8.0 2.1 (48) 72 10.0 2.9 (60) 77 11.0 2.7 (66) 72
After 24 day 0.1 0.3 (1) 52 3.5 1.1 (21) 66 4.3 0.7 (26) 66 5.1 0.9 (31) 73 10.0 1.5 (60) 80 17.3 2.2 (104) 70 19.3 3.7 (116) 67 20.0 3.4 (121) 73
After 30 day 0.5 0.6 (3) 58 2.1 1.3 (13) 64 3.5 0.5 (21) 60 5.1 1.4 (31) 68 15.3 2.2 (92) 68 25.8 5.2 (155) 71 29.0 4.0 (174) 68 31.1 3.5 (187) 74
TC PWC (12 ) – 10.8 (62 ) – 4.4 (81) b – 7.6 (115) b + 3.0 (211) a – 4.2 (330) c + 7.5 (375) d + 4.6 (402) e + 7.2
C/W/D 0.006 0.028 0.037 0.052 0.097 0.152 0.173 0.186
TH 8 50 76 97 188 305 361 408
HC
UC
UC 8 4 50 12 72 9 93 22 186 25 299 31 345 30 374 28
PHS 66.7 80.6 88.9 80.9 88.2 90.6 92.0 93.0
IT (days) 10 – 13 20 – 23 20 – 23 20 – 23 21 – 23 21 – 23 21 –
23 21 – 23
H/C 0.67 0.81 0.94 0.84 0.89 0.92 0.96 1.01
Values in front of brackets are Mean S.D. of cocoons collected from 6 pots; Values in brackets are total cocoons collected from 72 earthworms kept in
6 pots; Values in bold letters are total body weight of 72 earthworms; TC = Total Cocoons; PWC = Per cent Weight Change;
C/W/D = Cocoon/Worm/Day; TH = Total Hatchlings; HC = Hatched Cocoons; UC = Unhatched Cocoons; PHS = Per cent Hatching Success;
H/C = Hatchling/Cocoon; Out of total cocoons collected, a, b, c, d and e represents 2, 4, 6, 16 and 34 cocoons respectively produced 2 hatchlings/cocoon
while hatching.
Page 34
68
Table 6. Rate of cocoon and hatchling production, hatching success, incubation time (IT) and the body weight (gm) change of adult P.excavatus kept in
different PSR doses of partly decomposed water hyacinth for 30 days.
Period 0 PSR 10 PSR 20 PSR 30 PSR 40 PSR 50 PSR 75 PSR 100 PSR
Initial – (0) 75 – (0) 79 – (0) 76 – (0) 78 – (0) 73 – (0) 76 – (0) 73 – (0) 78
After 6 day 0 (0) 77 0 (0) 80 0 (0) 76 0 (0) 78 0 (0) 73 0 (0) 77 0 (0) 73 0 (0) 79
After 12 day 0.6 0.3 (4) 77 1.1 0.5 (7) 80 1.6 0.8 (10) 78 2.0 0.8 (12) 78 2.0 0.6 (12) 79 3.0 1.0 (18) 80 3.5 0.9 (21) 77 3.8 1.1 (23) 82
After 18 day 1.1 0.5 (7) 76 2.3 0.9 (14) 79 3.3 0.9 (20) 76 4.6 3.1 (28) 77 4.5 1.5 (27) 78 6.3 1.4 (38) 82 6.6 1.2 (40) 80 8.5 1.8 (51) 85
After 24 day 6.3 0.3 (2) 72 2.0 1.0 (12) 76 2.6 1.1 (16) 74 5.0 0.9 (30) 77 6.0 0.5 (36) 79 5.8 1.5 (35) 85 7.0 1.9 (42) 83 8.5 0.1 (51) 88
After 30 day 0 (0) 66 0 (0) 70 0 (0) 71 1.0 0.8 (6) 72 2.5 0.9 (15) 77 3.6 1.1 (22) 83 4.6 1.7 (27) 84 5.6 2.1 (34) 87
TC PWC (13) – 12.0 (33) – 11.3 (46) – 6.5 (76) – 7.6 (90) + 5.4 (113) + 9.2 (130) + 15.1 (159) + 11.5
C/W/D 0.006 0.015 0.021 0.035 0.041 0.052 0.060 0.073
TH 13 33 46 76 90 111 130 159
HC UC 13 0 33 0 46 0 76 0 90 0 111 2 130 0 159 0
PHS 100.0 100.0 100.0 100.0 100.0 98.2 100.0 100.0
IT (days) 10 – 11 10 – 13 10 – 13 10 – 13 17 – 18 17 – 18 17 – 18 17 – 18
H/C 1.00 1.00 1.00 1.00 1.00 0.98 1.00 1.00
Values in front of brackets are Mean S.D. of cocoons collected from 6 pots; Values in brackets are total cocoons collected from 72 earthworms kept in
6 pots; Values in bold letters are total body weight of 72 earthworms; TC = Total Cocoons; PWC = Per cent Weight Change;
C/W/D = Cocoon/Worm/Day; TH = Total Hatchlings; HC = Hatched Cocoons; UC = Unhatched Cocoons; PHS = Per cent Hatching Success;
H/C = Hatchling/Cocoon.
Page 35
69
Table 7. Rate of cocoon and hatchling production, hatching success, incubation time (IT) and the body weight (gm) change of adult L.mauritii kept in
different PSR doses of partly decomposed paddy waste for 30 days.
Period 0 PSR 10 PSR 20 PSR 30 PSR 40 PSR 50 PSR 75 PSR 100 PSR
Initial – (0) 62 – (0) 63 – (0) 58 – (0) 69 – (0) 78 – (0) 89 – (0) 87 – (0) 88
After 6 day 0 (0) 64 0 (0) 64 0 (0) 65 0 (0) 73 0 (0) 79 0 (0) 92 0 (0) 88 0 (0) 88
After 12 day 1.0 0.7 (6) 64 0.6 0.6 (4) 65 0.8 0.5 (5) 66 0.8 0.5 (5) 75 1.1 0.5 (7) 80 1.6 0.4 (10) 90 2.8 0.1 (17) 87 1.6 0.4 (10) 87
After 18 day 0.6 0.9 (4) 63 2.0 0.8 (12) 64 2.8 1.0 (17) 63 3.1 0.3 (19) 74 4.3 1.3 (26) 80 5.3 1.1 (32) 89 7.1 1.2 (43) 88 5.6 1.1 (34) 86
After 24 day 0.3 0.4 (2) 61 4.0 1.2 (24) 63 5.1 1.0 (31) 62 6.1 1.0 (37) 73 7.6 1.4 (46) 80 9.0 1.2 (54) 88 11.3 0.7 (68) 86 9.1 1.5 (55) 87
After 30 day 0 (0) 60 2.5 1.2 (15) 61 3.0 1.2 (18) 59 4.3 1.4 (26) 68 9.6 1.2 (58) 78 11.0 1.2 (66) 87 14.6 0.7 (88) 86 12.3 1.3 (74) 86
TC PWC (12) – 3.2 (55) a – 3.1 (71) + 1.7 (87) – 1.4 (137) 0.0 (162) – 2.2 (216) b – 1.1 (173)b – 2.2
C/W/D 0.006 0.025 0.032 0.040 0.063 0.073 0.100 0.073
TH 12 56 70 86 135 159 230 183
HC UC 12 0 52 3 70 1 86 1 135 2 159 3 216 0 169 4
PHS 100.0 94.5 98.6 98.9 98.5 98.1 100.0 97.7
IT (days) 9 – 11 10 – 12 10 – 13 10 – 14 20 – 23 20 – 23 20 – 23 20 – 25
H/C 1.00 1.02 0.99 0.99 0.99 0.98 1.06 1.06
Values in front of brackets are Mean S.D. of cocoons collected from 6 pots; Values in brackets are total cocoons collected from 72 earthworms kept in
6 pots; Values in bold letters are total body weight of 72 earthworms; TC = Total Cocoons; PWC = Per cent Weight Change;
C/W/D = Cocoon/Worm/Day; TH = Total Hatchlings; HC = Hatched Cocoons; UC = Unhatched Cocoons; PHS = Per cent Hatching Success;
H/C = Hatchling/Cocoon; Out of total cocoons collected, a and b represents 4 and 14 cocoons respectively produced 2 hatchlings/cocoon while hatching.
Page 36
70
Table 8. Rate of cocoon and hatchling production, hatching success, incubation time (IT) and the body weight (gm) change of adult P.excavatus kept in
different PSR doses of partly decomposed paddy waste for 30 days.
Period 0 PSR 10 PSR 20 PSR 30 PSR 40 PSR 50 PSR 75 PSR 100 PSR
Initial – (0) 69 – (0) 73 – (0) 78 – (0) 77 – (0) 68 – (0) 67 – (0) 69 – (0) 70
After 6 day 0 (0) 68 0 (0) 72 0 (0) 77 0 (0) 77 0 (0) 68 0 (0) 68 0 (0) 70 0 (0) 72
After 12 day 1.1 0.5 (7) 71 2.0 0.5 (12) 75 3.0 0.8 (18) 80 3.3 0.7 (20) 79 3.6 0.9 (22) 78 4.3 1.1 (26) 71 5.3 1.2 (32) 74 6.0 1.9 (36) 74
After 18 day 0 (0) 70 2.8 0.8 (17) 75 3.8 0.6 (23) 80 5.6 2.2 (34) 82 7.3 1.2 (44) 74 7.8 2.4 (47) 74 9.6 3.0 (58) 78 11.8 2.7 (71) 77
After 24 day 0 (0) 53 0.6 0.6 (4) 70 2.5 0.7 (15) 74 6.6 1.2 (40) 78 8.0 2.7 (48) 76 8.3 0.7 (50) 77 9.1 2.2 (55) 78 10.8 1.5 (65) 81
After 30 day 0 (0) 55 0 (0) 64 0.6 0.6 (4) 70 2.8 1.6 (17) 76 4.8 1.5 (29) 75 5.1 1.6 (31) 76 5.8 1.2 (35) 78 6.3 2.2 (38) 80
TC PWC (7) – 20.3 (33) – 12.3 (60) – 10.3 (111) – 10.3 (143) + 10.3 (154) + 13.8 (180) b + 13.1 (210) a + 14.3
C/W/D 0.003 0.015 0.027 0.051 0.066 0.071 0.083 0.097
TH 7 33 59 111 143 154 187 213
HC UC 7 0 33 0 59 1 111 0 143 0 154 0 179 1 207 3
PHS 100.0 100.0 98.3 100.0 100.0 100.0 99.4 98.6
IT (days) 9 – 10 9 – 10 9 –
10 9 – 10 17 – 18 17 – 18 17 –
18 17 – 18
H/C 1.00 1.00 0.98 1.00 1.00 1.00 1.04 1.01
Values in front of brackets are Mean S.D. of cocoons collected from 6 pots; Values in brackets are total cocoons collected from 72 earthworms kept in
6 pots; Values in bold letters are total body weight of 72 earthworms; TC = Total Cocoons; PWC = Per cent Weight Change;
C/W/D = Cocoon/Worm/Day; TH = Total Hatchlings; HC = Hatched Cocoons; UC = Unhatched Cocoons; PHS = Per cent Hatching Success;
H/C = Hatchling/Cocoon; Out of total cocoons collected, a and b represents 6 and 8 cocoons respectively produced 2 hatchlings/cocoon while hatching.
Page 37
71
Table 9. Rate of cocoon and hatchling production, hatching success, incubation time (IT) and the body weight (gm) change of adult L.mauritii kept in
different PSR doses of partly decomposed cow dung for 30 days.
Period 0 PSR 10 PSR 20 PSR 30 PSR 40 PSR 50 PSR 75 PSR 100 PSR
Initial – (0) 68 – (0) 65 – (0) 57 – (0) 56 – (0) 63 – (0) 67 – (0) 80 – (0) 68
After 6 day 0 (0) 68 0.5 0.3 (3) 68 0.5 0.3 (3) 62 0.1 0.3 (1) 72 0 (0) 79 0.8 1.0 (5) 92 0.5 0.3 (3) 89 0 (0) 90
After 12 day 0.6 0.6 (4) 64 1.8 1.0 (11) 65 2.6 1.1 (16) 58 2.8 1.3 (17) 69 3.1 0.6 (19) 78 4.0 0.8 (24) 91 3.1 1.0 (19) 87 3.0 1.2 (18) 87
After 18 day 1.3 0.5 (8) 61 4.0 1.9 (24) 61 5.8 0.9 (32) 57 6.3 1.3 (38) 67 7.1 0.9 (43) 78 9.3 1.7 (56) 94 6.5 1.5 (39) 90 6.5 1.3 (39) 84
After 24 day 0.6 0.9 (4) 69 4.3 0.9 (26) 58 6.3 2.1 (38) 55 7.8 2.6 (47) 67 12.0 1.6 (72) 79 13.0 2.7 (78) 95 10.3 1.5 (62) 93 9.8 2.1 (59) 84
After 30 day 0 (0) 52 1.8 1.1 (11) 53 2.6 1.1 (16) 53 7.1 1.8 (43) 71 11.3 1.8 (68) 81 14.6 2.8 (88) 97 9.5 2.6 (57) 94 9.1 1.5 (55) 88
TC PWC (16) – 23.5 (75) – 18.5 (105) – 7.0 (146) a + 26.8 (202) a + 28.6 (251) d + 44.8 (180) b + 17.5 (171) c + 29.4
C/W/D 0.007 0.034 0.048 0.067 0.093 0.116 0.083 0.079
TH 16 72 100 139 193 270 181 170
HC UC 16 0 72 3 100 5 137 9 191 11 249 2 177 3 162 9
PHS 100.0 96.0 95.2 93.8 94.6 99.2 98.3 94.7
IT (days) 10 – 12 10 – 12 11 – 14 15 – 17 21 – 23 21 – 23 21 – 23 21 – 23
H/C 1.00 0.96 0.95 0.95 0.96 1.08 1.01 0.99
Values in front of brackets are Mean S.D. of cocoons collected from 6 pots; Values in brackets are total cocoons collected from 72 earthworms kept in
6 pots; Values in bold letters are total body weight of 72 earthworms; TC = Total Cocoons; PWC = Per cent Weight Change;
C/W/D = Cocoon/Worm/Day; TH = Total Hatchlings; HC = Hatched Cocoons; Unhatched Cocoons; PHS = Per cent Hatching Success;
H/C = Hatchling/Cocoon; Out of total cocoons collected, a, b, c and d represents 2, 4, 8 and 21 cocoons respectively produced 2 hatchlings/cocoon while
hatching.
Page 38
72
Table 10. Rate of cocoon and hatchling production, hatching success, incubation time (IT) and the body weight (gm) change of adult P.excavatus kept in
different PSR doses of partly decomposed cow dung for 30 days.
Period 0 PSR 10 PSR 20 PSR 30 PSR 40 PSR 50 PSR 75 PSR 100 PSR
Initial – (0) 70 – (0) 73 – (0) 78 – (0) 82 – (0) 76 – (0) 76 – (0) 94 – (0) 83
After 6 day 0 (0) 71 0 (0) 76 0 (0) 78 0 (0) 83 0 (0) 75 0 (0) 71 0 (0) 75 0 (0) 83
After 12 day 0.5 0.4 (3) 74 1.3 0.5 (8) 79 1.8 0.5 (11) 81 2.5 1.1 (15) 85 3.1 1.3 (19) 78 3.0 1.0 (18) 80 3.6 0.4 (22) 78 4.3 1.5 (26) 87
After 18 day 0.1 0.3 (1) 73 1.8 0.6 (11) 74 3.1 0.6 (19) 75 4.1 1.4 (25) 81 6.0 1.4 (36) 79 6.6 1.7 (40) 82 7.5 0.5 (45) 81 9.0 1.5 (54) 88
After 24 day 1.1 0.6 (7) 62 2.1 0.3 (13) 64 3.0 1.0 (18) 56 5.0 1.7 (30) 75 6.3 0.7 (38) 77 7.5 1.8 (45) 79 8.3 1.9 (50) 81 11.3 0.9 (68) 87
After 30 day 0 (0) 53 0.5 0.3 (3) 55 1.0 0.5 (6) 63 3.1 1.7 (19) 59 4.3 1.5 (26) 73 6.3 1.5 (38) 77 6.8 0.6 (41) 80 9.1 1.6 (55) 89
TC PWC (11) _
– 24.3 (35) – 24.7 (54) – 19.2 (89) a – 28.0 (119) _
– 3.9 (141) + 1.3 (158) b – 14.9 (203) c + 7.2
C/W/D 0.005 0.016 0.025 0.041 0.055 0.065 0.073 0.093
TH 11 35 54 91 117 141 162 225
HC UC 11 0 35 0 54 0 89 0 117 2 141 0 158 0 203 0
PHS 100.0 100.0 100.0 100.0 98.3 100.0 100.0 100.0
IT (days) 10 – 11 10 – 11 10 – 11 10 – 11 17 – 18 17 – 18 17 – 18 17 – 18
H/C 1.00 1.00 1.00 1.02 0.98 1.00 1.03 1.11
Values in front of brackets are Mean S.D. of cocoons collected from 6 pots; Values in brackets are total cocoons collected from 72 earthworms kept in
6 pots; Values in bold letters are total body weight of 72 earthworms; TC = Total Cocoons; PWC = Per cent Weight Change;
C/W/D = Cocoon/Worm/Day; TH = Total Hatchlings; HC = Hatched Cocoons; UC = Unhatched Cocoons; PHS = Per cent Hatching Success;
H/C = Hatchling/Cocoon; Out of total cocoons collected, a, b and c represents 2, 4 and 22 cocoons respectively produced 2 hatchlings/cocoon while
hatching.
Page 39
73
Table 11. Rate of cocoon and hatchling production, hatching success, incubation time (IT) and the body weight (gm) change of adult L.mauritii kept in
different PSR doses of partly decomposed organic mixture for 30 days.
Values in front of brackets are Mean S.D. of cocoons collected from 6 pots; Values in brackets are total cocoons collected from 72 earthworms kept in
6 pots; Values in bold letters are total body weight of 72 earthworms; TC = Total Cocoons; PWC = Per cent Weight Change;
C/W/D = Cocoon/Worm/Day; TH = Total Hatchlings; HC = Hatched Cocoons; UC = Unhatched Cocoons; PHS = Per cent Hatching Success;
H/C = Hatchling/Cocoon; Out of total cocoons collected, a, b, c and d represents 2, 8, 16 and 30 cocoons respectively produced 2 hatchlings/cocoon
while hatching.
Period 0 PSR 10 PSR 20 PSR 30 PSR 40 PSR 50 PSR 75 PSR 100 PSR
Initial – (0) 73 – (0) 67 – (0) 68 – (0) 66 – (0) 71 – (0) 67 – (0) 67 – (0) 70
After 6 day 0 (0) 74 0 (0) 69 0 (0) 70 0 (0) 67 0 (0) 72 0 (0) 69 0 (0) 68 0 (0) 71
After 12 day 1.0 0.7 (6) 76 2.0 0.9 (12) 70 2.3 1.3 (14) 71 3.3 1.5 (20) 69 4.3 2.1 (26) 74 5.3 2.1 (32) 70 6.5 1.8 (39) 71 8.0 1.5 (48) 73
After 18 day 1.1 0.3 (7) 75 3.6 0.4 (22) 70 5.5 1.7 (33) 72 8.0 1.0 (48) 69 9.8 2.2 (59) 76 12.1 2.1 (73) 72 15.8 2.1 (95) 72 19.6 3.3 (118) 76
After 24 day 0.8 0.7 (5) 72 3.3 0.7 (20) 66 6.1 1.5 (37) 68 8.8 1.4 (53) 68 11.3 0.9 (68) 78 16.0 1.1 (76) 75 22.3 2.4 (134) 75 25.1 4.2 (151) 79
After 30 day 0 (0) 64 0.8 0.5 (5) 60 3.3 0.9 (20) 63 5.6 1.6 (34) 65 9.6 1.1 (58) 78 15.5 2.6 (93) 77 21.1 5.1 (127) 77 25.0 5.8 (150) 80
TC PWC (18) – 12.3 (59) a – 10.4 (104) – 7.4 (155) a – 1.5 (211) b + 9.9 (274) c + 14.9 (395) c + 14.9 (467) d + 14.3
C/W/D 0.008 0.027 0.048 0.071
.
0.097 0.126 0.182 0.216
TH 18 61 102 152 213 287 402 486
HC UC 18 0 59 0 102 2 150 5 205 6 271 3 386 9 456 11
PHS 100.0 100.0 98.0 96.8 97.2 98.9 97.7 97.6
IT (days) 10 – 11 21 – 23 21 – 23 21 – 23 21 – 23 21 – 23 21 – 23 21 – 23
H/C 1.00 1.03 0.98 0.98 1.01 1.05 1.02 1.04
Page 40
74
Table 12. Rate of cocoon and hatchling production, hatching success, incubation time (IT) and the body weight (gm) change of adult P.excavatus kept in
different PSR doses of partly decomposed organic mixture for 30 days.
Values in front of brackets are Mean S.D. of cocoons collected from 6 pots; Values in brackets are total cocoons collected from 72 earthworms kept in
6 pots; Values in bold letters are total body weight of 72 earthworms; TC = Total Cocoons; PWC = Per cent Weight Change;
C/W/D = Cocoon/Worm/Day; TH = Total Hatchlings; HC = Hatched Cocoons; UC = Unhatched Cocoons; PHS = Per cent Hatching Success;
H/C = Hatchling/Cocoon; Out of total cocoons collected, a and b represents 4 and 8 cocoons respectively produced 2 hatchlings/cocoon while hatching.
Period 0 PSR 10 PSR 20 PSR 30 PSR 40 PSR 50 PSR 75 PSR 100 PSR
Initial 0 (0) 62 – (0) 69 – (0) 77 – (0) 76 – (0) 68 – (0) 82 – (0) 69 – (0) 80
After 6 day 0 (0) 58 0 (0) 71 0 (0) 92 0 (0) 78 0 (0) 70 0 (0) 85 0 (0) 71 0 (0) 81
After 12 day 0.6 0.6 (4) 59 1.3 0.5 (8) 73 2.0 0.8 (12) 68 1.6 0.6 (10) 80 2.1 1.0 (13) 72 2.8 0.7 (17) 86 3.3 1.3 (20) 76 3.6 1.2 (22) 90
After 18 day 1.1 1.2 (7) 58 2.8 0.6 (17) 74 4.3 1.3 (26) 80 5.0 1.2 (30) 81 6.0 1.7 (36) 73 7.0 2.1 (42) 88 7.6 1.3 (46) 80 8.5 1.2 (51) 93
After 24 day 0 (0) 56 0.6 0.6 (4) 72 1.8 0.9 (11) 80 3.0 0.7 (18) 81 6.0 1.5 (36) 75 6.8 1.6 (41) 89 8.0 1.4 (48) 82 9.6 1.1 (58) 95
After 30 day 0 (0) 53 0 (0) 70 0.6 0.6 (4) 77 2.1 1.0 (13) 78 4.1 1.9 (25) 74 7.6 1.2 (46) 87 7.3 1.4 (44) 83 9.3 2.1 (59) 95
TC PWC (11) – 14.5 (29) + 1.4 (53) 0. 0 (71) +2.6 (110) + 8.8 (146) a + 6.1 (158) +20.3 (190) b +18.8
C/W/D 0.005 0.013 0.024 0.032 0.050 0.067 0.073 0.087
TH 11 29 51 70 108 150 157 198
HC UC 11 0 29 0 51 2 70 1 108 2 146 0 157 1 190 0
PHS 100.0 100.0 96.2 98.6 98.2 100.0 99.4 100.0
IT (days) 10 – 11 10 – 11 10 –11 10 – 11 16 – 17 16 – 17 16 – 17 16 – 17
H/C 1.00 1.00 0.96 0.98 0.98 1.03 0.99 1.04
Page 41
92
The values of L.mauritii and P.excavatus are represented in upper and lower rows respectively; BW = Body Weight;
PWG = Per cent Weight Gain; TCP = Total Cocoon Production; C/W/D = Cocoon/Worm/ Day; * 30 days value over respective initial.
Table 21. Body weight (gm) and cocoon production (CP) of 12 mature F1 offsprings (obtained from their adult parents previously
exposed to different PSR doses of partly decomposed water hyacinth for 30 days) of L.mauritii and P.excavatus kept in the same PSR
doses of water hyacinth for 30 days.
Period
10 PSR 20 PSR
30 PSR
40 PSR
50 PSR 75 PSR 100 PSR
BW
CP
BW
CP
BW
CP
BW CP BW
CP
BW CP BW CP
Initial
9.1 0 9.3 0 9.9 0 10.6 0 12.0 0 12.2 0 13.3 0
6.5 0 7.0 0 7.2 0 7.3 0 7.6 0 7.8 0 8.0 0
After 6 day 9.2 2 9.4 5 10.3 6 10.9 6 12.3 7 12.3 8 13.6 7
6.8 2 7.1 3 7.5 3 7.6 4 7.8 6 7.9 5 8.3 5
After 12 day 9.3 2 9.6 3 10.5 1 11.0 1 12.5 4 12.5 4 13.8 5
7.2 2 7.3 1 7.8 2 7.8 2 8.0 2 8.1 3 8.7 3
After 18 day 9.4 3 9.8 3 10.8 2 11.2 3 12.6 3 12.6 4 14.0 6
7.6 0 7.6 1 8.0 2 8.3 3 8.2 2 8.3 4 9.0 5
After 24 day
9.5 0 10.1 2 11.0 2 11.4 3 12.8 2 12.8 3 14.1 4
8.0 2 7.9 3 8.3 3 8.5 2 8.4 3 8.5 3 9.2 5
After 30 day
9.7 0 10.3 0 11.2 3 11.7 3 12.9 4 13.0 5 14.3 5
8.3 2 8.4 2 8.5 1 8.7 3 8.8 3 9.0 2 9.5 4
PWG*\TCP 6.6 7 10.8 13 13.1 14 10.4 16 7.5
7.5.5
20 6.6 24 7.5 27
27.7 8 20.0 10 18.1 11 19.2 14 15.8 16 15.4 17 18.8 22
C/W/D
0.019 0.036 0.038 0.044 0.055 0.066 0.075
0.022 0.027 0.030 0.038 0.044 0.047 0.061
Page 42
93
Table 22. Body weight (gm) and cocoon production (CP) of 12 mature F1 offsprings (obtained from their adult parents previously
exposed to different PSR doses of partly decomposed paddy waste for 30 days) of L.mauritii and P.excavatus kept in the same PSR
doses of paddy waste for 30 days.
The values of L.mauritii and P.excavatus are represented in upper and lower rows respectively; BW = Body Weight;
PWG = Per cent Weight Gain; TCP = Total Cocoon Production; C/W/D = Cocoon/Worm/ Day; * 30 days value over respective initial.
Period
10 PSR 20 PSR
30 PSR
40 PSR
50 PSR
75 PSR 100 PSR
BW CP BW CP BW CP BW CP BW CP BW
CP
BW CP
Initial
11.8 0 12.0 0 12.2 0 12.4 0 12.5 0 12.6 0 12.8 0
6.2 0 6.7 0 7.0 0 7.3 0 7.4 0 7.5 0 7.6 0
After 6 day 12.1 5 12.3 5 12.4 5 12.9 9 12.8 9 13.0 12 13.3 12
6.4 3 7.0 5 7.4 6 7.5 6 7.6 8 7.6 11 7.8 13
After12day 12.3 1 12.8 2 13.0 2 13.2 4 13.2 4 13.3 6 13.5 6
6.9 2 7.5 3 7.8 5 7.8 5 8.0 2 7.9 5 8.0 4
After18 day 12.6 2 13.3 3 13.4 4 13.8 5 13.5 6 13.7 4 14.1 5
7.4 3 7.9 4 8.0 4 8.1 3 8.1 4 8.2 4 8.4 7
After24 day
13.0 2 13.5 3 14.0 3 14.2 3 13.9 4 14.0 7 14.6 5
7.9 1 8.1 3 8.3 2 8.3 2 8.4 5 8.6 5 8.7 6
After30 day
13.4 1 13.8 2 14.2 4 14.4 4 14.5 5 14.6 5 14.9 6
8.3 3 8.5 3 8.6 3 8.7 4 8.8 4 8.9 5 9.0 5
PWG*\TCP 13.6 11 15.0 15 16.4 18 16.7 25 16.0 28 15.9 34 16.4 34
33.9 12 26.9 18 22.9 20 19.2 20 18.9 23 18.7 30 18.4 35
C/W/D
0.030 0.041 0.050 0.069 0.077 0.094 0.094
0.033 0.050 0.055 0.055 0.063 0.083 0.097
Page 43
94
Table 23. Body weight (gm) and cocoon production (CP) of 12 mature F1 offsprings (obtained from their adult parents previously exposed to
different PSR doses of partly decomposed cow dung for 30 days) of L.mauritii and P.excavatus kept in the same PSR doses of cow dung for 30
days.
Period
10 PSR
20 PSR
20 PSR
30 PSR 40 PSR
50 PSR
75 PSR
100 PSR
BW CP BW
CP
BW CP BW
CP
BW CP BW CP BW CP
Initial 11.5 0 11.8 0 12.0 0 12.3 0 12.5 0 12.4 0 12.3 0
6.0 0 6.3 0 6.7 0 7.0 0 7.2 0 7.5 0 7.7 0
After 6 day 11.9 5 12.3 4 12.4 6 12.5 9 12.7 13 12.7 10 12.8 12
6.3 5 6.8 5 6.9 5 7.3 7 7.5 5 7.8 7 7.7 9
After12day 12.3 1 12.5 2 12.7 3 12.9 5 13.2 5 13.0 5 13.2 4
6.7 2 7.1 2 7.0 3 7.7 2 7.9 3 8.1 4 8.3 5
After18day 12.6 2 12.9 4 13.0 3 13.1 4 13.5 4 13.4 5 13.5 5
7.0 0 7.4 2 7.4 2 8.0 3 8.1 5 8.4 6 8.6 5
After24day 12.9 2 13.3 1 13.3 2 13.5 6 13.8 7 13.8 6 13.8 5
7.3 3 7.7 3 7.7 3 8.3 4 8.5 5 8.7 4 8.9 4
After30day 13.3 1 13.6 4 13.8 5 14.0 6 14.5 7 14.3 6 14.2 4
7.7 2 8.1 1 8.2 3 8.5 3 8.8 4 9.0 3 9.3 5
PWG*/TCP 15.7 11 15.3 15 15.0 19 13.8 30 16.0 36 15.3 32 15.4 30
28.3 12 28.6 13 22.4 16 21.4 19 22.2 22 20.0 24 20.8 28
C/W/D
0.030 0.041 0.052 0.083 0.100 0.088 0.083
0.033 0.036 0.044 0.052 0.061 0.066 0.077
The values of L.mauritii and P.excavatus are represented in upper and lower rows respectively; BW = Body Weight;
PWG = Per cent Weight Gain; TCP = Total Cocoon Production; C/W/D = cocoon/Worm/ Day; * 30 days value over respective initial.
.
Page 44
95
Table 24. Body weight (gm) and cocoon production (CP) of 12 mature F1 offsprings (obtained from their adult parents previously exposed to
different PSR doses of partly decomposed organic mixture for 30 days) of L.mauritii and P.excavatus kept in the same PSR doses of organic
mixture for 30 days.
The values of L.mauritii and P.excavatus are represented in upper and lower rows respectively; BW = Body Weight;
PWG = Per cent Weight Gain; TCP = Total Cocoon Production; C/W/D = Cocoon/Worm/ Day; * 30 days value over respective initial.
Period
10 PSR
20 PSR
30 PSR
40 PSR
50 PSR 75 PSR
100 PSR
BW CP BW
CP
BW
CP
BW CP BW
CP
CP
BW
CP
BW CP
Initial
11.1 0 11.5 0 12.0 0 12.4 0 12.5 0 12.8 0 13.0 0
6.1 0 6.5 0 7.0 0 7.3 0 7.5 0 7.8 0 8.1 0
After 6 day 11.4 3 11.7 5 12.3 5 12.8 7 12.9 8 13.1 10 13.4 11
6.4 5 6.7 5 7.3 6 7.5 7 7.7 7 8.0 7 8.4 9
After 12day 11.7 0 12.0 2 12.6 3 13.1 2 13.2 3 13.4 5 13.8 6
6.7 1 7.0 2 7.6 3 7.6 3 8.0 3 8.3 4 8.7 4
After 18 day 11.9 3 12.3 4 13.0 2 13.4 5 13.5 5 13.7 6 14.2 7
6.9 3 7.2 2 7.9 2 7.7 4 8.2 4 8.6 3 9.1 5
After 24 day
2.2 2 12.5 1 13.3 4 13.7 4 13.8 6 14.1 5 14.6 5
7.2 2 7.5 3 8.2 2 8.0 2 8.5 3 8.8 4 9.5 6
After 30 day
12.5 4 12.8 2 13.5 3 14.1 6 14.3 7 14.6 6 14.9 8
7.3 0 7.7 2 8.5 2 8.4 2 8.9 2 9.3 3 9.7 3
PWG*\TCP
12.6 12 11.3 14 12.5 17 13.7 24 14.4 29 14.1 32 14. 6 37
19.7 11 18.5 14 21.4 15 15.1 18 18.7 19 19.2 21 19.8 27
C/W/D
0.033 0.038 0.047 0066 0.080 0.088 0.102
0.030 0.038 0.041 0.050 0.052 0.058 0.075
Page 45
33
Table 4. Review of research papers published in the cultivation studies with different plants using composts and vermicomposts of organic matters
obtained from different sources.
Species used Substrate composition Cultivation type/ plant used Observations made Author(s)
–
Compost of municipal
solid waste and biosolids
Lab study of ivy leaf morning glory,
barnyard grass, common purslane
and corn seeds germination
Germination time, root growth and
germination index
Hampton et al.
(1999)
E.eugeniae
Vermicompost of sugar
cane press mud,
biodigested slurry, coir
pith, cow dung and mixture
of weeds
Pot and field cultivation of rice and
black gram Growth and yield
Jeyabal and
Kuppuswamy
(2001)
E.eugeniae
Vermicompost of press
mud and NPK
Field cultivation of black gram and
ground nut
Germination, leaf area, shoot and
root length, shoot and root weight,
root nodules, chlorophyll, sugar
and protein content of leaf, shoot
and root, and yield
Parthasarathi and
Ranganathan (2002)
E.fetida
Vermicompost of tannery
sludge with saw dust, card
board and wheat straw
Pot cultivation of maize, rape,
sunflower and oat
Stem + leaves, roots, shoots, grain
and straw weight
Gondek and Filipek
- Mazur
(2003)
Table 4: Contd….
Page 46
34
Species used Substrate composition Cultivation type/ plant used Observations made Author(s)
E.fedita
P.excavatus
D.bolaui
Vermicompost of forest
litters of T.grandis (teak),
M.indica (mahua) and
B.monosperma (palas)
Field cultivation of Tectona grandia
(forest tree)
Growth characteristics Manna et al. (2003)
–
Sandy clay loam soil,
poultry manure, sewage
sludge, urban compost,
farm yard manure and
NPK
Field cultivation of ground nut
Number of pegs/plant, total
number of pods/plant, mature
pods/plant, pod yield/plant, kernal
weight, pod, haulm and kernal
yield and harvest index
Ananda et al.
(2004a)
–
Sandy clay loam soil, farm
yard manure, poultry
manure, recommended
NPK, urban compost,
enriched urban compost
and sewage sludge
Field cultivation of ground nut
Plant height, number of pods/
plants, pod yield/plant, total dry
matter, and number of
nodules/plant
Ananda et al.
(2004b)
L.mauritii
Vermicompost of paddy
chaff and weed plants
materials
Pot cultivation of radish
Shoot height, root height, total
height, shoot weight, root weight
and total weight
Bakthavathsalam and
Geetha (2004c)
– Sandy clay loam soil, farm
yard manure and NPK Field cultivation of potato
Dry matter production, tuber
bulking rate and tuber yield
Chettri and Thapa
(2004)
Table 4: Contd….
Page 47
35
Species used Substrate composition Cultivation type/ plant used Observations made Author(s)
P.excavatus
O.phillotti
O.rosea
Vermicompost of rice
straw
Pot cultivation of sorghum
Plant height, root length, number
of leaves, leaf area, shoot biomass
and root biomass
Vikram Reddy and
Ohkura (2004)
–
Sandy loam soil, farm yard
manure, coir pith compost,
vermicompost and
Asospirillum*
Field cultivation of tomato Biological properties of soil and
fruit yield/plant Kannan et al. (2005)
E.fetida
Vermicompost of cow
dung, silk worm rearing
wastes, farm refuse, weeds,
mulberry leaves
Field cultivation of mulberry
Leaf yield, plant height, number of
effective branches, average
number of leaves/plant and
average leaf area
Sinha et al. (2005)
O.tyrtaeum Litters of grass, maize and
wheat with earthworm
Pot cultivation of maize, barley and
wheat Shoot and root weight Bisht et al. (2006)
–
Alluvium soil, NPK,
Rhizobium,* cow dung
and vermicompost
Pot cultivation of black gram
Shoot and root length, fresh
weight, water content of roots,
shoot and leaves, number of
leaves/plant, number of lateral
roots and root nodules, total
flowers, pods and seeds, seed
protein, chlorophyll and carotenoid
content
Bakthavathsalam and
Deivanayaki (2007)
Table 4: Contd….
Page 48
36
Species used Substrate composition Cultivation type/ plant used Observations made Author(s)
–
Red soil, poultry manure,
farm yard manure,
vermicompost and sewage
sludge
Pot cultivation of ground nut and
corn
Stem and leaf biomass, kernal
yield and micronutrient uptake of
ground nut, and biomass yield and
micronutrient uptake of corn
Mohanty et al.
(2007)
Pleurotus sajor
caju**
Compost of coir pith, farm
yard manure, press mud
and gypsum
Field cultivation of finger millet Grain yield Rangaraj et al.
(2007)
P.excavatus
L.mauritii
Sodic soil, vermicompost
and vermiwash of paddy
straw and cattle dung
Field cultivation of spinach, onion
and potato
Reclamation of sodic soil through
application of vermicompost and
vermiwash, and yield of
vegetables
Ansari (2008)
E.fetida
Vermicompost of tannery
sludge with saw dust, card
board and wheat straw
Pot cultivation of maize, rape,
sunflower and oat
Tolerance indices and
contamination indices of cob, stem
+ leaves, roots, grains and straw
Gondek (2008)
E.eugeniae
Clay loam soil, red soil,
sandy loam soil,
vermicompost of press
mud, sugar cane trash and
bagasse mixture
Field cultivation of black gram Grain yield, and protein and sugar
contents in seeds
Parthasarathi et al.
(2008)
E.fetida Sandy loam soil and cattle
manure vermicompost Cultivation of spinach using bags
Plant height, leaf and root weight,
total leaves/plant and leaf area
Peyvast et al.
(2008)
Table 4: Contd….
Page 49
37
Species used Substrate composition Cultivation type/ plant used Observations made Author(s)
E.eugeniae
Alluvium and red soil,
vermicasts of sheep
droppings and paddy straw
waste and compost of cow
dung
Pot cultivation of red rose Total nods, total leaves and total
flowers
Bakthavathsalam
et al. (2009)
E.eugeniae
Alluvium soil and
vermicompost of green
gram waste
Pot cultivation of radish
Total leaves, leaves weight, tap
root weight, plant weight, tap root
length, tap root perimeter
Jayaseelan and
Bakthavathsalam
(2009b)
–
Alluvium soil and
composts of cabbage waste
and cow dung
Pot cultivation of chilli Total leaves, stem length and total
fruits
Muruganandham and
Bakthavathsalam
(2009)
E.eugeniae
Alluvium soil and
vermicompost of paddy
straw waste
Pot cultivation of radish Root weight, shoot weight and
total weight
Subramaniyan and
Bakthavathsalam
(2009)
L.mauritii
Alluvium soil and
vermicompost of vegetable
market wastes
Pot cultivation of black gram
Number of leaves, stem height,
petiole length, and number of
flowers, pods and seeds
Uthayakumar and
Bakthavathsalam
(2009)
–
Alluvium soil, and
compost of coir waste,
E.crassipes, cow dung and
poultry excreta mixture
Pot cultivation of radish
Total leaves, leaves weight, tap
root length and weight, and plant
weight
Bakthavathsalam
et al. (2010c)
Table 4: Contd….
Page 50
38
Species used Substrate composition Cultivation type/ plant used Observations made Author(s)
E.eugeniae
T.viride**
Alluvium soil, and
vermicompost of coir
waste, water lily, goat
droppings and poultry
excreta mixture
Pot cultivation of radish
Total leaves, leaves weight, tap
root length and weight, and plant
weight
Bakthavathsalam
et al. (2010d)
–
Alluvium soil, and
composts of I.carnea and
cow dung
Pot cultivation of green gram Total leaves, total pods and total
seeds/pod
Bakthavathsalam
et al. (2010e)
–
Alluvium and red soil, and
compost of sheep
droppings, E.crassipes and
I.carnea
Pot cultivation of Ooty rose
Total nods, total leaves and total
flowers
Kamaladevi and
Bakthavathsalam
(2010)
T.viride** Acidic soil and compost of
E.crassipes Pot cultivation of radish
Total leaves, plant length, tap root
length, leaves, tap root and plant
weight, and tap root perimeter
Mathialagan and
Bakthavathsalam
(2010)
E.eugeniae
Alkaline soil, compost of
cow dung and
vermicompost of
P.longifolia
Pot cultivation of radish
”
Umamaheswari and
Bakthavathsalam
(2010)
* Bacteria ** Fungus
Page 51
26
Table 3. Review of literature regarding the analysis and observations made in the physico - chemical characteristics of different organic matters after
using them by earthworms.
Earthworms used Materials used Analysis/ Observations made Author(s)
L.mauritii Ragi hay, paddy hay, and cashew, mango,
guava and eucalyptus leaf matters Food preferences in relation to C:N ratios
Kale and
Krishnamoorthy (1981)
L.terrestris
L.rubellus
Alfalfa leaves, red clover leaves, corn leaves
and brome grass
Analysis of N, P, K, Ca, Mg, OC, C:N ratio, and
ratio of aliphatic, carbohydrate, aromatic and
carboxylic acid C
Shipitalo et al. (1988)
E.andrei Solid paper-pulp mill sludge, sewage sludge,
pig slurry and poultry slurry
Analysis of pH, TOC, N, C:N ratio, total solid,
ash and crude fibre Elvira et al. (1997)
E.andrei Grasses, garden and municipal prunings and
river weeds
Analysis of pH, C, N, C:N ratio, cellulose, lignin
and ash
Frederickson et al.
(1997)
L.rubellus Onion sludge waste Analysis of N,P and K Kavian et al. (1997)
L.mauritii
E.eugeniae
Coir waste, press mud, water hyacinth, farm
wastes, farm yard manure, biogas slurry of
press mud and cattle dung
Analysis of pH, EC,OM, OC, TN, TP, TK, Ca,
Mg, S, Na, Fe, Mn, Zn, Cu, C:N ratio and C:P
ratio
Ramalingam (1997)
E.andrei Cattle manure, paper mill sludge and dairy
sludge
Analysis of pH, EC, TEC, non-humified
fraction, humic acids, fulvic acids, total soluble
carbon, humification index, degree of
humification, N, P, K, Fe, Mn, Cu, Zn, Pb and
Ni
Elvira et al. (1998)
Table 3: Contd….
Page 52
27
Earthworms used Materials used Analysis/ Observations made Author(s)
E.fetida
Sewage sludge
Analysis of pH, C, N and C:N ratio
Benitez et al. (1999)
E.eugeniae Areca nut leaves and cocoa leaves Analysis of pH, OC, N, P, K, Cu, Fe, Zn, Mn
and C:N ratio
Chowdappa et al.
(1999)
E.fetida
Kitchen waste, cow dung, poultry droppings,
municipal waste and dry leaves
Transformation of phosphorus during
vermicomposting
Ghosh et al. (1999a)
E.fetida
Mustard residues, sugarcane trash and cattle
dung Analysis of C:N ratio, N, P, K, Cu and Zn
Bansal and Kapoor
(2000)
L.mauritii Vegetable market wastes Analysis of EC, N, P, K, C, Ca, S, total solids,
volatile solids and ash Logakanthi et al. (2000)
E.fetida Aerobic and anaerobic sludges of municipal
sewage plant
Analysis of pH, EC, TN, TC and inorganic
anions
Masciandaro et al.
(2000a)
E.fetida Biosolids and paper mulch Analysis of pH, N, P, volatile solids and ash
content Ndegwa et al. (2000)
P.excavatus Sugarcane trash and cow dung Analysis of pH, EC, OM, OC, N, P, K, Ca, Mg,
S, Na, Fe, Cu, Mn, Zn, C:N ratio and C:P ratio
Ramalingam and
Thilagar (2000)
P.excavatus Sugarcane trash and press mud ” Ramalingam (2001)
E.eugeniae Press mud
Analysis of pH, EC, OM, OC, N, P, K, Ca, Mg,
S, Na, Zn, Fe, Mn, Cu, C:N ratio, C:P ratio and
crude protein
Ramalingam and
Ranganathan (2001)
Table 3: Contd….
Page 53
28
Earthworms used Materials used Analysis/ Observations made Author(s)
E.eugeniae Press mud vermicasts Analysis of N, P, K, Mg, Fe, Zn and humic acid Parthasarathi and
Ranganathan (2002)
E.fedita Wheat straw residue Analysis of OC, N, P, K, C:N ratio, cellulose,
hemi cellulose and lignin
Singh and Sharma
(2002)
L.rubellus Compost of cattle manure, leaves and food
scraps
Analysis of TN, TC, C:N ratio P,K, extractable
NH4 +- N and NO3
- -N
Chaoui et al. (2003)
E.fetida Farm yard manure, tannery
sludge, saw dust, card board and wheat straw
Analysis of OC, TN, P, K, Ca, Mg, Na, Cu, Zn,
Cr, Ni, Pb and Cd
Gondek and
Filipek - Mazur (2003)
E.fetida
L.mauritii Municipal solid waste
Efficiency of vermicomposting and chemical
analysis of vermicompost
Kaviraj and Sharma
(2003)
E.fetida
P.excavatus
D.bolaui
Compost and vermicompost of forest litters
such as T.grandis (teak),
M.indica (mahua) and
B.monosperma (palas)
Analysis of TOC, TN, C:N ratio,TP, TK, TCa,
TMg, lignin, cellulose and lignin/ cellulose ratio Manna et al. (2003)
L.mauritii Sewage sludge, rice straw and cow dung Analysis of TN and TOC Arumugam et al.
(2004)
L.mauritii Paddy chaff and weed plants materials Analysis of pH, N, P and K Bakthavathsalam and
Geetha (2004c)
P.excavatus
Octonochaeta rosea
Octochaetona
phillotti
Rice straw Analysis of OC, N, P, K, Ca, Mg and Na
Vikram Reddy and
Ohkura (2004)
Table 3: Contd….
Page 54
29
Earthworms used Materials used Analysis/ Observations made Author(s)
E.andrei Pine saw dust, poultry litter, cotton industry
waste, horse manure and shredded paper
Analysis of pH, OC, N, P, K, Mn, Cu, Fe, and
C:N ratio Castillo et al. (2005)
E.eugeniae Sago solid waste and press mud Analysis of pH, OM, OC, N, P, K, Ca, Mg, Na,
S, C:N ratio and C:P ratio
Christy and
Ramalingam (2005b)
E.fetida Animal wastes of cow, buffalo, horse,
donkey, sheep, goat and camel Analysis of pH, EC, TOC, N ,P, K and C:N ratio Garg et al. (2005a)
E.fetida Cow dung, biogas plant slurry and solid
textile mill sludge
Analysis of pH, TOC, TN, TP,TK and C:N ratio
Garg et al. (2005b)
E.fetida
Sewage sludge added with heavy metals
Accumulation of heavy metals such as Zn, Cu,
Cr, Cd and Pb in earthworm body
Shahmansouri et al.
(2005)
O.tyrtaeum Litters of grass, maize and wheat Analysis of pH, OC, N, P, K and C:N ratio Bisht et al. (2006)
E.eugeniae Fruit waste, yard waste, municipal solid
waste and paper mill sludge
Analysis of pH, EC, total solids, volatile
solids,C, N, P, K, Fe, Mn, Zn, Cu and Cd
Hemalatha and
Meenambal (2006)
L.mauritii Organic kitchen waste Analysis of pH, EC, N, P, K, Fe, Zn, Mn and Cu Indirabai et al. (2006)
P.excavatus Sago solid waste and press mud Analysis of pH, EC, OM, OC, N, P, K, Ca, Mg,
S, Na, C:N ratio and C:P ratio
Ramalingam and
Christy (2006)
L.mauritii Cow dung and press mud Analysis of pH, N, P and K Bakthavathsalam
(2007b)
Table 3: Contd….
Page 55
30
Earthworms used Materials used Analysis/ Observations made Author(s)
E.eugeniae Press mud, bagasse, coir waste, rice husk
and ground nut shell Analysis of pH, EC, N, P, K, Ca, Fe and Zn Kitturmath et al. (2007)
E.fetida
E.eugeniae
P.excavatus
Cattle manure with saw dust Analysis of pH, EC, ash content, OC, N, P, K,
Ca and Na Meena and Renu (2007)
P.excavatus Press mud Role of moisture on the content of N, P and K
during vermicomposting
Parthasarathi (2007)
E.fetida
E.eugeniae
Weed materials such as Achyranthes
asperal, Cassia tora L. and Parthenium
hysterophoruse
Analysis of N, P, K, C, ash and C:N ratio Umesh Mogle and
Bharati Jadha (2007)
P.excavatus
L.mauritii Sodic soil, paddy straw and cattle dung Analysis of pH, EC, OC, N, K, Na and Ca Ansari (2008)
E.fetida Duck weed and cattle manure Analysis of pH, ash, OC, N, P, K, Ca, Mg, Na,
Fe, Mn, Zn, Cu, Ni, Cr, Co, Cd and Pb
Kostecka and
Kaniuczak (2008)
L.mauritii Cow dung and vegetable market wastes Analysis of pH, N, P and K Muthukumaravel et al.
(2008)
E.fetida Cattle manure vermicompost Analysis of pH, EC, OC, N, P, K, Ca, Mg, Fe,
Zn, Mn and Cu Peyvast et al. (2008)
P.excavatus
P.sansibaricus Domestic waste (house hold waste)
Analysis of pH, OC, TN, P, K, C:N ratio and
C:P ratio
Suthar and Singh (2008)
Table 3: Contd….
Page 56
31
Earthworms used Materials used Analysis/ Observations made Author(s)
E.eugeniae Fly ash and cow dung Analysis of pH, EC, OC, N, P, K, Ca, Mg, Zn,
Cu, Mn, Fe, B and Mo
Venkatesh and Eevera
(2008)
L.mauritii Fly ash and cow dung Analysis of OC, N, P and K Ananthakrishnasamy
et al. (2009)
E.fetida Kitchen waste, grass clippings, goat manure,
vermicompost and garden soil
Analysis of pH, OC, N, P, K, Cu, Cr, Cd, Ni, Pb
and Zn
Fauziah and Agamuthu
(2009)
E.eugeniae Green gram waste Analysis of pH, EC, N, P, K, Fe, Mn, Zn and Cu
Jayaseelan and
Bakthavathsalam
(2009b)
E.fetida Cow manure added with heavy metals Accumulation of heavy metals (Zn, Pb, Ni, Cd,
Cr, Mo) in earthworm body
Macki Aleagha et al.
(2009)
– Compost of cabbage waste Analysis of pH, EC, N, P, K, Fe, Mn, Zn and Cu
Muruganandham and
Bakthavathsalam (2009)
E.eugeniae Paddy straw waste ”
Subramaniyan and
Bakthavathsalam (2009)
L.mauritii Vegetable market wastes Analysis of pH, EC, N, P, K, Ca, Mg, OC, Zn,
Fe, Cu and Mn
Uthayakumar and
Bakthavathsalam (2009)
E.eugeniae Mixture of coir waste, E.crassipes, cow dung
and poultry excreta
Analysis of pH, EC, OC, N, P, K, Na, Ca, Mg,
S, Zn, Cu, Fe and Mn
Bakthavathsalam et al.
(2010c)
Table 3: Contd….
Page 57
32
Earthworms used Materials used Analysis/ Observations made Author(s)
E.eugeniae Mixture of coir waste, water lilly, goat
droppings and poultry excreta
Analysis of pH, EC, OC, N, P, K, Na, Ca, Mg,
S, Zn, Cu, Fe and Mn
Bakthavathsalam et al.
(2010d)
– Fresh and decomposed Ipomoea carnea Analysis of pH, EC, N, P, K, Fe, Mn, Zn and Cu Bakthavathsalam et al.
(2010e)
Trichoderma viride* Compost of E.crassipes Analysis of pH, EC, OC, N, P, K, Na, Ca, Mg,
S, Zn, Cu, Fe and Mn
Mathialagan and
Bakthavathsalam (2010)
E.eugeniae Elephant dung ” Sudha and
Bakthavathsalam (2010)
E.eugeniae Cow dung and P.longifolia ” Umamaheswari and
Bakthavathsalam (2010)
* Fungus


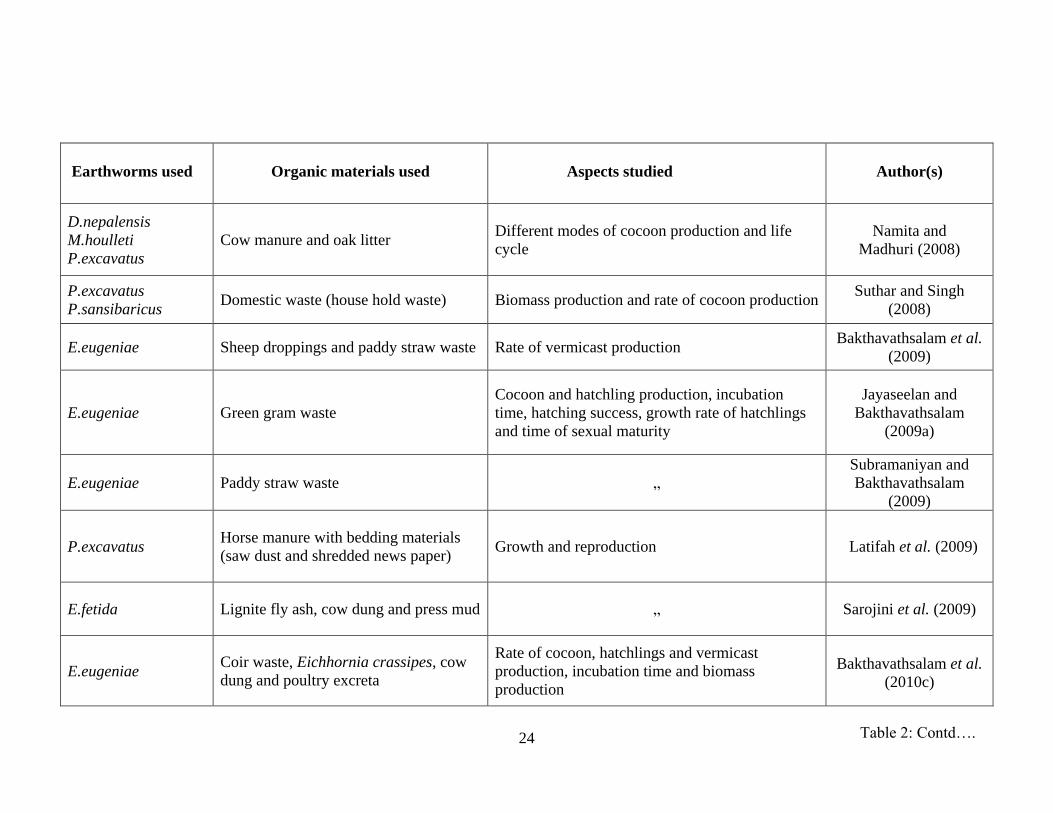


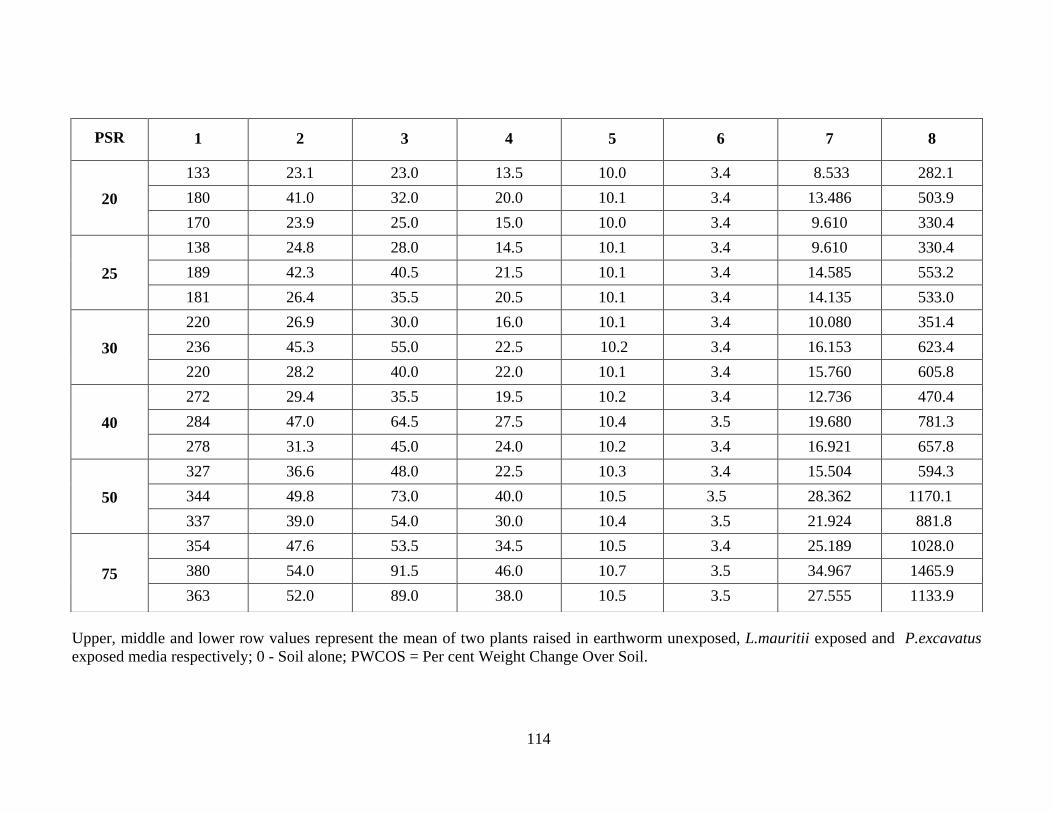


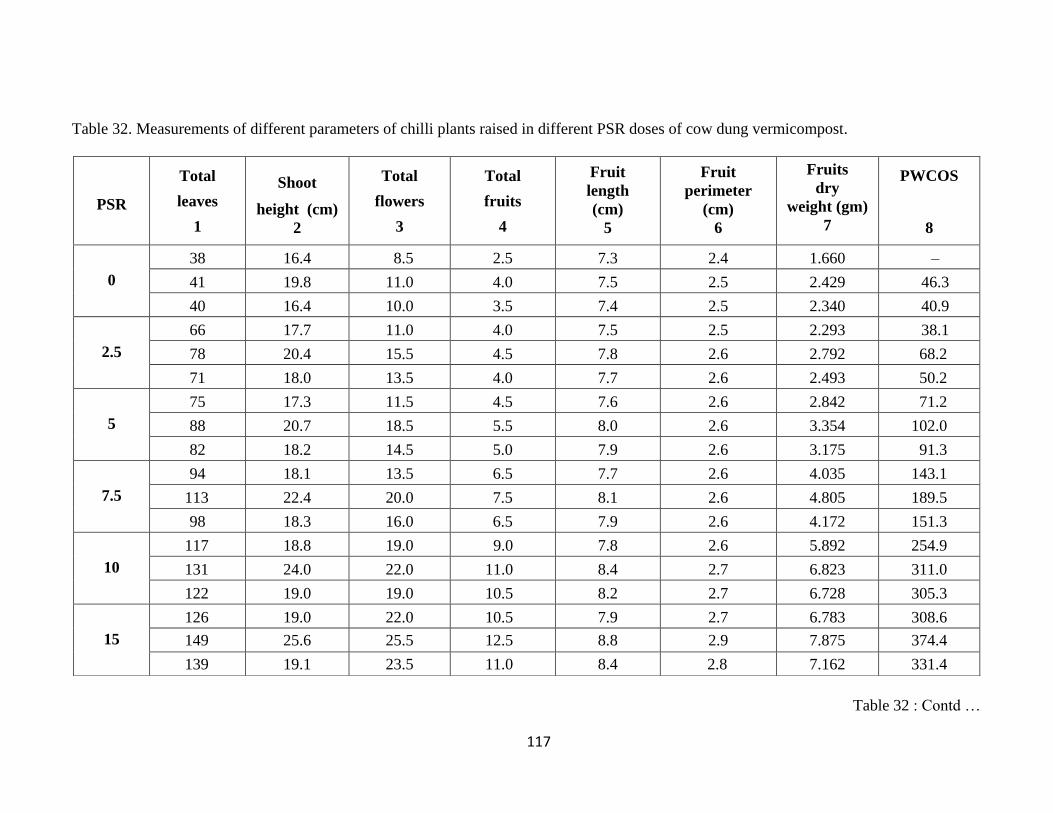


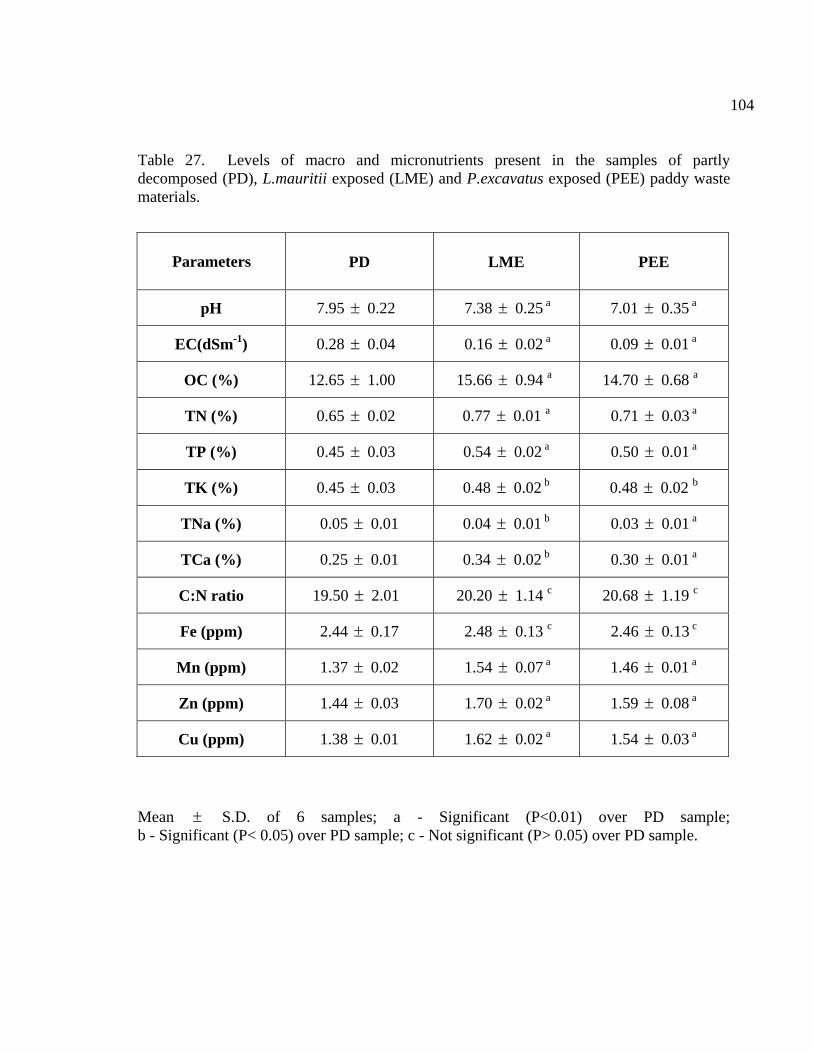


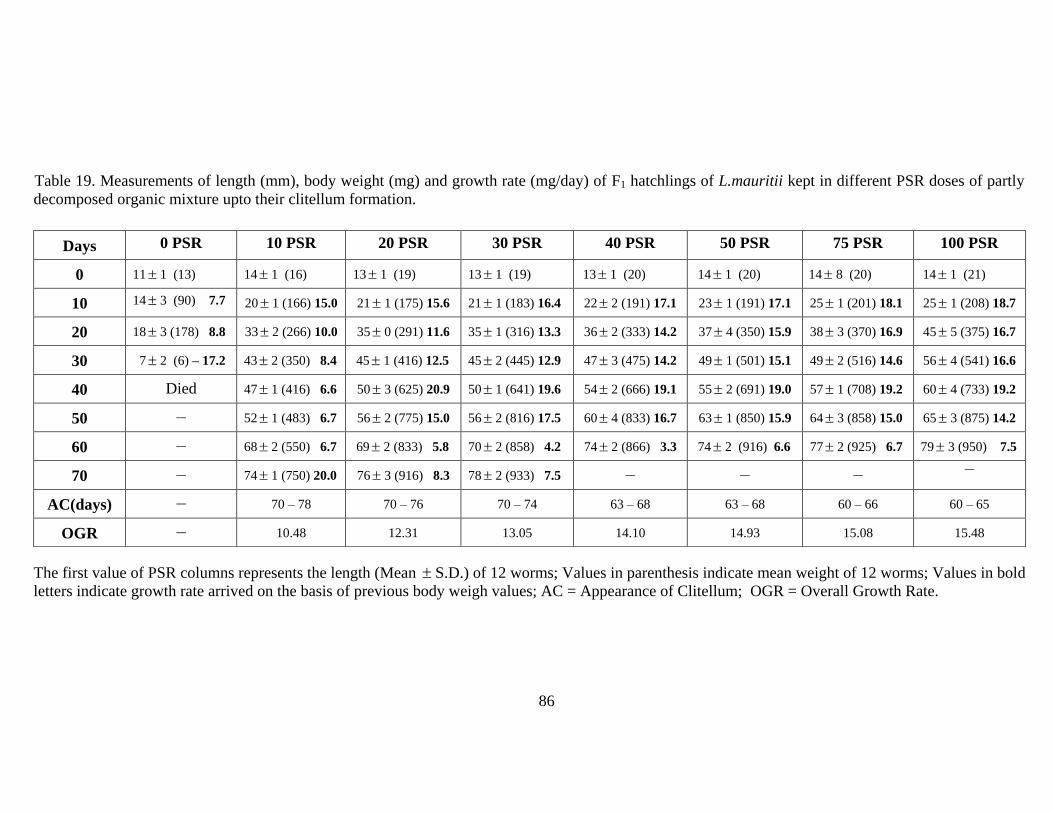


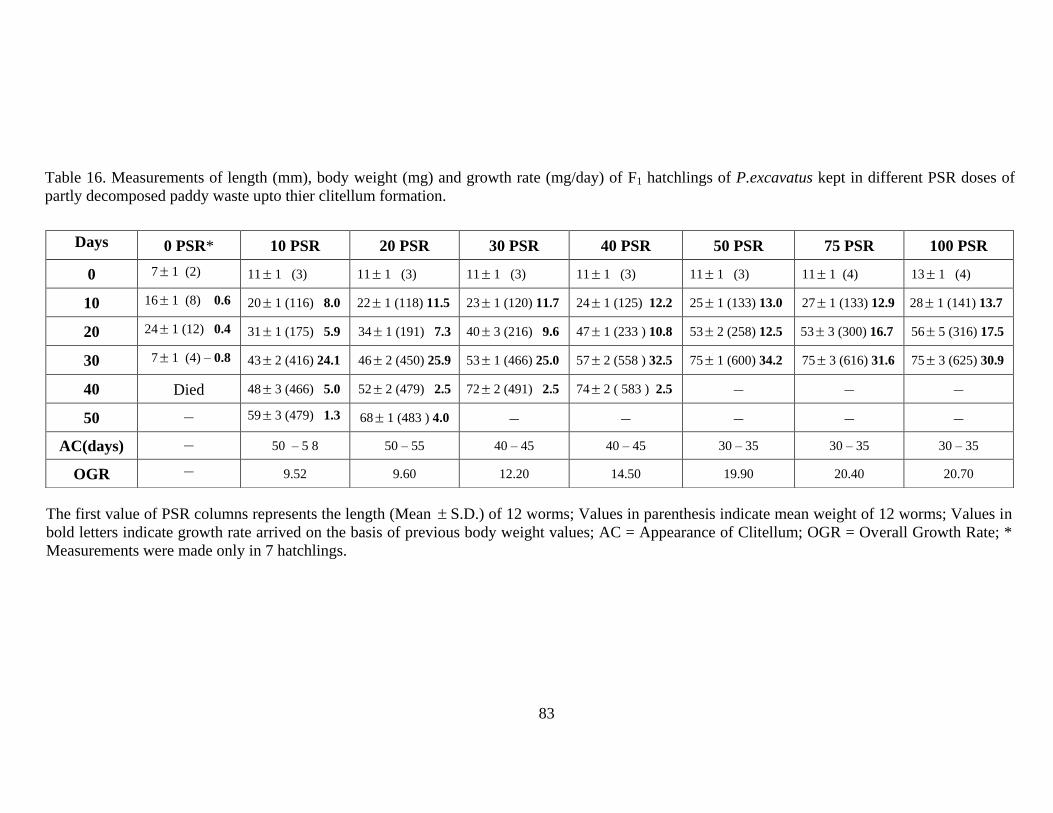


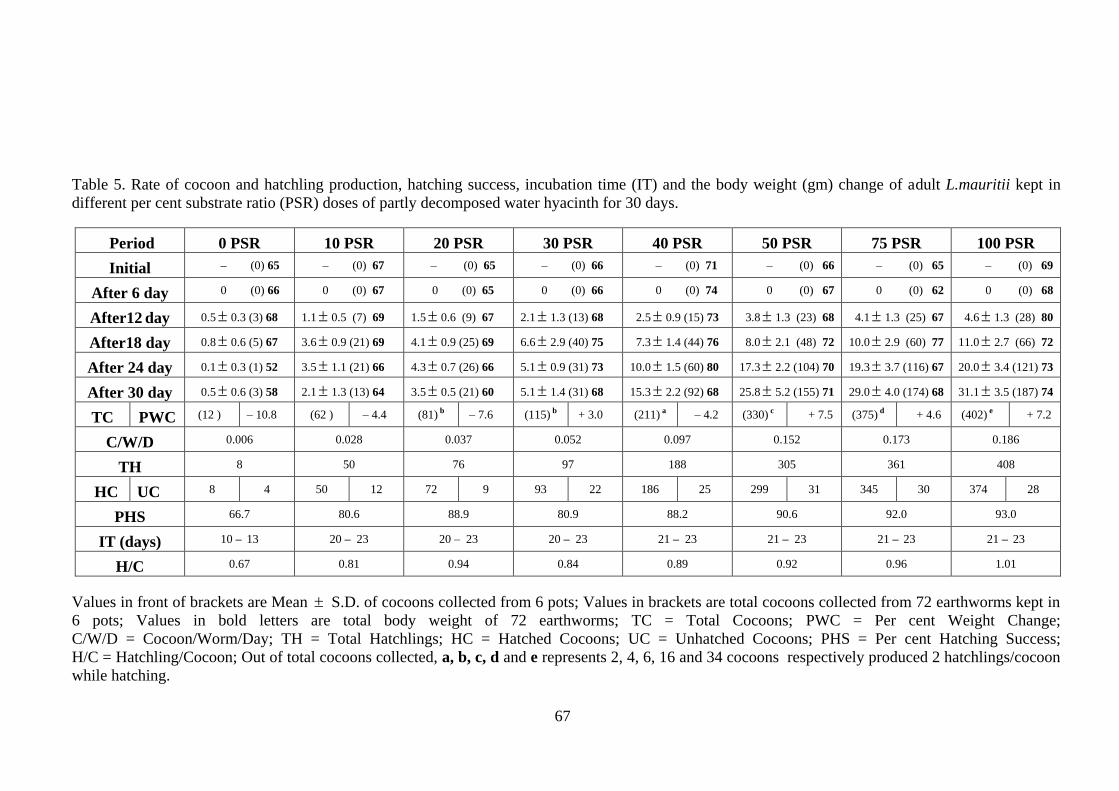

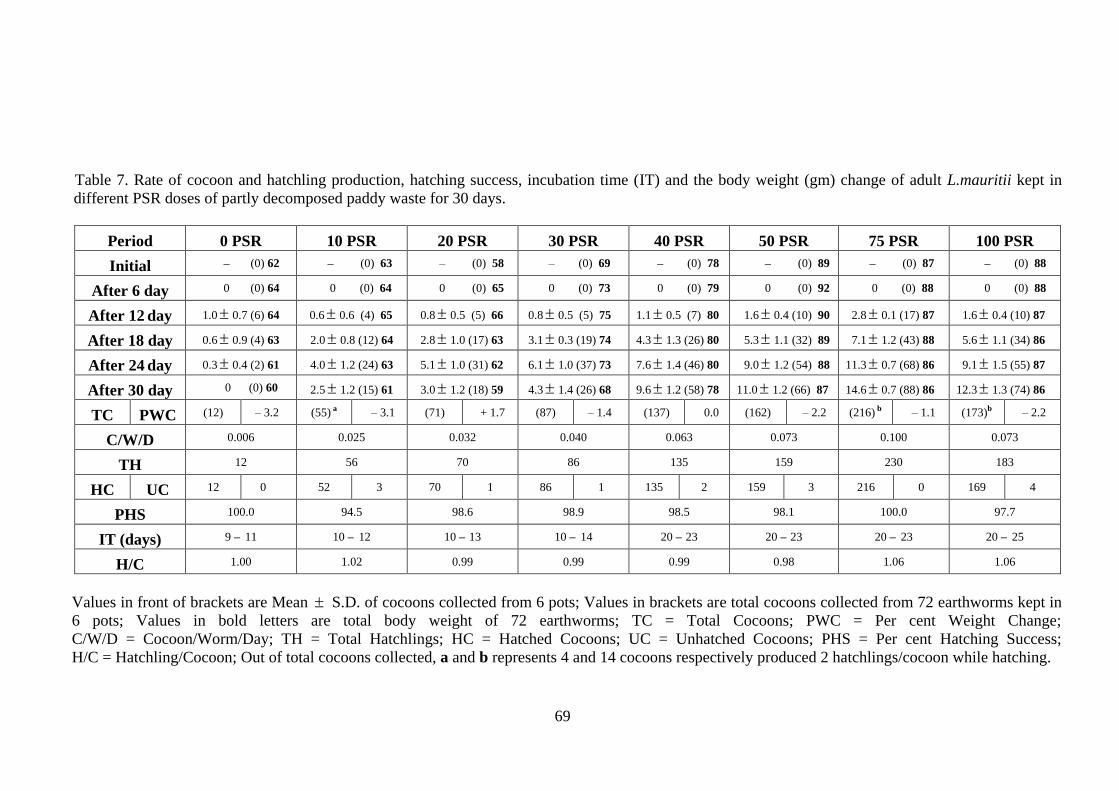
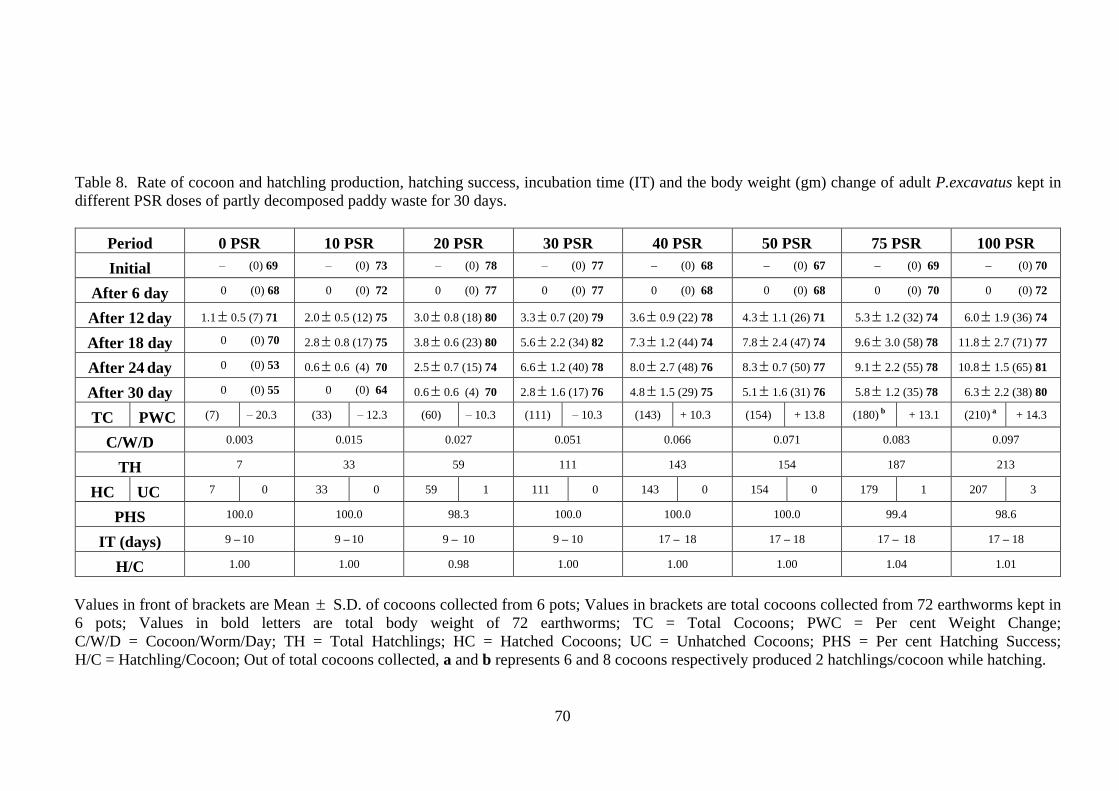


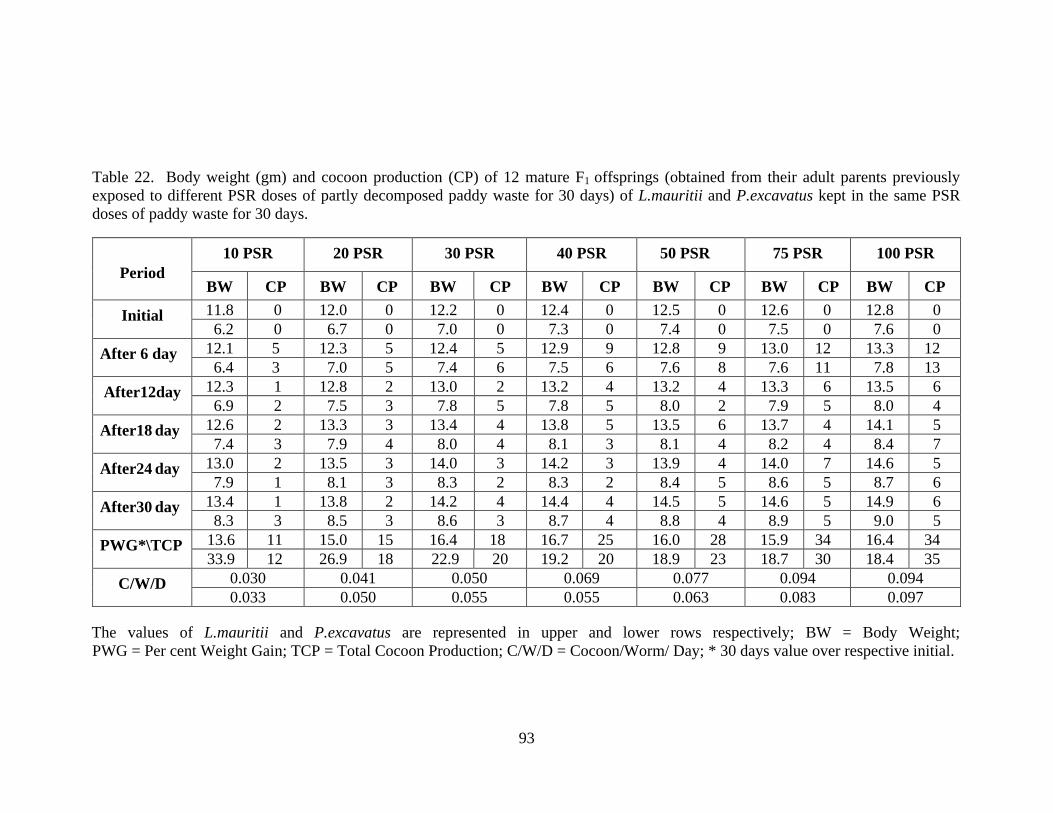
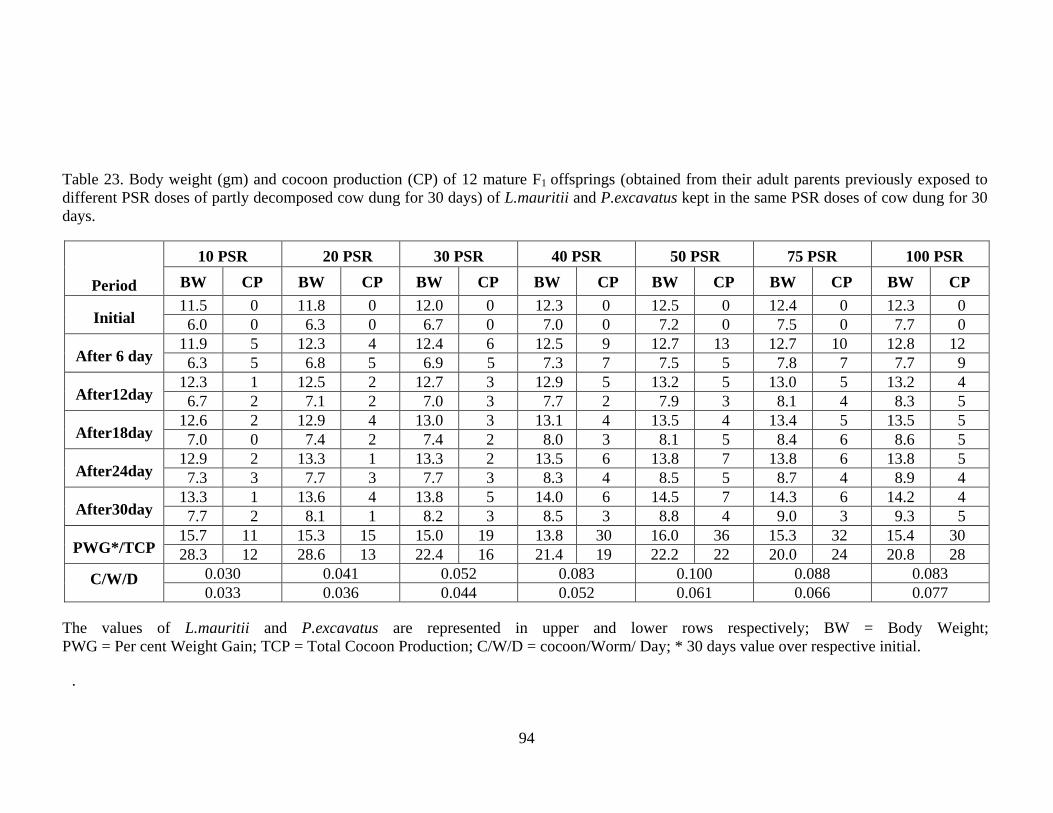


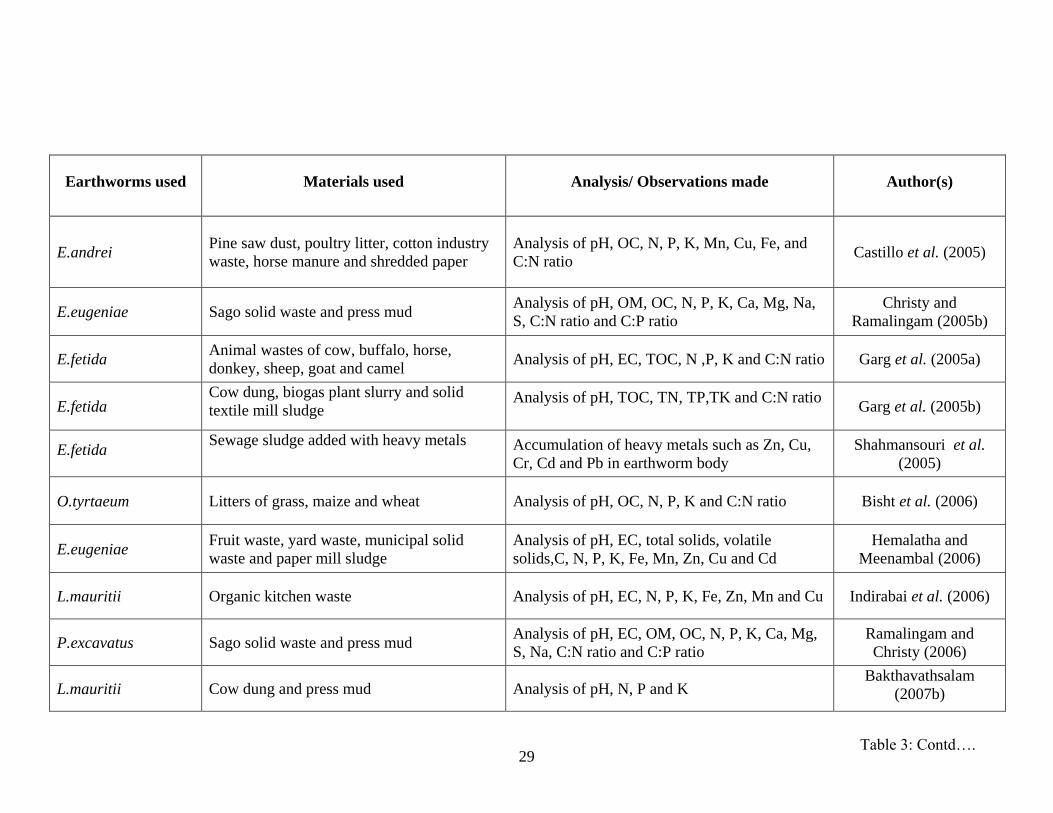


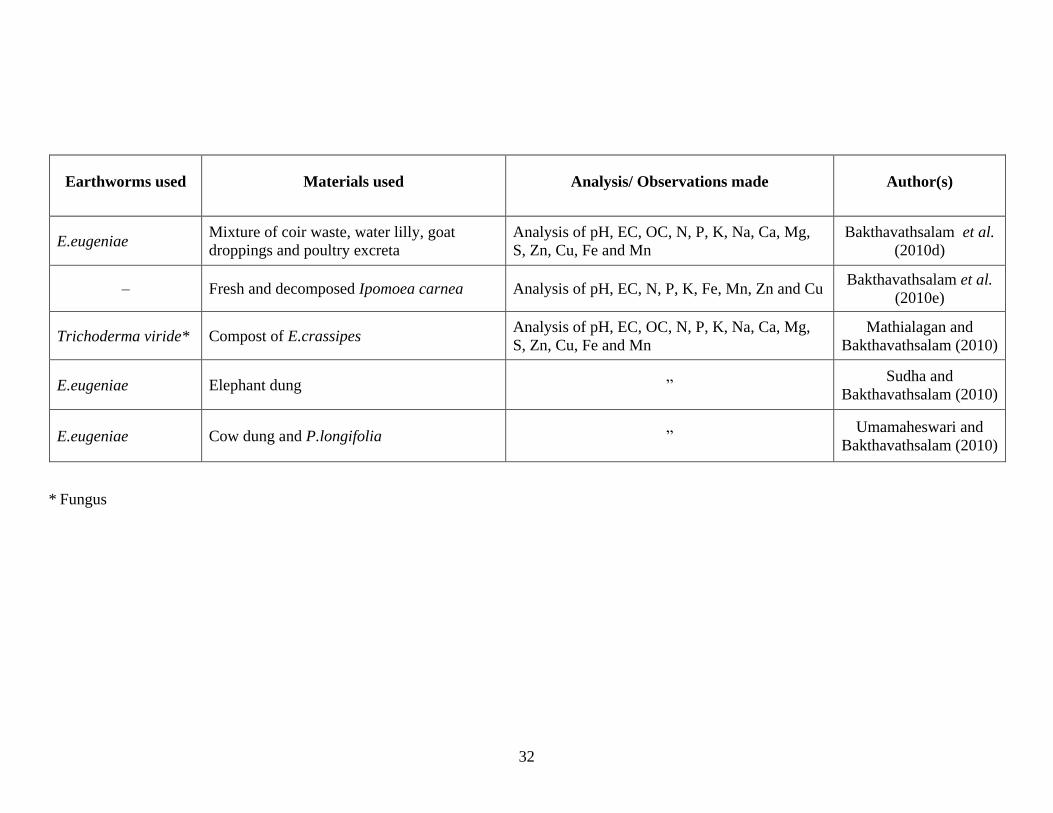


![Ballade [Op.288] - Free-scores.com · Title: Ballade [Op.288] Author: Reinecke, Carl - Arranger: Reinecke, Carl - Publisher: Leipzig: Jul. Heinr. Zimmermann, 1911. Plate Z. 5005 Subject:](https://static.documents.pub/doc/80x56/60f9d297d52ad7638e5628c7/ballade-op288-free-title-ballade-op288-author-reinecke-carl-arranger.jpg)

