Organic Trade Association's 2013 Organic Industry Survey Intro Organic Trade Association (OTA) 2013 Organic Industry Survey Nutrition Business Journal, on behalf of the Organic Trade Association, is conducting an annual survey of the organic products industry. The objective of this survey is to gauge the size and growth of the organic industry in North America by product category. This information will help OTA raise the profile of the organic industry, accurately presenting its contribution to the national economy and building credibility for its members in the eyes of the media, the government and the private sector. We ask you to provide information about your company and to share growth estimates for several food and product categories. We understand that information about your company's sales may be private, and we assure you that your responses will remain confidential. Figures will be used to construct an aggregate model of the industry, in addition to a list of top organic manufacturers according to revenue ranges (specific figures derived from this survey will not be detailed). For the success of this ambitious project, it is important that each company fill out a survey. Respondents will receive a free copy of the executive summary of the OTA 2013 Organic Industry Survey If you have any questions, please contact NBJ Market Intelligence Analyst James Johnson at [email protected] or at (303) 998-9336 or OTA Associate Director, Conference and Product Development, Angela Jagiello at [email protected]. or at (802) 275-3831. If you would like a hard copy of the survey to reference while gathering the information needed to complete the survey, please contact James at the e-mail above or follow this link: <link to come>.
Transcript
Organic Trade Association's 2013 Organic
Industry Survey
Intro
Organic Trade Association (OTA) 2013 Organic Industry Survey
Nutrition Business Journal, on behalf of the Organic Trade Association, is
conducting an annual survey of the organic products industry.
The objective of this survey is to gauge the size and growth of the organic
industry in North America by product category. This information will help OTA
raise the profile of the organic industry, accurately presenting its contribution to
the national economy and building credibility for its members in the eyes of the
media, the government and the private sector.
We ask you to provide information about your company and to share growth
estimates for several food and product categories. We understand that
information about your company's sales may be private, and we assure you that
your responses will remain confidential. Figures will be used to construct an
aggregate model of the industry, in addition to a list of top organic
manufacturers according to revenue ranges (specific figures derived from this
survey will not be detailed). For the success of this ambitious project, it is
important that each company fill out a survey. Respondents will receive a free
copy of the executive summary of the OTA 2013 Organic Industry Survey
If you have any questions, please contact NBJ Market Intelligence Analyst James
The next questions address your experience with inventory management.
3) How did your overall inventory levels change in 2012 versus 2011?
( ) New company
( ) Down more than 20%
( ) Down 10% to <20%
( ) Down 0% to <10%
( ) About even
( ) Up 0% to 10%
( ) Up >10% to 20%
( ) Up more than 20%
4) If overall sales were down in 2012, what was the biggest factor?
( ) New Company
( ) Sales weren't down
( ) Reduced orders due to distributor/retailer inventory reduction
( ) Reduced orders due to decreased consumer purchases
( ) Reduced sales due to price decreases
( ) Reduced sales, not sure why
( ) Reduced sales for other reasons (please specify):: _________________
5) How did order levels from distributors and direct-order retailers change in 2012 versus
2011?
( ) New company
( ) Down more than 20%
( ) Down 10% to <20%
( ) Down 0% to <10%
( ) About even
( ) Up 0% to 10%
( ) Up >10% to 20%
( ) Up more than 20%
( ) Not Applicable
End of Page: Jump to Q8
Inventory Contraction - Retailer
Inventory Trends
The next questions address your experience with inventory management.
6) How did your overall inventory levels change in 2012 versus 2011?
( ) New company
( ) Down more than 20%
( ) Down 10% to <20%
( ) Down 0% to <10%
( ) About even
( ) Up 0% to 10%
( ) Up >10% to 20%
( ) Up more than 20%
7) If overall sales were down in 2012, what was the biggest factor:
( ) New Company
( ) Sales weren't down
( ) Reduced sales due to decreased consumer purchases
( ) Reduced sales due to price reductions at retail
( ) Reduced sales, but I don't know why
( ) Reduced sales due to another reason (please specify):: _________________
Company
Information about your company
Note: We understand that information about your company may be private. NONE
OF THE COMPANY INFORMATION YOU PROVIDE WILL BE SHARED
WITH ANYONE. Data will be used to construct an aggregate model of the industry,
and we will only use sales information to rank the top organic manufacturers
according to revenue ranges.
8) 2012 Employees:
(Please enter "Not Sure" if you don't know)
Total number of full time and full-time equivalent employees:: _________________________
Total number of part-time/seasonal employees:: _________________________
9) Please indicate how employment levels in 2012 compare to previous years and growth
you expect for 2013:
2012
compared to
2011
2013
compared to
2012
2012
compared to
2007
2012
compared to
2002
Full-time ___ ___ ___ ___
Part-time/Seasonal ___ ___ ___ ___
10) Please estimate the percentage of your employees operating in the following segments in
2012: If you do not have any employees in a category, please enter "0" or leave blank.
Total should sum to 100.
_______Research & Development
_______Marketing
_______Sales
_______General or other office personnel
_______Warehousing
_______Production
_______Farming
_______Retail
_______Volunteers
_______Other
End of Page: If your core business type is Trade Association, Organic Certifier, or
Consultant/Service Provider, Jump to Q151
Overall Sales
Company Sales
Note: For the following questions, please keep these definitions in mind:
"Organic" includes products that are certified as:
"100% Organic"
"Organic" (95%+ organic)
"Made with organic ingredients" (70%+ organic)
Organic Does NOT include products that are made with less than 70% organic ingredients
11) 2012 gross TOTAL PRODUCTS dollar sales:
( ) Not Sure
( ) $0 to $50 thousand
( ) >$50 to $100 thousand
( ) >$100 thousand to $0.5 million
( ) >$0.5 million to $1 million
( ) >$1 to $2 million
( ) >$2 to $3 million
( ) >$3 to $5 million
( ) >$5 to $10 million
( ) >$10 $15 million
( ) >$15 to $20 million
( ) >$20 to $25 million
( ) >$25 to $30 million
( ) >$30 to $40 million
( ) >$40 to $50 million
( ) >$50 to $60 million
( ) >$60 to $80 million
( ) >$80 to $100 million
( ) >$100 to $150 million
( ) >$150 to $200 million
( ) >$200 to $250 million
( ) >$250 to $300 million
( ) >$300 to $400 million
( ) >$400 to $500 million
( ) >$500 to $1 billion
( ) >$1 billion
12) 2012 gross ORGANIC PRODUCTS dollar sales:
( ) Not Sure
( ) $0 to $50 thousand
( ) >$50 to $100 thousand
( ) >$100 thousand to $0.5 million
( ) >$0.5 million to $1 million
( ) >$1 to $2 million
( ) >$2 to $3 million
( ) >$3 to $5 million
( ) >$5 to $10 million
( ) >$10 $15 million
( ) >$15 to $20 million
( ) >$20 to $25 million
( ) >$25 to $30 million
( ) >$30 to $40 million
( ) >$40 to $50 million
( ) >$50 to $60 million
( ) >$60 to $80 million
( ) >$80 to $100 million
( ) >$100 to $150 million
( ) >$150 to $200 million
( ) >$200 to $250 million
( ) >$250 to $300 million
( ) >$300 to $400 million
( ) >$400 to $500 million
( ) >$500 to $1 billion
( ) >$1 billion
Organic Sales
Information about your company's organic sales
Note: "Organic" includes:
"100% Organic"
"Organic" (95%+ organic)
"Made with organic ingredients" (70%+ organic)
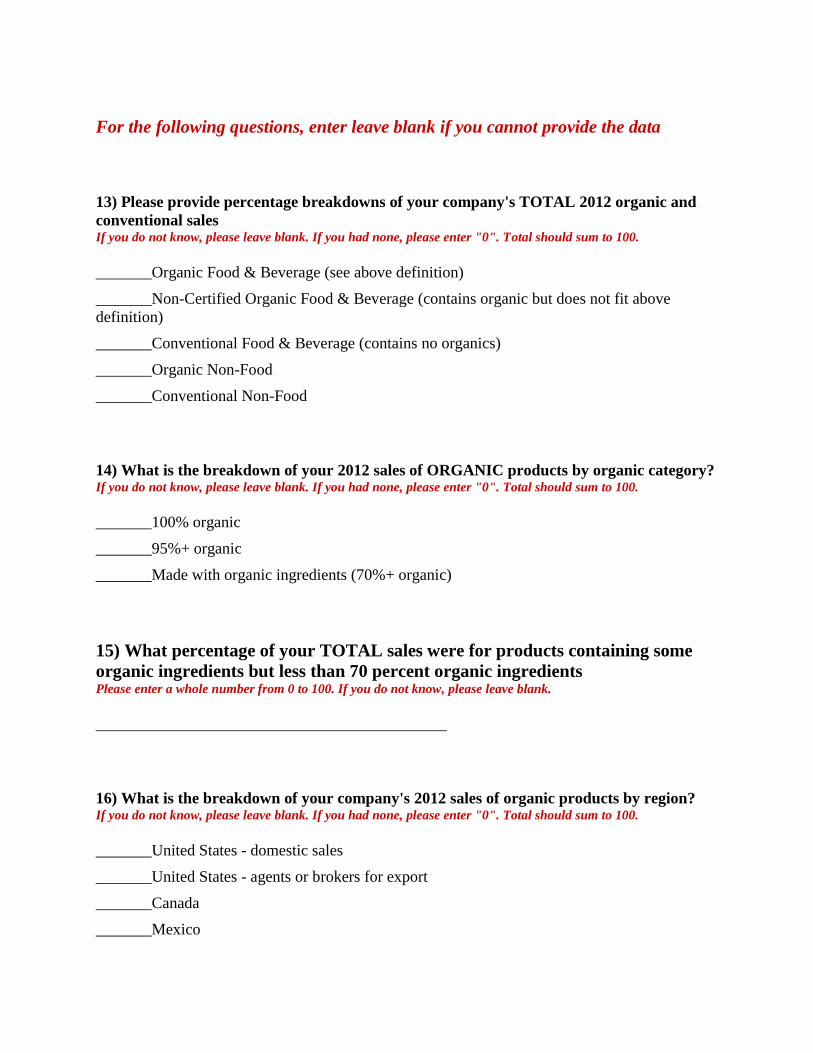
For the following questions, enter leave blank if you cannot provide the data
13) Please provide percentage breakdowns of your company's TOTAL 2012 organic and
conventional sales If you do not know, please leave blank. If you had none, please enter "0". Total should sum to 100.
_______Organic Food & Beverage (see above definition)
_______Non-Certified Organic Food & Beverage (contains organic but does not fit above
definition)
_______Conventional Food & Beverage (contains no organics)
_______Organic Non-Food
_______Conventional Non-Food
14) What is the breakdown of your 2012 sales of ORGANIC products by organic category? If you do not know, please leave blank. If you had none, please enter "0". Total should sum to 100.
_______100% organic
_______95%+ organic
_______Made with organic ingredients (70%+ organic)
15) What percentage of your TOTAL sales were for products containing some
organic ingredients but less than 70 percent organic ingredients Please enter a whole number from 0 to 100. If you do not know, please leave blank.
____________________________________________
16) What is the breakdown of your company's 2012 sales of organic products by region? If you do not know, please leave blank. If you had none, please enter "0". Total should sum to 100.
_______United States - domestic sales
_______United States - agents or brokers for export
_______Canada
_______Mexico
_______Latin America/South America
_______Europe
_______Asia/Pacific
_______Australia/New Zealand
_______Africa
_______Middle East
17) Please give the percentage growth of your company's gross ORGANIC sales Please enter percentages as whole numbers (For example 4 for 4%). If you do not know, please enter "Not
Sure". If you weren't in business, please enter "NA".
Growth in 2010: _________________________
Growth in 2011: _________________________
Growth in 2012: _________________________
Growth forecast for 2013: _________________________
Organic Seal
18) Do you display the USDA Organic seal on any of your products?*
( ) Yes
( ) No
Organic Labeling
USDA Organic Seal/Organic Raw Materials
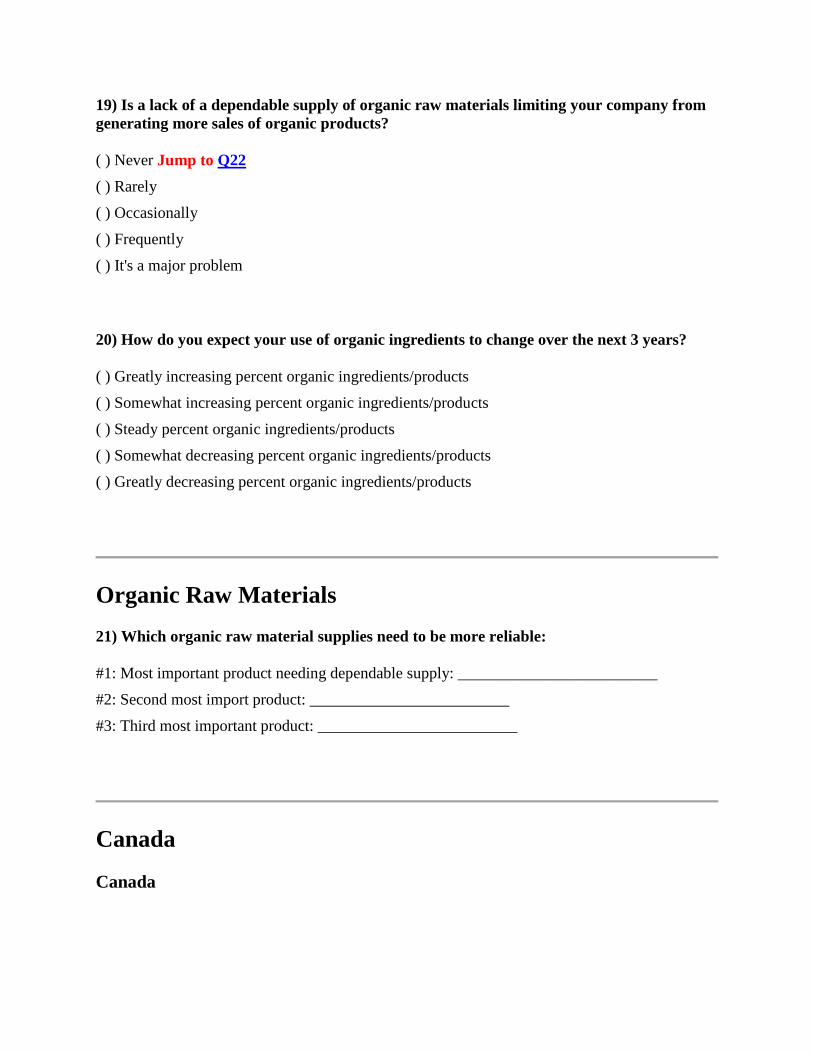
19) Is a lack of a dependable supply of organic raw materials limiting your company from
generating more sales of organic products?
( ) Never Jump to Q22
( ) Rarely
( ) Occasionally
( ) Frequently
( ) It's a major problem
20) How do you expect your use of organic ingredients to change over the next 3 years?
21) Which organic raw material supplies need to be more reliable:
#1: Most important product needing dependable supply: _________________________
#2: Second most import product: _________________________
#3: Third most important product: _________________________
Canada
Canada
22) Did you source any ingredients from Canada in 2012?*
( ) Yes
( ) No Jump to Q24
Canada Sourcing
Canada
23) What is the value (in thousands of U.S. Dollars) of the ingredients you
sourced from Canada in 2012?
Please enter "NA" if you don't know
____________________________________________
Canada 2
Canada
24) Were any of your products available/sold in Canada in 2012?*
( ) Yes
( ) No Jump to Q27
Canada Selling
Canada
25) What is the value (in thousands of U.S. Dollars) of your products sold in
Canada in 2012? Please enter "NA" if you don't know
____________________________________________
26) If you are a U.S. based company, how has the U.S/Canadian Organic equivalency
agreement signed in 2009 affected your sales to Canada?
( ) New Company
( ) Greatly Reduced Sales
( ) Somewhat Reduced Sales
( ) Sales About Even
( ) Somewhat Increased Sales
( ) Greatly Increased Sales
( ) Not a U.S. based company
Canada 3
Canada
27) Are you a Canadian company?*
( ) Yes
( ) No Jump to Q31
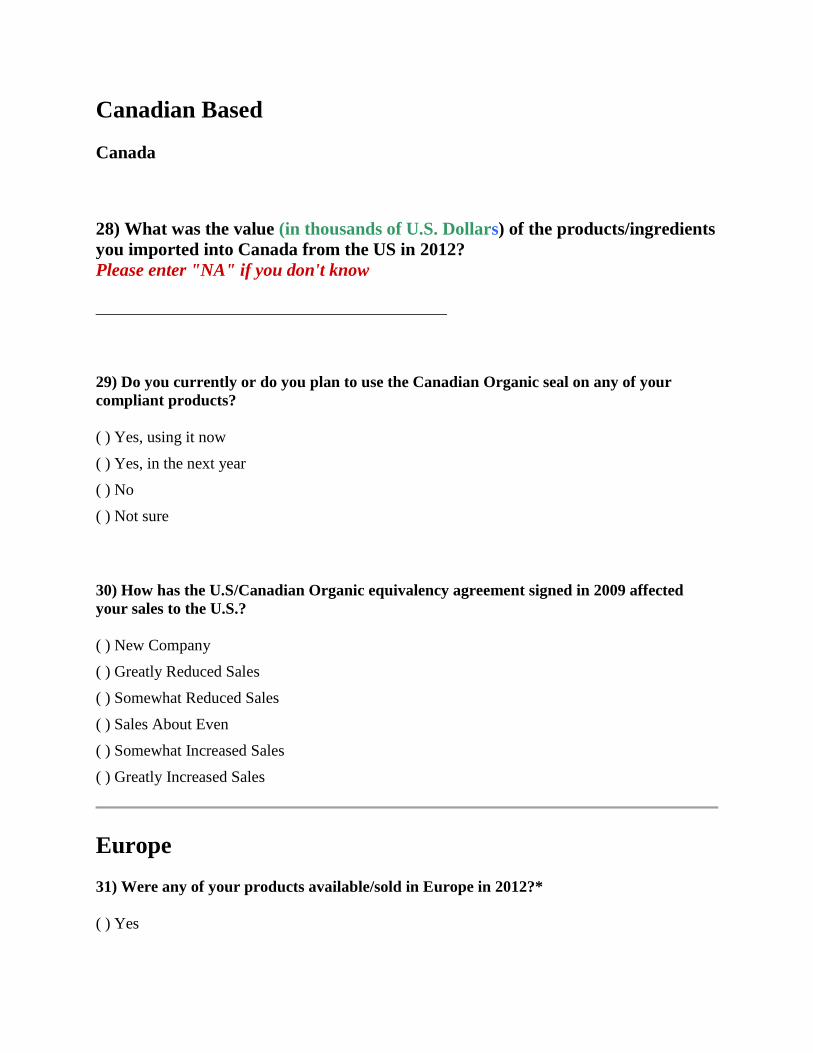
Canadian Based
Canada
28) What was the value (in thousands of U.S. Dollars) of the products/ingredients
you imported into Canada from the US in 2012?
Please enter "NA" if you don't know
____________________________________________
29) Do you currently or do you plan to use the Canadian Organic seal on any of your
compliant products?
( ) Yes, using it now
( ) Yes, in the next year
( ) No
( ) Not sure
30) How has the U.S/Canadian Organic equivalency agreement signed in 2009 affected
your sales to the U.S.?
( ) New Company
( ) Greatly Reduced Sales
( ) Somewhat Reduced Sales
( ) Sales About Even
( ) Somewhat Increased Sales
( ) Greatly Increased Sales
Europe
31) Were any of your products available/sold in Europe in 2012?*
( ) Yes
( ) No Jump to Q34
32) What was the value (in thousands of U.S. Dollars) of your products sold in
Europe in 2012?
Please enter "NA" if you don't know
____________________________________________
33) If you are a U.S. based company, how has the U.S/European Organic equivalency
agreement signed in 2012 affected your sales to Europe?
( ) New Company
( ) Greatly Reduced Sales
( ) Somewhat Reduced Sales
( ) Sales About Even
( ) Somewhat Increased Sales
( ) Greatly Increased Sales
( ) Too early to Tell
() Not a U.S. based company
Sales Channel Breakdown
34) Sales Channel Breakdown: Please provide the percentage breakdown of your
company's TOTAL organic sales in 2012.
If you are a retailer, enter "100" next to the category that describes your type of store. If you do not know, please leave blank. If you had none, please enter "0". Total should sum to 100.
Organic Seeds, Rootstock and Seed Treatment: Seeds, Rootstock, Planting Stock,
Seed treatments, Seed Additives (not seeds to eat)
For the following questions, please enter "Not sure" if you can't provide the data. Leave blank or enter "0" if
you have no sales in the category
35) Please indicate your company's TOTAL ORGANIC 2012 sales in these categories
(U.S. Dollar value in thousands)
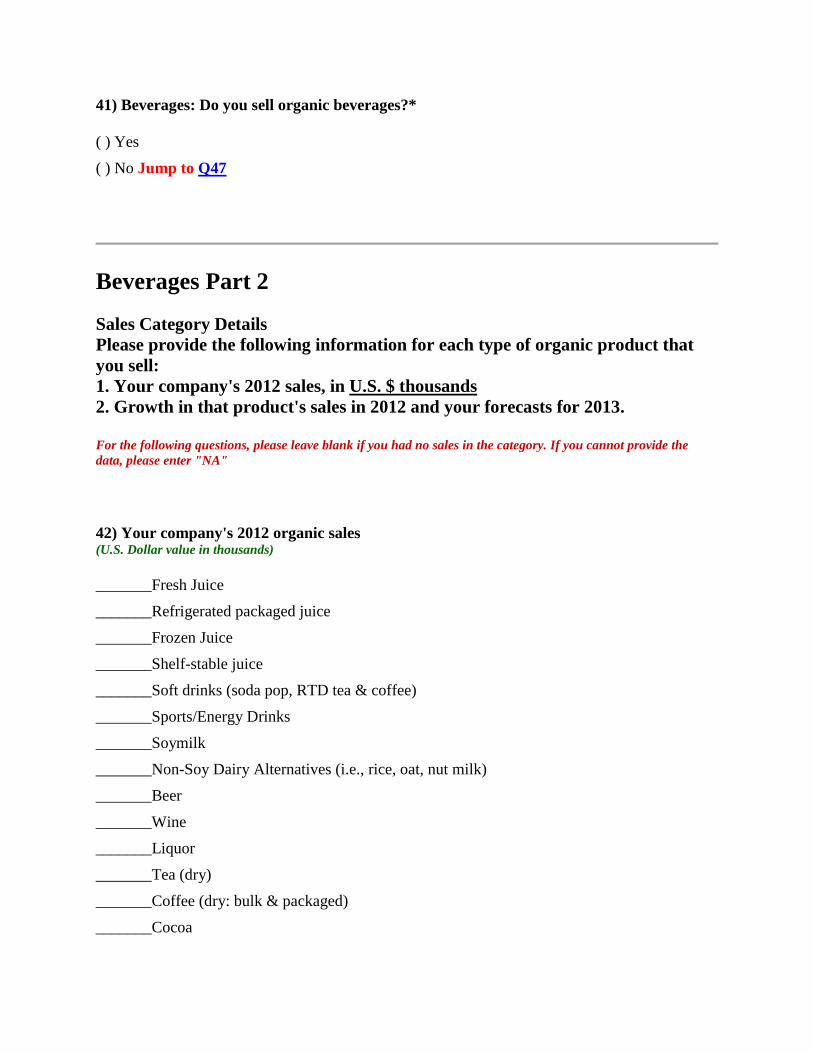
_______Beverages
_______Baked Goods & Grains
_______Meat and Seafood
_______Fruits and Vegetables
_______Dairy
_______Snacks
_______Packaged/Prepared Foods
_______Condiments
_______Nutritional Supplements
_______Personal Care
_______Clothing & Fibers
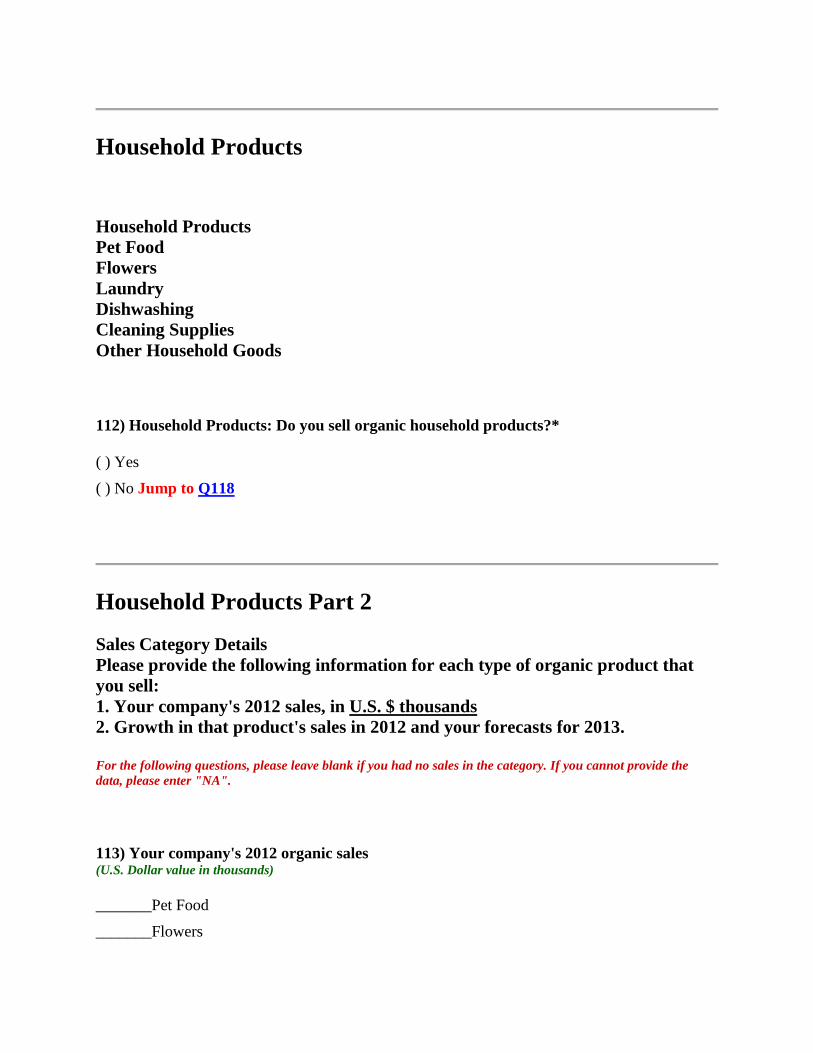
_______Household Products
_______Other
Private Label
Private Label
For the following questions, please leave blank if you can't provide the data. Please enter "0" if you have no
sales in the category
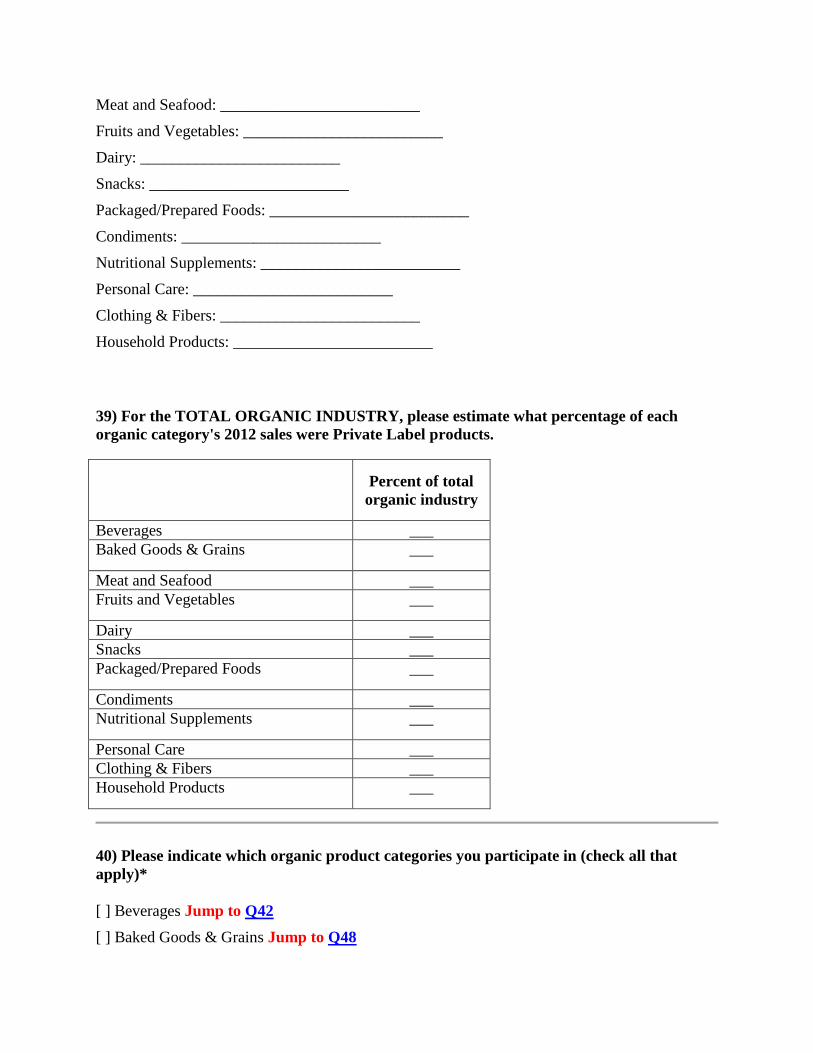
36) Please provide percentage breakdowns of your company's TOTAL ORGANIC sales in
2012 If you do not know, please leave blank or if you had none, please enter "0". Total should sum to 100.
_______Contract Manufacturing
_______Private Label Manufacturing
_______Branded Products
37) Please indicate what percentage of your company's 2012 ORGANIC PRIVATE
LABEL sales were in each product category. If you are not sure or had none, please leave blank. If you had some private label sales, total should sum to 100.
_______Beverages
_______Baked Goods & Grains
_______Meat and Seafood
_______Fruits and Vegetables
_______Dairy
_______Snacks
_______Packaged/Prepared Foods
_______Condiments
_______Nutritional Supplements
_______Personal Care
_______Clothing & Fibers
_______Household Products
38) What was your company's 2012 sales growth for Private Label products in each
ORGANIC category? Please enter percent growth as a whole number (For example enter 2% as 2). If you do not participate in a
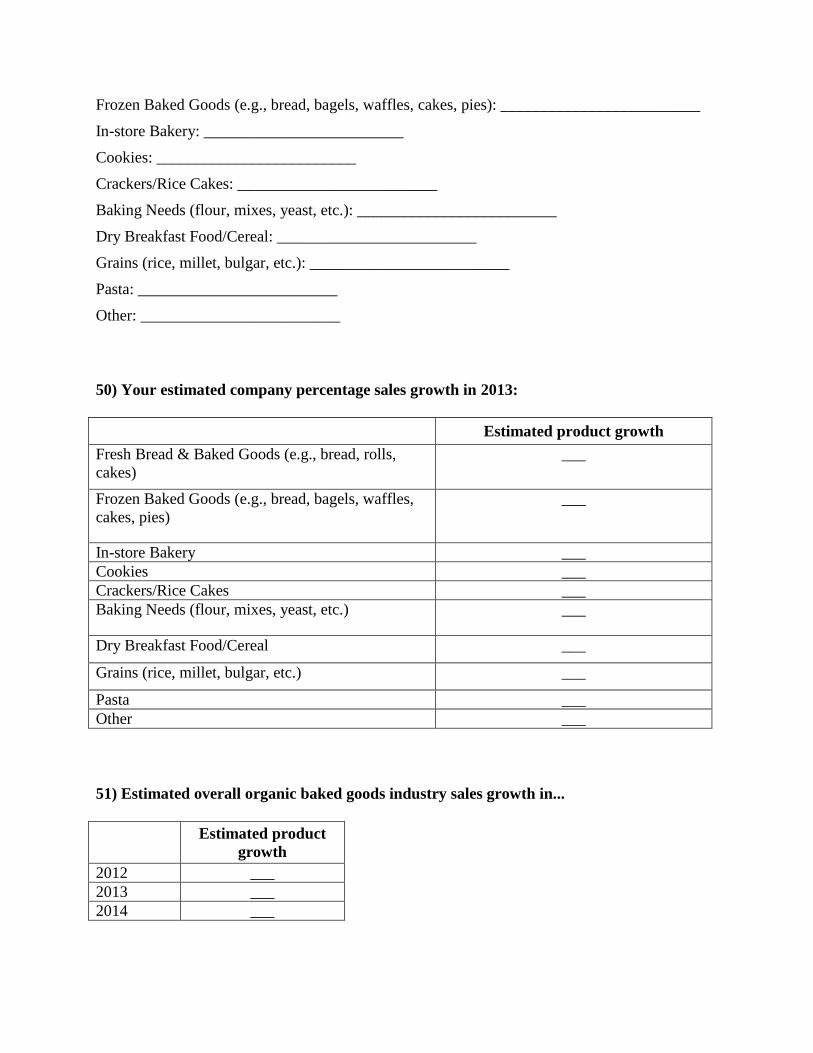
62) Your estimated company percentage sales growth in 2013:
Estimated product growth
Fresh Produce (bulk or loose) ___
Packaged & Branded Fresh
Produce
___
Frozen Fruits & Vegetables ___
Canned Fruits & Vegetables ___
Dried Fruits & Vegetables ___
Dried Beans ___
Other ___
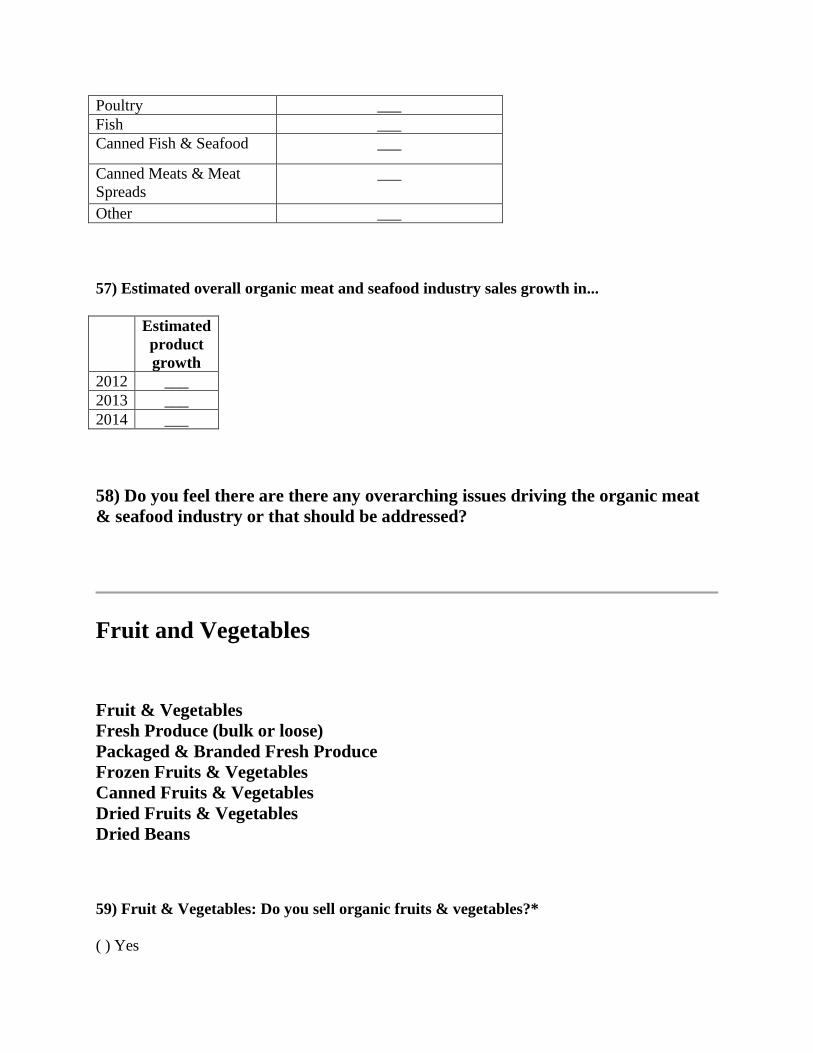
63) Estimated overall organic fruit and vegetable industry sales growth in...
Estimated
product
growth
2012 ___
2013 ___
2014 ___
What produce categories experienced the largest growth in 2012?
Of the bulk or loose (unpackaged) produce that you sell, what are your top 3 product categories?
Of the packaged and branded produce that you sell, what are your top 3 product categories (by highest sales volume)
What surprising sales trends are you seeing in the produce category right now? (for example, newly popular products, products that aren't selling, new varieties, etc.)
64) Do you feel there are there any overarching issues driving the organic fruit &
vegetable industry or that should be addressed?
For 2012, OTA is conducting a deep dive into the produce segment. Would you be available for a follow-up interview on this topic? ()Yes
()No
Dairy
Dairy
Milk/Cream
Cheese
Butter
Eggs
Yogurt
Ice Cream
Sour Cream
Cottage Cheese
Canned Milk
65) Dairy: Do you sell organic dairy?*
( ) Yes
( ) No Jump to Q71
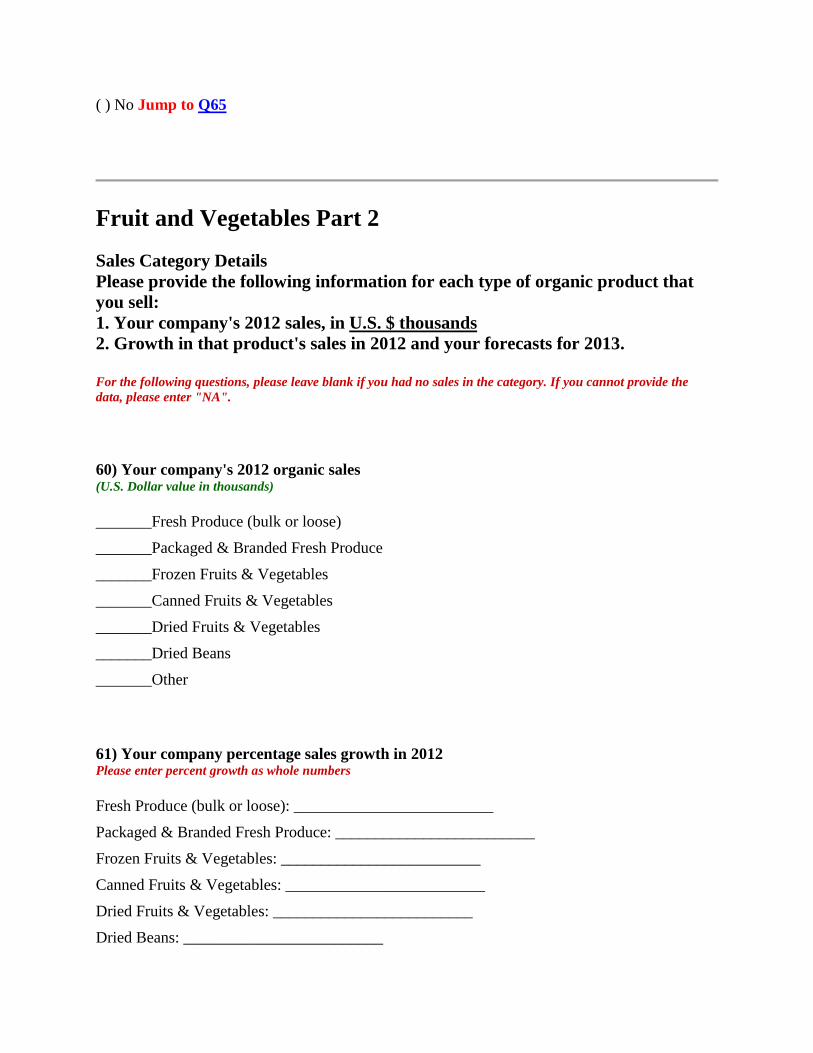
Dairy Part 2
Sales Category Details
Please provide the following information for each type of organic product that
you sell:
1. Your company's 2012 sales, in U.S. $ thousands
2. Growth in that product's sales in 2012 and your forecasts for 2013.
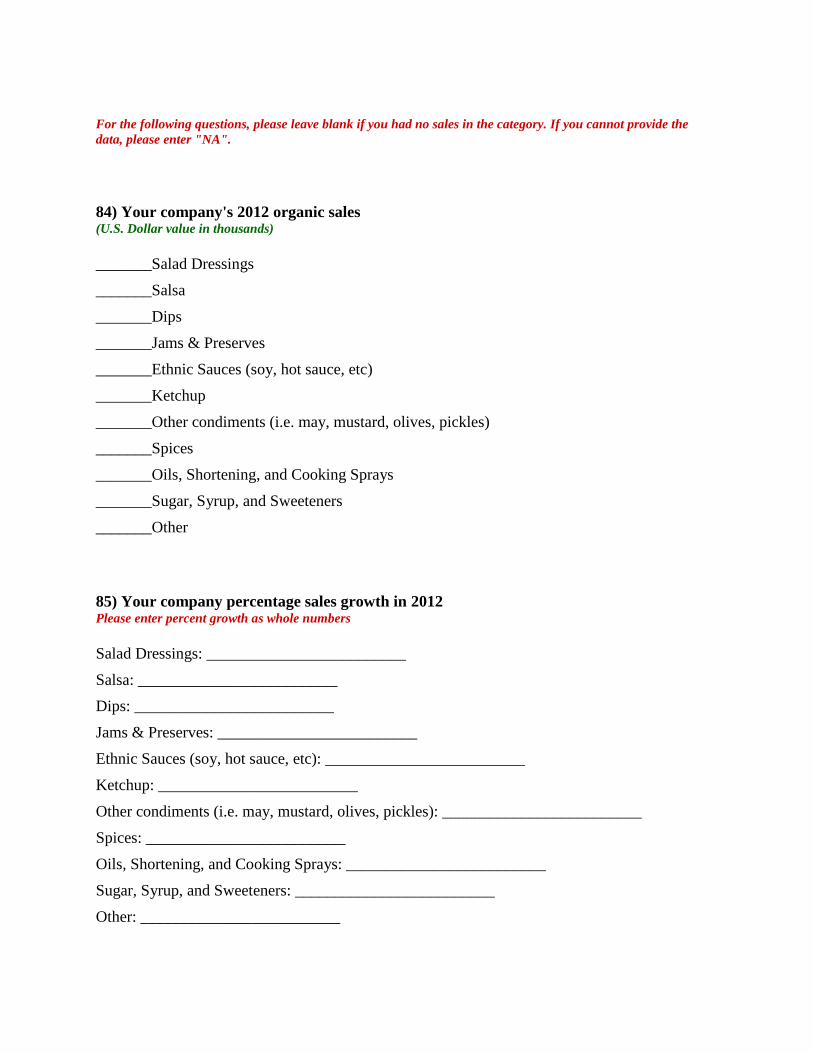
For the following questions, please leave blank if you had no sales in the category. If you cannot provide the
data, please enter "NA".
66) Your company's 2012 organic sales (U.S. Dollar value in thousands)
_______Milk/Cream
_______Cheese
_______Butter
_______Eggs
_______Yogurt
_______Ice Cream
_______Sour Cream
_______Cottage Cheese
_______Canned Milk
_______Other
67) Your company percentage sales growth in 2012 Please enter percent growth as whole numbers
Milk/Cream: _________________________
Cheese: _________________________
Butter: _________________________
Eggs: _________________________
Yogurt: _________________________
Ice Cream: _________________________
Sour Cream: _________________________
Cottage Cheese: _________________________
Canned Milk: _________________________
Other: _________________________
68) Your estimated company percentage sales growth in 2013:
Estimated
product
growth
Milk/Cream ___
Cheese ___
Butter ___
Eggs ___
Yogurt ___
Ice Cream ___
Sour Cream ___
Cottage Cheese ___
Canned Milk ___
Other ___
69) Estimated overall organic dairy industry sales growth in...
Estimated
product
growth
2012 ___
2013 ___
2014 ___
70) Do you feel there are there any overarching issues driving the organic dairy
industry or that should be addressed?
Snacks
Snacks
Chocolate/Candy Bars
Other Candy & Gum
Nuts (bulk & packaged)
Salty Snacks (chips, pretzels, popcorn)
Nutrition Bars
71) Snacks: Do you sell organic snacks?*
( ) Yes
( ) No Jump to Q77
Snacks Part 2
Sales Category Details
Please provide the following information for each type of organic product that
you sell:
1. Your company's 2012 sales, in U.S. $ thousands
2. Growth in that product's sales in 2012 and your forecasts for 2013.
For the following questions, please leave blank if you had no sales in the category. If you cannot provide the
data, please enter "NA".
72) Your company's 2012 organic sales (U.S. Dollar value in thousands)
_______Chocolate/Candy Bars
_______Other Candy & Gum
_______Nuts (bulk & packaged)
_______Salty Snacks (chips, pretzels, popcorn)
_______Nutrition Bars
_______Other
73) Your company percentage sales growth in 2012 Please enter percent growth as whole numbers
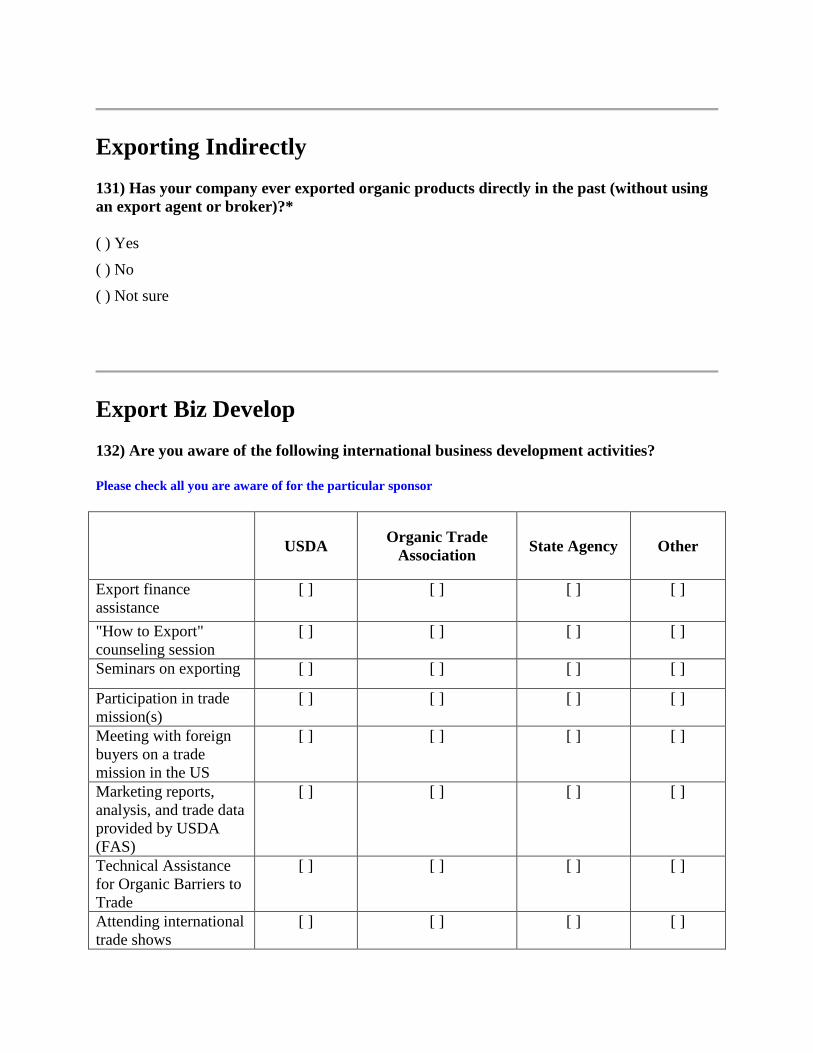
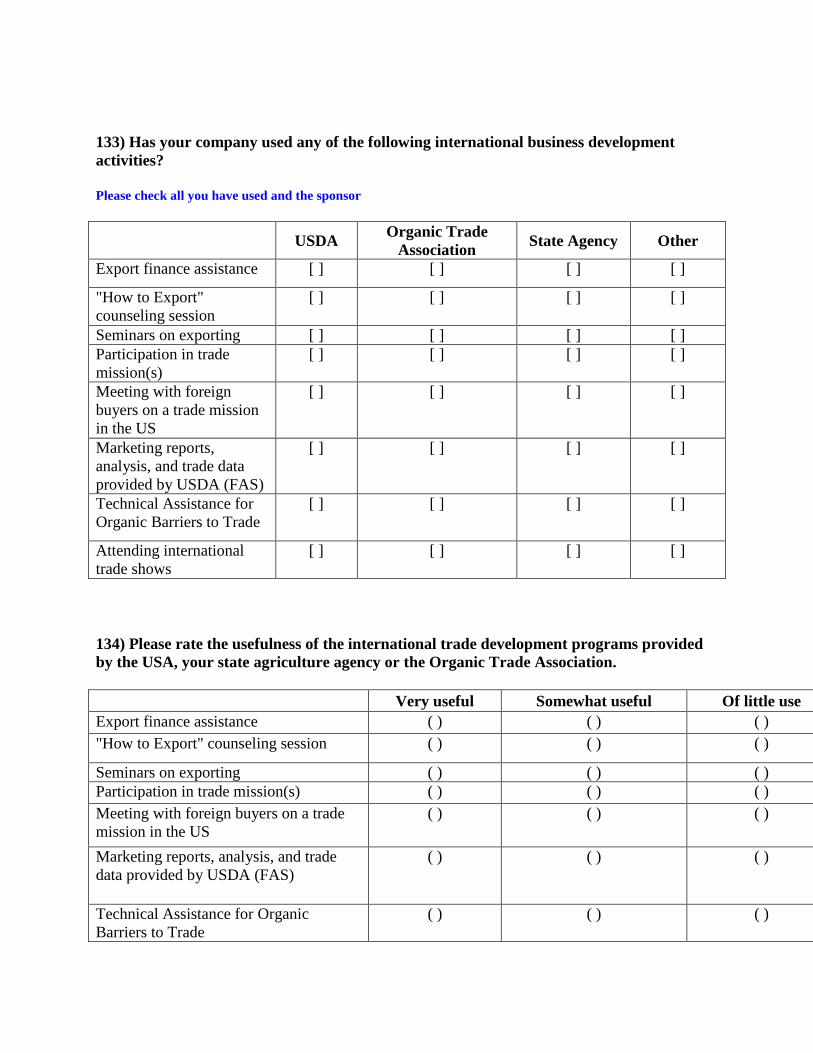
135) For how many years has your company been exporting organic products?
( ) Less than 1 year
( ) 1 to 2 years
( ) 3 to 5 years
( ) 6 to 10 years
( ) 11 to 20 years
( ) More than 20 years
( ) Not sure
136) What percentage of your 2012 ORGANIC sales were exports (includes sales to US
export agents/brokers)?
( ) 0%
( ) >0% to 5%
( ) >5% to 10%
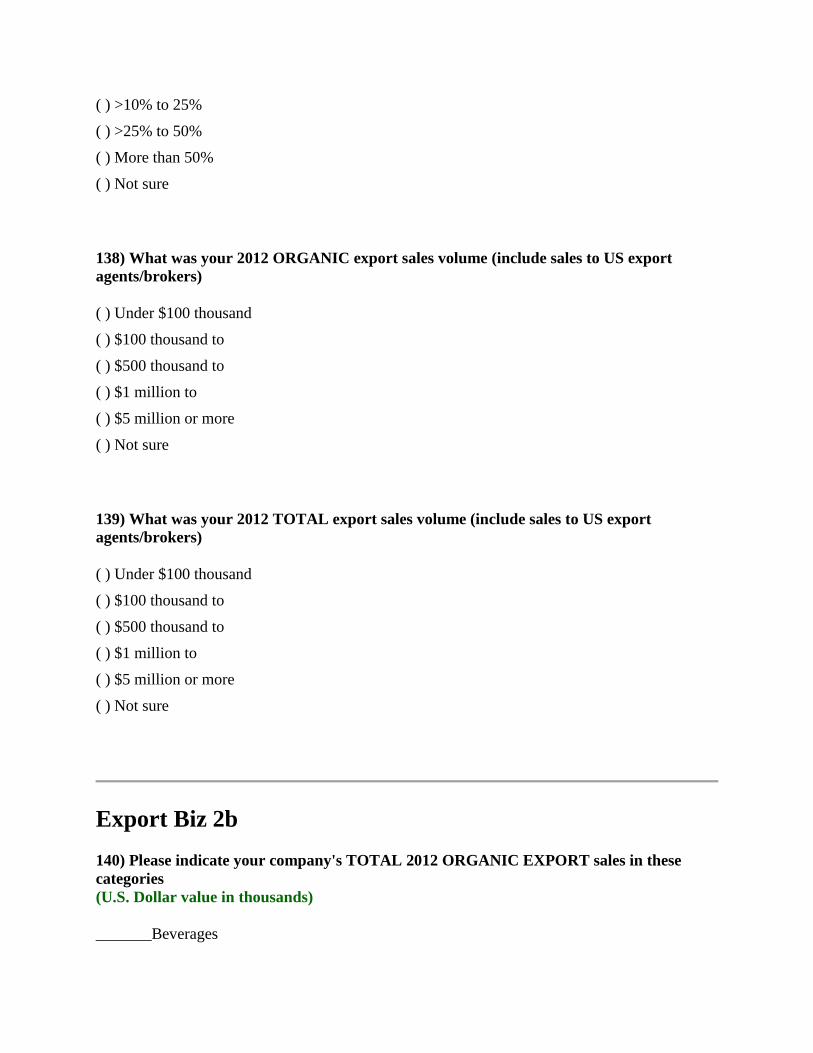
( ) >10% to 25%
( ) >25% to 50%
( ) More than 50%
( ) Not sure
137) What percentage of your TOTAL 2012 sales were exports (includes sales to US export
agents/brokers)?
( ) 0%
( ) >0% to 5%
( ) >5% to 10%
( ) >10% to 25%
( ) >25% to 50%
( ) More than 50%
( ) Not sure
138) What was your 2012 ORGANIC export sales volume (include sales to US export
agents/brokers)
( ) Under $100 thousand
( ) $100 thousand to
( ) $500 thousand to
( ) $1 million to
( ) $5 million or more
( ) Not sure
139) What was your 2012 TOTAL export sales volume (include sales to US export
agents/brokers)
( ) Under $100 thousand
( ) $100 thousand to
( ) $500 thousand to
( ) $1 million to
( ) $5 million or more
( ) Not sure
Export Biz 2b
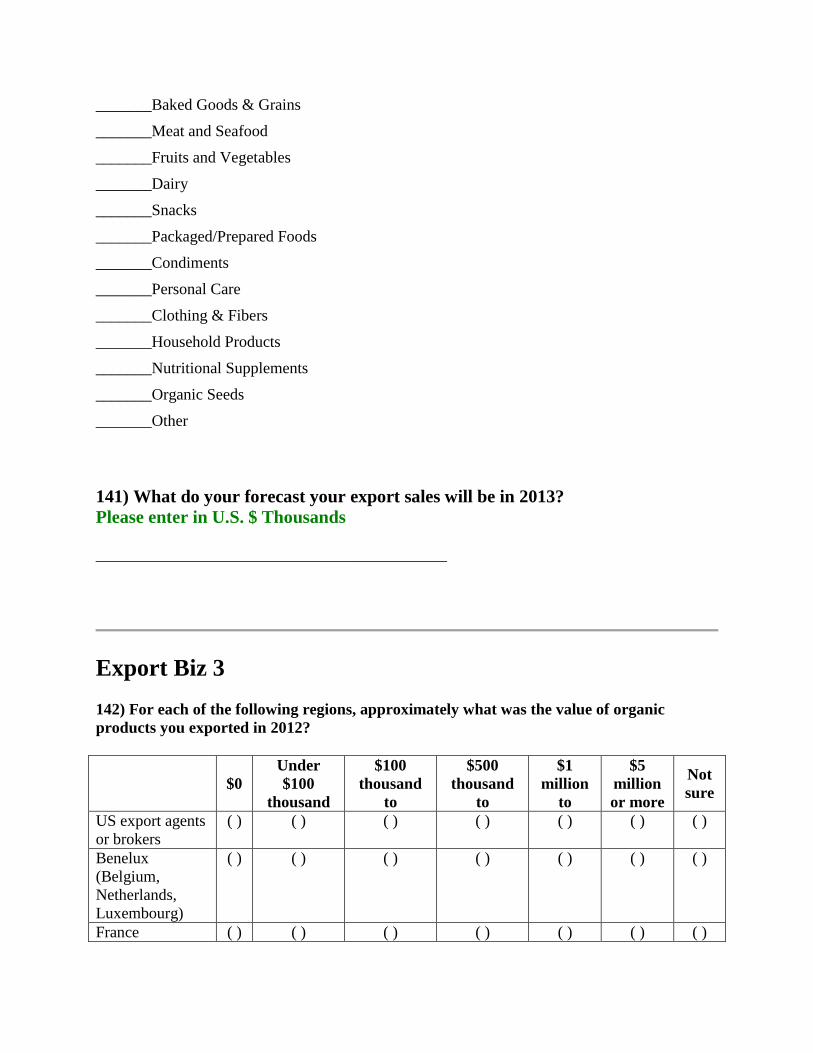
140) Please indicate your company's TOTAL 2012 ORGANIC EXPORT sales in these
categories
(U.S. Dollar value in thousands)
_______Beverages
_______Baked Goods & Grains
_______Meat and Seafood
_______Fruits and Vegetables
_______Dairy
_______Snacks
_______Packaged/Prepared Foods
_______Condiments
_______Personal Care
_______Clothing & Fibers
_______Household Products
_______Nutritional Supplements
_______Organic Seeds
_______Other
141) What do your forecast your export sales will be in 2013?
Please enter in U.S. $ Thousands
____________________________________________
Export Biz 3
142) For each of the following regions, approximately what was the value of organic
products you exported in 2012?
$0
Under
$100
thousand
$100
thousand
to
$500
thousand
to
$1
million
to
$5
million
or more
Not
sure
US export agents
or brokers
( ) ( ) ( ) ( ) ( ) ( ) ( )
Benelux
(Belgium,
Netherlands,
Luxembourg)
( ) ( ) ( ) ( ) ( ) ( ) ( )
France ( ) ( ) ( ) ( ) ( ) ( ) ( )
Germany ( ) ( ) ( ) ( ) ( ) ( ) ( )
United Kingdom ( ) ( ) ( ) ( ) ( ) ( ) ( )
Spain ( ) ( ) ( ) ( ) ( ) ( ) ( )
Italy ( ) ( ) ( ) ( ) ( ) ( ) ( )
European Union:
all countries
( ) ( ) ( ) ( ) ( ) ( ) ( )
Middle East ( ) ( ) ( ) ( ) ( ) ( ) ( )
Canada ( ) ( ) ( ) ( ) ( ) ( ) ( )
Mexico ( ) ( ) ( ) ( ) ( ) ( ) ( )
Caribbean ( ) ( ) ( ) ( ) ( ) ( ) ( )
Central America ( ) ( ) ( ) ( ) ( ) ( ) ( )
South America ( ) ( ) ( ) ( ) ( ) ( ) ( )
Russia ( ) ( ) ( ) ( ) ( ) ( ) ( )
China ( ) ( ) ( ) ( ) ( ) ( ) ( )
Hong Kong ( ) ( ) ( ) ( ) ( ) ( ) ( )
Japan ( ) ( ) ( ) ( ) ( ) ( ) ( )
South Korea ( ) ( ) ( ) ( ) ( ) ( ) ( )
Taiwan ( ) ( ) ( ) ( ) ( ) ( ) ( )
Southeast Asia ( ) ( ) ( ) ( ) ( ) ( ) ( )
South Asia
(India)
( ) ( ) ( ) ( ) ( ) ( ) ( )
Australia/New
Zealand
( ) ( ) ( ) ( ) ( ) ( ) ( )
Other (please
specify)
( ) ( ) ( ) ( ) ( ) ( ) ( )
Not Sure ( ) ( ) ( ) ( ) ( ) ( ) ( )
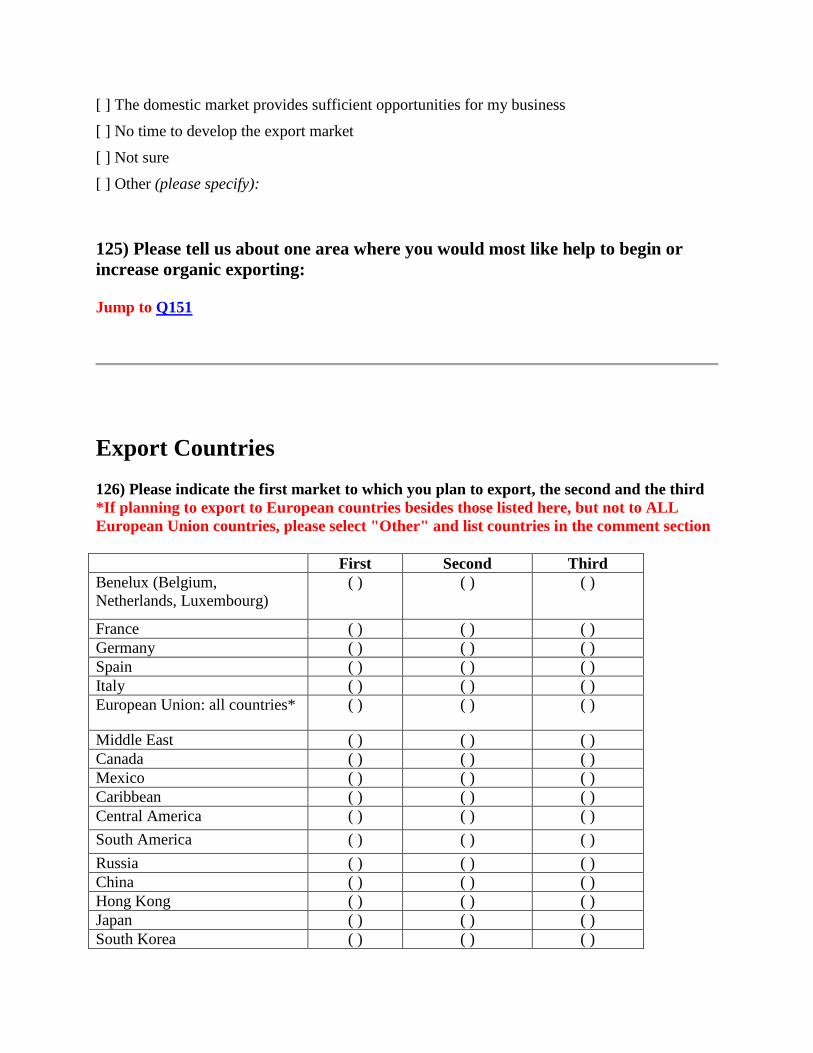
143) To which regions do you anticipate expanding your organic exports in the next 2-3
years? Please check all that apply
[ ] US export agents or brokers
[ ] Benelux (Belgium, Netherlands, Luxembourg)
[ ] France
[ ] Germany
[ ] United Kingdom
[ ] Spain
[ ] Italy
[ ] European Union: all countries
[ ] Middle East
[ ] Canada
[ ] Mexico
[ ] Caribbean
[ ] Central America
[ ] South America
[ ] Russia
[ ] China
[ ] Hong Kong
[ ] Japan
[ ] South Korea
[ ] Taiwan
[ ] Southeast Asia
[ ] South Asia (India)
[ ] Australia/New Zealand
[ ] Other (please specify)
[ ] Not Sure
Export Biz 4
144) What are the challenges to expanding your organic exports programs? Please check all that apply
[ ] Phytosanitary and food safety issues
[ ] Inability to modify products to international specifications
[ ] Inability to adapt labels or packaging to international specifications
[ ] Lack of sufficient knowledge of how to export and develop exports
[ ] High tariffs
[ ] Lack of knowledge of individual markets
[ ] Inability to locate appropriate buyers/ distributors/ importers
[ ] High cost of developing markets
[ ] Trade barriers from different organic regulations of importing countries
[ ] High cost of transporting products
[ ] Shelf life issues
[ ] Other (please specify):
145) Please check all the effective ways you've found to locate foreign buyers for your
organic products. Please check all that apply
[ ] Responding to advertisements in US trade magazines
[ ] Advertising in foreign trade magazines
[ ] Advertising in US trade magazines
[ ] Hosting foreign buyers at my plant
[ ] Meeting foreign buyers at US trade shows (reverse buyer missions)
[ ] Following up on trade leads obtained through US embassies in other countries
[ ] Referrals from my business associates
[ ] Attending trade shows in the US
[ ] Attending international trade shows
[ ] Online directories
[ ] OTA's Export Directory Online
[ ] Through the Web
[ ] Technical Assistance from OTA/FAS
[ ] Other (please specify):
Most Effective
146) Please indicate which ONE of the helpful ways you've found to locate foreign buyers
for your organic products is the MOST effective way to meet foreign buyers.
Trade Shows
147) Does your company exhibit at trade shows to promote export sales?*
( ) Yes
( ) No Jump to Q149
Trade Show Participant
148) Where does your company exhibit at trade shows to promote export sales?
( ) Inside the US
( ) Outside the US
( ) Both inside and outside the US
Trade Show Attendance
149) What trade shows do you usually attend in order to develop and/or maintain
international contacts? Please check all that apply
[ ] Do not attend trade shows
[ ] CHFA (Canadian Health Food Association) - Canada
[ ] Wellnes Show - Canada
[ ] CRFA Show - Canada
[ ] SIAL Canada - Canada
[ ] FMI (Food Marketing Institute) - US
[ ] American Food Fair (National Restaurant Association) - US
[ ] IFE Americas Food & Beverages - US
[ ] Fancy Food Show - US
[ ] Snack Expo (SNAXPO) - US
[ ] IFT (Institute of Food Technologists)-US
[ ] MAGIC Marketplace - US
[ ] NRA (National Restaurant Association) - US
[ ] NNFA Marketplace - US
[ ] PMA (Product Marketing Association) - US
[ ] Natural Products (ExpoEast)/ All Things Organic - US
[ ] Natural Products (ExpoWest) - US
[ ] ANTAD - Mexico
[ ] Alimentaria Mexico - Mexico
[ ] Abastur - Mexico
[ ] EXPHOTEL - Mexico
[ ] Food Ingredients (FI S. America) - Brazil
[ ] SIAL Mercosur - Argentina
[ ] FOODEX - Japan
[ ] IFIA International Food Ingredients & Additives Exhibition - Japan
[ ] BioFach - Japan
[ ] Supermarket Trade Show - Japan
[ ] AAHAR - India
[ ] International Food & Drink Expo - India
[ ] Food & Hotel Asia - Singapore
[ ] SIAL China - China
[ ] Food & Hotel China - China
[ ] Food Ingredients China - China
[ ] Seoul Food & Hotel Korea - S. Korea
[ ] Food Taipei - Taiwan
[ ] WOFEX World Food Expo - Philippines
[ ] Asia Fruit Logistica - Hong Kong
[ ] Hong Kong International Wine Fair - Hong Kong
[ ] HOFEX - Hong Kong
[ ] FI Food Ingredients Asia - Indonesia
[ ] Food & Hotel Indonesia - Indonesia
[ ] VIV Asia - Thailand
[ ] FI Asia Food Ingredients Asia - Thailand
[ ] Food & Hotel Vietnam - Vietnam
[ ] Fine Food Australia - Australia
[ ] ANUGA - Germany
[ ] BioFach - Germany
[ ] Fruit Logistica - Germany
[ ] Alimentaria Barcelona - Spain
[ ] HI Health Ingredients Europe - Spain
[ ] European Seafood Exposition - Belgium
[ ] World Food Moscow - Russia
[ ] Natural and Organic Products - UK
[ ] IFE International Food & Drink Exhibition London - UK
[ ] SANA - Italy
[ ] SIAL - France
[ ] Sirha - France
[ ] Food Ingredients Europe - France
[ ] Gulfood - UAE
[ ] Food Ingredients Africa - S. Africa
[ ] Morocco (American Cafe) - Morocco
[ ] Other (please specify):
150) How many export assistance programs have you participated in over the last 3 years? Export assistance programs include foreign buyers missions, trade missions, the Export Directory Online,
exporter seminars, or any export related activities hosted by OTA or the USDA
( ) 1
( ) 2
( ) 3
( ) 4
( ) 5
( ) 6
( ) 7 or more
( ) None, though I am aware of these programs
( ) None, I am unaware of these programs
Industry Open-ended
151) Do you have any other comments about the state of the Organic Industry in
general?
152) Do you have any other comments regarding public or consumer education
and awareness?
Thank You!
Thank you for taking the time to participate in our survey.
If you completed the survey in full and provided your e-mail address, we will be
sending you a copy of the Executive Summary of our findings by June 1, 2013.