Europe has enjoyed many decades of growth in wealth and well-being based on intensive use of material and energetic resources. To promote efficient use of these resources needs a policy frame-work that rewards innovation and resource efficiency, creates economic opportunities and improved security of supply through product redesign, sustainable management of environmental resources, resource savings and increased reuse, recycling and replacement of primary materials. To decouple growth from resources’ use and unlock these new sources needs coherence and integration in the policies that shape our economy and our life-styles (Bain et al., 2012; European Commission, 2011). In par-ticular, the secondary resources obtained from a municipal waste management system should be increased in amount and quality by designing a proper waste management strategy. This planning is a complex process involving many disciplines, processes and technologies that compose the infrastructural network of the waste management system and allows to design different sce-narios whose sustainability can be evaluated only by carrying out the waste management system itself, within existing legal, social and environmental guidelines that protect the public health and
the environment (Moy et al., 2008) and are, at same time, aes-thetically and economically acceptable (Nemerow et al., 2009). Generally, to fulfil the objectives of sustainable waste manage-ment, the general following objectives must be reached: minimi-sation of consumption of raw materials and energy without yielding a real overall environmental advantage; recovery of materials, albeit in respect of the principles laid down previously; recovery of energy since, in a life-cycle approach, energy recov-ery from waste allows decreasing consumption of fossil fuels and overall emissions from all energy conversion systems (Azapagic
Evaluation of municipal solid waste management performance by material flow analysis: Theoretical approach and case study
Lucio Zaccariello1,2, Raffaele Cremiato1 and Maria Laura Mastellone1,2
AbstractThe main role of a waste management plan is to define which is the combination of waste management strategies and method needed to collect and manage the waste in such a way to ensure a given set of targets is reached. Objectives have to be sustainable and realistic, consistent with the environmental policies and regulations and monitored to verify the progressive achievement of the given targets. To get the aim, the setting up and quantification of indicators can allow the measurement of efficiency of a waste management system. The quantification of efficiency indicators requires the developing of a material flow analysis over the system boundary, from waste collection to secondary materials selling, processing and disposal. The material flow analysis has been carried out with reference to a case study for which a reliable, time- and site-specific database was available. The material flow analysis allowed the evaluation of the amount of materials sent to recycling, to landfilling and to waste-to-energy, by highlighting that the sorting of residual waste can further increase the secondary materials amount. The utilisation of energy recovery to treat the low-grade waste allows the maximisation of waste diversion from landfill with a low production of hazardous ash. A preliminary economic balance has been carried out to define the gate fee of the waste management system that was in the range of 84–145 € t-1 without including the separate collection cost. The cost of door-by-door separate collection, designed to ensure the collection of five separate streams, resulted in 250 € t-1 ±30%.
KeywordsWaste management, assessment, indicators, material flow analysis, separate collection, recycling, recovery
1 Department of Environmental, Biological and Pharmaceutical Science and Technology, Second University of Naples, Caserta, Italy
2Athena srl – Academic spin-off, Caserta, Italy
Corresponding author:ML Mastellone, Department of Environmental, Biological and Pharmaceutical Science and Technology, Second University of Naples, Via A. Vivaldi 43, Caserta 81100, Italy. Email: [email protected]
595284WMR0010.1177/0734242X15595284Waste Management & ResearchZaccariello et al.research-article2015
Original Article
at UNIV OF PITTSBURGH on August 11, 2015wmr.sagepub.comDownloaded from
et al., 2004; Brunner, 2011) and minimisation of landfill use (European Commission, 2011).
The evaluation of a waste management system sustainability of methodological tools needs to measure the distance to targets of a selected series of performance indicators (Arendse and Godfrey, 2010; Ristic, 2005; Teixeira et al., 2014). Material flow analysis, life-cycle assessment and risk analysis are different tools that can be used to measure the performance of a waste management system by evaluating a set of indicators as a final result of an accurate modelling (Beigl et al., 2008; Cleary, 2009; Gunamantha and Sarto, 2012; Mastellone et al., 2009; Pires et al., 2011). First question is defining the aspects to be measured and the proper indicators. Regarding the municipal solid waste management, a crucial questions is ‘does a high percentage of municipal solid waste fractions, collected for potential recycling, translate into maximum sustainable resource efficiency?’ (Velis and Brunner, 2013), by pointing out the necessity of a metric to measure the sustainability of the system.
Scope of this article is: to apply the material flow analysis to a waste management system by using a case-study data inventory; to evaluate the efficiency of the base case scenario by means of a set of indicators set up to this end; to propose an alternative scenario ensuring the maximisation of both diversion of waste from landfill and materials recovery. A set of alternative scenarios have been also included in the analysis, by considering the best available technologies in the waste treatment sector and by referring to the industrial data provided by the scientific literature, on-site visits to industrial facilities and private communications.
The performance assessment does not include environmental considerations and exclusively refers to the material balances carried out over the system boundaries of the waste management system. The environmental impacts owing to a waste manage-ment can be evaluated by means of a life-cycle assessment, with reference to the global burdens, and by a risk assessment, with reference to local effects on public health. The future implemen-tation of the research will apply these methods by starting from the inventory presented in this article.
A preliminary economic assessment has been also carried out with reference to the base-case scenario, by collecting data related to: operating costs of the facilities included in the system boundaries; commercial values of the material streams; commer-cial value of energy vector (biogas and syngas).
General framework, methods and toolsGeneral waste management system description
The municipal solid waste can be addressed to different pro-cesses, mainly aiming to recycling of secondary materials, recov-ery of energy, waste-derived fuels production and, only for a residual fraction, to landfilling. The sustainability and the effi-ciency of the recycling chain are both affected by the waste com-position and by the successive separation and cleaning treatments
that allow each material to be reprocessed. The efficiency of waste producers to recognise and separate the different waste streams affects efficiency and cost of the whole waste manage-ment system; this efficiency has been evaluated in the present study by means of proper indicators. The efficiency of waste col-lection can be considered unitary, except anomalies not included in this analysis.
Waste delivering and collection systems can be classified on the basis of the waste separation degree and on the collection point decentralisation respect to the generation points (houses, shops, markets, etc.). Two opposite extremes can be considered for waste delivering systems: (a) commingled waste collection followed by an intense mechanical separation at centralised facil-ities; (b) intense homemade waste separation followed by a mild mechanical separation process. Two opposite extremes, having different costs and efficiencies, can be also considered for collec-tion systems: (a) door-by-door collection; (b) kerbside collection. Several intermediate possibilities are developed in different countries by taking into account local policies, social sensitivity, educational degree, urbanisation characteristics, industrial infra-structures, etc.
The system to which this research refers as a base case is char-acterised by an intense separation made at a household level and by a door-by-door collection system. A sketch of the routes of the waste categories intercepted by the collection system is given in Figure 1.
Methods and tools
Several methodological tools can be used alone, or in conjunc-tion each to other, in order to design and evaluate the waste man-agement scenarios (Beigl et al., 2008; Li et al., 2008; Oliveira et al., 2007; Salhofer et al., 2007; Wang et al., 1996), but the cru-cial point is always the reliability, the representativeness and the accuracy of input data and parameters utilised to perform the analyses. Data quality has a great influence on the integrity of the models’ results and, in particular, data sources are crucial to per-form the scenario analysis, planning and improving (Beigl et al., 2008). Moreover, the experimental data has to be general enough to be used to draw considerations that are widely applicable to other cases. In this article, the experimental data has been used to evaluate the performance of the waste management actually in operation in the reference system and to obtain provisional mod-els. The previsional models have been built to evaluate the effect of the changes of some parameters on the performance indica-tors. The tool used to compare the results is the indexing carried out by using the indicators reported in Table 1. The evaluation method is the comparison of different scenarios, each of which have been quantified by using the material flow analysis.
Definition of indicators and indicators
The use of indicators to assess the performance of open or closed systems is reported in the literature with reference to waste man-agement (Arendse and Godfrey, 2010; Li et al., 2008; Moy et al.,
at UNIV OF PITTSBURGH on August 11, 2015wmr.sagepub.comDownloaded from
2008; Ristic, 2005). The choice of the set of indicators is driven by the availability of data and by the capacity to measure the performance. A way to evaluate the waste management system’s global efficiency is to measure the waste diversion, i.e. the pre-vention and reduction of generated waste through source reduc-tion, recycling, reuse, energy recovery, composting, feedstock
and biogas production (European Environmental Agency, 2009).
Waste diversion generates a host of environmental, financial and
social benefits, including conserving energy, reducing disposal
costs and reducing the burden on landfills and other waste dis-
posal methods (Environmental Protection Agency, 2012). The waste diversion indicator is a measure of the amount of mass of each waste component diverted from the landfill and addressed to recovery or recycling. To increase the waste diversion is gener-ally adopted as a household separate collection, because it is
considered the best option to minimise the sorting cost of the waste downstream of the collection. The separate collection effi-ciency must be evaluated on the basis of the amount of contami-nating materials included in the waste stream. This is the rationale behind the designing of the following indicators whose detailed description is reported in the following paragraphs.
Separate delivery rate indicator. The widespread indicator utilised to assess the efficiency of a management system of waste is the separate delivery rate (SDR), defined as the ratio between the amount of waste collected as separated streams and the total produced waste. This indicator just takes into account the collected waste streams, without considering how much is actually addressed to recycling/recovery, and which are the environmental and economic costs correlated to the fol-lowing treatments.
Figure 1. Classification of waste categories delivered and collected to be addressed to the successive treatment processes.
Table 1. Set of partial and aggregated indicators.
i: waste category (i.e. biowaste, paper, etc.); mi: real amount of a given waste fraction (i) collected; m’i: nominal amount of a given waste frac-tion (i); ri: amount of a given waste fraction (i) sent to recycle; rei: amount of a given waste fraction (i) sent to recovery; gi: amount of a given waste fraction (i) generated; di: amount of a given waste fraction (i) disposed in the landfill; assuming that: ∑
i m
i=∑
i m’
i=∑
i g
i
at UNIV OF PITTSBURGH on August 11, 2015wmr.sagepub.comDownloaded from
Nominal interception efficiency. The nominal interception effi-ciency (nie) is defined as the ratio between the amount of the waste category (i) that is collected as a separated stream (m’i), including an undesired amount of contaminating materials and the total amount of the generated waste (gi). It measures the capa-bility to recognise and intercept specific categories of waste by diverting it from the commingled waste, i.e. the residual waste/restwaste. In the case of analysing data of an existing waste man-agement plan, the nie can be calculated; in the case of a new waste management system planning the set of nie indicators, each of them related to a given waste fraction i, has to be fixed (Mastellone, 2015). The aggregate indicator NIE, which repre-sents the sum of the m’i for the separate collection streams divided by the totality of the waste (municipal solid waste), coin-cides with SDR (Table 1). This indicator has been defined ‘nomi-nal’, because the collected amount of waste includes the so-called ‘contaminating materials’ that usually ranges between 10% and 35%. To perform a material flow analysis, the nie represents the composition of the municipal solid waste collection.
Actual interception efficiency. The actual interception effi-ciency (aie) is defined as the ratio between the amount of the material category present in the intercepted waste (mi) and the produced one (gi); aie is the indicator assessing the efficiency of the separate delivery/collection system. Its estimation, starting from nie indicators, is possible by knowing the detailed composi-tion of each stream i and, in particular, the amount of contaminat-ing materials fraction to be removed during the sorting process. In the material flow analysis, the aie/nie allows the separation of input flowrate (e.g. biowaste) into its components (e.g. biode-gradable and inorganic contaminants).
Recycled-collected ratio. The recycled-collected ratio (rcr) is defined as the ratio between the amounts of waste i actually addressed to be reprocessed as secondary materials (ri) and the collected i stream (m’i). It can be calculated with respect to a specific waste fraction i, thus obtaining the indicator relative to the given waste fraction i, or with respect to the overall recycled waste fractions, thus obtaining the overall indicator RCR. The RCR gives information about the efficiency of the sorting, selec-tion and reprocessing steps to obtain the secondary materials.
Recovered-collected ratio. The recovered-collected ratio (recr) is defined as the ratio between the amounts of waste (rei) addressed to different recovery options (biogas and compost production, energy recovery, etc.) and the collected one (mi). The RECR indi-cator gives information about the amount of waste that is con-verted into biogas, compost, synthetic natural gas, energy, etc.
Disposal-collected ratio and diversion-collected ratio. The disposal-collected ratio (dcr/DCR) and diversion-collected ratio (dvr/DVR) are correlated to each other. The indicator ‘DCR’ is the ratio between the amount of waste actually addressed to land-fill and the generated waste, while the ‘DVR’ measures the rela-tive amount of waste diverted by landfill compared with the generated one. The DCR indicator refers to the waste that cannot be re-used, recycled or recovered but, in a sustainable waste man-agement system, is inert (e.g. stones, glass) or inertised (e.g. encapsulated fly ash, stabilised organic matter (SOM) from
anaerobic digestion and composting, slag from plasma gasifica-tion, etc.). The sum of RCR, RECR and DCR indicators should, in theory, be unitary, but it is actually less than 1 owing to meta-bolic losses during bio-drying and aerobic processes.
Experimental: Data sources and data evaluation
Processing the set of indicators reported in Table 1 needs the availability of a wide range of reliable data on a disaggregated level (Beigl et al., 2008), accounting for spatial and temporal variability (Clavreul et al., 2012) related to:
(a) generated waste amount for each category i;(b) separately collected waste amounts;(c) efficiencies of the treatment processes;(d) commodity analyses of each type of waste entering the
processing facilities;(e) secondary materials amounts obtained by the collected
waste.
Data used in this article came from the Caserta Provincial Observatory for Waste the National Consortium for Packaging (CONAI) and, by means of on-site compilation of specific data-bases, from the facilities that treat the separate and residual waste of Caserta municipalities. In particular, this research work pro-cessed and evaluated the following data, available on different aggregation levels.
•• Daily data at a municipal level related to all the collection streams, available at the Provincial Waste Observatory, as aggregated in the Waste Report (Romeo, 2013).
•• Annual data related to the waste streams processed by the recycling plants and introduced in the market as secondary materials.
•• Commodity-related analysis of residual waste, as obtained by the sorting processes at the mechanical-biological treatment (MBT) plant.
•• Commodity-related analysis of mixed recyclable waste com-ing from separate collection as obtained by the material recovery facilities (MRFs).
Commodity analyses of municipal solid waste and residual waste
The main data source to obtain the single mass rate (expressed in Mg day-1) of the collected streams for each municipality is the official database managed by the Provincial Waste Observatory. Each municipality daily updates their own data related to the col-lected amount of given waste streams by means of a web-friendly interactive interface. A careful comparison between data pro-vided by municipalities after collection and those provided by the treatment plants receiving the waste increases the level of accu-racy. Table 2 reports an extract of the available data that has been processed in order to obtain the total amount of each waste cate-gory for a set of municipalities. Table 2 also reports on the
at UNIV OF PITTSBURGH on August 11, 2015wmr.sagepub.comDownloaded from
number of inhabitants for each municipality and the population density values in order to provide some territorial information. The collection system, for all municipalities, consists in a door-by-door collection for which the biowaste is delivered and col-lected three times a week, glass, paper and mixed recyclable waste once a week and the residual waste once a week. The treat-ment plants are: composting plants for biowaste aerobic diges-tion (private ownership), MRFs for plastics, metals, aluminium and cellulosic sorting and cleaning (private ownership), a mechanical-biological plant (public ownership), a landfill (public ownership) and an incinerator (public/private ownership).
The elaboration of the mass flow data allows calculation of the pro-capita waste production that was equal to 1.29 kg inh-1 day-1, consistent with data of high-income country regions, not including very large cities (Hoornweg and Bhada-Tata, 2012). The elaboration of mass flowrate data also provides the composi-tion of the collected waste. By using the composition of the solid waste generated ab origine as an input data, the restwaste compo-sition has been estimated. Each waste fraction in the restwaste can be obtained by the following relationship, which represents the mass balance for the waste category i:
i i P i P P
i 1 SDR i S
restwaste MSW MSW SC SC RES
MSW SC
= −( )= −( ) −
. .
.
/
/ DDR 1 SDR/ −( ) (1)
where i indicates the waste category, that is: biowaste, metals, plas-tics, etc.; SDR is the diversion rate indicator; P represents the mass rate (generally expressed in Mg y-1) for municipal solid waste
(MSW), residual waste (RES), and separate collected waste (SC). The resulting composition of the restwaste, together with that taken as reference for municipal solid waste, is reported in Table 3. This table also reports the value of nie indicators for the residual and separate waste. It should be noted that a certain number of commodity analyses were available for the residual waste at the entrance of the MBT facility. They were obtained by sampling 1.5 t of the residual waste and by following the ANPA RTI CTN_RIF 1/2000 guidelines. The analysis separates the waste into the fol-lowing fractions: fine fraction <50 mm, biowaste, paper, card-board, composites, textiles, sanitary textiles, plastic sheets, plastic packaging, plastics (miscellaneous), rubber, glass, metals (fer-rous), metals (non-ferrous), wood, inert, leather, hazardous, elec-tronical and electronic equipment waste, others (unclassified). The resulting mean composition of the residual waste is in line with that obtained by calculation and reported in Table 3.
Commodity analysis of the mixed recyclable waste
The composition of the mixed recyclable waste, coming from the separate delivery and collection system, has been obtained by means of analyses made at the MRF entrance. In this facility, the recyclable waste is separated by the contaminating materials, the polymers are selected on the basis of type and colour and bailed to send them to the mechanical reprocessing. Several samples of the input waste have been analysed in order to detect and quan-tify the contaminating materials, i.e. materials that cannot be recycled (e.g. thermosets, composites) or that should not be
Table 2. Data of waste categories amounts for each municipality in an ambit – units are in Mg y-1. Blank cells corresponds to 0 Mg y-1.
present (e.g. biowaste). The commodity analysis of the mixed waste entering the MRF is presented in Table 3. The sampling programme is structured in the following way: (a) each day a certain amount of waste is taken from different trucks just after the weighing; (b) when a given amount, not less than 100 kg, is available, the sampling and analysis begins; (c) the analysts carry out the sampling by following a specific guideline to determine the liquid containers (3D), sheets larger and smaller than A3 size (2D), biowaste, metals, contaminating material. The number of samples utilised in this study related to the commodity analysis of mixed recyclable waste is not less than 176. The sampling pro-gramme is an obligation for all the MRFs and it is issued by the National Consortium for Plastics Packaging in the framework of a convention between the Italian municipalities and the National Consortium for Packaging recycling (CONAI, 2015).
Results and discussionDescription of the base case and alternative scenarios
The quantified block diagram of the case study is reported in Figure 2. The flows and stocks are defined and quantified by means of mass balances carried out by using the STAN freeware for material flow analysis (Cencic and Rechberger, 2008). Each block represents a process or a sub-system included in the system boundaries, while each arrow is related to mass flowrate of a
waste/material. The base case includes: a door-by-door separate collection; a composting plant to treat the biowaste by producing a compost fraction (after refining) and a stabilised matter con-taining the contaminating materials collected with the biowaste and the partially stabilised biowaste; a MRF where the recyclable waste is sorted, cleaned and addressed to reprocessing by also producing other waste outputs mainly constituted by plastic materials; a MBT facility that divides the residual waste into two main streams – the combustible waste addressed to incineration and the biowaste that was not intercepted by the separate collec-tion (about 17%) contaminated by fine fractions as glass, stones, ceramics, metals, etc. having a size <50 mm. This latter is aerobi-cally stabilised before landfilling.
The alternative scenarios have been designed by substituting the MBT facility with a MRF able to separate recyclable materi-als from the restwaste and to transform the non-recyclable frac-tion into a high-quality, waste-derived fuel. The composting plant has been substituted by an anaerobic–aerobic integrated facility in order to produce biogas and reduce the fugitive (i.e. not intercepted) volatile organic compounds emissions.
The unit processes included in the scenarios are described in the following.
MBT. A plant that treats the residual waste by removing the bio-waste (putrescible organic matter) and heavy and small particles (glass, stones, etc.) in order to produce a proper fuel for the waste-to-energy plant (Archer et al., 2005). The biowaste, mixed
Table 3. Commodity composition of municipal solid waste, separate collected waste and restwaste, as obtained by experimental data (base case).
with a high inert fraction, undergoes aerobic stabilisation to be transformed in a stabilised organic matter (SOM). Refuse-derived fuel (UNI, 2011) is obtained by solid waste by recurring to this kind of facility (MBT).
MRF. A facility that selects ferrous metals, glass, aluminium and plastics from the mixed recyclable waste (Craig et al., 2003; PeerConsultants and CalRecovery, 1991). The material is disen-tangled by breaking up any bags and separating the compacted material. The feed passes through a rotating trommel screen that splits the material into three streams:
•• <50 mm fraction collected as a waste stream for disposal;•• 50–200 mm fraction, which is fed onto a ballistic separator;•• oversize fraction (>200 mm) for manual hand sorting.
Any plastic or metal from the oversize hand sort is added back into the feed at this point. The ballistic separator divides flat and light materials (i.e. paper, card, plastic film, etc.) from heavier rolling materials (i.e. metals, plastic bottles, etc.). Any fines that remain in the feed are also removed at this stage. The following secondary materials can be obtained: light, light-blue and col-oured polyethylene-terephthalate (PET), polyethylene (PE), met-als (ferrous), aluminium, glass.
Platforms, PL. Transfer stations, often included in the same MRF site, where the mono-material streams of paper, glass, met-als, etc., coming from commercial sector or by collection centres, are stored before sending it to a recycling plants.
Waste-to-energy plant – combustion based. A facility where the waste, or the waste-derived fuel, is converted into energy by means of oxidation carried out with an excess of air. The waste combustion uses excess air ranging between 80–120% (up to 200% for hazardous waste), depending on waste characteristics and furnace technology (Niessen, 2002). The waste-to-energy plant in the case study is a typical combustion facility equipped with a cooled moving grate furnace. The air-to-fuel ratio is equal to 12t/t to ensure 11%v of free oxygen in the flue gas, the bottom ash is non-hazardous waste addressed to recovery processes, the fly ash can be addressed to special landfill for hazardous waste or inertised by vitrification or solidification.
Waste-to-energy plant – plasma gasification based. A facility where the waste/waste-derived fuel is converted into a synthetic gaseous fuel composed of carbon monoxide, hydrogen, carbon dioxide, light hydrocarbons (including methane, hydrogen sul-fide, ammonia, etc.) by means of a thermochemical process under sub-stoichiometric conditions. This process transforms the fuel into gaseous fuels (syngas), synthetic natural gas, hydrogen and liquid fuels (Byun et al., 2012; E4tech, 2009; Higman and Burgt, 2003; Mastellone, 2015). The waste-to-energy plant in the alter-native scenarios is an oxygen plasma gasifier that works with an oxygen-to-fuel ratio equal to 0.21, produces inert slag and a low amount of fly ash (Alter NRG, 2014).
Anaerobic digestion plant, AD. A biotechnological facility where the biodegradable fraction of biowaste is stabilised thanks
to a complex microbiological activity. During the anaerobic pro-cess, a part of biowaste (generally 12–18%w) is transformed into a mixture composed mainly by methane and carbon dioxide (bio-gas), and in a stabilised inert solid substrate (raw compost) by means of an anaerobic–aerobic in series process. Generally, com-post, useful for agricultural purposes, can be obtained, starting with clean biowaste (from separate collection), while the SOM should be exclusively used as covering material in the landfill.
Evaluation of base case scenario indicators
The values of nie, referred to the base case, have been reported in the Table 3 and are used to quantify the first block (separate col-lection) of the material flow analysis reported in Figure 2 (by using STAN the nie corresponds to the transfer coefficients). The values of aie has been obtained by knowing the amount of con-taminating material fraction in the MRF for the base case, and by using relationships similar to equation (2), written with reference to metals. The values of contaminating material (CM) have been obtained by on-site investigations and analyses at the MRF:
aie nieCM metals SDR
metals
metals sep col
MSW
= −⋅ ⋅( )
−% /
% (2)
The values of all indicators are obtained by using the results of the material flow analysis, based on the values of nie and aie. To clarify the calculation procedure, Table 4 reports the calculations details.
The values of indicators can be calculated with reference to the single process of the waste management system and with ref-erence to the whole system. In Table 5, the indicators related to the mass flows intercepted by means of separate collection are reported together with those obtained by considering the whole system. In the calculation of global indicators the following assumptions have been made.
RCR: paper, glass, polymers, metals, 30% of bottom ashes and 30% of ‘others’ are included.RCER: compost, biogas, sum of waste to incineration (by sub-tracting fly ashes and bottom ashes), 30% of bottom ashes and 30% of ‘others’ are included for base case scenarios; compost, biogas, syngas (by subtracting oxygen), are included for alterna-tive scenarios.DCR: the 40% of bottom ash, the fly ash, the 40% of ‘others’ and all the waste accumulated in the process ‘landfill’ are considered.
Indicators obtained for the base case (SDR = 46%) shows that household separation allows a high interception of biowaste (74%), while that of metals and plastics (20%) is more difficult, so that a large amount of these materials remains in the residual waste. A large amount of plastics is then addressed to energy recovery so that the recycling indicator for this material is only 9.3%. The 73% of the plastics separated and collected as a sepa-rate stream is transformed into secondary polymers (PET, PE)
at UNIV OF PITTSBURGH on August 11, 2015wmr.sagepub.comDownloaded from
owing to the contaminating materials and unrecyclable polymers presence. The global RCR indicator referred to the municipal solid waste is only 10%: this indicates that, even though the sepa-rate delivering is high (46%), the material recycling is low. The largest part of metals is not intercepted by means of the separate collection of mixed recyclable waste: an rcr of 11% demonstrates that the 89% of metals is in other streams.
The recovery indicator (RECR) is high thanks to the transforma-tion of the refuse-derived fuel (RDF) into energy (68% of municipal solid waste is addressed to energy recovery), while the contribution of compost from biowaste is <6%. The waste diversion reached an acceptable level (48%), but it can be improved by increasing the recycling rate (i.e. reducing ‘residual waste’ and ‘others’ streams).
Material flow analysis and evaluation of alternative scenario indicatorsThe alternative scenarios aim to maximise the performance indi-cators related to the recycling of materials (RCR) and energy (RECR), and to minimise landfilling, i.e. DCR. Two sets of sce-narios have been designed: in the first one (A2) the configuration of the waste management system is the same as the base case without any change regarding the technological aspects, but the nie values have been increased until they reach the maximum achievable value of SDR (60%). In the second set of scenarios (B1 and B2), a different choice has been made regarding the treatment processes.
1. The composting process of biowaste has been integrated with an anaerobic digestion section in order to produce biogas in addition to compost. The biogas is produced with a yield of 17% by weight by referring to the biowaste and it is com-
posed by 65% methane. With reference to the SDR of 46%,
the aie/nie value for biowaste indicates that 33% of the input
is not really biowaste, so that the biogas is calculated on the
real amount of organic matter present in the stream. The ratio aie/nie at SDR = 60% is higher (0.74).
2. The MBT has been upgraded to a MRF in order to maximise the material recycling instead of energy recovery. A pro-cessing unit has been added in order to produce a high-qual-ity solid secondary fuel instead of a RDF. This unit reduces the amount of metals, glass, ceramics, etc., in the fuel, reduces and homogenises the mean size and densifies the waste.
3. A plasma gasification process has been considered instead of the incineration process to convert the solid secondary fuel into a syngas instead of energy by means of a plant much smaller than an incinerator. The high-quality secondary fuel contains a low amount of metals and inorganics thanks to the intense pre-processing (later shown in detail) and it produces slag instead of bottom ash with a consequent decreasing of economic costs and environmental concerns. The production of inert slag is a better choice to obtain recoverable materials that can be used, for instance, for road construction. The
Table 4. Example of the calculation procedure to evaluate the indicator values starting from material flow analysis data.
Table 5. Values of indicators for the base case scenario at SDR equal to 46%.
Waste category Indicators for base case scenario – SDR = 46%
With reference to the separate collection system nie aie rcr recr dcr
Metals in mixed recyclable waste 20% 15% 11% 0% 89%Plastics in mixed recyclable waste 20% 15% 9% 73% 18%Biowaste in separate collection 74% 50% 0% 15% 39%Paper and cardboard in separate collection 22% 12% 10% 72% 18%Glass in separate collection 55% 31% 15% 0% 85%With reference to the waste management system NIE AIE RCR RECR DCRMSW 46% 30% 10% 38% 41%
aie: actual interception efficiency; drc: diversion-collected ratio; MSW: municipal solid waste; nie: nominal interception efficiency; recr: recovered-collected ratio; rcr: recycled-collected ratio; SDR: separate delivery rate.
at UNIV OF PITTSBURGH on August 11, 2015wmr.sagepub.comDownloaded from
gasifier is fed by oxygen (98% purity) and produces a syngas, having a low heating value (dry basis) of 8.7 MJ kg-1.
The nie as a function of SDR
In order to reach a given value of the SDR indicator, it is neces-sary to properly choose a set of nie values. It is then necessary to know the relationship between the nie values and SDR that has been obtained by using data related to 5 years (from 2008 to 2012) by correlating the amount of each category i to the resulting SDR of the period. Figure 3 shows the experimental values of nie–SDR data, together with its interpolation curve. It must be noteworthy that the functions are not valid in the entire range 0–100%, because the household interception capacity cannot be indiscrimi-nately increased. It is also interesting that the increasing rate of biowaste interception is well interpolated by a log function, while the increasing of the other categories follows a power law as expected because the biowaste recognition and interception is easier. An important consequence of this behaviour is that is not possible to overcome the value of 60% for the SDR by fixing the nie for the categories glass, metals, plastics, paper and biowaste at their maximum value, without the interception of other categories of waste as WEEE, textiles, tyres, bulky, etc. This modelling result is in accordance with several empirical data that demon-strate that 60–65% is the maximum SDR achievable by means of the best performance of the delivering stage (Consonni et al., 2011). With regard to the contaminating materials present in the mixed recyclable waste entering the MRF processing, a mathe-matical correlation has been obtained by fitting the empirical val-ues of contaminating materials at different values of SDR obtained by the on-site investigations. The correlation is:
CM 5 9SDR= 0 0. . (3)
The values of contaminating materials in the other streams, i.e. biowaste, paper, glass and other, have been maintained at fixed values, experimentally obtained with reference to the base case (SDR = 46%), since their variation with SDR is limited and not enough data are available to fit.
The indicators related to the alternative scenarios have been designed and modelled under the following hypotheses.
– The rules for separating household waste are unvaried (glass, mixed recyclable waste, biowaste, restwaste).
– The municipal solid waste composition is that given in Table 3.
– The nominal interception efficiencies for each waste category can be evaluated by the relationships of Figure 3.
Figure 4 reports the material flow analysis related to the alter-native scenario B2, for which the nominal interception efficien-cies of the separately collected waste streams are the same of base case-A2, but with a different technological infrastructure (MRF instead of MBT) to manage the waste. The MRF flow
diagram is reported in Figure 5. The material processing and recovery facility increases the amount of secondary materials addressed to recycling and the production of a high-quality sec-ondary fuel converted into syngas.
The main results in terms of performance indicators for all scenarios are reported in Table 6. The SOM obtained by the bio-waste treatment is addressed to landfill as covering material for scenarios A1 and A2; on the contrary, in the alternative scenarios B1 and B2, it is used as a low-calorific value fuel. The material recovery is increased thanks to the sorting and selection pro-cesses occurring in the MRF (restwaste).
The good results in term of RCR indicators obtained by mov-ing from A to B scenarios, indicate that an intense separate sort-ing by householders is not useful. In fact, the RCR values at SDR equal to 46% and 60% are quite similar (10% vs 13% and 15% vs 17%, for A and B scenarios, respectively).
Preliminary economic considerations
The quantification of the performance indicators reported in the preceding paragraphs allows us to make considerations about the effects of technological choices on the output material flows. These choices have effects also on the environmental features and on the economy of the waste management chain. The environ-mental effects will be analysed by using life-cycle assessment and risk assessment methods in the future development of the research. The economic performance has been evaluated and reported here by considering the same system boundary of the material flow assessment and by making the following considerations.
(a) The processing costs do not contain financial items (interests on the debt) and administrative costs. They include workers costs, fixed capital amortisation in 10 years, energy and mate-rials consumption, etc.
(b) The revenues from the selling of secondary materials, energy vectors (biogas and syngas), electric and thermal energy are considered separately by the processing costs of the facility.
Figure 3. Experimental (blanked) and calculated (shaded) values of nie at different values of SDR.nie: nominal interception efficiency; SDR: separate delivery rate.
at UNIV OF PITTSBURGH on August 11, 2015wmr.sagepub.comDownloaded from
(c) The gate fee is the net value resulting by the economic bal-ance carried out around the whole waste management scenario.
(d) The processing cost for the separate collection system is mainly composed by the following items: workers’ salaries, capital, amortisation and maintenance costs for trucks, trans-portation fuel cost (that depends on urban highway configu-ration and by localisation of facilities), insurances, etc. The cost of this step has been considered not variable with SDR for values larger than 50%, because the kerbside collection method is not able to reach these values and the chosen method is necessarily the door-by-door collection. Its cost does not vary with the variation of the collected waste com-position if the total production is constant, because the num-ber of workers and the transport fleet remains the same. The unitary cost of separate collection is in the range 180–330 € t-1 for the set of municipalities considered.
(e) The processing costs of anaerobic digestion and composting plant are quite similar, because the composting plant requires more electric energy for air introduction, but the digestion plant requires more maintenance. Their processing cost has been fixed to 80 € t-1.
(f) The processing cost of the waste-to-energy combustion facility related to the base case is comparable with that of other incinera-tors in Europe, but the revenue by the electric energy transferred to the grid is much higher owing to high economic incentives. While in Europe the gate fee of incineration is in the range 100–150 € t-1, the reference facility has a gate fee of 70 € t-1 thanks to the incentives. The calculation of the base-case scenario consid-ers of the net cost of 70 € t-1 that includes the revenues (i.e. it represents the gate fee and not the processing costs).
(g) In the alternative scenarios, two different calculations have been made: in one case the gate fee has been considered the same of the incinerator (including the revenue from energy); in a second case, more generally applicable, the processing costs of the high-temperature gasifier has been considered equal to 130 € t-1. In this latter case, the syngas has been con-sidered as having an economic value equivalent to its calo-rific value by referring to methane.
(h) The processing costs of MRF is 70 € t-1.
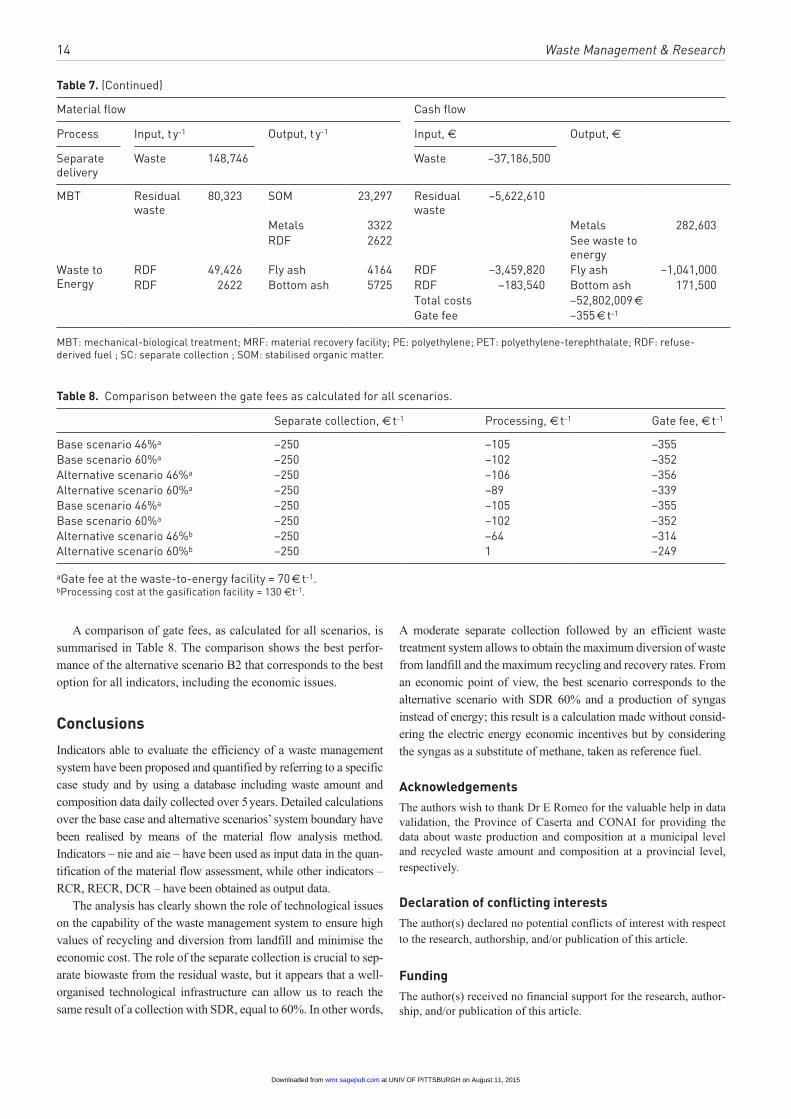
The economic balance is reported in Table 7 with reference to the base case.
The gate fee of the base-case scenario corresponds to 160 € for each inhabitant a year. This corresponds to a mean expenditure for a family of about 630 € y-1.
Table 6. Summary of indicators for the compared scenario.
1refers to SDR = 46%; 2 refers to SDR = 60%; A refers to the base case process configuration; B refers to the alternative process configuration.DCR: disposal-collected ratio; RCR: recycled-collected ratio; RECR: recovered-collected ratio.
Table 7. Gate fee calculation for the base case scenario.
Material flow Cash flow
Process Input, t y-1 Output, t y-1 Input, € Output, €
Separate delivery
Waste 148,746 Waste –37,186,500
Composting and refining
Biowaste 39,938 Solid residue 29,235 Biowaste –2,396,280 Solid residue 0 Compost 8040 Compost 241,200 SOM 21,195 SOM –847,800
Platform Paper 7006 Paper 3153 Paper –210,180 Paper 157,650Others 9371 Others 5154 Others –281,130 Others 0 Non-
A comparison of gate fees, as calculated for all scenarios, is summarised in Table 8. The comparison shows the best perfor-mance of the alternative scenario B2 that corresponds to the best option for all indicators, including the economic issues.
Conclusions
Indicators able to evaluate the efficiency of a waste management system have been proposed and quantified by referring to a specific case study and by using a database including waste amount and composition data daily collected over 5 years. Detailed calculations over the base case and alternative scenarios’ system boundary have been realised by means of the material flow analysis method. Indicators – nie and aie – have been used as input data in the quan-tification of the material flow assessment, while other indicators – RCR, RECR, DCR – have been obtained as output data.
The analysis has clearly shown the role of technological issues on the capability of the waste management system to ensure high values of recycling and diversion from landfill and minimise the economic cost. The role of the separate collection is crucial to sep-arate biowaste from the residual waste, but it appears that a well-organised technological infrastructure can allow us to reach the same result of a collection with SDR, equal to 60%. In other words,
A moderate separate collection followed by an efficient waste treatment system allows to obtain the maximum diversion of waste from landfill and the maximum recycling and recovery rates. From an economic point of view, the best scenario corresponds to the alternative scenario with SDR 60% and a production of syngas instead of energy; this result is a calculation made without consid-ering the electric energy economic incentives but by considering the syngas as a substitute of methane, taken as reference fuel.
AcknowledgementsThe authors wish to thank Dr E Romeo for the valuable help in data validation, the Province of Caserta and CONAI for providing the data about waste production and composition at a municipal level and recycled waste amount and composition at a provincial level, respectively.
Declaration of conflicting interests The author(s) declared no potential conflicts of interest with respect to the research, authorship, and/or publication of this article.
FundingThe author(s) received no financial support for the research, author-ship, and/or publication of this article.
Table 8. Comparison between the gate fees as calculated for all scenarios.
ReferencesAlter NRG (2014) Syngas composition as obtained by a Westinghouse facil-
ity for municipal solid waste. Private communication.Archer E, Baddeley A, Schwager J, et al. (2005) Mechanical-biological-
treatment: A guide for decision makers. Processes, Policies & Markets. Gloucestershire, UK: Juniper.
Arendse L and Godfrey L (2010) Waste management indicators for national state of environment reporting. Available at: http://www.unep.or.jp/ietc/kms/data/2010.pdf
Azapagic A, Perdan S and Clift R (2004) Sustainable Development in Practice: Case Studies for Engineers and Scientists. Chichester, UK: John Wiley & Sons.
Bain J, Tan A, Mudgal S, et al. (2012) Decoupling of waste and economic indicators. Available at: http://www.wrap.org.uk/sites/files/wrap/Decoupling%20of%20Waste%20and%20Economic%20Indicators.pdf
Beigl P, Labersorger S and Salhofer S (2008) Modelling municipal solid waste generation: A review. Waste Management 28: 200–214.
Brunner PH (2011) Urban mining: A contribution to reindustrializing the city. Journal of Industrial Ecology 15: 339–341.
Byun Y, Cho M, Hwang S-M, et al. (2012) Thermal plasma gasification of municipal solid waste. INTECH. Available at: http://cdn.intechopen.com/pdfs-wm/40402.pdf
Cencic O and Rechberger H (2008) Material flow analysis with Software STAN. Journal of Environmental Engineering and Management 18: 5.
Clavreul J, Guyonnet D and Christensen TH (2012) Quantifying uncertainty in LCA-modelling of waste management systems. Waste Management 32: 2482–2495.
Cleary J (2009) Life cycle assessments of municipal solid waste management systems: A comparative analysis of selected peer-reviewed literature. Environment International 35: 1256–1266.
CONAI (2015) Database of Regione Campania. Private communication.Consonni S, Giugliano M, Massarutto A, et al. (2011) Material and energy
recovery in integrated waste management system: Project overview and main results. Waste Management 31: 2057–2065.
Craig C, Prince T, Davenport L, et al. (2003) Material Recovery Facility Handbook. Lexington, TN: Recycling Marketing Cooperative for Tennessee.
E4tech (2009) Review of Technologies for Gasification of Biomass and Wastes. York, UK: NNFCC Biocenter.
Environmental Protection Agency (2012) Municipal Solid Waste Generation, Recycling and Disposal in the United States. Washington, DC: Environmental Protection Agency.
European Commission (2011) Road Map to Resource Efficient Europe. Brussels, Belgium: European Commission.
European Environment Agency (2009) Diverting Waste From Landfill - Effectiveness of Waste-Management Policies in the European Union. Copenhagen, Denmark: EEA.
Gunamantha M and Sarto (2012) Life Cycle Assessment of Municipal solid waste treatment to energy options: Case study of Kartamantul region, Yogyakarta. Renewable Energy 41: 277–284.
Higman C and Burgt Mvd (2003) Gasification. New York: Gulf Professional Publishing.
Hoornweg D and Bhada-Tata P (2012) What a waste - A global review of solid waste management. Urban Development Series Knowledge Papers. Washington, DC: The World Bank.
Li YP, Huang GH, Yang ZF, et al. (2008) An integrated two-stage optimiza-tion model for the development of long-term waste-management. Science of Total Environment 392: 175–186.
Mastellone ML (2015) Waste Management and Clean Energy Production from Municipal Solid Waste. New York: Nova Science Publishers.
Mastellone ML, Brunner PH and Arena U (2009) Scenarios of Waste Management for a Waste Emergency Area: a Substance Flow Analysis. Journal of Industrial Ecology 13: 735–757.
Moy P, Krishnan N, Ulloa P, et al. (2008) Options of municipal solid waste in New York City: A preliminary comparison of health risks and policy implications. Journal of Environmental Management 87: 73–79.
Nemerow N, Agardy FJ, Sullivan P, et al. (2009) Environmental Engineering: Environmental Health and Safety for Municipal Infrastructure, Land Use and Planning, and Industry. Hoboken, NJ: John Wiley & Sons.
Niessen WR (2002) Combustion and Incineration Processes: Applications in Environmental Engineering: Marcel Dekker, Inc. New York. USA.
Oliveira d, Simonetto E and Borenstein D (2007) A decision support system for the operational planning of solid waste collection. Waste Management 27: 1286–1297.
PeerConsultants and CalRecovery (1991) Material Recovery Facilities for Municipal Solid Waste, EPA 625/6-91/031, September 1991. Washington, DC: EPA.
Pires A, Martinho G and Chang N (2011) Solid waste management in European countries: A review of systems analysis techniques. Journal of Environmental Management 92: 1033–1050.
Ristic G (2005) Basic indicator of integrated solid waste management. Working and Living Environmental Protection 2: 383–392.
Romeo E (2013) L’evoluzione della produzione dei rifiuti Urbani in Provincia di Caserta nel quadriennio 2008-2011. Waste Report. Caserta Province.
Salhofer S, Wasserman G and Binner E (2007) SWIM - Strategic envi-ronmental assessment as an approach to assess management systems. Experience from an Austrian case study. Environmental Modelling Software 22: 310–618.
Teixeira CA, Avelino C, Ferreira F, et al. (2014) Statistical analysis in MSW collection performance assessment. Waste Management 34: 1584–1594.
UNI-EN 15359 (2011) Solid Recovered Fuels - Specifications and Classes.Velis C and Brunner PH (2013) Recycling and resource efficiency: It is time
to change from quantity to quality. Waste Management and Research 6: 539–540.
Wang FS, Richarson AJ and Roddick FA (1996) A computer model for solid waste integrate management. Computers, Environment and Urban Systems 20: 233–246.
at UNIV OF PITTSBURGH on August 11, 2015wmr.sagepub.comDownloaded from