Wood and Fiber Science, 35(2), 2003, pp. 308–320 q 2003 by the Society of Wood Science and Technology ORTHOTROPIC STRENGTH AND ELASTICITY OF HARDWOODS IN RELATION TO COMPOSITE MANUFACTURE PART III: ORTHOTROPIC ELASTICITY OF STRUCTURAL VENEERS Elemer M. Lang² Associate Professor Laszlo Bejo Graduate Research Assistant West Virginia University Division of Forestry Morgantown, WV 26506-6125 Ferenc Divos Associate Professor Institute of Wood Based Composites Zsolt Kovacs Professor, Director Institute of Product Development and Technology University of West Hungary H-9400 Sopron, Pf.:132 Hungary and R. Bruce Anderson Assistant Professor West Virginia University Division of Forestry Morgantown, WV 26506-6125 (Received November 2001) ABSTRACT Structural veneers approximately 3.2 mm (⅛ in.) in thickness are widely used as basic constituents in structural composites such as plywood, laminated veneer lumber (LVL), and parallel strand lumber (PSL). The veneer processing operation (peeling) may adversely alter the mechanical properties of the wood substance by introducing compression-set, cracks, and splits, etc. The modulus of elasticity (MOE) in tension of five hardwood species, which are potential raw materials for composite manu- facture, was investigated in veneer form. The experimental work included dynamic MOE determination using ultrasound stress wave timing and static MOE measurements for comparison purposes. The orthotropy of MOE in the longitudinal-tangential (LT) plane was also a target of the investigation. Theoretical models were fitted to experimental data that may predict the MOE of the constituents according to their position within the consolidated composites. Experimental and analytical results indicated that a combined model including the Hankinson’s formula and an orthotropic tensorial ap- proach is the best estimator for MOE of veneers having inclined grain orientation. Furthermore, the ² Member of SWST.
Transcript
Wood and Fiber Science, 35(2), 2003, pp. 308–320q 2003 by the Society of Wood Science and Technology
ORTHOTROPIC STRENGTH AND ELASTICITY OF HARDWOODS INRELATION TO COMPOSITE MANUFACTURE
PART III: ORTHOTROPIC ELASTICITY OF STRUCTURAL VENEERS
Elemer M. Lang†Associate Professor
Laszlo BejoGraduate Research Assistant
West Virginia UniversityDivision of Forestry
Morgantown, WV 26506-6125
Ferenc DivosAssociate Professor
Institute of Wood Based Composites
Zsolt KovacsProfessor, Director
Institute of Product Development and TechnologyUniversity of West Hungary
H-9400 Sopron, Pf.:132Hungary
and
R. Bruce AndersonAssistant Professor
West Virginia UniversityDivision of Forestry
Morgantown, WV 26506-6125
(Received November 2001)
ABSTRACT
Structural veneers approximately 3.2 mm (⅛ in.) in thickness are widely used as basic constituentsin structural composites such as plywood, laminated veneer lumber (LVL), and parallel strand lumber(PSL). The veneer processing operation (peeling) may adversely alter the mechanical properties of thewood substance by introducing compression-set, cracks, and splits, etc. The modulus of elasticity(MOE) in tension of five hardwood species, which are potential raw materials for composite manu-facture, was investigated in veneer form. The experimental work included dynamic MOE determinationusing ultrasound stress wave timing and static MOE measurements for comparison purposes. Theorthotropy of MOE in the longitudinal-tangential (LT) plane was also a target of the investigation.Theoretical models were fitted to experimental data that may predict the MOE of the constituentsaccording to their position within the consolidated composites. Experimental and analytical resultsindicated that a combined model including the Hankinson’s formula and an orthotropic tensorial ap-proach is the best estimator for MOE of veneers having inclined grain orientation. Furthermore, the
† Member of SWST.
309Lang et al.—ORTHOTROPIC ELASTICITY OF VENEERS
relationship between static and dynamic MOE values may be obtained by second-order polynomialmodels.
Keywords: Orthotropy, hardwood, tensile MOE.
INTRODUCTION
A long-term research project to investigatedifferent hardwood species as potential rawmaterials for structural composites is underprogress. The cooperative international re-search focuses on the exploration of mechan-ical properties of five hardwoods, includingthree Appalachian and two East European spe-cies: quaking aspen (Populus tremuloides), redoak (Quercus rubra), yellow-poplar (Lirioden-dron tulipifera), turkey oak (Quercus cerris),and true poplar (Populus x. Euramericana cv.Pannonia), respectively. A detailed descrip-tion of the project, justification, and researchneed have already been discussed previouslyin related publications (Lang et al. 2000; Langet al. 2002).
The work presented here is the third paperof a series further exploring the mechanicalproperties for hardwood species used in struc-tural composite production. The orthotropy ofMOE in tension for structural veneers was thetarget of the present investigation.
The objectives included:
1. The experimental determination of modu-lus of elasticity (MOE) of veneer sheets us-ing an ultrasonic technique.
2. Investigation of the correlation between dy-namic and static MOE values.
3. Development of model(s) that are capableof estimating the MOE values of structuralveneers at different grain orientations.
4. Experimental validation of the model(s) forscreening out the possible best predictionequation for further modeling purposes.
This paper provides a review of relevant lit-erature and discusses possible theoretical ap-proaches for estimating the direction-depen-dent modulus of elasticity of structural ve-neers. Furthermore, it describes the experi-mental and analytical works performed, alongwith conclusions and further modeling possi-bilities.
LITERATURE REVIEW
The orthotropic tensile properties of thinwood plates (veneers) are difficult to assess bycommon testing methods because of the lowstiffness and strength properties perpendicularto the grain. Usually no standard ASTM test-ing procedures can be used for measuring thetension strength and modulus of elasticity ofveneers. Therefore, limited research has beendone on the tensile orthotropy of thin woodenplates. Gerhards (1988) examined the effect ofsloping grain on the tensile strength of Doug-las-fir. At small angle deviations (less than208), he found that the modified Hankinson’sformula (Kollman and Cote 1968) provided anacceptable fit. In another work that includedthe full grain orientation range (Woodwardand Minor 1988), the authors found that thesame theory worked well, but provided aworse prediction than a hyperbolic formula.Pugel (1990) developed an angle-to-grain ten-sile setup for thin specimens. Tensile test re-sults of Douglas-fir and southern pine, mea-sured by this new technique, showed reason-able agreement with the original Hankinson’sformula. These studies dealt with the tensilestrength only, and did not address the effectof sloping grain on the modulus of elasticity.
Nondestructive testing is a simple and in-expensive alternative to static tests. Its advan-tages are obvious: the specimen is not de-stroyed during the measurement, which is usu-ally fast and less labor-intensive. Furthermore,nondestructive evaluation is often much sim-pler than the static test. Vibration methods areparticularly suitable for quantitative, as well asqualitative evaluation, of materials. The rela-tionship of vibration properties to the elasticcharacteristics of materials was recognized asearly as 1747 by Riccati. Researchers startedto apply this relationship for wood in the early1950s (Pellerin 1965).
Vibration methods include two subtypes:
310 WOOD AND FIBER SCIENCE, APRIL 2003, V. 35(2)
transverse and longitudinal (stress-wave) vi-bration. Furthermore, different measuringtechniques may include low or high frequency(ultrasonic) stress waves for measuring me-chanical and/or physical properties of materi-als. According to theory, measured transversevibration frequency and wave propagation ve-locity are related to the bending and uniaxialMOE, respectively. Many studies verifiedthese relationships experimentally, typicallywith excellent results. Researchers also en-deavored to find empirical correlations be-tween vibration and strength properties. Manyconsidered the damping characteristics ofwood to be promising for evaluation of me-chanical properties, but their experiments werenot invariably successful. Pu and Tang (1997)gave an excellent overview of the researchconducted in this area.
The application of static tension tests to an-gle-to-grain veneer specimens is limited dueto the inherent fragility of thin wooden platesacross the grain. The mechanical properties ofveneer can be very different from those of thewood it originated from, and assessment of ve-neer properties is sometimes desirable.
There are two areas where vibration testing(stress-wave grading) of veneers can be par-ticularly useful: 1. relating the mechanicalproperties of logs to those of the veneer peeledfrom them (Ross et al. 1999; Rippy et al.2000) and 2. veneer classification prior toLaminated Veneer Lumber manufacture to en-gineer or improve the consistency of the prod-uct’s end properties (Koch and Woodson 1968;Jung 1982; Kimmel and Janiowak 1995;Shuppe et al. 1997). The latter gained practicalapplication, too, and a commercial tool is nowwidely used for classifying veneer sheets ac-cording to their stress-wave characteristics(Sharp 1985).
Other studies about veneer testing by stress-waves include that of Jung (1979), who pre-sented a comprehensive study of stress-waveapplication on veneers. He examined the po-tential of this technique to detect knots andslope of grain, and investigated the effect ofspecimen size and different testing devices.
Hunt et al. (1989) correlated the tensile andstress-wave MOE of veneer with acceptableresults. Most recently, Wang et al. (2001) in-vestigated the potential of two stress-wavetechniques to detect lathe checks and knots inveneer. Stress-wave propagation parameterswere sensitive to defects, when measuring per-pendicular to grain.
Few studies dealt with the effect of slopinggrain on nondestructive testing parameters.Kaiserlik and Pellerin (1977) attempted to pre-dict tensile strength of woods containing slop-ing grain. Divos et al. (2000) used ultrasonicpropagation velocity and attenuation parame-ters to predict grain slope. They showed thatboth ultrasonic velocity and the magnitude ofthe first received amplitude are good indica-tors of grain deviation. Attenuation is better todetect small grain angles, while propagationvelocity—which is a function of the direction-dependent MOE—is a better estimator for theentire grain orientation range. Jung (1979) ex-amined (among other factors) the effect ofsloping grain on the stress-wave characteris-tics of veneers. He found that at small angles(,58) there is little change in stress-wave ve-locity, but at slightly larger angles it decreasesrapidly. There appears to be no study in theliterature that uses vibration methods to de-scribe the relationship between MOE andgrain angle in wood.
THEORETICAL BACKGROUND
The propagation velocity of longitudinalstress-waves in a material is directly related tothe modulus of elasticity and the bulk densityof the substance:
Ed 5 v2r (1)
where:
Ed — dynamic Modulus of Elasticity (Pa)v — propagation velocity (m/s)r — density (kg/m3)
The above equation holds true for so-calledone-dimensional bodies only, that is, wherethe dimensions perpendicular to the wave
311Lang et al.—ORTHOTROPIC ELASTICITY OF VENEERS
propagation are at least one magnitude smallerthan the wave length. In veneer sheets, whereone cross-sectional dimension is larger thanthe wave length (two-dimensional body), theabove equation is modified with the Poisson’sratio:
Ed 5 v2r(1 2 nxy2) (2)
where:
nxy 5 Poisson’s ratio (x—propagation direc-tion; y—perpendicular in-plane direc-tion).
Unfortunately, reliable information con-cerning nxy is seldom available. In past inves-tigations, stress-wave MOE measured on ve-neer was invariably calculated using Eq. (1).The results of Jung’s investigations (1979) in-dicate that the correction introduced in Eq. (2)appears to be negligible in red oak wood ve-neers. Other researchers also reported the neg-ligible effect of Poisson’s ratio in evaluationof thin wooden plates (Divos and Tanaka2000).
Because of the viscoelastic nature of wood,measured dynamic MOE depends on the rateof stress-development. During dynamic test-ing, stresses develop much faster than they doduring static testing and the difference be-tween the resulting MOE values is significant.For this reason, MOE calculated from longi-tudinal or transverse vibration characteristicsis called dynamic MOE.
Divos and Tanaka (2000) proposed the fol-lowing empirical equation to calculate the ra-tio of dynamic and static MOE:
E td s5 1 1 0.017 log (3)1 2E ts d
where:
Ed; Es — dynamic and static MOE, re-spectively
td; ts — characteristic time of the dynam-ic and static MOE determination,respectively.
Note that td is the period (T) of the appliedstress wave when vibration method is used to
determine dynamic properties and ts is theelapsed time to develop 10% of failure stresslevel by any applicable static testing proce-dure.
PREDICTION MODELS
Several models and theories were developedfor estimating the direction-dependent engi-neering properties of orthotropic materials.Many of these approaches include hard tomeasure material constants like modulus of ri-gidity or Poisson’s ratios. The model selectioncriteria for this research included: simplicity,reliability, and easy adaptability. The follow-ing three models were involved in this inves-tigation.
Tensor approach
The compliance matrix of an orthotropicmaterial can be converted into a four-dimen-sional tensor (Szalai 1994). Transforming thefirst element of this tensor results in an equa-tion that can be used to estimate the stiffnessof the material in any direction inclined to itsprincipal material coordinates. The interestedreader can find the detailed description andderivation of this model in an earlier, relatedpublication (Lang et al. 2002). The generalequation applied to MOE in the LT plane only,where the grain angle (w) controls the prop-erty, reduces to the following form:
1 14 4E 5 1 cos w 1 sin wO @[E EL T
4 1 12 21 2 2 sin w cos w
R4581 2 ]E E ELT L T
(4)
where:
EO — predicted MOE at grain angle w;Ei — experimentally determined MOE in
the principal anatomical directions (i5 L, T);
E R458LT — experimentally determined MOE in
the LT plane, at w 5 458.
Equation (4) needs three predetermined E
312 WOOD AND FIBER SCIENCE, APRIL 2003, V. 35(2)
values for predicting the modulus of elasticityin the LT plane. Besides its demonstrated the-oretical basis, the experimentally determinedmidpoint (i.e., E ) may provide improvedR458
LT
accuracy compared to other models.
Hankinson’s formula
The most widely used equation for predict-ing the effect of sloping grain on unidirection-al strength and MOE is the experimental Han-kinson’s formula (Hankinson 1921). For MOEin the LT plain, the equation can be written asfollows:
E EL TE 5 , (5)H 2 2E sin w 1 E cos wL T
where EH is the predicted MOE at grain anglew, and the other notations are as in Eq. (4).
The Hankinson’s formula, though empirical,is simpler than the tensor approach and usesonly two predetermined MOE values for theestimation.
Hyperbolic formula
Woodward and Minor (1988) reported thata hyperbolic formula provides excellent fit totensile strength data. Although no experimen-tal data were provided regarding the stiffnessprediction, it may provide reasonable estima-tion of elasticity values. The equation appliedin the LT plane takes the following form:
2E EL TE 5 , (6)Hyp 0.01w 20.01we (E 1 E ) 1 e (E 1 E )T L T L
where e is the base of the natural logarithm,and the other notations are as in Eq. (4). Sim-ilarly to that of Hankinson’s formula, it rep-resents a simple approach that requires onlytwo predetermined elastic constants. Duringthis research, the applicability and predictionaccuracy of these models were investigated bythe following experimental and analyticalmethods.
MATERIALS AND METHODS
Experimental material consisted of 3.2-mm-(⅛-in)-thick structural veneer sheets of three
Appalachian hardwood species: quaking aspen(Populus tremuloides), red oak (Quercus rub-ra), and yellow-poplar (Liriodendron tulipi-fera), and two European species: turkey oak(Quercus cerris), and true poplar (Populus x.Euramericana cv. Pannonia). Structural com-posite plants in West Virginia and in Europeprepared the veneer sheets from logs. The ve-neer sheets used for specimen fabrication wereprocessed as in actual manufacturing includingpeeling, drying, and clipping. Consequently,specimens included all the random discrepan-cies such as cracks, compression-set, etc. thatmay develop during structural veneer manu-facturing. However, studying the effects offurther composite manufacturing processessuch as densification and resin penetration onthe mechanical properties was beyond thescope of this investigation.
Dynamic MOE was determined using astress-wave measuring equipment. The deviceconsists of an ultrasonic timer and two pie-zoelectric accelerometers. The transducersused a 127 V, 45 kHz impulse that lasted for30 ms. The subsequent impulses were gener-ated at one-second intervals. Surface pressureof 3–4 MPa between the transducers and theveneer sheets provided adequate coupling, us-ing sandpaper as a coupling material.
Figure 1a and 1b show the details and sche-matic of the ultrasonic equipment, respective-ly. The distance between the transducer andthe receiver was 160 mm. The material wasclamped on a special table, which was coveredwith a 4-mm-thick rubber sheet, to avoidbridging of the signal between the transducerand the receiver. A commercial hand-clampprovided adequate surface pressure betweenthe transducers and the material.
Figure 2 demonstrates the operation prin-ciple of the ultrasonic timer. Timing startswhen the excitation impulse rises, and stopswhen the received signal reaches a thresholdvalue above the noise level. The advantage ofthis method is that there is minimal delay be-tween the reception of the signal and the stop-page of the timer. The measured time was cor-
313Lang et al.—ORTHOTROPIC ELASTICITY OF VENEERS
FIG. 1. View (a.) and schematic (b.) of the ultrasonictiming device.
FIG. 2. Operation principle of the ultrasonic timer. Ex-planation of propagation time and threshold signal.
rected to account for travelling time in thetransducer housing.
Because peeled structural veneers representtwo-dimensional bodies, the applicability ofEq. (1) or (2) was investigated. Preliminarymeasurements were executed on 300-mm 3300-mm 3 3.2.-mm veneer sheets using var-ious grain orientations. The exact location ofthe accelerometers was marked and thin ve-neer strips, that included the marked measure-ment locations, were cut from the sheet. Prop-agation times measured on veneer strips (i.e.,one-dimensional body) were no different fromthose obtained from measuring large sheets.This led to the conclusion that Eq. (1) is suf-ficient for dynamic MOE determination.
Material preparation for the exploration ofdynamic MOE started with the splitting oflarge veneer sheets along the grain. This pro-vided a base line for cutting the 200-mm 3200-mm specimens using a large paper shear.Furthermore, the split-side of the specimenserved as the 08 grain direction to which theinclined directions could be measured and
marked. Both sides of the specimens weremarked by 158 increment of grain orientationusing a precision protractor having 618 of ac-curacy.
The precut and marked specimens wereconditioned in a controlled environment of208C and 65% relative humidity. Approxi-mately six days of conditioning resulted inconstant weight of the veneer sheets. Twentycontrol specimens were used to establish thephysical properties of the experimental mate-rials. Table 1 contains the summary statisticsof these properties obtained by standard mea-surements (ASTM D-2394 and ASTM D-4442; 1996b, c). The comparatively low stan-dard deviations of physical properties indicatethat the natural variability wood was limitedby selecting defect-free and straight-grainedveneer specimens.
After conditioning and immediately prior todynamic MOE evaluation, the exact dimen-sions and weight of the specimens were mea-sured and recorded for bulk density calcula-tions. The accuracies of dimension and weightmeasurements were 0.01 mm and 0.01 g, re-spectively. The ultrasonic propagation timewas assessed in the marked directions on bothfaces of each specimen.
Data evaluation started with calculating thedensity of the specimens, and the propagationtime (average of two sides) in each directionon each sheet. The propagation velocity wascalculated by dividing the transducer distanceby the corrected propagation time. Finally, Eq.
314 WOOD AND FIBER SCIENCE, APRIL 2003, V. 35(2)
TABLE 1. Summary statistics of the measured physical properties of structural veneers.
Species Na
Moisture content (%)
xb Stdc
Specific gravity
x Stdc
Bulk density (kg/m3)
x Stdc
AspenRed oakYellow-poplarTrue poplarTurkey oak
2020202020
11.810.511.511.311.7
0.320.380.610.590.45
0.370.500.420.380.65
0.010.010.020.040.03
385523450397670
18.019.517.317.619.4
a Sample size.b Mean value.c Standard deviation.
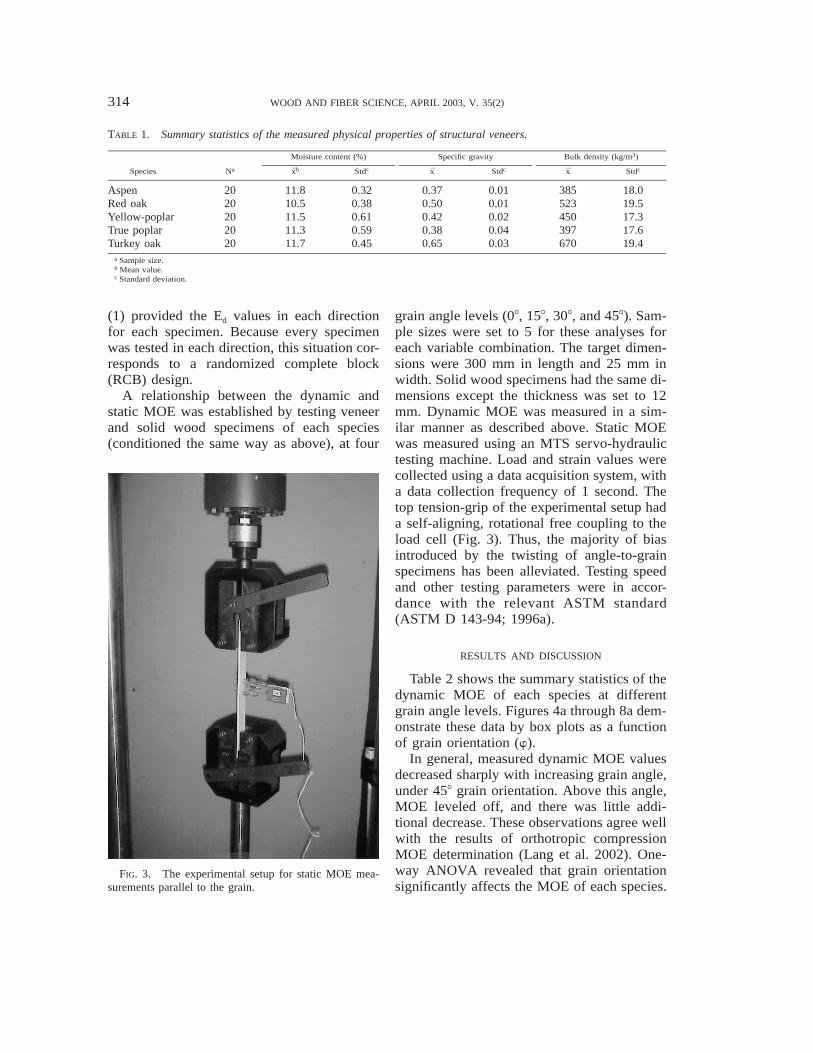
FIG. 3. The experimental setup for static MOE mea-surements parallel to the grain.
(1) provided the Ed values in each directionfor each specimen. Because every specimenwas tested in each direction, this situation cor-responds to a randomized complete block(RCB) design.
A relationship between the dynamic andstatic MOE was established by testing veneerand solid wood specimens of each species(conditioned the same way as above), at four
grain angle levels (08, 158, 308, and 458). Sam-ple sizes were set to 5 for these analyses foreach variable combination. The target dimen-sions were 300 mm in length and 25 mm inwidth. Solid wood specimens had the same di-mensions except the thickness was set to 12mm. Dynamic MOE was measured in a sim-ilar manner as described above. Static MOEwas measured using an MTS servo-hydraulictesting machine. Load and strain values werecollected using a data acquisition system, witha data collection frequency of 1 second. Thetop tension-grip of the experimental setup hada self-aligning, rotational free coupling to theload cell (Fig. 3). Thus, the majority of biasintroduced by the twisting of angle-to-grainspecimens has been alleviated. Testing speedand other testing parameters were in accor-dance with the relevant ASTM standard(ASTM D 143-94; 1996a).
RESULTS AND DISCUSSION
Table 2 shows the summary statistics of thedynamic MOE of each species at differentgrain angle levels. Figures 4a through 8a dem-onstrate these data by box plots as a functionof grain orientation (w).
In general, measured dynamic MOE valuesdecreased sharply with increasing grain angle,under 458 grain orientation. Above this angle,MOE leveled off, and there was little addi-tional decrease. These observations agree wellwith the results of orthotropic compressionMOE determination (Lang et al. 2002). One-way ANOVA revealed that grain orientationsignificantly affects the MOE of each species.
315Lang et al.—ORTHOTROPIC ELASTICITY OF VENEERS
TABLE 2. Summary statistics of the measured dynamic MOE values.
Species
Grain angle (f8)
08 158 308 458 608 758 908 n
Dynamic modulus of elasticity (GPa)
Quaking aspen
Red oak
Yellow-poplar
MeanStd.MeanStd.MeanSt.
11.9760.888
10.6511.201
13.5291.020
7.0560.7525.7700.8277.6310.735
2.6580.2871.9970.3482.5890.254
1.2790.1351.3960.0461.2540.112
1.0480.0451.3870.0391.1490.050
1.0350.0451.3830.0391.1450.060
1.0300.0471.3820.0441.1420.062
20
23
21
Turkey oak
True poplar
MeanStd.MeanStd.
12.2210.852
10.6380.839
8.4350.8977.2080.825
3.9890.4173.4760.371
1.8780.2581.8500.159
1.1580.1951.1580.154
0.8070.0710.8700.106
0.6850.1250.7500.132
11
12
n—sample size.Std.—standard deviation.
FIG. 4. Dynamic MOE values as a function of grainorientation for aspen (Populus tremuloides). a. Compari-son of experimental and model predicted values. b. Theaverage absolute percentage of bias of the models.
FIG. 5. Dynamic MOE values as a function of grainorientation for red oak (Quercus rubra). a. Comparison ofexperimental and model predicted values. b. The averageabsolute percentage of bias of the models.
Tukey’s multiple comparison tests, however,failed to detect statistically significant differ-ences between the MOE values above 458 and608 grain angles for the Appalachian and Eu-ropean species, respectively.
As a first approach to evaluating the predic-tion models, correlation analysis was used onthe data, without regard to blocking. Table 3lists the r2 values by species and model types.
316 WOOD AND FIBER SCIENCE, APRIL 2003, V. 35(2)
TABLE 3. r2 values provided by the different prediction models.
FIG. 6. Dynamic MOE values as a function of grainorientation for yellow-poplar (Liriodendron tulipifera). a.Comparison of experimental and model predicted values.b. The average absolute percentage of bias of the models.
In all but one case, the hyperbolic formulaprovided less precise prediction than either ofthe other two models. Thus, it was eliminatedfrom further evaluations. The fit of Hankin-son’s formula resulted in higher r2 values inthe cases of aspen and yellow-poplar, whilethe orthotropic tensor approach (Eq. 4) seemsto work better for red oak and for the Hun-garian species. For the Appalachian species,the former appears to work better in the lower
grain angle region, while the latter is very ac-curate in the higher range.
In complex modeling that requires severalinput parameters, the calculated results can beseriously impaired if the uncertainties of theparameters are high. Our goal was to screenout the possible best prediction equation forMOE determination of structural veneers as afunction of grain orientation for further mod-eling purposes. Thus, the prediction equationintroduces only limited uncertainties that prop-agates into the final model prediction. Basedon the above discussion, a combination of thetwo models appeared to improve the MOEprediction throughout the whole range. Fol-lowing is a possible combination that workswell:
Ïp/2 2 Ïw Ïwˆ ˆ ˆE 5 E 1 E , (7)C H OÏp/2 Ïp/2
where: EH, EO and EC are the dynamic MOEvalues predicted at grain angle w, by the Han-kinson formula, the orthotropic tensor ap-proach, and the above combination, respec-tively. It is obvious that the value of EC willbe close EH at lower grain angles, and ap-proaches EO rapidly, as w increases. Figures 4athrough 8a, along with r2 values given in Table3, show that the combined model provides im-proved prediction for almost all examined spe-cies. One should note that Eq. (7) does notprovide a new approach to predict the direc-tion-dependent MOE of structural veneers.Rather, it exploits the fact that the evaluatedtwo models have different accuracies over thelower and higher grain angle domains.
For a more rigorous evaluation of predictionaccuracy, all three models were applied to
317Lang et al.—ORTHOTROPIC ELASTICITY OF VENEERS
FIG. 7. Dynamic MOE values as a function of grainorientation for turkey oak (Quercus cerris). a. Comparisonof experimental and model predicted values. b. The av-erage absolute percentage of bias of the models.
FIG. 8. Dynamic MOE values as a function of grainorientation for true poplar (Populus x. Euroamericana cv.Pannonia). a. Comparison of experimental and model pre-dicted values. b. The average absolute percentage of biasof the models.
each specimen individually. The followingformula calculated the average percentage biasof the prediction for a given grain angle andprediction model:
E 2 Ewi wiOEwiBias 5 3 100% (8)
n
where:
Ewi — dynamic MOE value predicted atgrain angle w by applying Eqs. (4),(5), or (7) to data obtained fromspecimen i;
Ewi — dynamic MOE measured on speci-men i at grain angle w.
n — total number of specimens.
Figures 4b through 8b show the average ab-solute percentage bias of the different predic-
tion models. The analysis revealed that thebias of the Hankinson’s formula is at maxi-mum close to 458 (;30 to 100%), then de-creasing sharply towards 08 and 908.
The tensor approach gives the most accurateprediction for red oak and for the Europeanspecies, where its bias is always less than20%. This model follows experimental resultsvery closely above 458 grain angle for everyspecies. The maximum bias is usually at 158grain angle, approaching 40% for aspen andyellow-poplar. This translates into a large ab-solute bias, since MOE is relatively high atthis grain angle. Note that at 458 grain anglethis model has 0 bias because Eq. (4) includesthe actual MOE at this grain orientation.
While it was not always the best model, thecombined formula provided consistently goodperformance, in terms of both r2 values and
318 WOOD AND FIBER SCIENCE, APRIL 2003, V. 35(2)
FIG. 9. Association between experimentally measureddynamic and static MOE values. Regression models andr2 values are listed. a. First-order regression model. b.Second-order regression model.
bias. With the exception of red oak, the biasremained below 20%. It does appear that thismodel offers satisfactory predictions for eachspecies, and might be more useful for dynamicMOE estimation for further model develop-ments.
Figure 9 shows the association between theexperimentally measured dynamic and staticMOE. This graph includes the data pointsmeasured both on veneer and on solid wood,for all North American species. It was as-sumed that the relationship should dependonly on the characteristic time of the test pro-cedure (Eq. 3). Because the ratio of ts to td isindependent from species or orientation, therelationship should be linear with uniformslope for every species, and the regression lineshould pass through the origin. From Fig. 9ait is apparent that this is not so. The regressionline does not pass through the origin, and thelinearity of the data is questionable. The cause
of this anomaly is most likely the high damp-ing effect in veneer and wood in non-longi-tudinal directions, which might have influ-enced the measurements. A serious problemwith the first order regression model depictedon Fig. 9a is that, according to its equation,dynamic MOE values measured at highergrain angles correspond to negative staticMOE.
Figure 9b shows the scatter plot to which asecond-order polynomial was fitted. As theimproved r2 value indicates, this model de-scribes the relationship significantly betterthan did the linear regression depicted in Fig.9a. It is also apparent that, using the quadraticmodel, positive static MOE values are calcu-lated for any dynamic MOE value. Whilethere is no real justification for using a second-order regression model, it appears that thisequation might be better for estimating thestatic MOE from its dynamic counterpart.
SUMMARY AND CONCLUSIONS
The analytical and experimental worksaimed at exploring the orthotropic nature ofMOE in tension of structural veneers havebeen presented. Results indicated that a com-bined model including the Hankinson’s equa-tion and a model based on tensorial approachcould predict the stiffness of structural veneersas a function of inclined grain orientation withreasonable accuracy. Although this combina-tion does not represent a new theoretical ap-proach for angle-to-grain MOE prediction, itmay reduce bias errors that can propagate tothe results of complex calculations. Ultrasonicstress-wave timing does appear to be a goodtechnique for assessing the dynamic MOE ofveneers. A second-order polynomial regres-sion model may be used to estimate the staticmodulus of elasticity values after obtaining thedynamic ones.
The developed experimental methods andmodels will be used to generate input MOEdata for simulation models. The overall sim-ulation process will include the effect of fur-ther composite processing parameters such as
319Lang et al.—ORTHOTROPIC ELASTICITY OF VENEERS
densification during consolidation, resin pen-etration, etc. These combined stochastic/deter-ministic models are under development forpredicting the flexural strength and stiffness ofstructural composites in which the veneer con-stituents are aligned randomly or systemati-cally.
ACKNOWLEDGMENTS
This research is partially financed by theMcIntire-Stennis Forestry Research Act, pro-ject No.: 978 at West Virginia University andthe Hungarian National Science Foundation(OTKA) project No.: T 025985. The interna-tional cooperation has been made possiblethrough the North Atlantic Treaty Organiza-tion (NATO), Cooperative Research Grant,CRG.LG 973967. The financial supports aregratefully acknowledged. The authors wish toexpress their appreciation to Trus Joist Mc-Millan a Weyerhaeuser Business, LVL andPSL plant at Buckhannon, WV, for donatingraw materials and providing technical assis-tance in veneer manufacturing. This manu-script is published with the approval of theDirector of the West Virginia Agricultural andForestry Experiment Station as Scientific Ar-ticle No. 2836.
REFERENCES
AMERICAN SOCIETY FOR TESTING AND MATERIALS (ASTM).1996a. Standard Methods of Testing Small Clear Spec-imens of Timber ASTM D 143-94. ASTM, West Con-shohocken, PA.
. 1996b. Standard Test Methods for Specific Grav-ity of Wood and Wood-base Materials ASTM D 2395-93. ASTM, West Conshohocken, PA.
. 1996c. Standard Test Methods for Direct Mois-ture Content Measurement of Wood and Wood-baseMaterials ASTM D 4442-92. ASTM, West Consho-hocken, PA.
DIVOS, F., AND T. TANAKA. 2000. Effect of creep on mod-ulus of elasticity determination of wood. ASME J. Vi-bration Acoust. 122(1):90–92.
, I. DANIEL, AND L. BEJO. 2000. Defect detectionin timber by stress wave technique. In Proc. Int. Conf.on Wood and Wood Fiber Composites, 13–15 April,2000, Stuttgart, Germany.
GERHARDS, G. C. 1988. Effect of slope of grain on tensilestrength. Forest Prod. J. 38(7/8):39–40.
HANKINSON, R. L. 1921. Investigation of crushing strength
of spruce at varying angles of grain. Air Service Infor-mation Circular No. 259, U.S. Air Service, 1921.
HUNT, M. O., M. H. TRICHE, G. P. MCCABE, AND W. L.HOOVER. 1989. Tensile properties of yellow-poplar ve-neer strands. Forest Prod. J. 39(9):31–33.
JUNG, J. 1979. Stress-wave grading techniques on veneersheets. Gen. Tech. Rep. FPL-GTR-22. USDA ForestServ., Forest Prod. Lab., Madison, WI.
JUNG, J. 1982. Properties of parallel-laminated veneerlumber from stress-wave-tested veneers. Forest Prod. J.32(7):30–35.
KAISERLIK, J. H., AND R. F. PELLERIN. 1977. Stress-waveattenuation as an indicator of lumber strength. ForestProd. J. 27(6):39–43.
KIMMELL, J. D., AND J. J. JANIOWAK. 1995. Red maple andyellow-poplar LVL from ultrasonically rated veneer.Forest Prod. J. 45(7/8):54–58.
KOCH, P., AND G. E. WOODSON. 1968. Laminating butt-jointed, log-run southern pine veneers into long beamsof uniform high strength. Forest Prod. J. 18(10):45–51.
KOLLMAN, F. P. P., AND W. A. COTE, JR. 1968. Principlesof wood science and technology, I. Springer-Verlag,New York, NY.
LANG, E. M., L. BEJO, J. SZALAI, AND Z. KOVACS. 2001.Orthotropic strength and elasticity of hardwoods in re-lation to composite manufacture. Part I. Orthotropy ofshear strength. Wood Fiber Sci. 32(4):502–519.
, , , , AND R. B. ANDERSON.2002. Orthotropic strength and elasticity of hardwoodsin relation to composite manufacture. Part II. Orthotro-py of compression strength and elasticity. Wood FiberSci. 34(2):350–365.
PELLERIN, R. F. 1965. Vibrational approach to nondestruc-tive testing of structural lumber. Forest Prod. J. 15(3):93–101.
PU, J., AND R. C. TANG. 1997. Nondestructive evaluationof modulus of elasticity of southern pine LVL: Effectof veneer grade and relative humidity. Wood Fiber Sci.29(3):249–263.
PUGEL, A. D. 1990. Angle-to-grain tensile strength speci-men for thin wood samples. Forest Prod. J. 40(2):49–51.
RICCATI, J. 1747. Verae et Germanae virim elasticarumleges ex phaenumenis demonstratae. De BononiensiSchientarium Academia Commentarii 1:523. Bogona.
RIPPY, R. C., F. G. WAGNER, T. M. GORMAN, H. D. LAY-TON, AND T. BODENHEIMER. 2000. Stress-wave analysisof Douglas-fir logs for veneer properties. Forest Prod.J. 50(4):49–52.
ROSS, R. J., S. W. WILLITS, W. VON SEGEN, T. BLACK, B.K. BRASHAW, AND R. F. PELLERIN. 1999. A stress wavebased approach to NDE of logs for assessing potentialveneer quality. Part 1. Small diameter ponderosa pine.Forest Prod. J. 49(11/12):60–62.
SHARP, D. J. 1985. Non-destructive techniques for manu-facturing LVL and predicting performance. Pages 100–108 in Proc. Fifth Symp. on Nondestructive Testing ofWood, Washington State Univ., Pullman, WA.
320 WOOD AND FIBER SCIENCE, APRIL 2003, V. 35(2)
SHUPPE, T. F., C. Y. HSE, L. H. GROOM, AND E. T. CHOONG.1997. Effect of silvicultural practice and veneer gradelayup on some mechanical properties of loblolly pineLVL. Forest Prod. J. 47(9):63–69.
SZALAI, J. 1994. Anisotropic strength and elasticity ofwood and wood based composites. Private ed. Sopron,Hungary. (in Hungarian.)
WANG, J., J. M. BIERNACKI, AND F. LAM. 2001. Nonde-structive evaluation of veneer quality using acousticwave measurements. Wood Sci. Technol. 34(2001):505–516.
WOODWARD, C. B., AND J. MINOR. 1988. Failure theoriesfor Douglas-fir in tension. J. Struct. Eng. 114(12):2808–2813.