64
Otis W. Brawley, M.D. Chief Medical and Scientific Officer American Cancer Society Professor of Hematology, Medical Oncology, Medicine and Epidemiology Emory University
Otis W. Brawley, M.D.
Chief Medical and Scientific Officer American Cancer Society
Professor of Hematology, Medical Oncology, Medicine and Epidemiology
Emory University
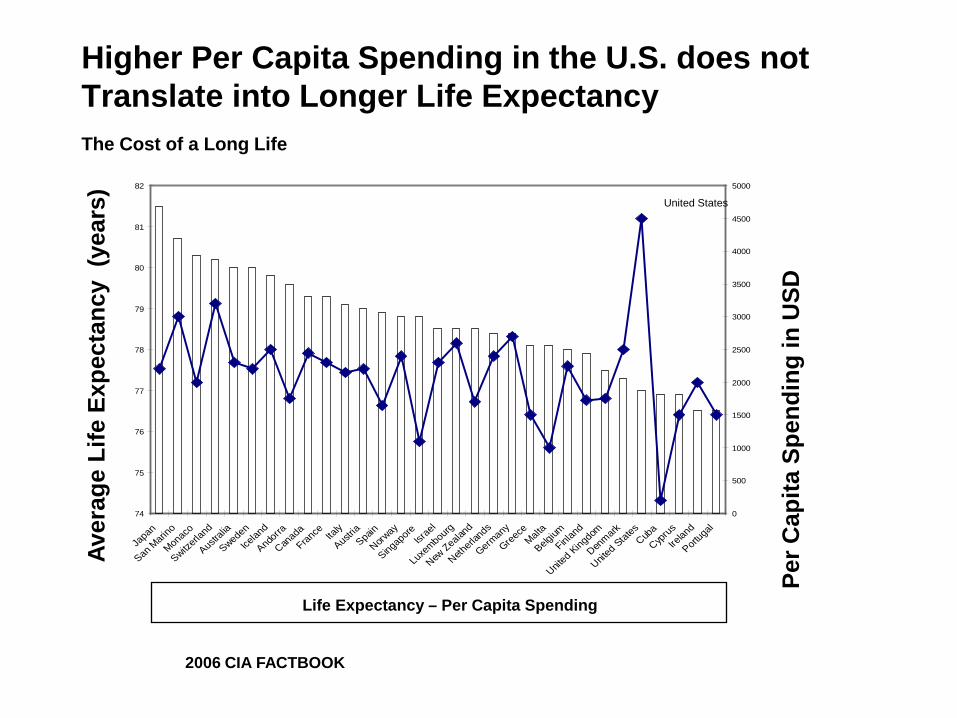
Higher Per Capita Spending in the U.S. does not Translate into Longer Life Expectancy The Cost of a Long Life
Japan
San Marin
o
Monaco
Switzerl
and
Australia
Sweden
Iceland
Andorra
Canada
France
Italy
Austria
Spain
Norway
Singapore Isr
ael
Luxembourg
New Zealan
d
Netherla
nds
Germany
GreeceMalta
Belgium
Finland
United Kingdom
Denmark
United States
Cuba
Cyprus
Ireland
Portugal
82 5000
Aver
age
Life
Exp
ecta
ncy
(yea
rs)
81
80
79
78
77
76
75
74
U ni t ed S t at es 4500
4000
3500
3000
2500
2000
1500
1000
500
0
Per C
apita
Spe
ndin
g in
USD
Life Expectancy – Per Capita Spending
2006 CIA FACTBOOK
Disparities in Health
• Some consume too much – (Unnecessary care given)
• Some consume too little – (Necessary care not given)
• We could decrease the waste and improve overall health!!!!
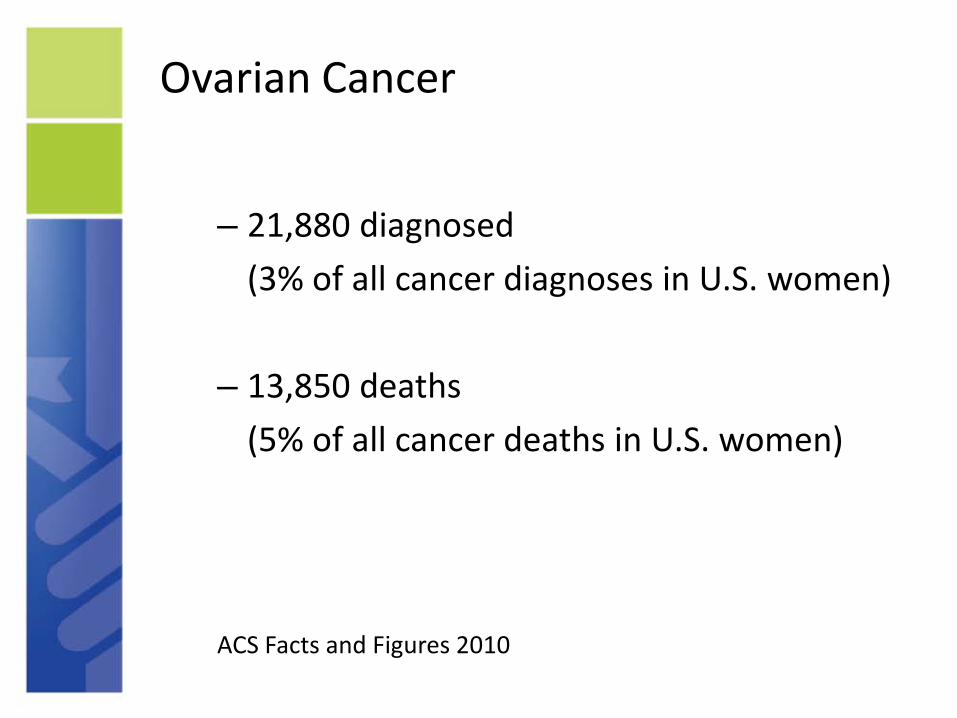
Ovarian Cancer
Ovarian Cancer
– 21,880 diagnosed (3% of all cancer diagnoses in U.S. women)
– 13,850 deaths (5% of all cancer deaths in U.S. women)
ACS Facts and Figures 2010
Breast Cancer
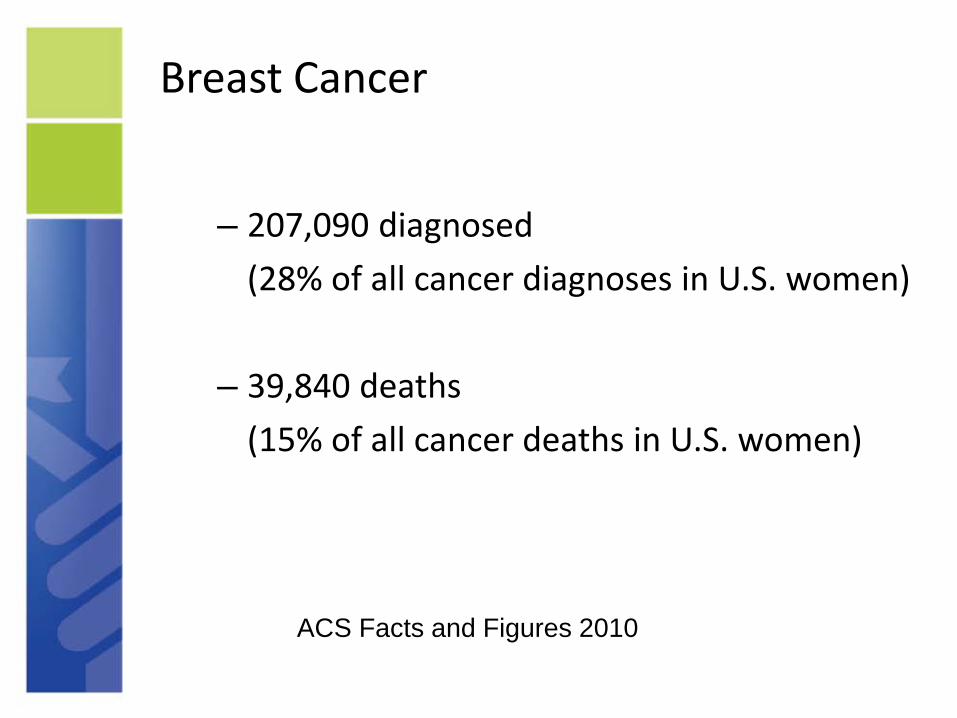
Breast Cancer
– 207,090 diagnosed (28% of all cancer diagnoses in U.S. women)
– 39,840 deaths (15% of all cancer deaths in U.S. women)
ACS Facts and Figures 2010
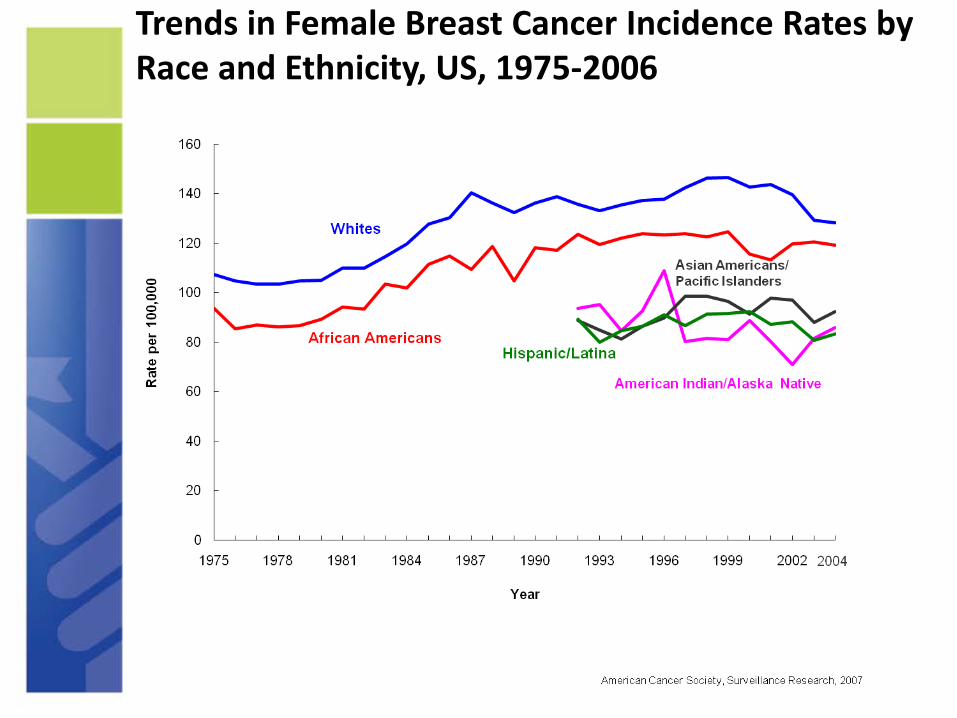
Trends in Female Breast Cancer Incidence Rates by Race and Ethnicity, US, 1975-2006
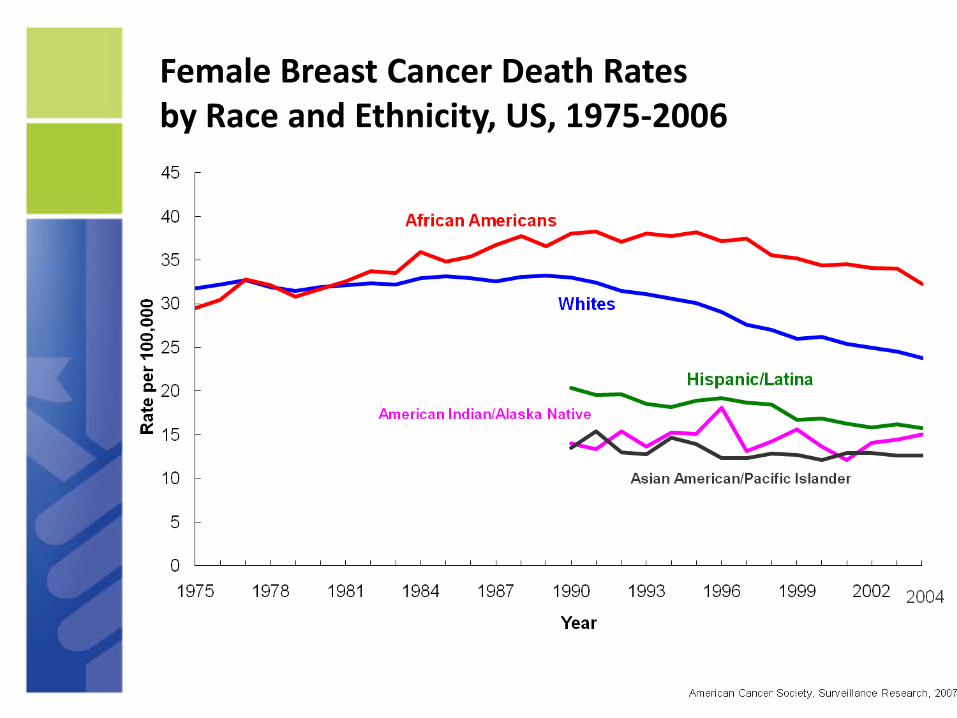
Female Breast Cancer Death Rates by Race and Ethnicity, US, 1975-2006

Breast Cancer Incidence Annualized 2003-2007 (NCI SEER)
Race/Ethnicity Rate per 100,000 Age-adjusted to 2000 standard
White 126.5
Black 118.3
Asian/Pacific Isl. 90.0
Native American 76.4
Hispanic 86.0
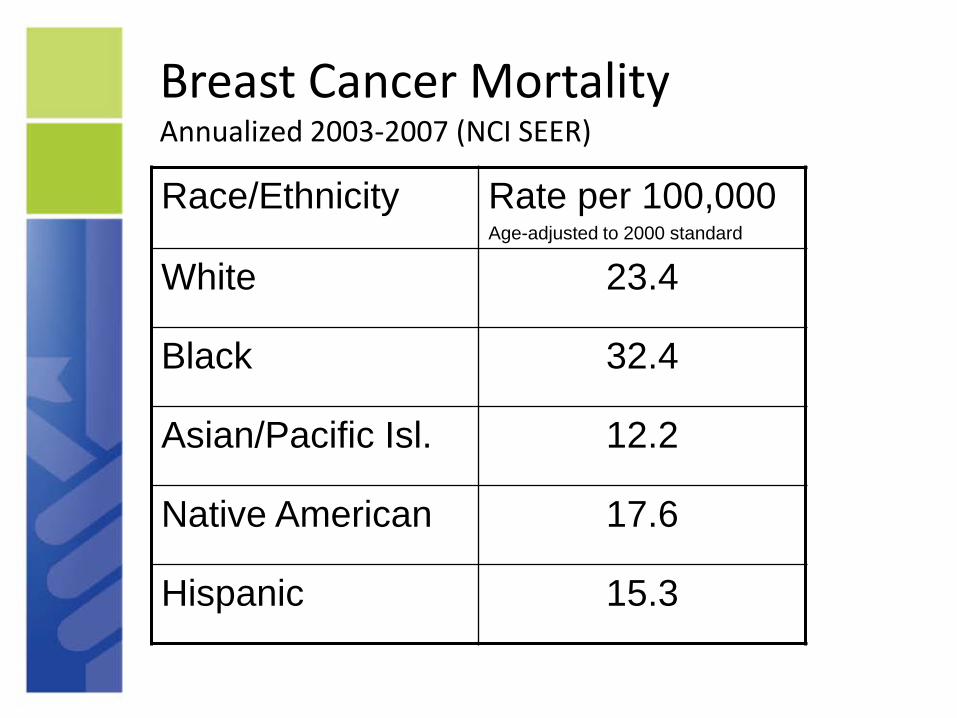
Breast Cancer Mortality Annualized 2003-2007 (NCI SEER)
Race/Ethnicity Rate per 100,000 Age-adjusted to 2000 standard
White 23.4
Black 32.4
Asian/Pacific Isl. 12.2
Native American 17.6
Hispanic 15.3

Probability of Developing Invasive Breast Cancer Among Women (NCI SEER)
Age 10 Year Risk
30 Years 0.40%
40 Years 1.47%
50 Years 2.84%
60 Years 3.67%
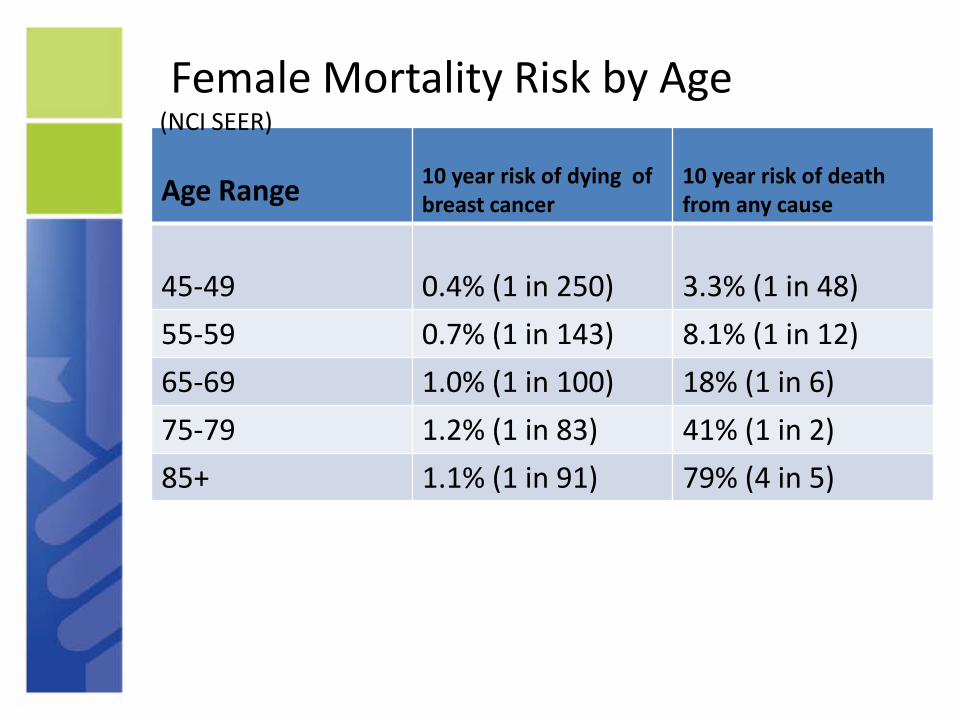
Female Mortality Risk by Age (NCI SEER)
Age Range 10 year risk of dying of breast cancer
10 year risk of death from any cause
45-49 0.4% (1 in 250) 3.3% (1 in 48) 55-59 0.7% (1 in 143) 8.1% (1 in 12) 65-69 1.0% (1 in 100) 18% (1 in 6) 75-79 1.2% (1 in 83) 41% (1 in 2) 85+ 1.1% (1 in 91) 79% (4 in 5)

Breast Cancer
207,090 total diagnosed in 2010 • Median age at diagnosis is 61
• Median age of death 68
• 161,590 age 50 and above • 35,400 age 40 to 49
• 6,170 age 35 to 40
• 3,930 age less than 35.
ACS Facts and Figures 2010
Breast Cancer Risk Factors
– Female – Age – Family History

Breast Cancer Risk Factors
Approximately 10,100 women diagnosed annually under the age of 40.
One in five women diagnosed under age forty has a family history of breast cancer diagnosed at any age.
Risk due to family history is not the exact same thing as genetic risk!
ACS Facts and Figures 2010

Breast Cancer Risk Factors
• Potentially modifiable
– Weight (overweight or obese) – Estrogen and progestin use
– Physical inactivity – Alcohol consumption
Breast Cancer Risk Factors
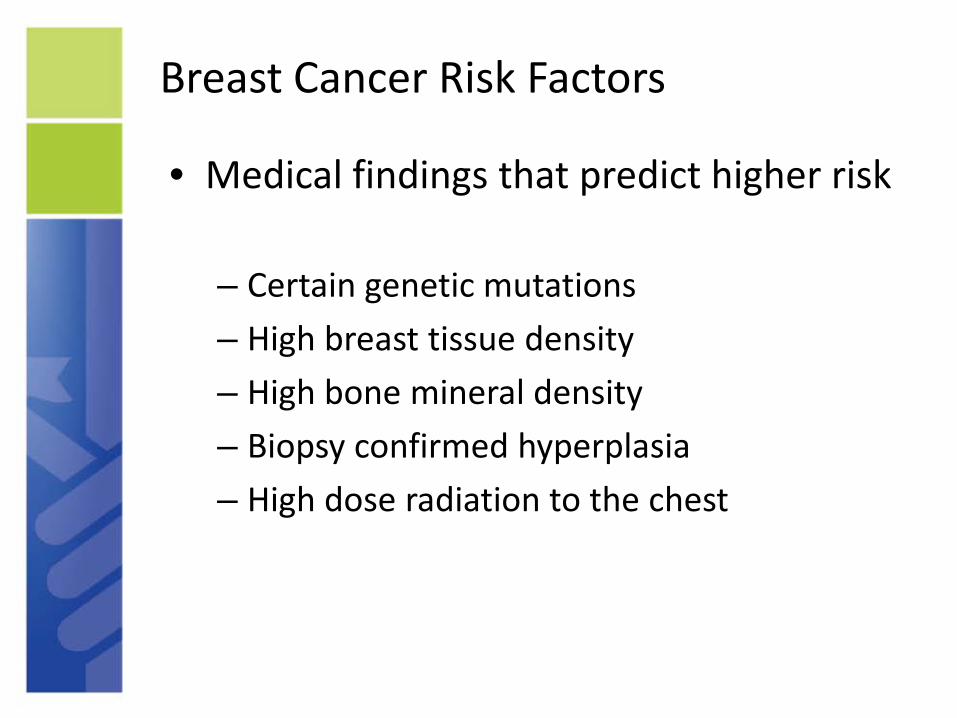
• Medical findings that predict higher risk
– Certain genetic mutations – High breast tissue density – High bone mineral density – Biopsy confirmed hyperplasia – High dose radiation to the chest
Breast Cancer Risk Factors
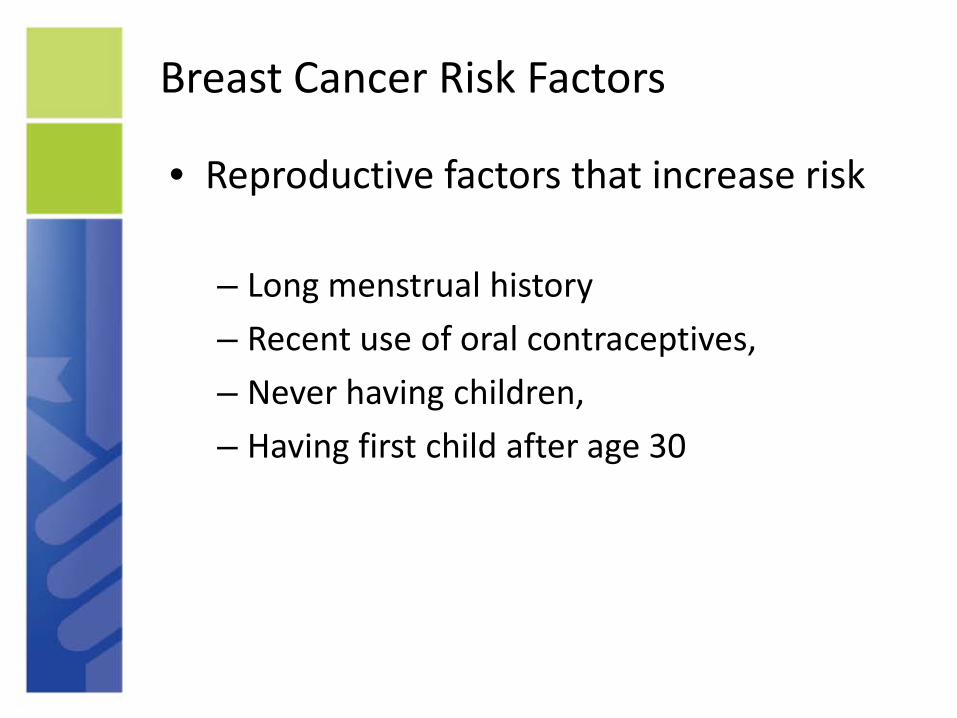
• Reproductive factors that increase risk
– Long menstrual history – Recent use of oral contraceptives, – Never having children, – Having first child after age 30
Genetic Risk for Breast Cancer
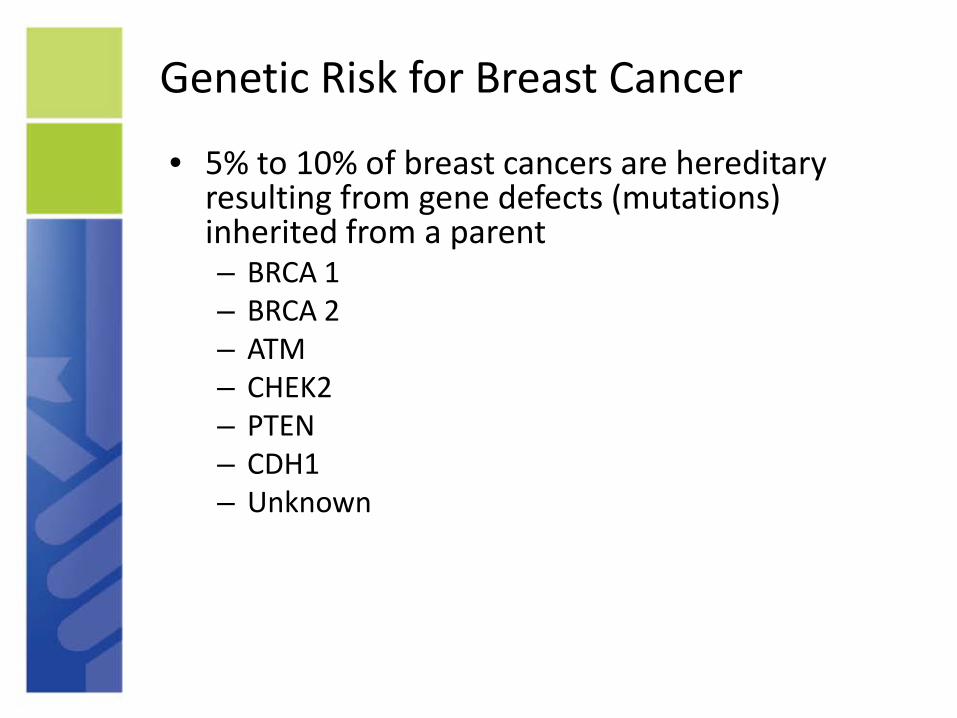
• 5% to 10% of breast cancers are hereditary resulting from gene defects (mutations) inherited from a parent – BRCA 1 – BRCA 2 – ATM – CHEK2 – PTEN – CDH1 – Unknown
Genetic Risk for Breast Cancer
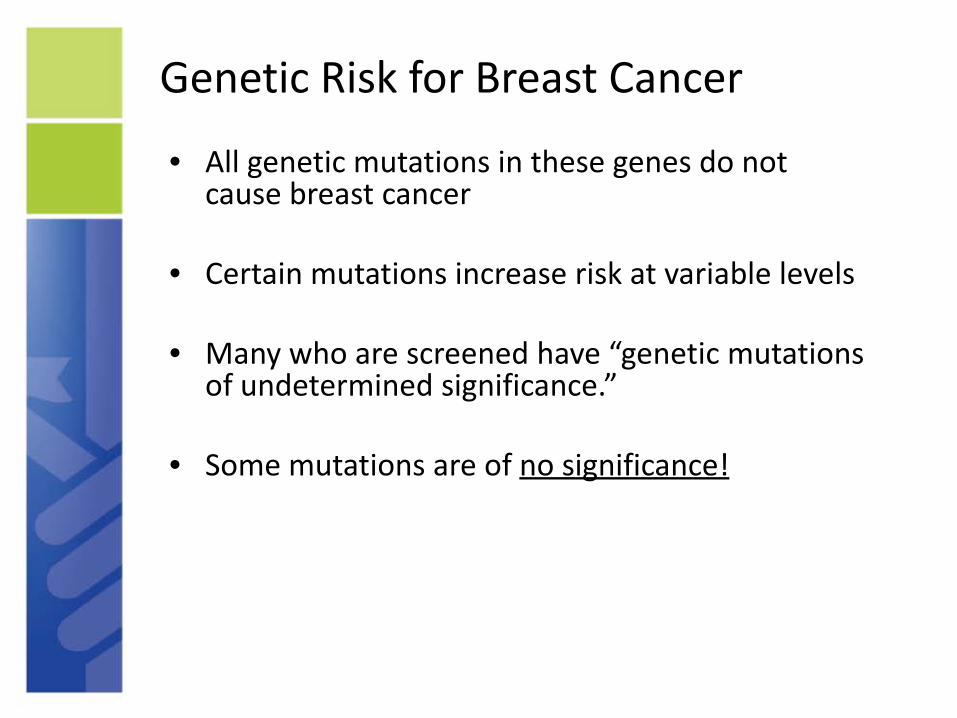
• All genetic mutations in these genes do notcause breast cancer
• Certain mutations increase risk at variable levels
• Many who are screened have “genetic mutationsof undetermined significance.”
• Some mutations are of no significance!
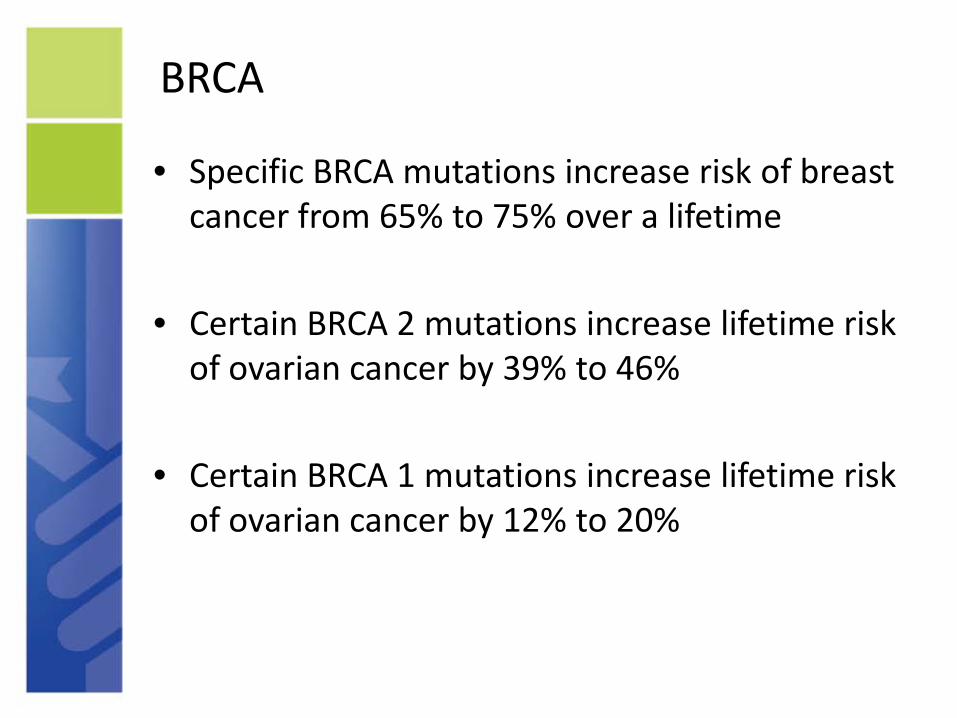
BRCA
• Specific BRCA mutations increase risk of breast cancer from 65% to 75% over a lifetime
• Certain BRCA 2 mutations increase lifetime risk of ovarian cancer by 39% to 46%
• Certain BRCA 1 mutations increase lifetime risk of ovarian cancer by 12% to 20%
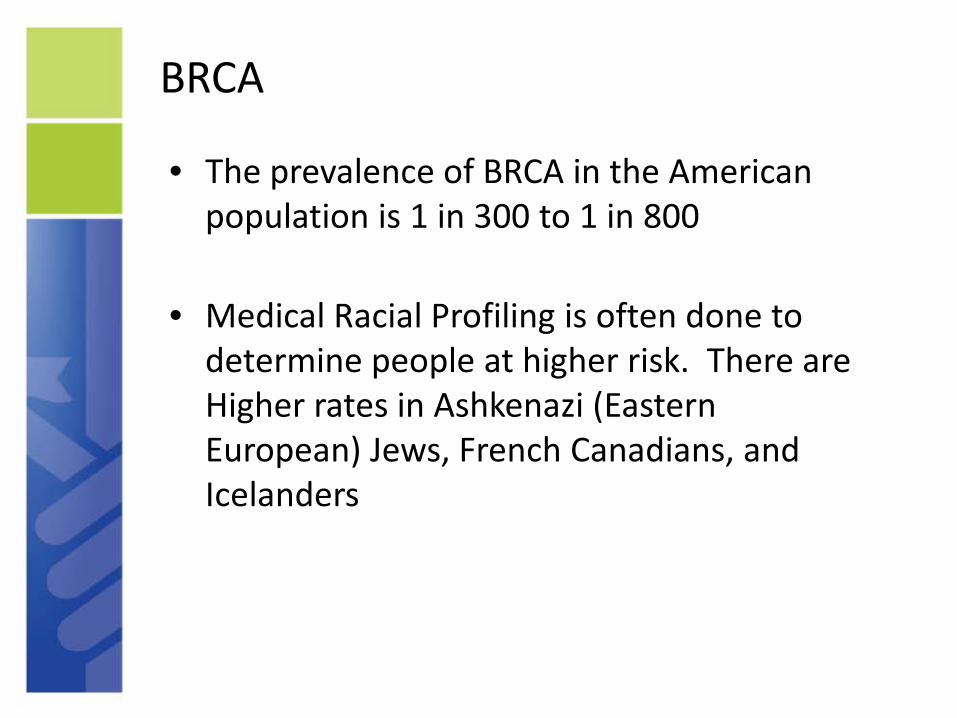
BRCA
• The prevalence of BRCA in the American population is 1 in 300 to 1 in 800
• Medical Racial Profiling is often done to determine people at higher risk. There are Higher rates in Ashkenazi (Eastern European) Jews, French Canadians, and Icelanders
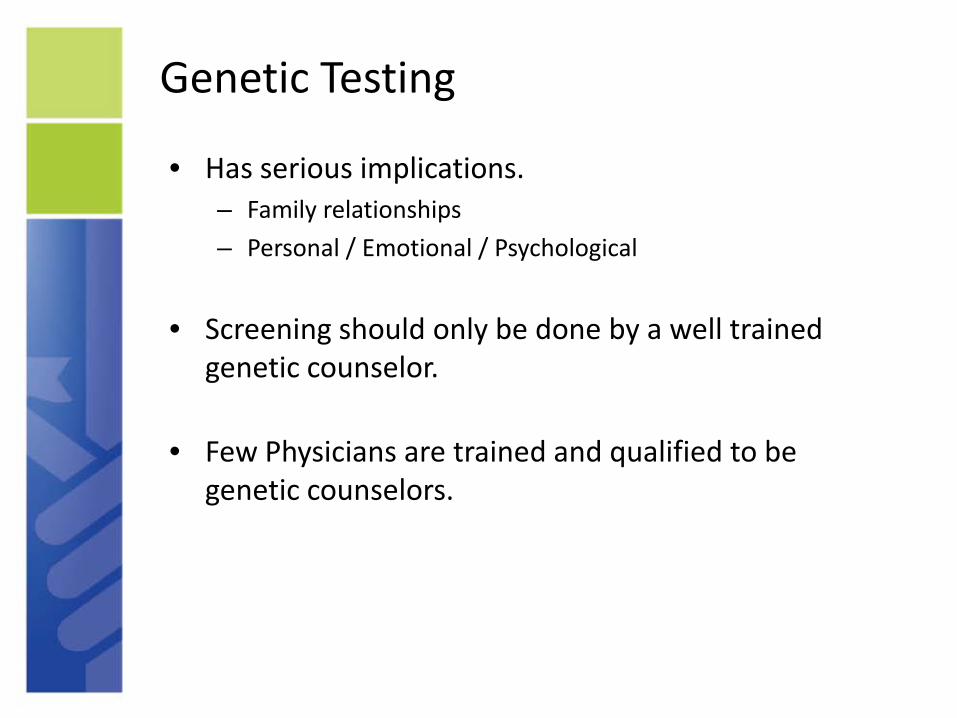
Genetic Testing
• Has serious implications. – Family relationships – Personal / Emotional / Psychological
• Screening should only be done by a well trained genetic counselor.
• Few Physicians are trained and qualified to be genetic counselors.
Principles of Screening (Advanced Epidemiology)

Proof of Screening Effectiveness
• Decreased mortality as seen in a prospective randomized trial
• Improvement in quality of life (difficult to establish)
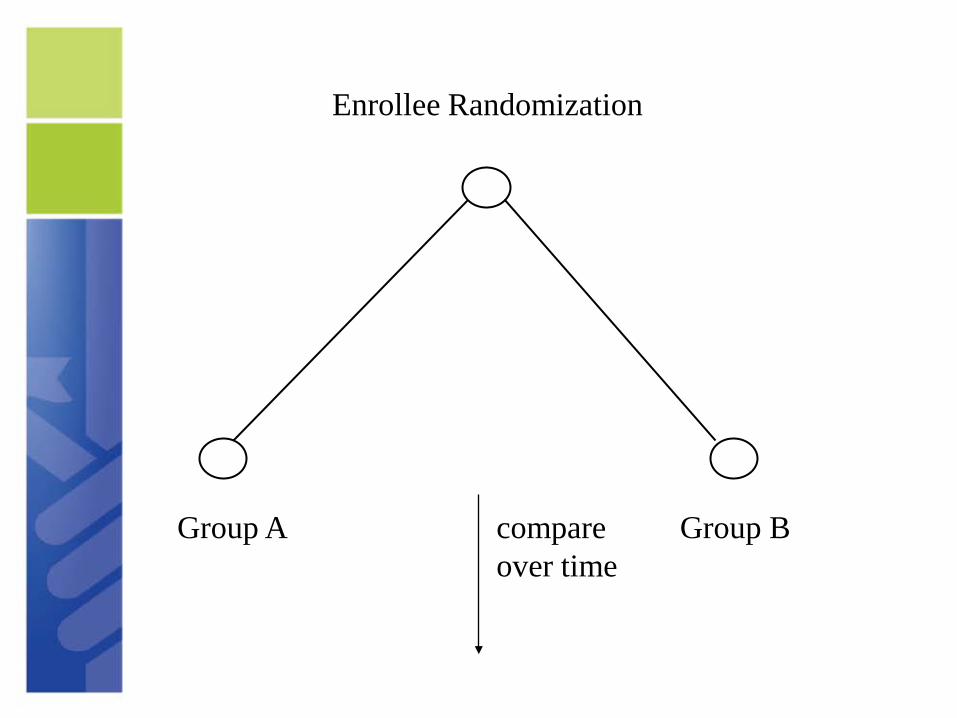
Enrollee Randomization
Group A compare Group B over time
Not Proof of Screening Effectiveness
• Finding cancer
• Finding cancer early
• Increasing five year survival rates
The Lessons of Lung Cancer Screening (1960 to 1980)
• Chest X-ray Screening: – Found cancer (increased incidence) – Found cancer early at more lower stage – increased survival

Enrollee Randomization
Group A compare Group B over time

Lead Time Bias
Diagnosis due to symptoms
Death due to Cancer
Diagnosis due to screening
Lead Time
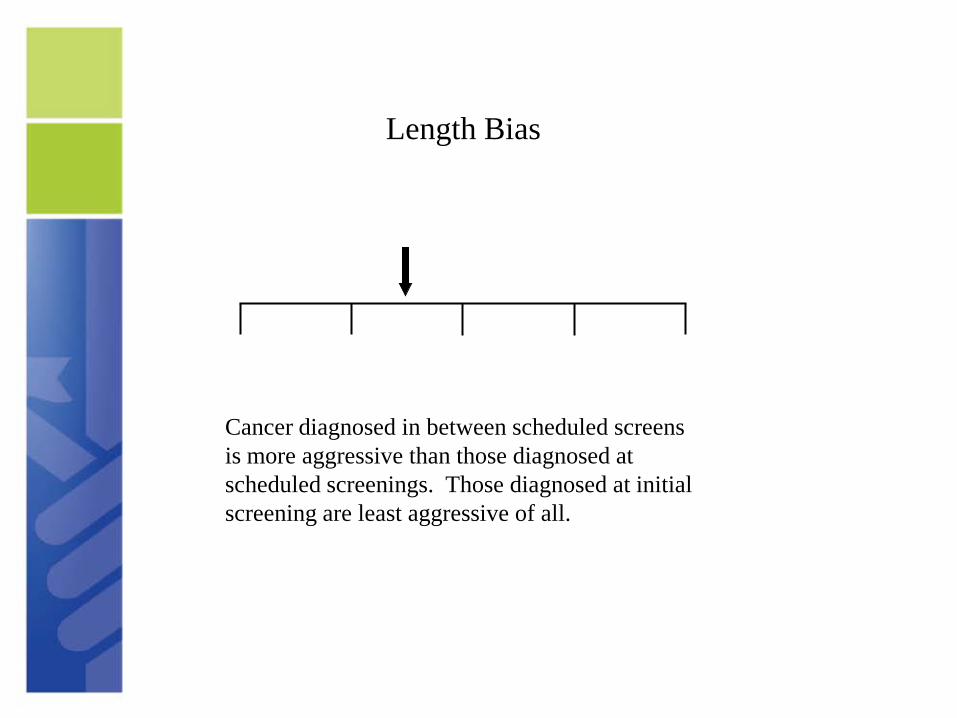
Length Bias
Cancer diagnosed in between scheduled screens is more aggressive than those diagnosed at scheduled screenings. Those diagnosed at initial screening are least aggressive of all.

Over-diagnosis A form of length bias
Cancer Diagnosed Develops Treated
Cured
Cancer Death from Never Diagnosed Develops other than Never Treated cancer
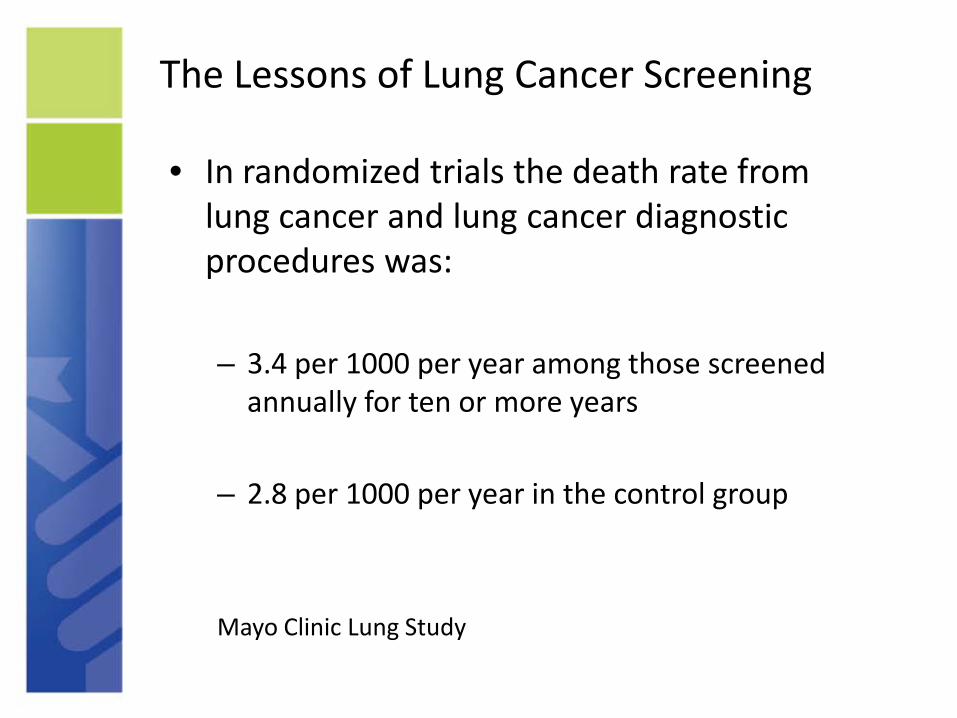
The Lessons of Lung Cancer Screening
• In randomized trials the death rate from lung cancer and lung cancer diagnostic procedures was:
– 3.4 per 1000 per year among those screened annually for ten or more years
– 2.8 per 1000 per year in the control group
Mayo Clinic Lung Study
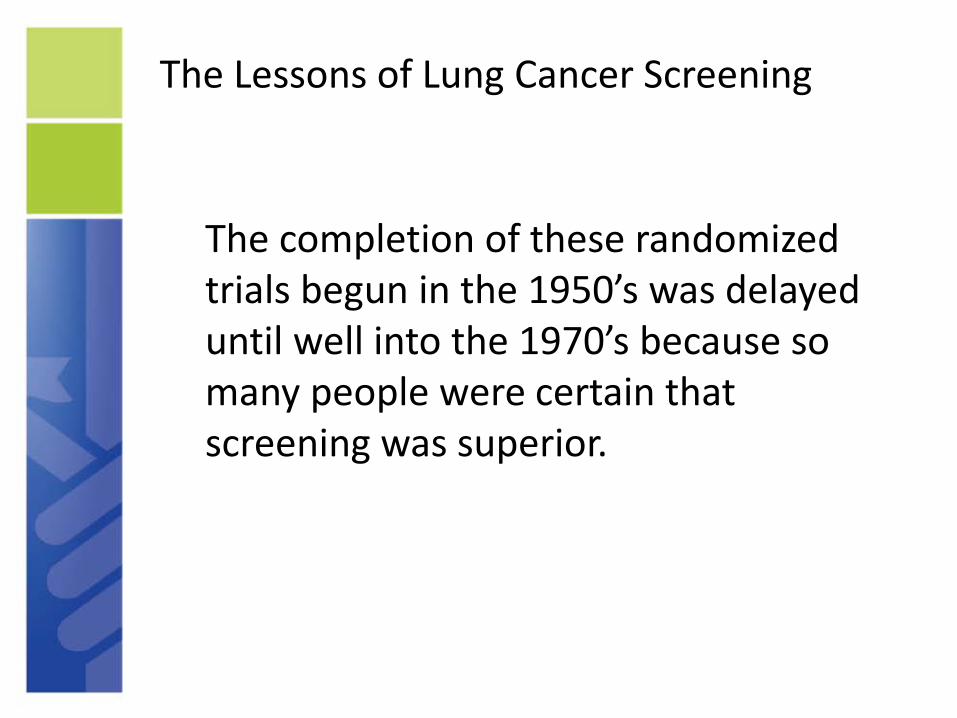
The Lessons of Lung Cancer Screening
The completion of these randomized trials begun in the 1950’s was delayed until well into the 1970’s because so many people were certain that screening was superior.
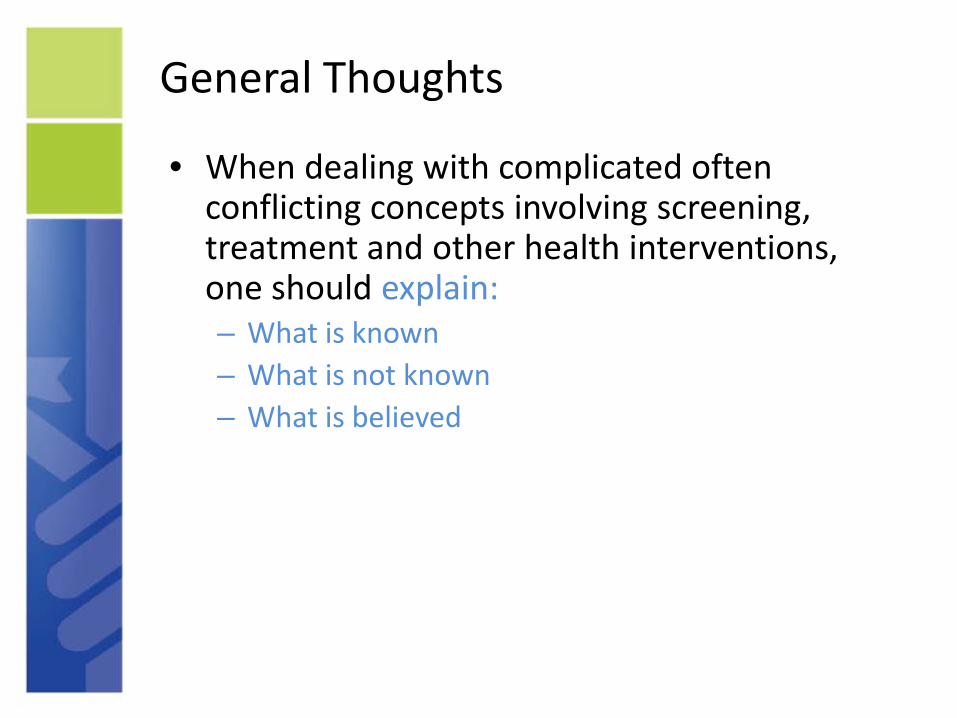
General Thoughts
• When dealing with complicated often conflicting concepts involving screening, treatment and other health interventions, one should explain: – What is known – What is not known – What is believed
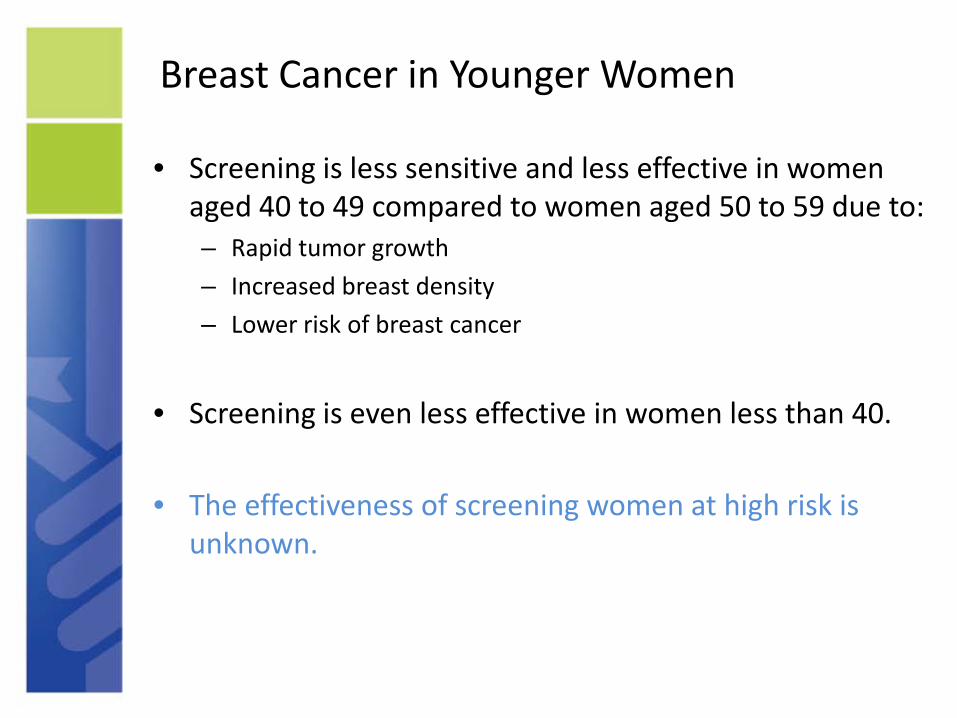
Breast Cancer in Younger Women
• Screening is less sensitive and less effective in women aged 40 to 49 compared to women aged 50 to 59 due to: – Rapid tumor growth – Increased breast density – Lower risk of breast cancer
• Screening is even less effective in women less than 40.
• The effectiveness of screening women at high risk is unknown.
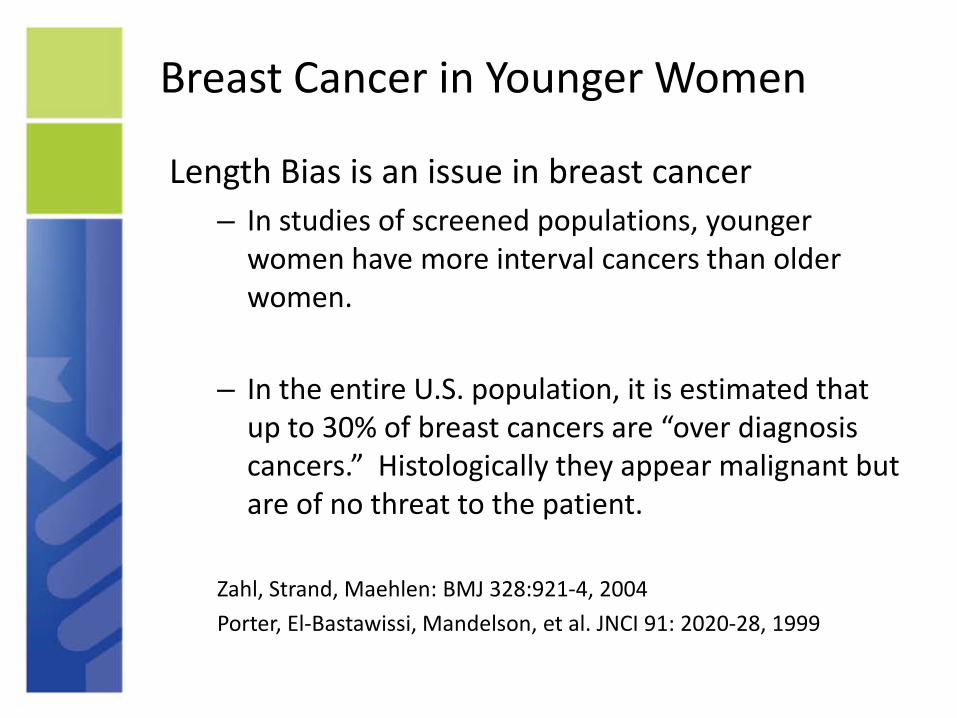
Breast Cancer in Younger Women
Length Bias is an issue in breast cancer – In studies of screened populations, younger
women have more interval cancers than older women.
– In the entire U.S. population, it is estimated that up to 30% of breast cancers are “over diagnosis cancers.” Histologically they appear malignant but are of no threat to the patient.
Zahl, Strand, Maehlen: BMJ 328:921-4, 2004 Porter, El-Bastawissi, Mandelson, et al. JNCI 91: 2020-28, 1999

Breast Cancer in Younger Women
• A fundamental problem in cancer screening is, it is less effective and less efficient in populations at lower risk.
• Younger women are at lower risk of breast cancer compared to older women.
Breast Cancer in Younger Women
• A fundamental problem in cancer screening is it is less effective and less efficient in people in very fast growing tumors.
• Younger women have a higher proportion of interval cancers (faster growing tumors) compared to older women.
Screening Trials
• There are eight prospective randomized breast cancer screening trials involving normal risk women over women age 40 using mammography and CBE.
• Most focus on women over 50.
• Each has its own design problems.
• All but one were completed before adjuvant therapy was proven effective and our technology has changed.
Screening Trials
• The collective interpretation is screening saves lives for women age 40 and above:
– Relative mortality risk reduction of 15% to 35%.
– Absolute mortality reduction is not as impressive.
Screening Trials
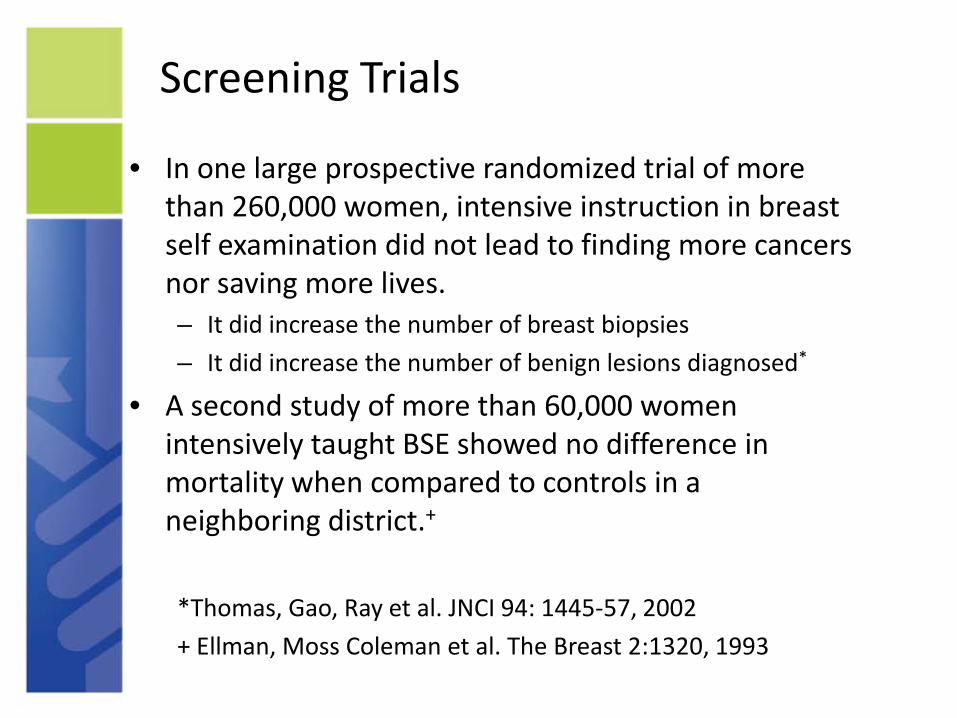
• In one large prospective randomized trial of more than 260,000 women, intensive instruction in breast self examination did not lead to finding more cancers nor saving more lives. – It did increase the number of breast biopsies – It did increase the number of benign lesions diagnosed*
• A second study of more than 60,000 women intensively taught BSE showed no difference in mortality when compared to controls in a neighboring district.+
*Thomas, Gao, Ray et al. JNCI 94: 1445-57, 2002 + Ellman, Moss Coleman et al. The Breast 2:1320, 1993
Guidelines
• Beware of Guidelines !!!!
– Some are a consensus of “experts” based on belief and opinion
– Some are a consensus of “experts” after a structured review of the published literature
• The literature is graded and weighted • Objective rules are used for accepting literature.
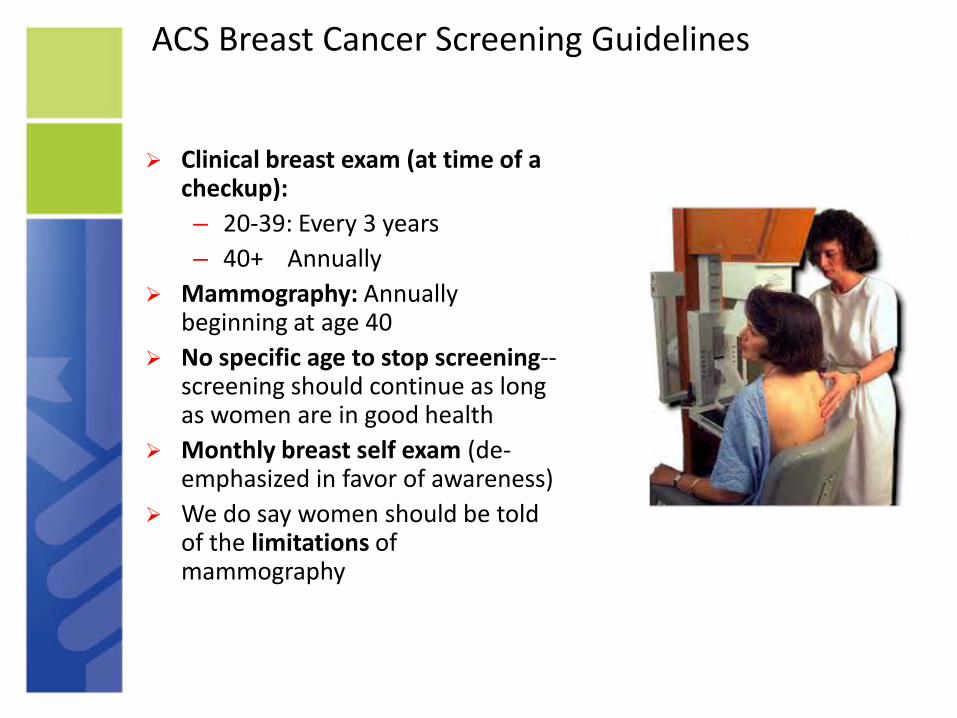
ACS Breast Cancer Screening Guidelines
Clinical breast exam (at time of a checkup): – 20-39: Every 3 years – 40+ Annually
Mammography: Annually beginning at age 40
No specific age to stop screening--screening should continue as long as women are in good health
Monthly breast self exam (de-emphasized in favor of awareness)
We do say women should be told of the limitations of mammography
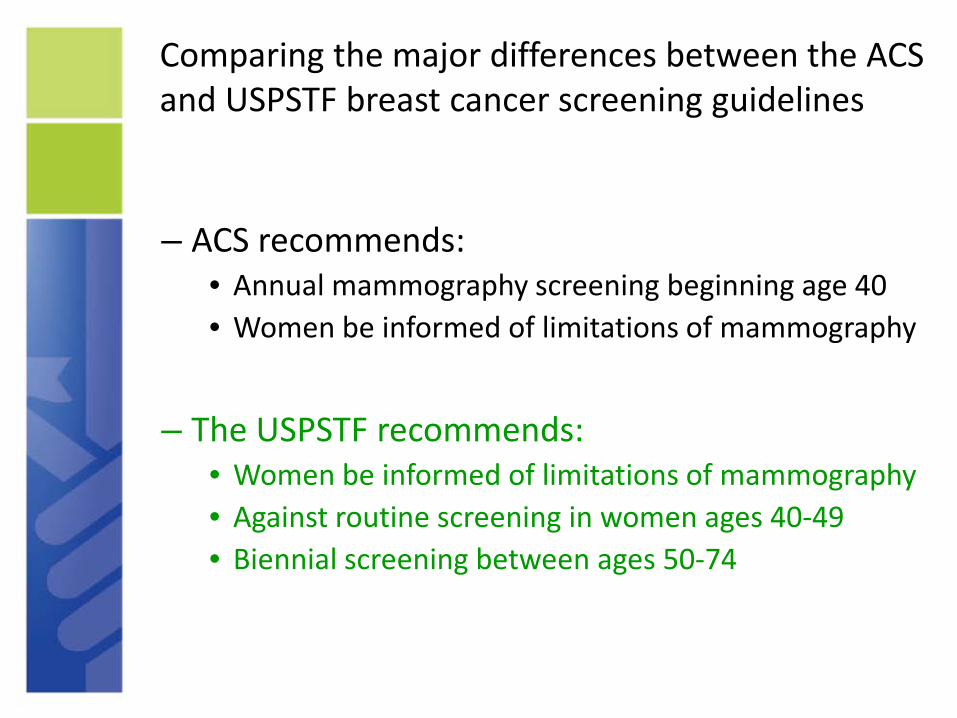
Comparing the major differences between the ACS and USPSTF breast cancer screening guidelines
– ACS recommends: • Annual mammography screening beginning age 40 • Women be informed of limitations of mammography
– The USPSTF recommends: • Women be informed of limitations of mammography • Against routine screening in women ages 40-49 • Biennial screening between ages 50-74

MRI Screening of the Breast
• Several organizations recommend MRI screening of women at high risk for breast cancer.
• Screening should start at age 25 according to American College of Ob/Gyn
• High risk is defined as a 20% or greater lifetime risk of breast cancer as determined by a computer program assessment.
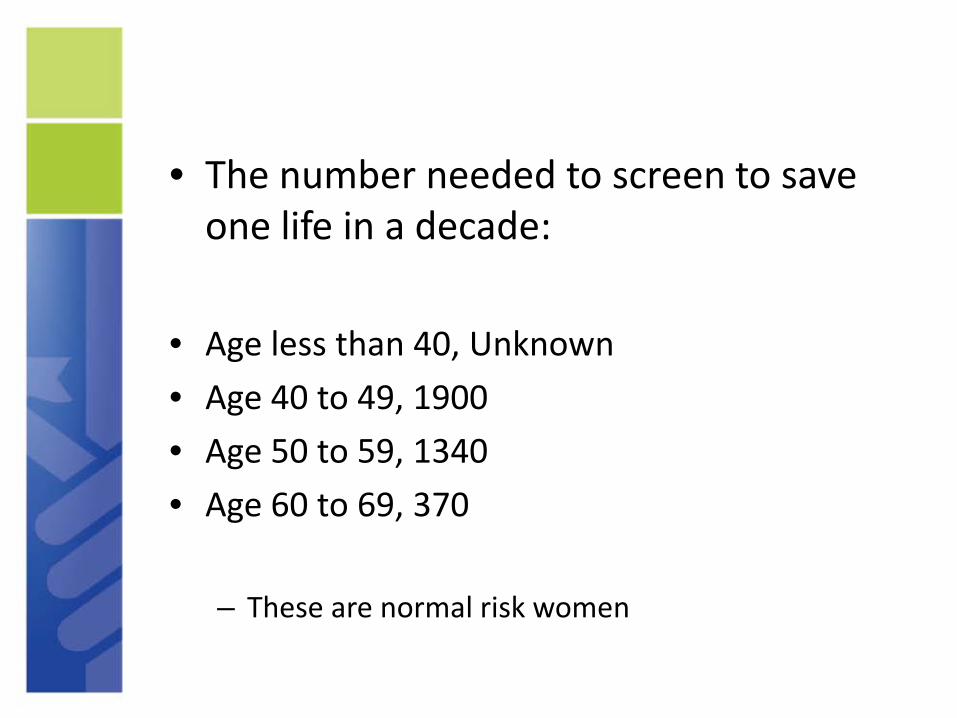
• The number needed to screen to save one life in a decade:
• Age less than 40, Unknown • Age 40 to 49, 1900
• Age 50 to 59, 1340
• Age 60 to 69, 370
– These are normal risk women
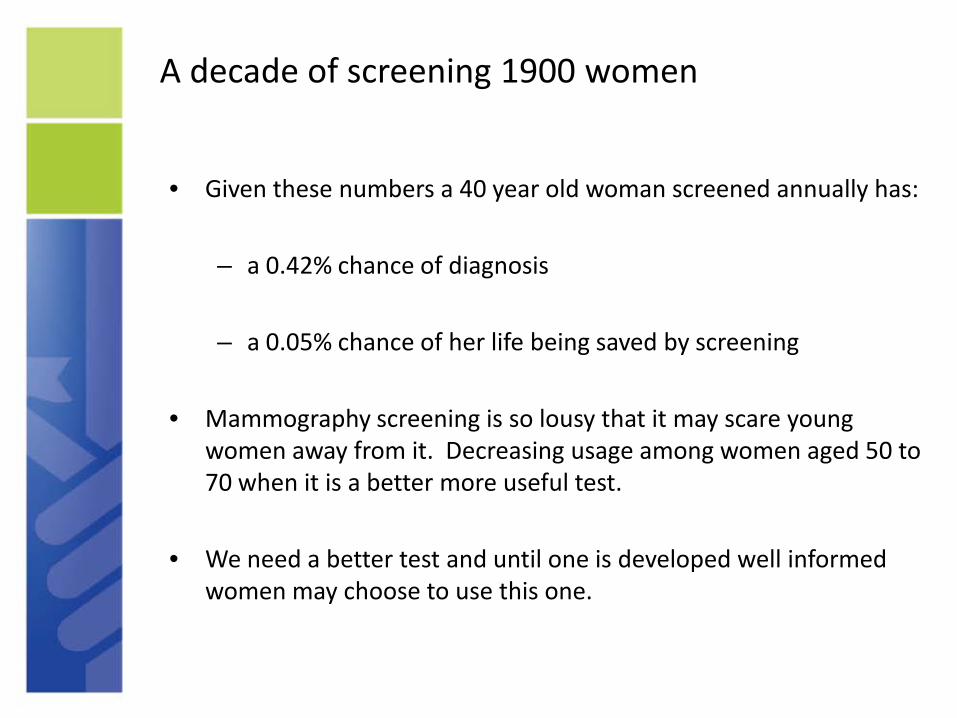
A decade of screening 1900 women
• Given these numbers a 40 year old woman screened annually has:
– a 0.42% chance of diagnosis
– a 0.05% chance of her life being saved by screening
• Mammography screening is so lousy that it may scare young women away from it. Decreasing usage among women aged 50 to 70 when it is a better more useful test.
• We need a better test and until one is developed well informed women may choose to use this one.
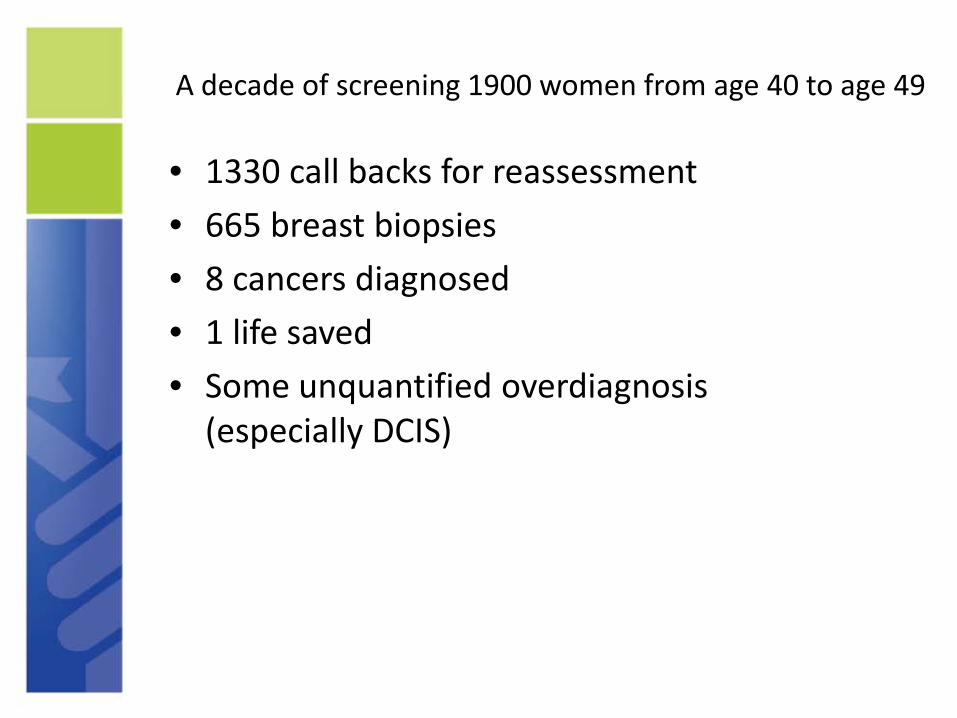
A decade of screening 1900 women from age 40 to age 49
• 1330 call backs for reassessment • 665 breast biopsies • 8 cancers diagnosed • 1 life saved • Some unquantified overdiagnosis
(especially DCIS)

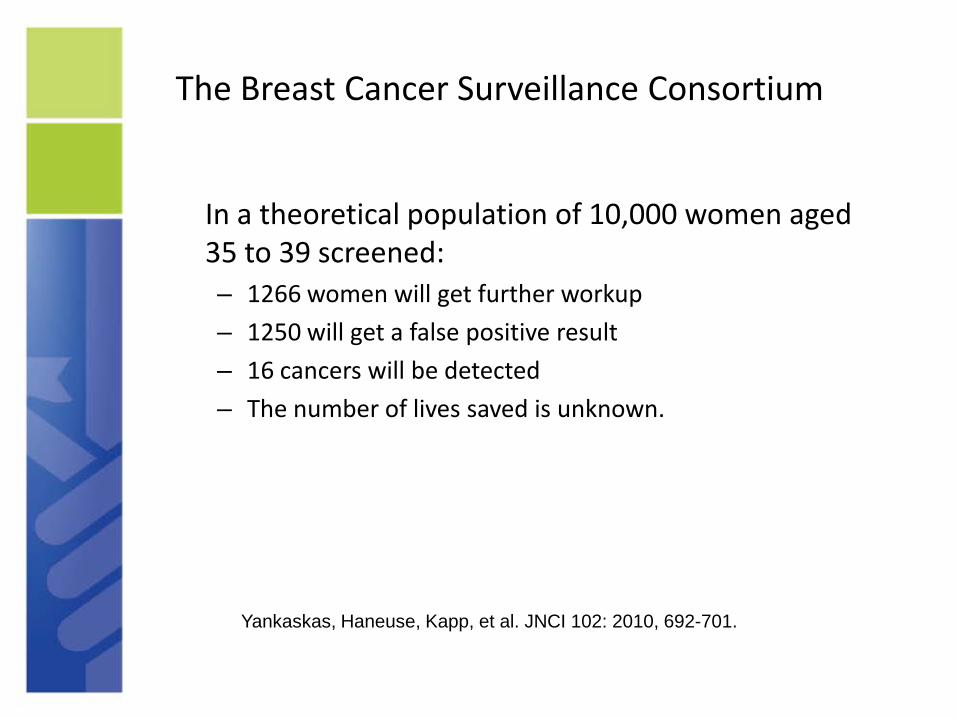
The Breast Cancer Surveillance Consortium
A screening study of 117,738 women age 18 to 39. Entry due to concern for breast cancer. Conducted from 1995 to 2005.
No woman aged 18 to 24 diagnosed with cancer
Of women age 35 to 39: -Recall rate 12.7% (95% CI 12.4 to 12.7) -Sensitivity 76.1% (95% CI 69.2 to 82.6) -Specificity 87.5% (95% CI 87.2 to 87.7) -Positive predictive value 1.3% (95% CI 1.1 to 1.5)
Cancer detection rate was 1.6 cancers per 1000 mammograms (95% CI 1.3 to 1.9)
Yankaskas, Haneuse, Kapp, et al. JNCI 102: 2010, 692-701.
The Breast Cancer Surveillance Consortium
In a theoretical population of 10,000 women aged 35 to 39 screened: – 1266 women will get further workup – 1250 will get a false positive result – 16 cancers will be detected – The number of lives saved is unknown.
Yankaskas, Haneuse, Kapp, et al. JNCI 102: 2010, 692-701.
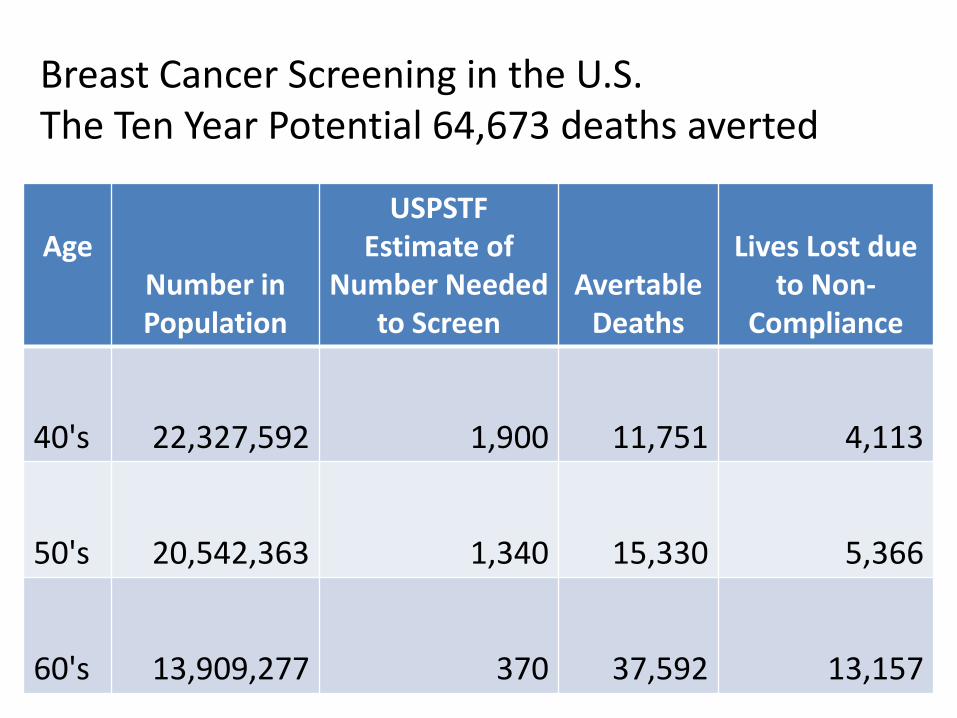
Breast Cancer Screening in the U.S. The Ten Year Potential 64,673 deaths averted
Age Number in Population
USPSTF Estimate of
Number Needed to Screen
Avertable Deaths
Lives Lost due to Non-
Compliance
40's 22,327,592 1,900 11,751 4,113
50's 20,542,363 1,340 15,330 5,366
60's 13,909,277 370 37,592 13,157
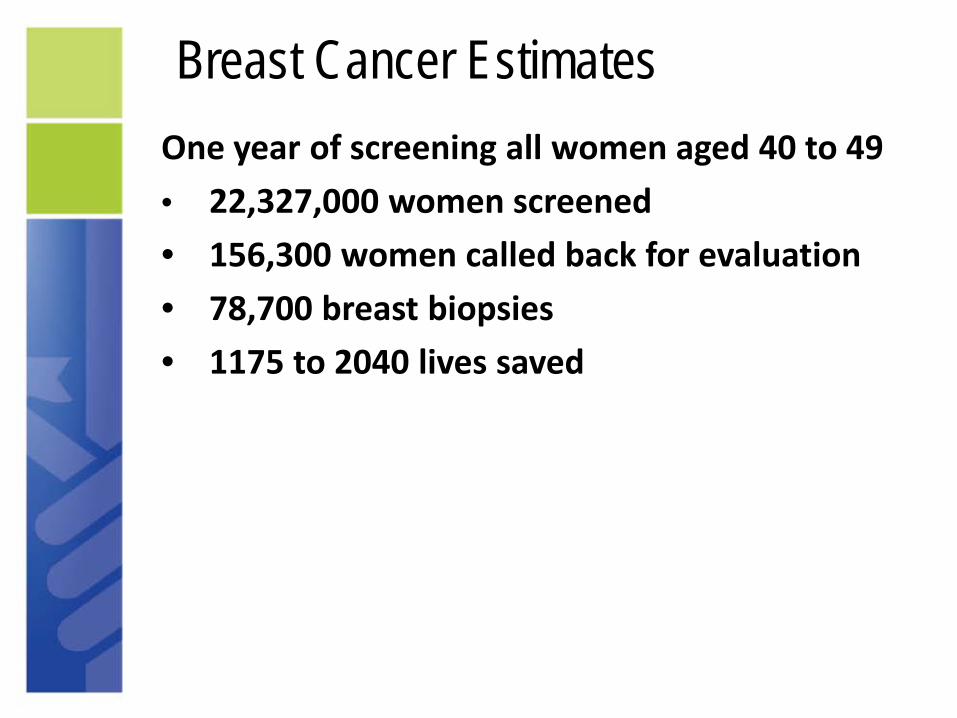
Breast Cancer Estimates One year of screening all women aged 40 to 49
• 22,327,000 women screened • 156,300 women called back for evaluation
• 78,700 breast biopsies • 1175 to 2040 lives saved

Principles of Health Education “The T1 line Concept”
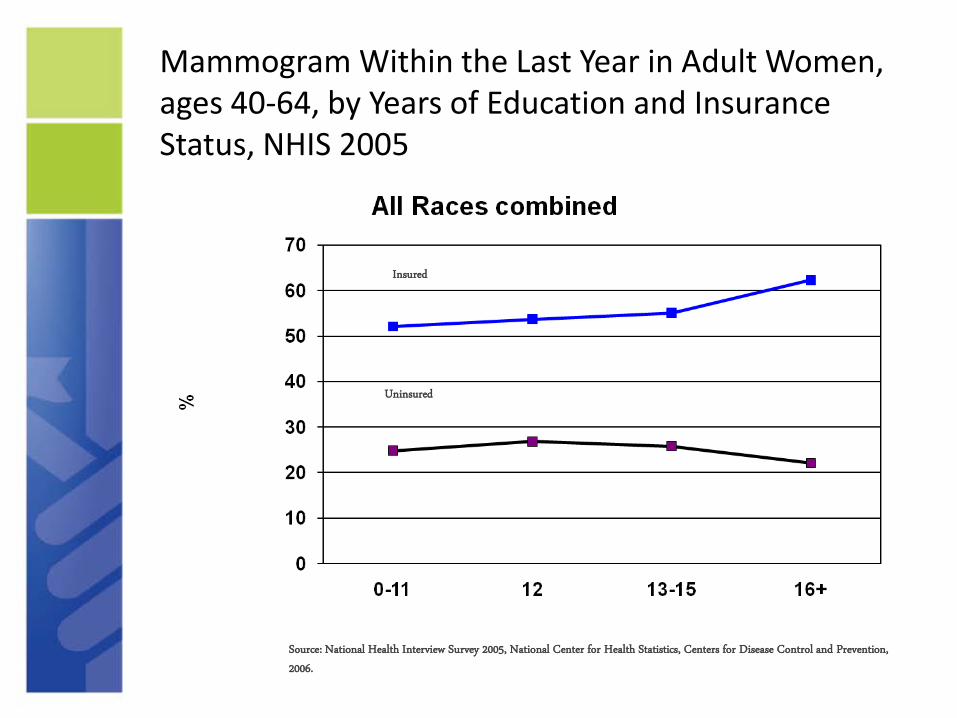
Mammogram Within the Last Year in Adult Women, ages 40-64, by Years of Education and Insurance Status, NHIS 2005
Insured
Uninsured
Source: National Health Interview Survey 2005, National Center for Health Statistics, Centers for Disease Control and Prevention,
2006.
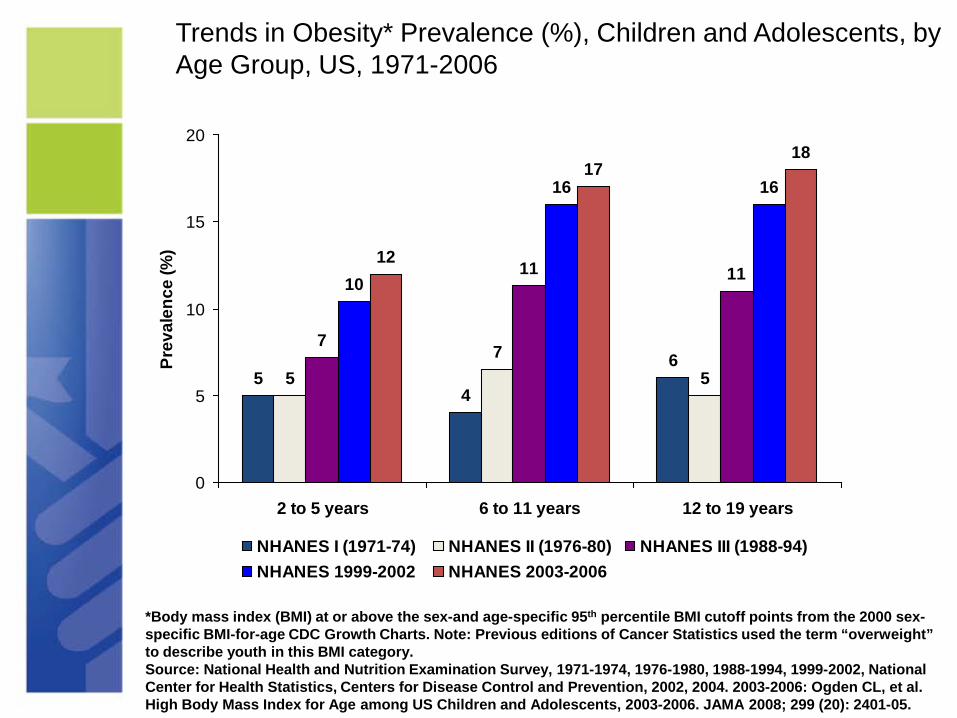
Trends in Obesity* Prevalence (%), Children and Adolescents, by Age Group, US, 1971-2006
Prev
alen
ce (%
)
20
15
10
5
0
5 4
6 5
7 5
7
11 1110
16 16
12
17 18
2 to 5 years 6 to 11 years 12 to 19 years
NHANES I (1971-74) NHANES II (1976-80) NHANES III (1988-94) NHANES 1999-2002 NHANES 2003-2006
*Body mass index (BMI) at or above the sex-and age-specific 95th percentile BMI cutoff points from the 2000 sex-specific BMI-for-age CDC Growth Charts. Note: Previous editions of Cancer Statistics used the term “overweight” to describe youth in this BMI category. Source: National Health and Nutrition Examination Survey, 1971-1974, 1976-1980, 1988-1994, 1999-2002, National Center for Health Statistics, Centers for Disease Control and Prevention, 2002, 2004. 2003-2006: Ogden CL, et al. High Body Mass Index for Age among US Children and Adolescents, 2003-2006. JAMA 2008; 299 (20): 2401-05.
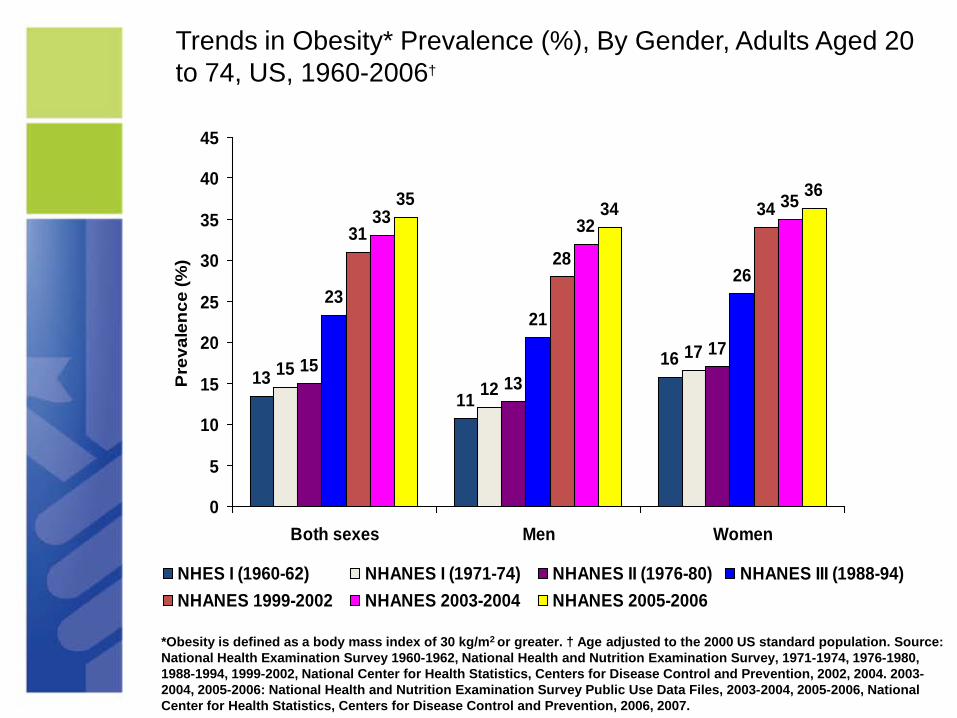
Trends in Obesity* Prevalence (%), By Gender, Adults Aged 20 to 74, US, 1960-2006†
13 11
1615 12
1715
13
17
23 21
26
31 28
3433 32 3535 34
36
0
5
10
15
20
25
30
35
40
45
Pre
vale
nce
(%)
Both sexes Men Women
NHES I (1960-62) NHANES I (1971-74) NHANES II (1976-80) NHANES III (1988-94) NHANES 1999-2002 NHANES 2003-2004 NHANES 2005-2006
*Obesity is defined as a body mass index of 30 kg/m2 or greater. † Age adjusted to the 2000 US standard population. Source: National Health Examination Survey 1960-1962, National Health and Nutrition Examination Survey, 1971-1974, 1976-1980, 1988-1994, 1999-2002, National Center for Health Statistics, Centers for Disease Control and Prevention, 2002, 2004. 20032004, 2005-2006: National Health and Nutrition Examination Survey Public Use Data Files, 2003-2004, 2005-2006, National Center for Health Statistics, Centers for Disease Control and Prevention, 2006, 2007.

Multivariate Analysis of Initial Breast Cancer Chemotherapy Dose < 85% of Standard N = 737
Odds Ratio 95% CI
Normal BMI 1.00
Overweight 1.18 0.74 to 1.87 P=.65
Obese 2.47 1.36 to 4.51 P=.003
Severely obese 4.04
Griggs et al, JCO v25, 2007
1.46 to 11.19 P=.007

Adjusted Breast Cancer Survival by Stages and Insurance Status, among Patients Diagnosed in 1999-2000 and Reported to the NCDB
Guiding Principles
• Cancer prevention and treatment is an issue that must be approached ethically, logically and rationally
• We must realize: – What we know. – What we do not know. – What we believe.
Breast Cancer Fact: It is estimated that 39,840 American women died of breast cancer in 2010.
•If beginning in 1995, all American women age 40 and over had received:
–good screening, –good evaluation and –good treatment
•It is estimated that more than 35,000 American women would have died of breast cancer in 2010.
Breast Cancer While this is a meeting devoted to breast cancer in younger women, we should not forget:
–One-third of women over 40 do not get screened. –Many of those who get screened get less than optimal quality care. –Conservatively this is 22,600 lives lost needlessly over a ten year period. 18,500 of those women are over fifty.
We need to provide better quality care to many and we need better tests for all!!!

Otis W. Brawley, M.D.
Chief Medical and Scientific Officer American Cancer Society
Professor of Hematology, Medical Oncology, Medicine and Epidemiology
Emory University


