Distribution and use of this document restricted under EDGAR Online, Inc. Terms of Use.
Table of Contents
Table of Contents
SECURITIES AND EXCHANGE COMMISSION Washington, D.C. 20549
FORM 10-Q (Mark One)
For the quarterly period ended March 31, 2010
OR
For the transition period from to
Commission file number 0-53713
OTTER TAIL CORPORATION (Exact name of registrant as specified in its charter)
866-410-8780 (Registrant’s telephone number, including area code)
(Former name, former address and former fiscal year, if changed since last report)
Indicate by check mark whether the registrant (1) has filed all reports required to be filed by Section 13 or 15(d) of the Securities Exchange Act of 1934 during the preceding 12 months (or for such shorter period that the registrant was required to file such reports), and (2) has been subject to such filing requirements for the past 90 days. YES � NO �
Indicate by check mark whether the registrant has submitted electronically and posted on its corporate Web site, if any, every Interactive Data File required to be submitted and posted pursuant to Rule 405 of Regulation S-T (§ 232.405 of this chapter) during the preceding 12 months (or for such shorter period that the registrant was required to submit and post such files). Yes � No �
Indicate by check mark whether the registrant is a large accelerated filer, an accelerated filer, a non-accelerated filer, or a smaller reporting company. See the definitions of “large accelerated filer,” “accelerated filer” and “smaller reporting company” in Rule 12b-2 of the Exchange Act. (Check one):
Indicate by check mark whether the registrant is a shell company (as defined by Rule 12b-2 of the Exchange Act). YES � NO �
Indicate the number of shares outstanding of each of the issuer’s classes of Common Stock, as of the latest practicable date:
April 30, 2010 — 35,932,089 Common Shares ($5 par value)
� QUARTERLY REPORT PURSUANT TO SECTION 13 OR 15(d) OF THE SECURITIES EXCHANGE ACT OF 1934
� TRANSITION REPORT PURSUANT TO SECTION 13 OR 15(d) OF THE SECURITIES EXCHANGE ACT OF 1934
Minnesota 27-0383995
(State or other jurisdiction of (I.R.S. Employer incorporation or organization) Identification No.)
215 South Cascade Street, Box 496, Fergus Falls, Minnesota 56538-0496
(Address of principal executive offices) (Zip Code)
Large accelerated filer � Accelerated filer � Non-accelerated filer � Smaller reporting company �
(Do not check if a smaller reporting company)
OTTER TAIL CORPORATION
INDEX
1
Page No. Part I. Financial Information Item 1. Financial Statements
Consolidated Balance Sheets — March 31, 2010 and December 31, 2009 (not audited) 2 & 3
Consolidated Statements of Income — Three Months Ended March 31, 2010 and 2009 (not audited) 4
Consolidated Statements of Cash Flows — Three Months Ended March 31, 2010 and 2009 (not audited) 5
Notes to Consolidated Financial Statements (not audited) 6-26 Item 2. Management’s Discussion and Analysis of Financial Condition and Results of Operations 27-40 Item 3. Quantitative and Qualitative Disclosures About Market Risk 41-42 Item 4. Controls and Procedures 42 Part II. Other Information Item 1. Legal Proceedings 43-44 Item 1A. Risk Factors 44 Item 2. Unregistered Sales of Equity Securities and Use of Proceeds 44 Item 6. Exhibits 44 Signatures 44 EX-31.1 EX-31.2 EX-32.1 EX-32.2
See accompanying notes to consolidated financial statements.
2
Item 1. Financial Statements
March 31, December 31, (in thousands) 2010 2009
ASSETS Current Assets
Cash and Cash Equivalents $ — $ 4,432 Accounts Receivable:
Trade—Net 117,485 95,747 Other 9,714 10,883
Inventories 96,839 86,515 Deferred Income Taxes 11,420 11,457 Accrued Utility and Cost-of-Energy Revenues 11,328 15,840 Costs and Estimated Earnings in Excess of Billings 82,792 61,835 Income Taxes Receivable 50,668 48,049 Other 25,253 15,265
Total Current Assets 405,499 350,023
Investments 10,274 9,889 Other Assets 26,865 26,098 Goodwill 106,778 106,778 Other Intangibles—Net 33,530 33,887 Deferred Debits
Unamortized Debt Expense and Reacquisition Premiums 10,065 10,676 Regulatory Assets and Other Deferred Debits 124,680 118,700
Total Deferred Debits 134,745 129,376
Plant
Electric Plant in Service 1,313,478 1,313,015 Nonelectric Operations 375,624 362,088
Total 1,689,102 1,675,103 Less Accumulated Depreciation and Amortization 617,000 599,839
Plant—Net of Accumulated Depreciation and Amortization 1,072,102 1,075,264 Construction Work in Progress 26,168 23,363
Deferred Income Taxes 162,949 155,306 Deferred Tax Credits 46,981 47,660 Regulatory Liabilities 64,681 64,274 Other 530 562
Total Deferred Credits 275,141 267,802
Capitalization
Long-Term Debt, Net of Current Maturities 436,078 436,170
Class B Stock Options of Subsidiary 1,220 1,220
Cumulative Preferred Shares Authorized 1,500,000 Shares Without Par Value; Outstanding 2010 and 2009 — 155,000 Shares 15,500 15,500
Cumulative Preference Shares — Authorized 1,000,000 Shares Without Par Value; Outstanding — None — —
Common Shares, Par Value $5 Per Share—Authorized, 50,000,000 Shares; Outstanding, 2010—
35,838,353 Shares; 2009—35,812,280 Shares 179,192 179,061 Premium on Common Shares 249,375 250,398 Retained Earnings 237,223 243,352 Accumulated Other Comprehensive Loss (683 ) (1,315 )
Total Common Equity 665,107 671,496
Total Capitalization 1,117,905 1,124,386
Total $ 1,815,961 $ 1,754,678
Table of Contents
Otter Tail Corporation Consolidated Statements of Income
(not audited)
See accompanying notes to consolidated financial statements.
4
Three Months Ended March 31, (in thousands, except share and per-share amounts) 2010 2009
Operating Revenues Electric $ 91,014 $ 88,479 Nonelectric 171,172 188,760
Total Operating Revenues 262,186 277,239 Operating Expenses
Production Fuel — Electric 20,909 18,659 Purchased Power — Electric System Use 12,056 17,373 Electric Operation and Maintenance Expenses 28,322 26,930 Cost of Goods Sold — Nonelectric (excludes depreciation; included below) 131,912 152,961 Other Nonelectric Expenses 30,771 30,634 Product Recall and Testing Costs — 1,766 Depreciation and Amortization 19,751 17,817 Property Taxes — Electric 2,474 2,490
Total Operating Expenses 246,195 268,630
Operating Income 15,991 8,609 Other Income 136 667 Interest Charges 9,030 6,270
Income Before Income Taxes 7,097 3,006 Income Tax Expense (Benefit) 2,380 (1,382 )
Net Income 4,717 4,388 Preferred Dividend Requirements 184 184
Earnings Available for Common Shares $ 4,533 $ 4,204
Average Number of Common Shares Outstanding—Basic 35,720,571 35,324,736 Average Number of Common Shares Outstanding—Diluted 35,939,759 35,488,640 Earnings Per Common Share:
Basic $ 0.13 $ 0.12 Diluted $ 0.13 $ 0.12
Dividends Per Common Share $ 0.2975 $ 0.2975
Table of Contents
Otter Tail Corporation Consolidated Statements of Cash Flows
(not audited)
See accompanying notes to consolidated financial statements.
5
Three Months Ended March 31, (in thousands) 2010 2009
Cash Flows from Operating Activities Net Income $ 4,717 $ 4,388 Adjustments to Reconcile Net Income to Net Cash (Used in) Provided by Operating Activities:
Depreciation and Amortization 19,751 17,817 Deferred Tax Credits (679 ) (538 ) Deferred Income Taxes 6,691 5,487 Change in Deferred Debits and Other Assets 27 569 Change in Noncurrent Liabilities and Deferred Credits 2,346 1,916 Allowance for Equity Funds Used During Construction — (91 ) Change in Derivatives Net of Regulatory Deferral (1,622 ) (809 ) Stock Compensation Expense — Equity Awards 610 837 Other—Net (52 ) 195
Cash (Used for) Provided by Current Assets and Current Liabilities: Change in Receivables (20,518 ) 18,482 Change in Inventories (10,038 ) 4,072 Change in Other Current Assets (23,550 ) 9,864 Change in Payables and Other Current Liabilities 1,171 (33,430 ) Change in Interest Payable and Income Taxes Receivable/Payable (1,594 ) (6,878 )
Net Cash (Used in) Provided by Operating Activities (22,740 ) 21,881
Cash Flows from Investing Activities Capital Expenditures (17,676 ) (26,756 ) Proceeds from Disposal of Noncurrent Assets 619 840 Net (Increase) in Other Investments (1,001 ) (2,834 )
Net Cash Used in Investing Activities (18,058 ) (28,750 )
Cash Flows from Financing Activities Change in Checks Written in Excess of Cash 3,251 — Net Short-Term Borrowings 102,914 14,149 Proceeds from Issuance of Common Stock 55 7 Common Stock Issuance Expenses (79 ) (17 ) Payments for Retirement of Common Stock (262 ) (160 ) Proceeds from Issuance of Long-Term Debt 95 1 Short-Term and Long-Term Debt Issuance Expenses (87 ) (71 ) Payments for Retirement of Long-Term Debt (58,350 ) (982 ) Dividends Paid and Other Distributions (10,938 ) (10,718 )
Net Cash Provided by Financing Activities 36,599 2,209
Effect of Foreign Exchange Rate Fluctuations on Cash (233 ) 207
Net Change in Cash and Cash Equivalents (4,432 ) (4,453 ) Cash and Cash Equivalents at Beginning of Period 4,432 7,565
Cash and Cash Equivalents at End of Period $ — $ 3,112
Table of Contents
OTTER TAIL CORPORATION
NOTES TO CONSOLIDATED FINANCIAL STATEMENTS (not audited)
In the opinion of management, Otter Tail Corporation (the Company) has included all adjustments (including normal recurring accruals) necessary for a fair presentation of the consolidated financial statements for the periods presented. The consolidated financial statements and notes thereto should be read in conjunction with the consolidated financial statements and notes as of and for the years ended December 31, 2009, 2008 and 2007 included in the Company’s Annual Report on Form 10-K for the fiscal year ended December 31, 2009. Because of seasonal and other factors, the earnings for the three months ended March 31, 2010 should not be taken as an indication of earnings for all or any part of the balance of the year.
The following notes are numbered to correspond to numbers of the notes included in the Company’s Annual Report on Form 10-K for the fiscal year ended December 31, 2009.
1. Summary of Significant Accounting Policies
Revenue Recognition Due to the diverse business operations of the Company, revenue recognition depends on the product produced and sold or service performed. The Company recognizes revenue when the earnings process is complete, evidenced by an agreement with the customer, there has been delivery and acceptance, and the price is fixed or determinable. In cases where significant obligations remain after delivery, revenue recognition is deferred until such obligations are fulfilled. Provisions for sales returns and warranty costs are recorded at the time of the sale based on historical information and current trends. In the case of derivative instruments, such as Otter Tail Power Company’s (OTP’s) forward energy contracts, marked-to-market and realized gains and losses are recognized on a net basis in revenue in accordance with Financial Accounting Standards Board (FASB) Accounting Standards Codification (ASC) 815-10-45-9. Gains and losses on forward energy contracts subject to regulatory treatment, if any, are deferred and recognized on a net basis in revenue in the period realized.
For the Company’s operating companies recognizing revenue on certain products when shipped, those operating companies have no further obligation to provide services related to such product. The shipping terms used in these instances are FOB shipping point.
Some of the operating businesses enter into fixed-price construction contracts. Revenues under these contracts are recognized on a percentage-of-completion basis. The Company’s consolidated revenues recorded under the percentage-of-completion method were 23.9% for the three months ended March 31, 2010 and 29.2% for the three months ended March 31, 2009. The method used to determine the progress of completion is based on the ratio of labor costs incurred to total estimated labor costs at the Company’s wind tower manufacturer and costs incurred to total estimated costs on all other construction projects. If a loss is indicated at any point in time during a contract, a projected loss for the entire contract is estimated and recognized.
The following table summarizes costs incurred and billings and estimated earnings recognized on uncompleted contracts:
6
March 31, December 31, (in thousands) 2010 2009
Costs Incurred on Uncompleted Contracts $ 328,954 $ 400,577 Less Billings to Date (295,379 ) (400,711 ) Plus Estimated Earnings Recognized 42,885 59,202
$ 76,460 $ 59,068
Table of Contents
The following amounts are included in the Company’s consolidated balance sheets. Billings in excess of costs and estimated earnings on uncompleted contracts are included in Accounts Payable:
Costs and Estimated Earnings in Excess of Billings at DMI Industries, Inc. (DMI), the Company’s wind tower manufacturer, were $75,740,000 as of March 31, 2010 and $54,977,000 as of December 31, 2009. This amount is related to costs incurred on wind towers in the process of completion on major contracts under which the customer is not billed until towers are completed and ready for shipment.
Retainage Accounts Receivable include amounts billed by the Company’s subsidiaries under contracts that have been retained by customers pending project completion of $7,846,000 on March 31, 2010 and $9,215,000 on December 31, 2009.
Sales of Receivables DMI has a three-year, $40 million receivables purchase agreement whereby designated customer accounts receivable may be sold to General Electric Capital Corporation on a revolving basis. The agreement expires in March 2011. Accounts receivable sold totaled $10,800,000 in the first three months of 2010 compared with $38,800,000 in the first three months of 2009. Discounts, fees and commissions charged to operating expenses in the consolidated statements of income were $32,000 in the first three months of 2010 compared with $175,000 in the first three months of 2009. In compliance with guidance under ASC 860-20, Sales of Financial Assets , sales of accounts receivable are reflected as a reduction of accounts receivable in the consolidated balance sheets and the proceeds are included in the cash flows from operating activities in the consolidated statements of cash flows.
Marketing and Sales Incentive Costs ShoreMaster, Inc. (ShoreMaster), the Company’s waterfront equipment manufacturer, provides dealer floor plan financing assistance for certain dealer purchases of ShoreMaster products for certain set time periods based on the timing and size of a dealer’s order. ShoreMaster recognizes the estimated cost of projected interest payments related to each financed sale as a liability and a reduction of revenue, at the time of sale, based on historical experience of the average length of time floor plan debt is outstanding, in accordance with guidance under ASC 605-50, Customer Payments and Incentives . The liability is reduced when interest is paid. To the extent current experience differs from previous estimates the accrued liability for financing assistance costs is adjusted accordingly. Financing assistance costs charged to revenue for the three month periods ended March 31, 2010 and 2009 were $60,000 and $145,000, respectively.
Supplemental Disclosures of Cash Flow Information
Fair Value Measurements The Company applies authoritative accounting guidance under ASC 820 which provides a single definition of fair value and requires enhanced disclosures about assets and liabilities measured at fair value. ASC 820-10-35 establishes a hierarchal framework for disclosing the observability of the inputs utilized in measuring assets and liabilities at fair value. The three levels defined by the hierarchy and examples of each level follow:
Level 1 — Quoted prices are available in active markets for identical assets or liabilities as of the reported date. The types of assets and liabilities included in Level 1 are highly liquid and actively traded instruments with quoted prices, such as equities listed by the New York Stock Exchange and commodity derivative contracts listed on the New York Mercantile Exchange.
7
March 31, December 31, (in thousands) 2010 2009
Costs and Estimated Earnings in Excess of Billings on Uncompleted Contracts $ 82,792 $ 61,835 Billings in Excess of Costs and Estimated Earnings on Uncompleted Contracts (6,332 ) (2,767 )
$ 76,460 $ 59,068
Three Months Ended March 31, (in thousands) 2010 2009
Decreases in Accounts Payable Related to Capital Expenditures $ (62 ) $ (2,191 )
Table of Contents
Level 2 — Pricing inputs are other than quoted prices in active markets, but are either directly or indirectly observable as of the reported date. The types of assets and liabilities included in Level 2 are typically either comparable to actively traded securities or contracts, such as treasury securities with pricing interpolated from recent trades of similar securities, or priced with models using highly observable inputs, such as commodity options priced using observable forward prices and volatilities.
Level 3 — Significant inputs to pricing have little or no observability as of the reporting date. The types of assets and liabilities included in Level 3 are those with inputs requiring significant management judgment or estimation and may include complex and subjective models and forecasts.
The following table presents, for each of these hierarchy levels, the Company’s assets and liabilities that are measured at fair value on a recurring basis as of March 31, 2010 and December 31, 2009:
Inventories Inventories consist of the following:
8
March 31, 2010 (in thousands) Level 1 Level 2 Level 3
Assets: Investments for Nonqualified Retirement Savings Retirement Plan:
Money Market and Mutual Funds and Cash $ 1,614 $ — Forward Energy Contracts 11,200 Investments of Captive Insurance Company:
Corporate Debt Securities 8,358 U.S. Government Debt Securities 251
Total Assets $ 10,223 $ 11,200
Liabilities: Forward Energy Contracts $ — $ 21,573
Total Liabilities $ — $ 21,573
December 31, 2009 (in thousands) Level 1 Level 2 Level 3
Assets: Investments for Nonqualified Retirement Savings Retirement Plan:
Money Market and Mutual Funds and Cash $ 731 $ — Forward Energy Contracts 8,321 Investments of Captive Insurance Company:
Corporate Debt Securities 7,795 U.S. Government Debt Securities 253
Total Assets $ 8,779 $ 8,321
Liabilities: Forward Energy Contracts $ — $ 14,681
Total Liabilities $ — $ 14,681
March 31, December 31, (in thousands) 2010 2009
Finished Goods $ 46,896 $ 42,784 Work in Process 6,229 3,824 Raw Material, Fuel and Supplies 43,714 39,907
Total Inventories $ 96,839 $ 86,515
Table of Contents
Other Intangible Assets The following table summarizes the components of the Company’s intangible assets at March 31, 2010 and December 31, 2009:
The amortization expense for these intangible assets was $383,000 for the three months ended March 31, 2010 compared with $417,000 for the three months ended March 31, 2009. The estimated annual amortization expense for these intangible assets for the next five years is $1,444,000 for 2010, $1,332,000 for 2011, $1,312,000 for 2012, $1,308,000 for 2013 and $1,308,000 for 2014.
Comprehensive Income
New Accounting Standards
Consolidation of Variable Interest Entities —In June 2009, the FASB issued new guidance on consolidation of variable interest entities. The guidance affects various elements of consolidation, including the determination of whether an entity is a variable interest entity and whether an enterprise is a variable interest entity’s primary beneficiary. These updates to the ASC are effective for interim and annual periods beginning after November 15, 2009. The Company implemented the guidance on January 1, 2010 and the implementation did not have a material impact on its consolidated financial statements.
9
Gross Carrying Accumulated Net Carrying Amortization March 31, 2010 (in thousands) Amount Amortization Amount Periods
Amortized Intangible Assets: Covenants Not to Compete $ 1,854 $ 1,747 $ 107 3 — 5 years Customer Relationships 26,982 4,013 22,969 15 — 25 years Other Intangible Assets Including Contracts 2,319 1,752 567 5 — 30 years
Three Months Ended March 31, (in thousands) 2010 2009
Net Income $ 4,717 $ 4,388 Other Comprehensive Income (Loss) (net-of-tax):
Foreign Currency Translation Gain (Loss) 488 (424 ) Amortization of Unrecognized Losses and Costs Related to Postretirement Benefit Programs 105 15 Unrealized Gain (Loss) on Available-for-Sale Securities 39 (55 )
Total Other Comprehensive Income (Loss) 632 (464 )
Total Comprehensive Income $ 5,349 $ 3,924
Table of Contents
Accounting Standards Update (ASU) No. 2010-06 Fair Value Measurements and Disclosures (Topic 820)—Improving Disclosures about Fair Value Measurements, issued by the FASB in January 2010, updates the ASC to require new disclosures for assets and liabilities measured at fair value. The requirements include expanded disclosure of valuation methodologies for fair value measurements, transfers between levels of the fair value hierarchy, and gross rather than net presentation of certain changes in Level 3 fair value measurements. The updates to the ASC contained in ASU No. 2010-06 were effective for interim and annual periods beginning after December 15, 2009, except for requirements related to gross presentation of certain changes in Level 3 fair value measurements, which are effective for interim and annual periods beginning after December 15, 2010. The implementation of applicable guidance from ASU No. 2010-06 on January 1, 2010 did not have a material impact on the Company’s consolidated financial statements, but did require additional fair value disclosures in footnotes to interim financial statements, similar to disclosures required with year-end financial statements.
2. Segment Information
The Company’s businesses have been classified into six segments based on products and services and reach customers in all 50 states and international markets. The six segments are: Electric, Plastics, Manufacturing, Health Services, Food Ingredient Processing and Other Business Operations.
Electric includes the production, transmission, distribution and sale of electric energy in Minnesota, North Dakota and South Dakota by the Company’s subsidiary, OTP. In addition, OTP is an active wholesale participant in the Midwest Independent Transmission System Operator (MISO) markets. OTP’s operations have been the Company’s primary business since 1907.
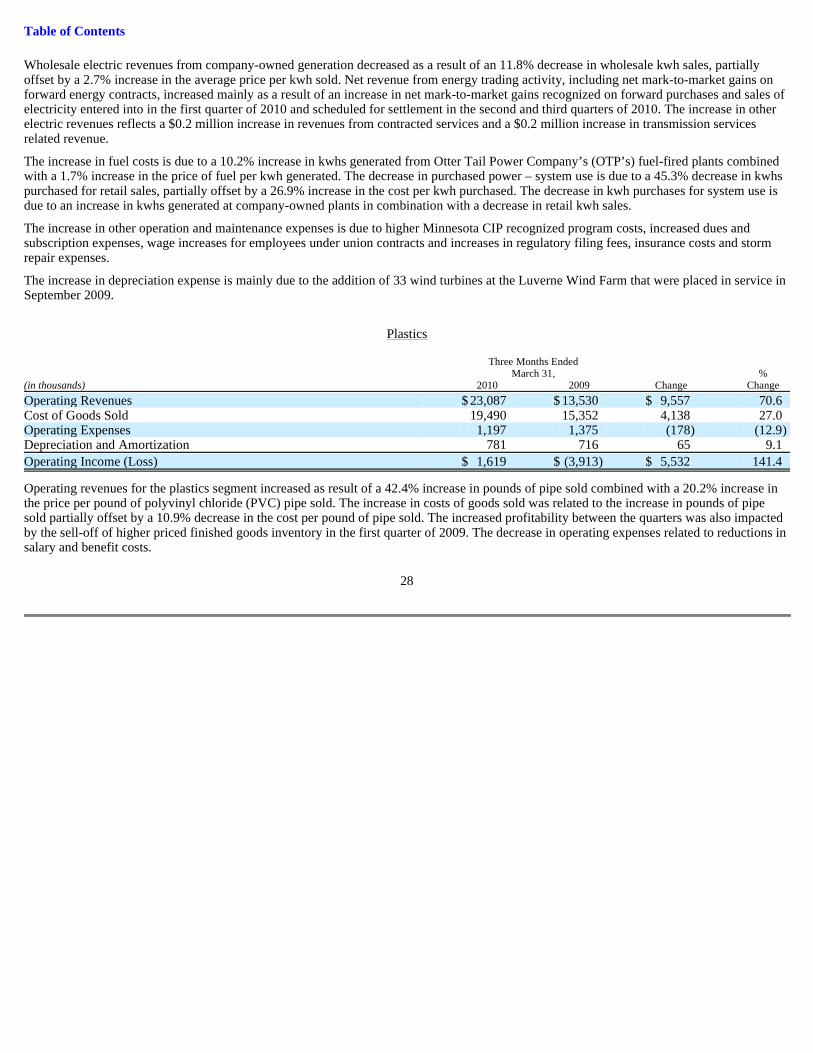
Plastics consists of businesses producing polyvinyl chloride (PVC) pipe in the Upper Midwest and Southwest regions of the United States.
Manufacturing consists of businesses in the following manufacturing activities: production of wind towers, contract machining, metal parts stamping and fabrication, and production of waterfront equipment, material and handling trays and horticultural containers. These businesses have manufacturing facilities in Florida, Illinois, Minnesota, Missouri, North Dakota, Oklahoma and Ontario, Canada and sell products primarily in the United States.
Health Services consists of businesses involved in the sale of diagnostic medical equipment, patient monitoring equipment and related supplies and accessories. These businesses also provide equipment maintenance, diagnostic imaging services and rental of diagnostic medical imaging equipment to various medical institutions located throughout the United States.
Food Ingredient Processing consists of Idaho Pacific Holdings, Inc. (IPH), which owns and operates potato dehydration plants in Ririe, Idaho; Center, Colorado; and Souris, Prince Edward Island, Canada. IPH produces dehydrated potato products that are sold in the United States, Canada and other countries.
Other Business Operations consists of businesses in residential, commercial and industrial electric contracting industries, fiber optic and electric distribution systems, water, wastewater and HVAC systems construction, transportation and energy services. These businesses operate primarily in the Central United States, except for the transportation company which operates in 48 states and four Canadian provinces.
The Company’s electric operations, including wholesale power sales, are operated by its wholly owned subsidiary, OTP, and its energy services operation is operated by a separate wholly owned subsidiary of the Company. All of the Company’s other businesses are owned by its wholly owned subsidiary, Varistar Corporation (Varistar).
Corporate includes items such as corporate staff and overhead costs, the results of the Company’s captive insurance company and other items excluded from the measurement of operating segment performance. Corporate assets consist primarily of cash, prepaid expenses, investments and fixed assets. Corporate is not an operating segment. Rather, it is added to operating segment totals to reconcile to totals on the Company’s consolidated financial statements.
The Company has one customer within the manufacturing segment that accounted for 13.6% of the Company’s consolidated revenues in 2009. No other single external customer accounts for 10% or more of the Company’s consolidated revenues. Substantially all of the Company’s long-lived assets are within the United States except for a food ingredient processing dehydration plant in Souris, Prince Edward Island, Canada and a wind tower manufacturing plant in Fort Erie, Ontario, Canada.
10
Table of Contents
The following table presents the percent of consolidated sales revenue by country:
The Company evaluates the performance of its business segments and allocates resources to them based on earnings contribution and return on total invested capital. Information for the business segments for three month periods ended March 31, 2010 and 2009 and total assets by business segment as of March 31, 2010 and December 31, 2009 are presented in the following tables:
Operating Revenue
Interest Expense
Income Taxes
11
Three Months Ended March 31, 2010 2009
United States of America 96.5 % 98.4 % Canada 2.6 % 0.7 % All Other Countries (none greater than 1%) 0.9 % 0.9 %
Three Months Ended March 31, (in thousands) 2010 2009
Electric $ 91,086 $ 88,541 Plastics 23,087 13,530 Manufacturing 78,578 96,019 Health Services 25,171 28,167 Food Ingredient Processing 18,915 20,086 Other Business Operations 26,302 31,895 Corporate Revenues and Intersegment Eliminations (953 ) (999 )
Total $ 262,186 $ 277,239
Three Months Ended March 31, (in thousands) 2010 2009
Electric $ 5,254 $ 4,011 Plastics 363 200 Manufacturing 2,466 1,279 Health Services 245 96 Food Ingredient Processing 37 10 Other Business Operations 236 120 Corporate and Intersegment Eliminations 429 554
Total $ 9,030 $ 6,270
Three Months Ended March 31, (in thousands) 2010 2009
Electric $ 4,898 $ 1,771 Plastics 494 (1,647 ) Manufacturing (265 ) (804 ) Health Services (432 ) (13 ) Food Ingredient Processing 727 725 Other Business Operations (1,426 ) (206 ) Corporate (1,616 ) (1,208 )
Total $ 2,380 $ (1,382 )
Table of Contents
Earnings Available for Common Shares
Total Assets
3. Rate and Regulatory Matters
Minnesota
General Rate Case —In an order issued by the Minnesota Public Utilities Commission (MPUC) on August 1, 2008 OTP was granted an increase in Minnesota retail electric rates of $3.8 million, or approximately 2.9%, which went into effect in February 2009. The MPUC approved a rate of return on equity of 10.43% on a capital structure with 50.0% equity. An interim rate increase of 5.4% was in effect from November 30, 2007 through January 31, 2009. Amounts refundable totaling $3.9 million had been recorded as a liability on the Company’s consolidated balance sheet as of December 31, 2008. An additional $0.5 million refund liability was accrued in January 2009. OTP refunded Minnesota customers the difference between interim and final rates, with interest, in March 2009. In June 2008, OTP deferred recognition of $1.5 million in rate case-related regulatory assessments and fees of outside experts and attorneys that are subject to amortization and recovery over a three-year period beginning in February 2009.
Capacity Expansion 2020 (CapX 2020) Mega Certificate of Need (CON) —On August 16, 2007 the eleven CapX 2020 utilities asked the MPUC to determine the need for three 345-kilovolt (kV) transmission lines. Evidentiary hearings for the CON for the three CapX 2020 345-kV transmission line projects began in July 2008 and continued into August 2008. On April 16, 2009 the MPUC approved the CON for the three 345-kV Group 1 CapX 2020 line projects (Fargo-St. Cloud, Brookings-Southeast Twin Cities, and Twin Cities-LaCrosse). The MPUC then voted to impose conditions pertaining to reserving line capacity for renewable energy sources on the Brookings line project. The MPUC reconsidered the original order regarding the conditions. The MPUC slightly modified the conditions on the Brookings line. As part of the CON approval, the MPUC accepted a CapX 2020 request to build the 345-kV lines for double-circuit capability to have two 345-kV transmission circuits on each structure. The current plan is to string only one circuit. The MPUC CON orders were appealed to the Minnesota Court of Appeals on October 9, 2009 and the appellate court’s determination is expected to be made in the fall of 2010. Route permit applications were filed in Minnesota for the Brookings project in late December 2008. The route permit for the Monticello to St. Cloud portion of the Fargo project was filed in April 2009 and is anticipated to be received in mid-2010. The Minnesota route permit for the St. Cloud to Fargo portion of the Fargo Project was filed on October 1, 2009. Portions of the projects would also require approvals by federal officials and by regulators in North Dakota, South Dakota and Wisconsin. After regulatory need is established and routing decisions are completed, construction will begin. The lines would be expected to be completed over a period of two to four years. Great River Energy and Xcel Energy are leading these projects, and OTP and eight other utilities are involved in permitting, building and financing. OTP is directly involved in two of these three 345-kV projects.
12
Three Months Ended March 31, (in thousands) 2010 2009
Electric $ 7,621 $ 8,342 Plastics 781 (2,458 ) Manufacturing (157 ) (1,090 ) Health Services (691 ) (73 ) Food Ingredient Processing 1,404 1,447 Other Business Operations (2,164 ) (325 ) Corporate (2,261 ) (1,639 )
Total $ 4,533 $ 4,204
March 31, December 31, (in thousands) 2010 2009
Electric $ 1,125,511 $ 1,119,822 Plastics 79,591 70,380 Manufacturing 340,159 306,011 Health Services 63,845 58,164 Food Ingredient Processing 91,412 88,478 Other Business Operations 66,731 59,915 Corporate 48,712 51,908
Total $ 1,815,961 $ 1,754,678
Table of Contents
OTP serves as the lead utility in a fourth CapX 2020 Group 1 project, the Bemidji-Grand Rapids 230-kV line, which has an expected in-service date of 2012-2013. OTP filed an application for a CON for this fourth project on March 17, 2008. The Department of Commerce Office of Energy Security (MNOES) staff completed briefing papers regarding the Bemidji-Grand Rapids route permit application. The MNOES staff recommended to the MPUC that: (1) the route permit application be found to be complete, (2) the need determination not be sent to a contested case but be handled informally by MPUC review, and (3) the CON and route permit proceedings be combined as requested. The MPUC met on June 26, 2008 to act on the MNOES staff recommendation. The MPUC agreed that the CON and route permit applications were complete. The MNOES subsequently recommended a determination that need for the line has been established. An environmental report for the CON was issued in April 2009. CON hearings were conducted on May 20 and May 21, 2009 and a summary of comments was issued on June 8, 2009. The CON was issued on July 9, 2009 and the written order received on July 14, 2009. The MNOES issued a draft environmental impact statement (EIS) in April 2010. Route hearings were held April 21-23, 2010. The MPUC is expected to determine the route for this line and, if appropriate, issue a route permit in the fall of 2010. A federal EIS also will be needed for this project.
Renewable Energy Standards, Conservation, Renewable Resource Riders and Transmission Riders —The state of Minnesota has a renewable energy standard which requires OTP to generate or procure sufficient renewable generation such that the following percentages of total retail electric sales to Minnesota customers come from qualifying renewable sources: 12% by 2012; 17% by 2016; 20% by 2020 and 25% by 2025. Under certain circumstances and after consideration of costs and reliability issues, the MPUC may modify or delay implementation of the standards. OTP has acquired renewable resources and expects to acquire additional renewable resources in order to maintain compliance with the Minnesota renewable energy standard. OTP has sufficient renewable energy resources available and in service to comply with the required 2016 level of the Minnesota renewable energy standard. OTP’s compliance with the Minnesota renewable energy standard will be measured through the Midwest Renewable Energy Tracking System.
Under the Next Generation Energy Act of 2007, an automatic adjustment mechanism was established to allow Minnesota electric utilities to recover investments and costs incurred to satisfy the requirements of the renewable energy standards. The MPUC is authorized to approve a rate schedule rider to enable utilities to recover the costs of qualifying renewable energy projects that supply renewable energy to Minnesota customers. Cost recovery for qualifying renewable energy projects can now be authorized outside of a rate case proceeding, provided that such renewable projects have received previous MPUC approval. Renewable resource costs eligible for recovery may include return on investment, depreciation, operation and maintenance costs, taxes, renewable energy delivery costs and other related expenses.
In an order issued on August 15, 2008, the MPUC approved OTP’s proposal to implement a Renewable Resource Cost Recovery Rider for its Minnesota jurisdictional portion of investment in qualifying renewable energy facilities. The rider enables OTP to recover from its Minnesota retail customers its investments in owned renewable energy facilities and provides for a return on those investments. The Minnesota Renewable Resource Adjustment (MNRRA) of $0.0019 per kilowatt-hour (kwh) was included on Minnesota customers’ electric service statements beginning in September 2008, reflecting cost recovery for OTP’s twenty-seven 1.5 megawatt (MW) wind turbines and collector system at the Langdon Wind Energy Center, which became fully operational in January 2008.
The MPUC approved OTP’s petition for a 2009 MNRRA in July 2009, which increased the MNRRA rate to provide cost recovery for its 32 wind turbines at the Ashtabula Wind Energy Center that became commercially operational in November 2008. This approval increased the 2009 MNRRA to $0.00415 per kwh for the recovery of $6.6 million through March 31, 2010—$4.0 million from August through December 2009 and $2.6 million from January through March 2010. The approval also granted OTP authority to recover over a 48-month period beginning in April 2010 accrued renewable resource recovery revenues that had not previously been recovered. OTP has recognized a regulatory asset of $5.9 million for revenues that are eligible for recovery through the rider but have not been billed to Minnesota customers as of March 31, 2010. On January 12, 2010, the MPUC issued an order finding OTP’s Luverne Wind Farm project eligible for cost recovery through the MNRRA. The 2010 annual MNRRA cost recovery filing was made on December 31, 2009 with a requested effective date of April 1, 2010. The MNOES has taken the position that OTP’s internal costs should be excluded from recovery under the MNRRA. OTP filed reply comments in opposition to the MNOES’s position. As of the date of this report on Form 10-Q, the MPUC has not rendered a decision on OTP’s petition for a 2010 MNRRA.
13
Table of Contents
In addition to the Renewable Resource Cost Recovery Rider, the Minnesota Public Utilities Act provides a similar mechanism for automatic adjustment outside of a general rate proceeding to recover the costs of new transmission facilities that have been previously approved by the MPUC in a CON proceeding, certified by the MPUC as a Minnesota priority transmission project, made to transmit the electricity generated from renewable generation sources ultimately used to provide service to the utility’s retail customers, or otherwise deemed eligible by the MPUC. Such transmission cost recovery riders allow a return on investment at the level approved in a utility’s last general rate case. Additionally, following approval of the rate schedule, the MPUC may approve annual rate adjustments filed pursuant to the rate schedule. OTP’s request for approval of a transmission cost recovery rider was granted by the MPUC on January 7, 2010, and became effective February 1, 2010. Beginning February 1, 2010, OTP’s transmission rider rate is reflected on Minnesota customer electric service statements at $0.00039 per kwh plus $0.035 per kW for large general service customers and $0.00007 per kwh for controlled service customers, $0.00025 per kwh for lighting customers, and $0.00057 per kwh for all other customers. As of March 31, 2010 OTP had accrued $0.3 million in revenues that are eligible for recovery through the rider but have not been billed. In a request for a revenue increase under general rates filed with the MPUC on April 2, 2010, OTP has requested recovery of its transmission investments currently being recovered through OTP’s Minnesota transmission rider rate. The transmission investments will continue to be recovered through OTP’s Minnesota transmission rider rate until the MPUC makes a decision on OTP’s general rate case.
North Dakota
General Rate Case —On November 3, 2008 OTP filed a general rate case in North Dakota requesting an overall revenue increase of approximately $6.1 million, or 5.1%, and an interim rate increase of approximately 4.1%, or $4.8 million annualized, that went into effect on January 2, 2009. In an order issued by the North Dakota Public Service Commission (NDPSC) on November 25, 2009 OTP was granted an increase in North Dakota retail electric rates of $3.6 million or approximately 3.0%, which went into effect in December 2009. The NDPSC order authorizing an interim rate increase requires OTP to refund North Dakota customers the difference between final and interim rates, with interest. OTP established a refund reserve for revenues collected under interim rates that exceeded the final rate increase. The refund reserve balance was $0.9 million as of December 31, 2009, which was refunded to North Dakota customers in January 2010. OTP deferred recognition of $0.5 million in rate case-related filing and administrative costs that are subject to amortization and recovery over a three year period beginning in January 2010.
Renewable Resource Cost Recovery Rider —On May 21, 2008 the NDPSC approved OTP’s request for a Renewable Resource Cost Recovery Rider to enable OTP to recover the North Dakota share of its investments in renewable energy facilities it owns in North Dakota. The North Dakota Renewable Resource Cost Recovery Rider Adjustment (NDRRA) of $0.00193 per kwh was included on North Dakota customers’ electric service statements beginning in June 2008, and reflects cost recovery for OTP’s twenty-seven 1.5 MW wind turbines and collector system at the Langdon Wind Energy Center, which became fully operational in January 2008. The rider also allows OTP to recover costs associated with other new renewable energy projects as they are completed. OTP included investment costs and expenses related to its 32 wind turbines at the Ashtabula Wind Energy Center that became commercially operational in November 2008 in its 2009 annual request to the NDPSC to increase the amount of the NDRRA. An NDRRA of $0.0051 per kwh was approved by the NDPSC on January 14, 2009 and went into effect beginning with billing statements sent on February 1, 2009.
In a proceeding that was combined with OTP’s general rate case, the NDPSC reviewed whether to move the costs of the projects currently being recovered through the NDRRA into base rate cost recovery and whether to make changes to the rider. A settlement of the general rate case and the NDRRA reduced the NDRRA to $0.00369 for the period from December 1, 2009 until the effective date for the next annual NDRRA filing, requested to be April 1, 2010. Because the 2008 annual NDRRA filing was combined with the general rate case proceedings (concluded in November 2009), the 2009 annual filing to establish the 2010 NDRRA (which includes cost recovery for OTP’s investment in its Luverne Wind Farm project) was delayed until December 31, 2009, with a requested effective date of April 1, 2010. As of the date of this report on Form 10-Q, the NDPSC had not rendered a decision on OTP’s petition for a 2010 NDRRA.
OTP had not been deferring recognition of its renewable resource costs eligible for recovery under the NDRRA but had been charging those costs to operating expense since January 2008. After approval of the rider in May 2008, OTP accrued revenues related to its investment in renewable energy and for renewable energy costs incurred since January 2008 that are eligible for recovery through the NDRRA. Terms of the approved settlement provide for the recovery of accrued but unbilled NDRRA revenues over a period of 48 months beginning in January 2010. The Company’s March 31, 2010 consolidated balance sheet includes a regulatory asset of $0.9 million for revenues that are eligible for recovery through the NDRRA but have not been billed to North Dakota customers.
14
Table of Contents
North Dakota legislation also provides a mechanism for automatic adjustment outside of a general rate proceeding to recover jurisdictional capital and operating costs incurred by a public utility for new or modified electric transmission facilities. OTP requested recovery of such costs in its general rate case filed in November 2008, and was granted recovery of such costs by the NDPSC in its November 25, 2009 order.
CapX 2020 Request for Advance Determination of Prudence —On October 5, 2009 OTP filed an application for an advance determination of prudence with the NDPSC for its proposed participation in three of the four Group 1 projects (Fargo-St. Cloud, Brookings-Southeast Twin Cities, and Bemidji-Grand Rapids). An administrative law judge has been assigned to conduct a public hearing scheduled to begin May 24, 2010.
South Dakota
General Rate Case —On October 31, 2008 OTP filed a general rate case in South Dakota requesting an overall revenue increase of approximately $3.8 million, or 15.3%, which included, among other things, recovery of investments and expenses related to renewable resources in base rates. OTP increased rates by approximately 11.7% on a temporary basis beginning with electricity consumed on and after May 1, 2009, as allowed under South Dakota law. In an order issued by the South Dakota Public Utilities Commission (SDPUC) on June 30, 2009, OTP was granted an increase in South Dakota retail electric rates of $3.0 million or approximately 11.7%. OTP implemented final, approved rates in July 2009.
Federal
Revenue Sufficiency Guarantee (RSG) Charges —Since 2006, OTP has been a party to litigation before the FERC regarding the application of RSG charges to market participants who withdraw energy from the market or engage in financial-only, virtual sales of energy into the market or both. These litigated proceedings occurred in several electric rate and complaint dockets before the FERC and several of the FERC’s orders are on review before the United States Court of Appeals for the District of Columbia Circuit (D.C. Circuit).
On November 7, 2008 the FERC issued an order on rehearing and compliance in the RSG proceeding, reversing its determination in a prior order and stating that MISO should remove the volume of virtual supply offers of market participants — not physically withdrawing energy — from the denominator of the rate calculation from April 25, 2006 forward. MISO interpreted the order to mean that all virtual supply offers and deviations in the denominator of the rate calculation that do not ultimately pay the rate should be removed from April 1, 2005 (start of the Energy Market ) forward. On November 10, 2008 the FERC issued an order finding the current RSG rate unjust and unreasonable and accepting an interim rate that applied RSG charges to all virtual sales until such time as MISO makes a subsequent filing of the new RSG rate.
On May 6, 2009 the FERC issued an order on rehearing of the November 10, 2008 order. The May order relieved MISO from having to resettle RSG payments resulting from the FERC’s earlier decision to remove the words “actually withdraws energy” (AWE) from the RSG tariff provisions. Absent this relief (or waiver), the removal of the AWE language would have had two relevant impacts on the RSG charge: (1) it would tend to reduce the RSG rate because the rate denominator would include all virtual supply volumes and (2) it would impose RSG charges on all cleared virtual supply transactions. The waiver applies to the period August 10, 2007 through November 9, 2008. Beginning November 10, 2008, the MISO is obliged to resettle RSG charges by recalculating the RSG rate and impose RSG charges on all virtual supply transactions.
On June 12, 2009 the FERC issued an order on rehearing of the November 7, 2008 order. The June order, at a minimum, relieved MISO from having to resettle RSG payments resulting from any difference between the megawatt hours associated with virtual supply in the denominator of the RSG rate and the billing determinants associated with virtual supply transactions (VSO mismatch). This relief (or waiver) applies to the period April 25, 2006 through November 4, 2007. Since OTP would have had a payment obligation during this period associated with the virtual supply and other mismatches, the June order eliminates that payment obligation. However, the June order, like many of the other orders in this docket, is subject to appellate review and potential reversal. Beginning from November 5, 2007, MISO is obligated to resettle to correct the VSO mismatch. As of September 30, 2009, OTP had paid all its resettlement obligations determined and imposed by MISO. On August 7, 2009 the FERC issued an order requiring MISO’s RSG Task Force to develop a recommendation on any transactions that should be exempted from paying RSG charges. The RSG Task Force has completed its review and provided recommendations to the FERC. The Company does not know when these litigation proceedings will conclude.
15
Table of Contents
Big Stone II Project
On June 30, 2005 OTP and a coalition of six other electric providers entered into several agreements for the development of a second electric generating unit, named Big Stone II, at the site of the existing Big Stone Plant near Milbank, South Dakota. On September 11, 2009 OTP announced its withdrawal—both as a participating utility and as the project’s lead developer—from Big Stone II, due to a number of factors. The broad economic downturn, a high level of uncertainty associated with proposed federal climate legislation and existing federal environmental regulations and challenging credit and equity markets made proceeding with Big Stone II and committing to approximately $400 million in capital expenditures untenable for OTP’s customers and the Company’s shareholders. On November 2, 2009, the remaining Big Stone II participants announced the cancellation of the Big Stone II project.
As of March 31, 2010, OTP had incurred $13.2 million in costs related to this project that it believes are probable of recovery in future rates and has deferred recognition of these costs as operating expenses pending determination of recoverability by the state and federal regulatory commissions that approve OTP’s rates. In filings made on December 14, 2009, OTP requested from its three state commissions authority to reflect these costs on its books as a regulatory asset through the use of deferred accounting, pending a determination on the recoverability of the costs. OTP has requested recovery of the Minnesota portion of its Big Stone II development costs over a five-year period as part of its general rate case filed in Minnesota on April 2, 2010, and thereafter requested withdrawal of its December 14, 2009 request for deferred accounting as duplicative of the issues presented in the rate case. The SDPUC approved OTP’s request for deferred accounting treatment on February 9, 2010. OTP will request recovery of the South Dakota portion of its Big Stone II development costs over a five-year period in its next general rate case filing in South Dakota, expected to be filed in the second quarter of 2010.
In a hearing held on May 5, 2010, the NDPSC reviewed a settlement agreement filed on April 23, 2010 between the NDPSC Advocacy Staff, OTP and the North Dakota Large Industrial Energy Group in the matter of OTP’s applications for a determination of prudence to discontinue participation in the Big Stone II generating plant and authority to use deferred accounting. The terms of the settlement agreement indicate that OTP’s discontinuation of participation in the project was prudent and OTP should be authorized to recover the portion of costs it incurred related to the Big Stone II generation project. The North Dakota portion of Big Stone II generation and transmission costs under consideration pursuant to the settlement agreement is approximately $5.1 million. The settlement agreement is on file with the NDPSC. The NDPSC will evaluate the settlement agreement along with requested supplemental information in a working session yet to be scheduled before rendering a decision in this matter.
If Minnesota, North Dakota or South Dakota jurisdictions eventually deny recovery of all or any portion of these deferred costs, such costs would be subject to expense in the period they are deemed unrecoverable.
16
Table of Contents
4. Regulatory Assets and Liabilities
As a regulated entity OTP accounts for the financial effects of regulation in accordance with ASC 980, Regulated Operations . This accounting standard allows for the recording of a regulatory asset or liability for costs that will be collected or refunded in the future as required under regulation.
The following table indicates the amount of regulatory assets and liabilities recorded on the Company’s consolidated balance sheet:
The regulatory asset related to the unrecognized transition obligation, prior service costs and actuarial losses on pensions and other postretirement benefits represents benefit costs and actuarial losses subject to recovery through rates as they are expensed over the remaining service lives of active employees included in the plans. These unrecognized benefit costs and actuarial losses are required to be recognized as components of Accumulated Other Comprehensive Income in equity under ASC 715, Compensation—Retirement Benefits, but are eligible for treatment as regulatory assets based on their probable recovery in future retail electric rates.
All Deferred Marked-to-Market Gains and Losses recorded as of March 31, 2010 are related to forward purchases of energy scheduled for delivery through December 2013.
Unrecovered Project Costs — Big Stone II are costs incurred by OTP related to its participation in the planned construction of a 500- to 600-megawatt generating unit at its Big Stone Plant site. On September 11, 2009 OTP announced its withdrawal from participation in the Big Stone II project due to a number of factors. OTP believes the costs it incurred during its participation in the project are probable of recovery in future rates and has deferred recognition of these costs as operating expenses pending determination of recoverability by the state and federal regulatory commissions that approve OTP’s rates. No recovery period has been established for the recovery of these deferred costs as OTP is in the initial phase of seeking recovery of these costs
17
March 31, December 31, (in thousands) 2010 2009
Regulatory Assets: Unrecognized Transition Obligation, Prior Service Costs and Actuarial Losses on Pensions and Other
Postretirement Benefits $ 77,992 $ 78,871 Deferred Marked-to-Market Losses 13,309 7,614 Unrecovered Project Costs — Big Stone II 13,184 12,982 Minnesota Renewable Resource Rider Accrued Revenues 5,904 5,324 Deferred Income Taxes 5,595 5,441 Debt Reacquisition Premiums 4,037 3,051 Deferred Conservation Improvement Program Costs 2,079 1,908 Accumulated ARO Accretion/Depreciation Adjustment 1,908 1,808 General Rate Case Recoverable Expenses 1,519 1,693 MISO Schedule 16 and 17 Deferred Administrative Costs — ND 998 1,091 North Dakota Renewable Resource Rider Accrued Revenues 872 566 South Dakota — Asset-Based Margin Sharing Shortfall 406 330 Minnesota Transmission Rider Accrued Revenues 344 420 Deferred Holding Company Formation Costs 234 248 MISO Schedule 16 and 17 Deferred Administrative Costs — MN 183 252 Plant Acquisition Costs 7 18 Accrued Cost-of-Energy (Refund) Revenue (1,243 ) 1,175
Total Regulatory Assets $ 127,328 $ 122,792
Regulatory Liabilities: Accumulated Reserve for Estimated Removal Costs — Net of Salvage $ 59,447 $ 58,937 Deferred Income Taxes 4,796 4,965 Deferred Marked-to-Market Gains 284 224 Other Regulatory Liabilities 154 148
Total Regulatory Liabilities $ 64,681 $ 64,274
Net Regulatory Asset Position $ 62,647 $ 58,518
Table of Contents
through the regulatory process. If OTP is denied recovery of any portion of these deferred costs, such costs would be subject to expense in the period they are deemed unrecoverable.
Minnesota Renewable Resource Rider Accrued Revenues relate to revenues earned on qualifying 2008 and 2009 renewable resource costs incurred to serve Minnesota customers that have not been billed to Minnesota customers as of March 31, 2010. Minnesota Renewable Resource Rider Accrued Revenues are expected to be recovered over the next 48 months.
The regulatory assets and liabilities related to Deferred Income Taxes result from changes in statutory tax rates accounted for in accordance with ASC 740, Income Taxes .
Debt Reacquisition Premiums included in Unamortized Debt Expense are being recovered from OTP customers over the remaining original lives of the reacquired debt issues, the longest of which is 23 years.
Deferred Conservation Program Costs represent mandated conservation expenditures and incentives recoverable through retail electric rates over the next 15 months.
The Accumulated ARO Accretion/Depreciation Adjustment will accrete and be amortized over the lives of property with asset retirement obligations.
General Rate Case Recoverable Expenses will be recovered over the next 49 months.
MISO Schedule 16 and 17 Deferred Administrative Costs — ND will be recovered over the next 32 months.
North Dakota Renewable Resource Rider Accrued Revenues relate to revenues earned on qualifying 2008 and 2009 renewable resource costs incurred to serve North Dakota customers that have not been billed to North Dakota customers as of March 31, 2010. North Dakota Renewable Resource Rider Accrued Revenues are expected to be recovered over the next 45 months.
South Dakota — Asset-Based Margin Sharing Shortfall represents a difference in OTP’s South Dakota share of actual profit margins on wholesale sales of electricity from company-owned generating units and estimated profit margins from those sales that were used in determining current South Dakota retail electric rates. Net shortfalls or excess margins accumulated annually will be subject to recovery or refund through future retail rate adjustments in South Dakota in the following year.
Minnesota Transmission Rider Accrued Revenues are expected to be recovered over the next 9 months.
Deferred Holding Company Formation Costs will be amortized over the next 51 months.
MISO Schedule 16 and 17 Deferred Administrative Costs — MN will be recovered over the next 8 months.
Plant Acquisition Costs will be amortized over the next 2 months.
The Accrued Cost-of-Energy (Refund) is netted against Accrued Utility and Cost-of-Energy Revenues and will be credited to retail electric customers over the next 17 months.
The Accumulated Reserve for Estimated Removal Costs — Net of Salvage is reduced as actual removal costs are incurred.
Other Regulatory Liabilities includes: 1) a portion of profit margins on wholesales sales of purchased power subject to refund to South Dakota customers through future retail rate adjustments and 2) a deferred gain on the sale of utility property that will be paid to Minnesota retail electric customers over the next 24 years.
If for any reason, OTP ceases to meet the criteria for application of guidance under ASC 980 for all or part of its operations, the regulatory assets and liabilities that no longer meet such criteria would be removed from the consolidated balance sheet and included in the consolidated statement of income as an extraordinary expense or income item in the period in which the application of guidance under ASC 980 ceases.
18
Table of Contents
5. Forward Contracts Classified as Derivatives
Electricity Contracts
All of OTP’s wholesale purchases and sales of energy under forward contracts that do not meet the definition of capacity contracts are considered derivatives subject to mark-to-market accounting. OTP’s objective in entering into forward contracts for the purchase and sale of energy is to optimize the use of its generating and transmission facilities and leverage its knowledge of wholesale energy markets in the region to maximize financial returns for the benefit of both its customers and shareholders. OTP’s intent in entering into certain of these contracts is to settle them through the physical delivery of energy when physically possible and economically feasible. OTP also enters into certain contracts for trading purposes with the intent to profit from fluctuations in market prices through the timing of purchases and sales.
As of March 31, 2010 OTP had recognized, on a pretax basis, $2,652,000 in net unrealized gains on open forward contracts for the purchase and sale of electricity. The market prices used to value OTP’s forward contracts for the purchases and sales of electricity and electricity generating capacity are determined by survey of counterparties or brokers used by OTP’s power services’ personnel responsible for contract pricing, as well as prices gathered from daily settlement prices published by the Intercontinental Exchange. For certain contracts, prices at illiquid trading points are based on a basis spread between that trading point and more liquid trading hub prices. These basis spreads are determined based on available market price information and the use of forward price curve models. The fair value measurements of these forward energy contracts fall into level 2 of the fair value hierarchy set forth in ASC 820-10-35.
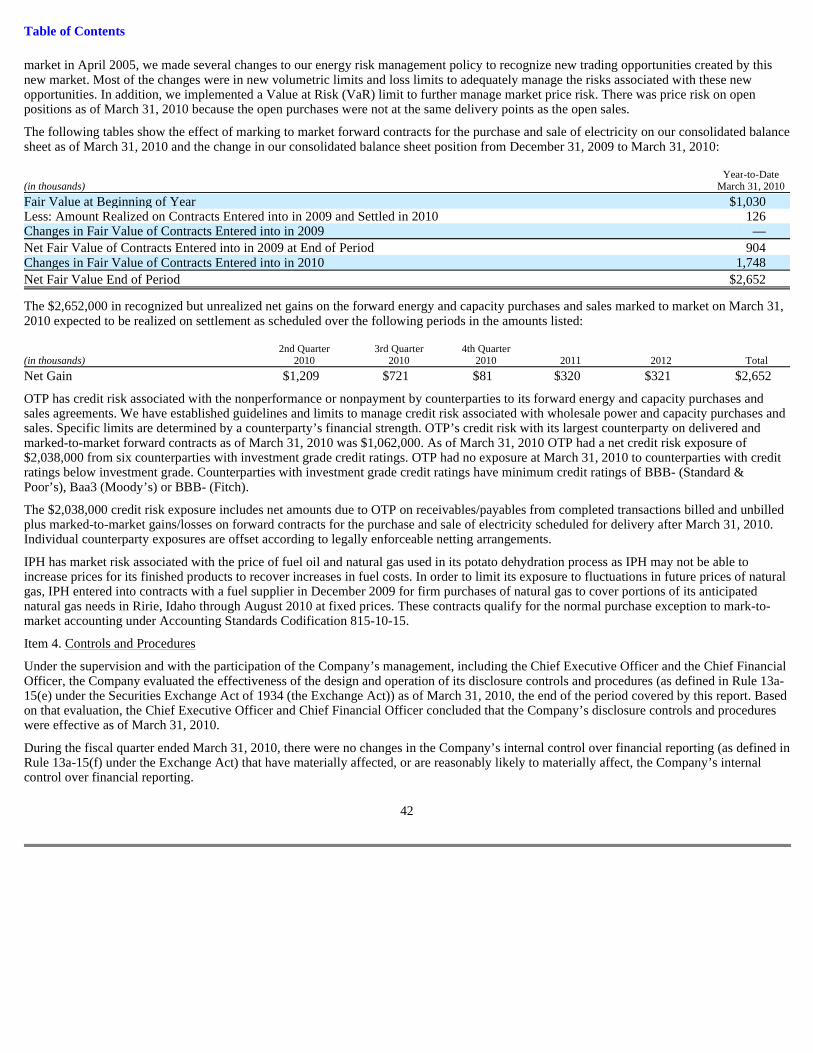
The following tables show the effect of marking to market forward contracts for the purchase and sale of electricity and the location and fair value amounts of the related derivatives reported on the Company’s consolidated balance sheets as of March 31, 2010 and December 31, 2009, and the change in the Company’s consolidated balance sheet position from December 31, 2009 to March 31, 2010:
The $2,652,000 in recognized but unrealized net gains on the forward energy and capacity purchases and sales marked to market on March 31, 2010 is expected to be realized on settlement as scheduled over the following periods in the amounts listed:
19
March 31, December 31, (in thousands) 2010 2009
Current Asset – Marked-to-Market Gain $ 11,200 $ 8,321 Regulatory Asset – Deferred Marked-to-Market Loss 13,309 7,614
Total Assets 24,509 15,935
Current Liability – Marked-to-Market Loss (21,573 ) (14,681 ) Regulatory Liability – Deferred Marked-to-Market Gain (284 ) (224 )
Total Liabilities (21,857 ) (14,905 )
Net Fair Value of Marked-to-Market Energy Contracts $ 2,652 $ 1,030
Year-to-Date (in thousands) March 31, 2010
Fair Value at Beginning of Year $ 1,030 Less: Amount Realized on Contracts Entered into in 2009 and Settled in 2010 126 Changes in Fair Value of Contracts Entered into in 2009 —
Net Fair Value of Contracts Entered into in 2009 at End of Period 904 Changes in Fair Value of Contracts Entered into in 2010 1,748
Net Fair Value End of Period $ 2,652
2nd Quarter 3rd Quarter 4th Quarter (in thousands) 2010 2010 2010 2011 2012 Total | | | | | |
Net Gain $ 1,209 $ 721 $ 81 $ 320 $ 321 $ 2,652
Table of Contents
Realized and unrealized net gains on forward energy contracts of $1,825,000 for the three months ended March 31, 2010 and $1,034,000 for the three months ended March 31, 2009 are included in electric operating revenues on the Company’s consolidated statements of income.
OTP has credit risk associated with the nonperformance or nonpayment by counterparties to its forward energy and capacity purchases and sales agreements. We have established guidelines and limits to manage credit risk associated with wholesale power and capacity purchases and sales. Specific limits are determined by a counterparty’s financial strength. OTP’s credit risk with its largest counterparty on delivered and marked-to-market forward contracts as of March 31, 2010 was $1,062,000. As of March 31, 2010 OTP had a net credit risk exposure of $2,038,000 from six counterparties with investment grade credit ratings. OTP had no exposure at March 31, 2010 to counterparties with credit ratings below investment grade. Counterparties with investment grade credit ratings have minimum credit ratings of BBB- (Standard & Poor’s), Baa3 (Moody’s) or BBB- (Fitch).
The $2,038,000 credit risk exposure includes net amounts due to OTP on receivables/payables from completed transactions billed and unbilled plus marked-to-market gains/losses on forward contracts for the purchase and sale of electricity scheduled for delivery after March 31, 2010. Individual counterparty exposures are offset according to legally enforceable netting arrangements.
Mark-to-market losses of $1,699,000 on certain of OTP’s derivative energy contracts included in the $21,573,000 derivative liability on March 31, 2010 are covered by deposited funds. Certain other of OTP’s derivative energy contracts contain provisions that require an investment grade credit rating from each of the major credit rating agencies on OTP’s debt. If OTP’s debt ratings were to fall below investment grade, the counterparties to these forward energy contracts could request immediate and ongoing full overnight collateralization on contracts in net liability positions. The aggregate fair value of all forward energy derivative contracts with credit-risk-related contingent features that are in a liability position on March 31, 2010 is $11,063,000, for which OTP has posted $9,730,000 as collateral in the form of offsetting gain positions on other contracts with its counterparties under master netting agreements. If the credit-risk-related contingent features underlying these agreements were triggered on March 31, 2010, OTP would have been required to post $1,333,000 in additional collateral to its counterparties. The remaining derivative liability balance of $8,811,000 relates to mark-to-market losses on contracts that have no ratings triggers or deposit requirements.
Fuel Contracts
In order to limit its exposure to fluctuations in future prices of natural gas, IPH entered into contracts with a fuel supplier in December 2009 for firm purchases of natural gas to cover portions of its anticipated natural gas needs in Ririe, Idaho through August 2010 at fixed prices. These contracts qualify for the normal purchase exception to mark-to-market accounting under ASC 815-10-15.
Foreign Currency Exchange Forward Windows
The Canadian operations of IPH records its sales and carries its receivables in U.S. dollars but pays its expenses for goods and services consumed in Canada in Canadian dollars. The payment of its bills in Canada requires the periodic exchange of U.S. currency for Canadian currency. In order to lock in acceptable exchange rates and hedge its exposure to future fluctuations in foreign currency exchange rates between the U.S. dollar and the Canadian dollar, IPH’s Canadian subsidiary entered into forward contracts for the exchange of U.S. dollars into Canadian dollars in 2008. Each monthly contract was for the exchange of $400,000 U.S. dollars for the amount of Canadian dollars stated in each contract. IPH’s Canadian subsidiary also entered into forward contracts for the exchange of U.S. dollars into Canadian dollars in July 2009. Each monthly contract was for the exchange of $200,000 U.S. dollars for the amount of Canadian dollars stated in each contract. All contracts were settled as of December 31, 2009.
These contracts were derivatives subject to mark-to-market accounting. IPH did not enter into these contracts for speculative purposes or with the intent of early settlement, but for the purpose of locking in acceptable exchange rates and hedging its exposure to future fluctuations in exchange rates. IPH settled these contracts during their stated settlement periods and used the proceeds to pay its Canadian liabilities when they came due. These contracts did not qualify for hedge accounting treatment
20
(in thousands) Settlement Periods USD CAD
Contracts Entered into in July 2008 January 2009 — July 2009 $ 2,800 $ 2,918 Contracts Entered into in October 2008 January 2009 — October 2009 $ 4,000 $ 5,001 Contracts Entered Into in July 2009 August 2009 — December 2009 $ 1,000 $ 1,163
Table of Contents
because the timing of their settlements did not coincide with the payment of specific bills or contractual obligations. The foreign currency exchange forward contracts outstanding as of March 31, 2009 were valued and marked to market on March 31, 2009 based on quoted exchange values on March 31, 2009. Realized and unrealized net losses on IPH’s foreign currency exchange forward windows of $144,000 for the three months ended March 31, 2009, are included in Other Income on the Company’s consolidated statements of income.
6. Common Shares and Earnings Per Share
Common Shares
Following is a reconciliation of the Company’s common shares outstanding from December 31, 2009 through March 31, 2010:
Earnings Per Share
Basic earnings per common share are calculated by dividing earnings available for common shares by the weighted average number of common shares outstanding during the period. Diluted earnings per common share are calculated by adjusting outstanding shares, assuming conversion of all potentially dilutive stock options. Stock options with exercise prices greater than the market price are excluded from the calculation of diluted earnings per common share. Nonvested restricted shares granted to the Company’s directors and employees are considered dilutive for the purpose of calculating diluted earnings per share but are considered contingently returnable and not outstanding for the purpose of calculating basic earnings per share. Underlying shares related to nonvested restricted stock units granted to employees are considered dilutive for the purpose of calculating diluted earnings per share. Shares expected to be awarded for stock performance awards granted to executive officers are considered dilutive for the purpose of calculating diluted earnings per share.
Excluded from the calculation of diluted earnings per share are the following outstanding stock options which had exercise prices greater than the average market price for the quarters ended March 31, 2010 and 2009:
Common Stock Distribution Agreement
On March 17, 2010, the Company entered into a Distribution Agreement (the Agreement) with J.P. Morgan Securities Inc. (JPMS). Pursuant to the terms of the Agreement, the Company may offer and sell its common shares from time to time through JPMS, as the Company’s distribution agent for the offer and sale of the shares, up to an aggregate sales price of $75,000,000.
Under the Agreement, the Company will designate the minimum price and maximum number of shares to be sold through JPMS on any given trading day or over a specified period of trading days, and JPMS will use commercially reasonable efforts to sell such shares on such days, subject to certain conditions. Sales of the shares, if any, will be made by means of ordinary brokers’ transactions on the NASDAQ Global Select Market at market prices or as otherwise agreed with JPMS. The Company may also agree to sell shares to JPMS, as principal for its own account, on terms agreed by the Company and JPMS in a separate agreement at the time of sale. JPMS will receive from the Company a commission of 2% of the gross sales price per share for any shares sold through it as the Company’s distribution agent under the Agreement.
The Company is not obligated to sell and JPMS is not obligated to buy or sell any of the shares under the Agreement. The shares, if issued, will be issued pursuant to the Company’s existing shelf registration statement, as amended.
21
Common Shares Outstanding, December 31, 2009 35,812,280 Issuances:
The Company has five share-based payment programs. No new stock awards were granted under these programs in the first quarter of 2010. As of March 31, 2010 the remaining unrecognized compensation expense related to stock-based compensation was approximately $5.0 million (before income taxes) which will be amortized over a weighted-average period of 1.9 years.
Amounts of compensation expense recognized under the Company’s five stock-based payment programs for the three months ended March 31, 2010 and 2009 are presented in the table below:
9. Commitments and Contingencies
Sierra Club Complaint
On June 10, 2008 the Sierra Club filed a complaint in the U.S. District Court for the District of South Dakota (Northern Division) against the Company and two other co-owners of Big Stone Generating Station (Big Stone). The complaint alleged certain violations of the Prevention of Significant Deterioration and New Source Performance Standards (NSPS) provisions of the Clean Air Act (CAA) and certain violations of the South Dakota State Implementation Plan (South Dakota SIP). The action further alleged the defendants modified and operated Big Stone without obtaining the appropriate permits, without meeting certain emissions limits and NSPS requirements and without installing appropriate emission control technology, all allegedly in violation of the CAA and the South Dakota SIP. The Sierra Club alleged the defendants’ actions have contributed to air pollution and visibility impairment and have increased the risk of adverse health effects and environmental damage. The Sierra Club sought both declaratory and injunctive relief to bring the defendants into compliance with the CAA and the South Dakota SIP and to require the defendants to remedy the alleged violations. The Sierra Club also seeks unspecified civil penalties, including a beneficial mitigation project. The Company believes these claims are without merit and that Big Stone was and is being operated in compliance with the CAA and the South Dakota SIP.
The defendants filed a motion to dismiss the Sierra Club complaint on August 12, 2008. On March 31, 2009 and April 6, 2009, the U.S. District Court for the District of South Dakota (Northern Division) issued a Memorandum and Order and Amended Memorandum and Order, respectively, granting the defendants’ motion to dismiss the Sierra Club complaint. On April 17, 2009 the Sierra Club filed a motion for reconsideration of the Amended Memorandum Opinion and Order. The Sierra Club motion was opposed by the defendants. The Sierra Club motion for reconsideration was denied on July 22, 2009. On July 30, 2009 the Sierra Club filed a notice of appeal to the 8th U.S. Circuit Court of Appeals. The briefing schedule calls for the appellant to submit its brief by mid-October, for appellees to submit their brief by mid-November and for the appellant to submit its reply brief by the end of November. On October 13, 2009, the United States Department of Justice filed a motion seeking a 30-day extension of the time to file an amicus brief in support of the Sierra Club’s position. The Court of Appeals granted this motion, as well as the appellees’ subsequent joint motion with the Sierra Club, extending the time to file the appellees’ brief and the Sierra Club’s reply brief. Briefing was complete on January 22, 2010 on filing of the Sierra Club’s reply brief. Oral arguments before the Court of Appeals are scheduled for May 11, 2010. The ultimate outcome of this matter cannot be determined at this time.
Federal Power Act Complaint
On August 29, 2008 Renewable Energy System Americas, Inc. (RES), a developer of wind generation, and PEAK Wind Development, LLC (PEAK Wind), a group of landowners in Barnes County, North Dakota, filed a complaint with the FERC alleging that OTP and Minnkota Power Cooperative, Inc. (Minnkota) had acted together in violation of the Federal Power Act (FPA) to deny RES and PEAK Wind access to the Pillsbury Line, an interconnection facility which Minnkota owns to interconnect generation projects being developed by OTP and NextEra Energy Resources, Inc. (fka FPL Energy, Inc.)
22
Three months ended March 31, (in thousands) 2010 2009
Employee Stock Purchase Plan (15% discount) $ 69 $ 90 Restricted Stock Granted to Directors 140 111 Restricted Stock Granted to Employees 118 91 Restricted Stock Units Granted to Employees 60 121 Stock Performance Awards Granted to Executive Officers 222 435
Totals $ 609 $ 848
Table of Contents
(NextEra). RES and PEAK Wind asked that (1) the FERC order Minnkota to interconnect its Glacier Ridge project to the Pillsbury Line, or in the alternative, (2) the FERC direct MISO to interconnect the Glacier Ridge project to the Pillsbury Line. RES and Peak Wind also requested that OTP, Minnkota and NextEra pay any costs associated with interconnecting the Glacier Ridge Project to the MISO transmission system which would result from the interconnection of the Pillsbury Line to the Minnkota transmission system, and that the FERC assess civil penalties against OTP. OTP answered the complaint on September 29, 2008, denying the allegations of RES and PEAK Wind and requesting that the FERC dismiss the complaint. On October 14, 2008, RES and PEAK Wind filed an answer to OTP’s answer and, restated the allegations included in the initial complaint. RES and PEAK Wind also added a request that the FERC rescind both OTP’s waiver from the FERC Standards of Conduct and its market-based rate authority. On October 28, 2008, OTP filed a reply, denying the allegations made by RES and PEAK Wind in its answer. By order issued on December 19, 2008, the FERC set the complaint for hearing and established settlement procedures. A formal settlement agreement was filed with the FERC requesting approval of the settlement and withdrawal of the complaint. On May 6, 2010 the FERC issued an order approving the settlement and terminating the proceeding. The settlement did not have a material impact on OTP’s financial position, results of operations or cash flows.
Other
The Company is a party to litigation arising in the normal course of business. The Company regularly analyzes current information and, as necessary, provides accruals for liabilities that are probable of occurring and that can be reasonably estimated. The Company believes the effect on its consolidated results of operations, financial position and cash flows, if any, for the disposition of all matters pending as of March 31, 2010 will not be material.
10. Short-Term and Long-Term Borrowings
The following table presents the status of our lines of credit as of March 31, 2010 and December 31, 2009:
The Otter Tail Corporation Credit Agreement was amended and restated effective May 4, 2010. See note 17 — Subsequent Events for further details.
23
Restricted due to In Use on Outstanding Letters Available on Available on (in thousands) Line Limit March 31, 2010 of Credit March 31, 2010 December 31, 2009 | | | | |
1 On January 4, 2010, OTP paid off the remaining $58.0 million balance outstanding on its two-year, $75.0 million term loan that was originally due on May 20, 2011, using lower cost funds available under the OTP Credit Agreement. OTP did not incur any penalties for the early repayment and retirement of this debt.
Table of Contents
The following table provides a breakdown of the assignment of the Company’s consolidated short-term and long-term debt outstanding as of March 31, 2010:
11. Class B Stock Options of Subsidiary
As of March 31, 2010 there were 772 options for the purchase of IPH Class B common shares outstanding with a combined exercise price of $391,000. All 772 outstanding options were “in-the-money” on March 31, 2010. A valuation of IPH Class B common shares in the first quarter of 2010 indicated a fair value of $2,485.60 per share. The book value of outstanding IPH Class B common share options on March 31, 2010 is based on an IPH Class B common share value of $2,085.88 per share.
12. Pension Plan and Other Postretirement Benefits
Pension Plan —Components of net periodic pension benefit cost of the Company’s noncontributory funded pension plan are as follows:
The Company did not make a contribution to its pension plan in the three months ended March 31, 2010 and is not currently required to make a contribution in 2010.
Senior Unsecured Notes 6.63%, due December 1, 2011 90,000 90,000 Pollution Control Refunding Revenue Bonds, Variable, 3.00% at
March 31, 2010, due December 1, 2012 10,400 10,400 9.000% Notes, due December 15, 2016 $ 100,000 100,000 Senior Unsecured Notes 5.95%, Series A, due August 20, 2017 33,000 33,000 Grant County, South Dakota Pollution Control Refunding Revenue Bonds
4.65%, due September 1, 2017 5,125 5,125 Senior Unsecured Note 8.89%, due November 30, 2017 50,000 50,000 Senior Unsecured Notes 6.15%, Series B, due August 20, 2022 30,000 30,000 Mercer County, North Dakota Pollution Control Refunding Revenue
Bonds 4.85%, due September 1, 2022 20,390 20,390 Senior Unsecured Notes 6.37%, Series C, due August 20, 2027 42,000 42,000 Senior Unsecured Notes 6.47%, Series D, due August 20, 2037 50,000 50,000 Obligations of Varistar Corporation — Various up to 13.31% at
Total Short-Term and Long-Term Debt (with current maturities) $ 344,414 $ 6,085 $ 196,994 $ 547,493
Three Months Ended March 31, (in thousands) 2010 2009
Service Cost—Benefit Earned During the Period $ 1,247 $ 1,133 Interest Cost on Projected Benefit Obligation 3,030 2,975 Expected Return on Assets (3,400 ) (3,448 ) Amortization of Prior-Service Cost 170 181 Amortization of Net Actuarial Loss 495 5
Net Periodic Pension Cost $ 1,542 $ 846
Table of Contents
Executive Survivor and Supplemental Retirement Plan —Components of net periodic pension benefit cost of the Company’s unfunded, nonqualified benefit plan for executive officers and certain key management employees are as follows:
Postretirement Benefits —Components of net periodic postretirement benefit cost for health insurance and life insurance benefits for retired OTP and corporate employees are as follows:
13. Fair Value of Financial Instruments
The following methods and assumptions were used to estimate the fair value of each class of financial instruments for which it is practicable to estimate that value:
Cash and Short-Term Investments —The carrying amount approximates fair value because of the short-term maturity of those instruments.
Long-Term Debt —The fair value of the Company’s long-term debt is estimated based on the current rates available to the Company for the issuance of debt. The Company’s long-term debt subject to variable interest rates approximates fair value.
15. Income Taxes
The Company’s effective income tax rates for the three months ended March 31, 2010 and 2009 were approximately 33.5% and (46.0%), respectively. Income taxes in the first quarter of 2010 included a charge of $1.7 million related to the enactment of new federal health care legislation in March 2010 which resulted in the reversal of previously recognized deferred tax assets due to the elimination of the tax deduction related to the Medicare Part D retiree drug subsidy, offset by $1.8 million in production tax credits and North Dakota wind energy credits related to OTP’s wind turbines. The reduction from the federal statutory rate in the first quarter 2009 is mainly due to the recognition of production tax credits and North Dakota wind energy tax credits totaling $2.1 million.
The Company recognizes PTCs as wind energy is generated and sold based on a per kwh rate prescribed in applicable federal statutes, which may differ significantly from amounts computed, on a quarterly basis, using an overall effective income tax rate
25
Three Months Ended March 31, (in thousands) 2010 2009
Service Cost—Benefit Earned During the Period $ 165 $ 188 Interest Cost on Projected Benefit Obligation 418 424 Amortization of Prior-Service Cost 18 18 Amortization of Net Actuarial Loss 119 96
Net Periodic Pension Cost $ 720 $ 726
Three Months Ended March 31, (in thousands) 2010 2009
Service Cost—Benefit Earned During the Period $ 425 $ 301 Interest Cost on Projected Benefit Obligation 775 753 Amortization of Transition Obligation 187 187 Amortization of Prior-Service Cost 50 53 Amortization of Net Actuarial Loss 188 1 Effect of Medicare Part D Expected Subsidy (500 ) (297 )
Net Periodic Postretirement Benefit Cost $ 1,125 $ 998
March 31, 2010 December 31, 2009 Carrying Carrying (in thousands) Amount Fair Value Amount Fair Value
anticipated for the full year. North Dakota wind energy credits are based on dollars invested in qualifying facilities and are being recognized on a straight-line basis over 25 years. The Company utilizes this method of recognizing PTCs for specific reasons, including that PTCs are an integral part of the financial viability of most wind projects and a fundamental component of such wind projects’ results of operations.
17. Subsequent Events
Stock Incentive Awards —On April 12, 2010 the Company’s Board of Directors granted 26,180 restricted stock units to key employees under the 1999 Stock Incentive Plan, as amended (Incentive Plan), payable in common shares on April 8, 2014, the date the units vest. The grant date fair value of each restricted stock unit was $17.76 per share based on the market value of the Company’s common stock on April 12, 2010, discounted for the value of the dividend exclusion over the four-year vesting period.
On April 12, 2010 the Company’s Board of Directors granted 24,800 shares of restricted stock to the Company’s nonemployee directors and 31,600 shares of restricted stock to the Company’s executive officers, including OTP’s president, under the Incentive Plan. The restricted shares vest 25% per year on April 8 of each year in the period 2011 through 2014 and are eligible for full dividend and voting rights. The grant date fair value of each share of restricted stock was $21.835 per share, the average market price on the date of grant.
On April 12, 2010 the Company’s Board of Directors granted performance share awards to the Company’s executive officers under the Incentive Plan. Under these awards, the Company’s executive officers could earn up to an aggregate of 146,800 common shares based on the Company’s total shareholder return relative to the total shareholder return of the companies that comprise the Edison Electric Institute Index over the performance period of January 1, 2010 through December 31, 2012. The aggregate target share award is 73,400 shares. Actual payment may range from zero to 200% of the target amount. The executive officers have no voting or dividend rights related to these shares until the shares, if any, are issued at the end of the performance period. The grant date fair value of the target amount common shares projected to be awarded was $20.97 per share, as determined under a Monte Carlo simulation valuation method. The terms of these awards are such that the entire award will be classified and accounted for as a liability, as required under ASC 718-10-25-18, and will be measured over the performance period based on the fair value of the award at the end of each reporting period subsequent to the grant date.
Federal Income Tax Refund —On May 3, 2010 the Company received a federal income tax refund of $42.3 million related to the carry-back of 2009 net operating losses for tax purposes to prior years.
2010 Minnesota General Rate Case Filing —OTP filed a general rate case in Minnesota on April 2, 2010 requesting an interim rate increase of approximately 3.8% or $5.0 million in annual revenue, effective June 1, 2010, and a final overall rate increase of approximately 8.0% or $10.6 million in annual revenue. If approved by the MPUC, interim rates will remain in effect for all Minnesota customers until the MPUC makes a final determination on the request, which is expected to occur in 2011. If final rates are lower than interim rates, OTP will refund Minnesota customers the difference with interest.
Credit Agreement Renewal —On May 4, 2010 the Company entered into a $200 million Second Amended and Restated Credit Agreement (the Credit Agreement) with the banks named therein, including U.S. Bank National Association, a national banking association, as administrative agent for the Banks and as Lead Arranger, Bank of America, N.A. and JPMorgan Chase Bank, National Association, as Co-Syndication Agents, and KeyBank National Association, as Documentation Agent. The Credit Agreement amends and restates the Company’s $200 million credit agreement dated as of December 23, 2008, and is an unsecured revolving credit facility that the Company can draw on to support its nonelectric operations. Borrowings under the Credit Agreement bear interest at LIBOR plus 3.25%, subject to adjustment based on the Company’s senior unsecured credit ratings. The Credit Agreement expires on May 4, 2013. The Credit Agreement contains a number of restrictions on the Company and the businesses of Varistar and its material subsidiaries, including restrictions on their ability to merge, sell assets, incur indebtedness, create or incur liens on assets, guarantee the obligations of certain other parties and engage in transactions with related parties. The Credit Agreement also contains affirmative covenants and events of default. The Credit Agreement does not include provisions for the termination of the agreement or the acceleration of repayment of amounts outstanding due to changes in the Company’s credit ratings. The Company’s obligations under the Credit Agreement are guaranteed by Varistar and its material subsidiaries. Outstanding letters of credit issued by the Company under the Credit Agreement can reduce the amount available for borrowing under the line by up to $50 million. The Credit Agreement has an accordion feature whereby the line can be increased to $250 million as described in the Credit Agreement.
26
Table of Contents
Item 2. Management’s Discussion and Analysis of Financial Condition and Results of Operations
RESULTS OF OPERATIONS
Following is an analysis of our operating results by business segment for the three months ended March 31, 2010 and 2009, followed by a discussion of changes in our consolidated financial position during the three months ended March 31, 2010 and our expectations for the remainder of 2010.
Comparison of the Three Months Ended March 31, 2010 and 2009
Consolidated operating revenues were $262.2 million for the three months ended March 31, 2010 compared with $277.2 million for the three months ended March 31, 2009. Operating income was $16.0 million for the three months ended March 31, 2010 compared with $8.6 million for the three months ended March 31, 2009. The Company recorded diluted earnings per share of $0.13 for the three months ended March 31, 2010 compared to $0.12 for the three months ended March 31, 2009.
Amounts presented in the segment tables that follow for operating revenues, cost of goods sold and other nonelectric operating expenses for the three month periods ended March 31, 2010 and 2009 will not agree with amounts presented in the consolidated statements of income due to the elimination of intersegment transactions. The amounts of intersegment eliminations by income statement line item are listed below:
Electric
The increase in retail sales revenues mainly is due to the following: (1) a $1.7 million increase in revenues related to a general rate increase in South Dakota which began in May 2009, (2) a $1.4 million increase in Minnesota resource recovery and transmission rider revenues, (3) a $0.9 million increase in North Dakota resource recovery rider revenues, (4) a $0.5 million increase in Minnesota Conservation Investment Program (CIP) surcharge revenues, and (5) an additional Minnesota interim rate refund accrual of $0.5 million in the first quarter of 2009, partially offset by (6) a $2.1 million reduction in Fuel Clause Adjustment revenues related to a decrease in fuel and purchased power costs incurred to serve retail customers, and (7) a 2.3% decrease in retail kilowatt-hour (kwh) sales related to a 9.6% reduction in heating-degree-days between the quarters.
27
Intersegment Eliminations (in thousands) March 31, 2010 March 31, 2009
Operating Revenues: Electric $ 72 $ 62 Nonelectric 881 937
Cost of Goods Sold 751 840 Other Nonelectric Expenses 202 159
Three Months Ended March 31, % (in thousands) 2010 2009 Change Change
Retail Sales Revenues $ 81,013 $ 79,055 $ 1,958 2.5 Wholesale Revenues – Company Generation 3,992 4,404 (412 ) (9.4 ) Net Revenue – Energy Trading Activity 2,007 1,393 614 44.1 Other Revenues 4,074 3,689 385 10.4
Total Operating Revenues $ 91,086 $ 88,541 $ 2,545 2.9 Production Fuel 20,909 18,659 2,250 12.1 Purchased Power – System Use 12,056 17,373 (5,317 ) (30.6 ) Other Operation and Maintenance Expenses 28,322 26,930 1,392 5.2 Depreciation and Amortization 10,037 8,988 1,049 11.7 Property Taxes 2,474 2,490 (16 ) (0.6 )
Operating Income $ 17,288 $ 14,101 $ 3,187 22.6
Table of Contents
Wholesale electric revenues from company-owned generation decreased as a result of an 11.8% decrease in wholesale kwh sales, partially offset by a 2.7% increase in the average price per kwh sold. Net revenue from energy trading activity, including net mark-to-market gains on forward energy contracts, increased mainly as a result of an increase in net mark-to-market gains recognized on forward purchases and sales of electricity entered into in the first quarter of 2010 and scheduled for settlement in the second and third quarters of 2010. The increase in other electric revenues reflects a $0.2 million increase in revenues from contracted services and a $0.2 million increase in transmission services related revenue.
The increase in fuel costs is due to a 10.2% increase in kwhs generated from Otter Tail Power Company’s (OTP’s) fuel-fired plants combined with a 1.7% increase in the price of fuel per kwh generated. The decrease in purchased power – system use is due to a 45.3% decrease in kwhs purchased for retail sales, partially offset by a 26.9% increase in the cost per kwh purchased. The decrease in kwh purchases for system use is due to an increase in kwhs generated at company-owned plants in combination with a decrease in retail kwh sales.
The increase in other operation and maintenance expenses is due to higher Minnesota CIP recognized program costs, increased dues and subscription expenses, wage increases for employees under union contracts and increases in regulatory filing fees, insurance costs and storm repair expenses.
The increase in depreciation expense is mainly due to the addition of 33 wind turbines at the Luverne Wind Farm that were placed in service in September 2009.
Plastics
Operating revenues for the plastics segment increased as result of a 42.4% increase in pounds of pipe sold combined with a 20.2% increase in the price per pound of polyvinyl chloride (PVC) pipe sold. The increase in costs of goods sold was related to the increase in pounds of pipe sold partially offset by a 10.9% decrease in the cost per pound of pipe sold. The increased profitability between the quarters was also impacted by the sell-off of higher priced finished goods inventory in the first quarter of 2009. The decrease in operating expenses related to reductions in salary and benefit costs.
28
Three Months Ended March 31, % (in thousands) 2010 2009 Change Change
• Revenues at DMI Industries, Inc. (DMI) decreased $8.9 million as production activity was reduced to match customer delivery schedules.
• Revenues at BTD Manufacturing, Inc. (BTD) decreased $4.7 million due to a decrease in sales volume. However, improved productivity on work completed and increased prices for scrap metal contributed to a $0.7 million increase in operating income at BTD.
• Revenues at T.O. Plastics, Inc. (T.O. Plastics) increased $0.5 million due to increased sales of horticultural products.
• Revenues at ShoreMaster, Inc. (ShoreMaster) decreased $4.3 million mainly due to a lower volume of sales of commercial products but also due to reduced sales of residential products.
• Cost of goods sold at DMI decreased $8.7 million as a result of decreased production levels and productivity improvements.
• Cost of goods sold at BTD decreased $5.1 million as a result of decreased sales volume and because the first quarter of 2009 included a $1.1 million reduction in the price of finished goods inventory.
• Cost of goods sold at T.O. Plastics increased $0.1 million as a result of increased sales of horticultural products.
• Cost of goods sold at ShoreMaster decreased $3.9 million mainly due to the decrease in sales of commercial products and $0.9 million in additional costs incurred on a commercial project in the first quarter of 2009.
• Operating expenses at DMI decreased $0.6 million as a result of decreases in employee benefit costs and reductions in insurance expenses related to safety improvements. The decrease also reflects a $0.2 million loss on an asset sale in the first quarter of 2009.
• Operating expenses at BTD decreased $0.5 million. In the first quarter of 2009, BTD spent $0.6 million on implementation of a management program designed to improve productivity across the organization. No similar costs were incurred in the first quarter of 2010.
• Operating expenses at T.O. Plastics increased $0.2 million mainly due to increased salary and benefit costs related to new hires in engineering and sales positions.
• Operating expenses at ShoreMaster decreased $2.5 million, reflecting a $1.8 million reduction in product recall and testing costs, a $0.4 million reduction in bad debt expense and a $0.4 million decrease in salary and payroll tax expenses. ShoreMaster’s first quarter 2009 expenses included $1.4 million in costs related to the recall of certain trampoline products and $0.4 million in costs to test imported products for lead/phthalate content.
Table of Contents
Health Services
A $3.6 million decrease in revenues from scanning and other related services related to a 9.1% decrease in scans performed combined with a 5.5% decrease in revenue per scan was partially offset by a $0.6 million increase in revenue from equipment sales and servicing. The decrease in cost of goods sold was directly related to the decreases in sales revenue. The decrease in operating expenses includes a $0.2 million gain on sale of an asset in the first quarter of 2010 and a $0.2 million reduction in sales and marketing salaries and expenses. The imaging side of the business continues to be affected by less-than-optimal utilization of certain imaging assets. The increase in depreciation expense reflects an increase in owned equipment related to the purchase of assets coming off lease.
Food Ingredient Processing
The decrease in food ingredient processing revenues is due to a 0.4% decrease in pounds of product sold, combined with a 5.5% decrease in the price per pound of product sold. The decrease in cost of goods sold reflects a 9.4% decrease in the cost per pound of product sold mainly due to a decrease in raw potato costs. The increase in operating expenses is mainly due to salary and benefit cost increases.
Other Business Operations
The decrease in revenues in the other business operations segment relates to the following:
30
Three Months Ended March 31, % (in thousands) 2010 2009 Change Change
• Revenues at Foley Company decreased $6.3 million due to a decrease in volume of completed projects due to unfavorable winter weather conditions in the first quarter of 2010 compared to the first quarter of 2009.
• Revenues at Aevenia, Inc. (Aevenia), our electrical design and construction services company, decreased $0.9 million as a result of a reduction in work volume.
Table of Contents
The decrease in cost of goods sold in the other business operations segment relates to the following:
A reduction in construction activity due to the economic recession and related credit constraints has led to excess capacity in the construction industry, resulting in a highly competitive bidding environment and lower margins on available work.
The increase in operating expenses in the other business operations segment is due to the following:
Corporate
Corporate includes items such as corporate staff and overhead costs, the results of our captive insurance company and other items excluded from the measurement of operating segment performance. Corporate is not an operating segment. Rather it is added to operating segment totals to reconcile to totals on our consolidated statements of income.
The increase in corporate operating expenses reflects an increase in general and administrative expenses related to increased employee benefit costs.
Interest Charges
Interest charges increased $2.8 million in the first three months of 2010 compared with the first three months of 2009 as a result of a $94.1 million increase in the average balance of long-term debt outstanding combined with an increase in the average rate of interest paid on outstanding long-term debt between the quarters. The December 2009 issuance of $100 million of 9.000% Notes, due 2016 contributed $2.3 million to the increase in interest expenses between the quarters.
Other Income
Other income decreased $0.5 million in the first three months of 2010 compared with the first three months of 2009 as a result of foreign currency transaction losses incurred in the Canadian operations of DMI and Idaho Pacific Holdings, Inc. (IPH) in the first quarter of 2010 related to fluctuations in foreign currency exchange rates between the Canadian and U.S. dollar during the quarter.
31
• Revenues at E.W. Wylie Corporation (Wylie) increased $1.6 million as a result of a 34.7% increase in miles driven by company-owned and owner-operated trucks, partially offset by a 6.8% reduction in revenue per mile.
• Cost of goods sold at Foley Company decreased $3.7 million, mainly in the area of subcontractor costs as Foley’s work volume was down in the first quarter of 2010.
• Cost of goods sold at Aevenia decreased $0.6 million, mainly due to a decrease in labor costs related to a reduction of jobs in progress.
• Operating expenses at Foley Company increased $0.2 million between the quarters mainly for salaries and insurance.
• Operating expenses at Aevenia increased $0.1 million between the quarters.
• Operating expenses at Wylie increased $1.4 million between the quarters related to the increase in miles driven by company-owned and owner-operated trucks. Subcontractor expenses increased $0.7 million as a result of a 57.1% increase in miles driven by owner-operated trucks. Labor costs increased by $0.5 million as a result of a 26.1% increase in miles driven by company-owned trucks. Equipment rental costs increased by $0.2 million due to the leasing of additional equipment.
Three Months Ended March 31, % (in thousands) 2010 2009 Change Change
Income taxes increased $3.8 million in the first quarter of 2010 compared with the first quarter of 2009 as a result of the following: (1) a $4.1 million increase in income before income taxes, (2) a charge of $1.7 million in the first quarter of 2010 related to the enactment of new federal health care legislation in March 2010 which resulted in the reversal of previously recognized deferred tax assets due to the elimination of the tax deduction for retiree prescription drug benefits that qualify for the Medicare Part D retiree drug subsidy, and (3) the benefit of production tax credits (PTCs) and North Dakota wind energy credits related to OTP’s wind projects of approximately $1.8 million in the first of quarter of 2010 and $2.1 million in the first of quarter of 2009.
Our effective income tax rates for the three months ended March 31, 2010 and 2009 were approximately 33.5% and (46.0%), respectively. Our effective income tax rate for the three months ended March 31, 2010 was increased by the $1.7 million charge related to the enactment of new federal health care legislation in March 2010. Reductions from the federal statutory rate reflect the benefit of the PTCs and North Dakota wind energy credits in the respective quarters. Federal production tax credits are recognized as wind energy is generated based on a per kwh rate prescribed in applicable federal statutes. North Dakota wind energy credits are based on dollars invested in qualifying facilities and are being recognized on a straight-line basis over 25 years.
FINANCIAL POSITION
The following table presents the status of our lines of credit as of March 31, 2010 and December 31, 2009:
We believe we have the necessary liquidity to effectively conduct business operations for an extended period if current market conditions continue. Our balance sheet is strong and we are in compliance with our debt covenants. Our dividend payout ratio for the year ended December 31, 2009 was 168% compared to 108% and 66% for the years ended December 31, 2008 and 2007, respectively. Our current indicated annual dividend would result in a dividend per share of $1.19 in 2010. The determination of the amount of future cash dividends to be declared and paid will depend on, among other things, our financial condition, cash flows from operations, the level of our capital expenditures, restrictions under our credit facilities and our future business prospects.
Financial flexibility is provided by operating cash flows, unused lines of credit, strong financial coverages, solid credit ratings, and alternative financing arrangements such as leasing. We believe our financial condition is strong and that our cash, other liquid assets, operating cash flows, existing lines of credit, access to capital markets and borrowing ability because of solid credit ratings, when taken together, provide adequate resources to fund ongoing operating requirements and future capital expenditures related to expansion of existing businesses and development of new projects. Equity or debt financing will be required in the period 2010 through 2014 given the expansion plans related to our electric segment to fund construction of new rate base investments, in the event we decide to reduce borrowings under our lines of credit, refund or retire early any of our presently outstanding debt or cumulative preferred shares, to complete acquisitions or for other corporate purposes.
DMI has a $40 million receivable purchase agreement whereby designated customer accounts receivable may be sold to General Electric Capital Corporation on a revolving basis. The agreement expires in March 2011. Accounts receivable totaling $10.8 million were sold in the first quarter of 2010. Discounts, fees and commissions charged to operating expense for the three months ended March 31, 2010 and 2009 were $32,000 and $175,000, respectively. The balance of receivables sold that was outstanding to the buyer as of March 31, 2010 was $5.8 million. The sales of these accounts receivable are reflected as a reduction of accounts receivable in our consolidated balance sheets and the proceeds are included in the cash flows from operating activities in our consolidated statement of cash flows.
32
In Use on Restricted due to Available on Available on March 31, Outstanding March 31, December 31, (in thousands) Line Limit 2010 Letters of Credit 2010 2009
1 On January 4, 2010, OTP paid off the remaining $58.0 million balance outstanding on its two-year, $75.0 million term loan that was originally due on May 20, 2011, using lower cost funds available under the OTP Credit Agreement. OTP did not incur any penalties for the early repayment and retirement of this debt.
Table of Contents
Cash used in operating activities was $22.7 million for the three months ended March 31, 2010 compared with cash provided by operating activities of $21.9 million for the three months ended March 31, 2009. The $44.6 million decrease in operating cash flows is mainly due to increases of $21.0 million in costs in excess of billings, $20.5 million in accounts receivable and $10.0 million in inventories in the first quarter of 2010.
Net cash used in investing activities was $18.1 million for the three months ended March 31, 2010 compared with $28.8 million for the three months ended March 31, 2009. Cash used for capital expenditures decreased by $9.1 million between the quarters mainly due to a $9.5 million decrease in capital expenditures in the manufacturing segment related to first quarter 2009 capital additions at DMI and BTD. Capital expenditures in the first quarter of 2010 include $6.7 million at OTP and $6.2 million in the health services segment. Capital expenditures in the health services segment included the purchase of imaging assets coming off lease.
Net cash provided by financing activities was $36.6 million for the three months ended March 31, 2010 compared with $2.2 million for the three months ended March 31, 2009. Proceeds from short-term borrowings and checks written in excess of cash of $106.2 million in the first quarter of 2010 compared to proceeds from short-term borrowings of $14.1 million in the first quarter of 2009. We paid $58.4 million to retire long-term debt in the first quarter of 2010 compared to $1.0 million in the first quarter of 2009. Proceeds from short-term borrowings and checks written in excess of cash of $106.2 million in the first quarter of 2010 were used to retire early $58 million in long-term debt used to finance construction of 33 wind turbines at the Luverne Wind Farm, to finance first quarter 2010 capital expenditures and to fund a portion of the increase in working capital items in the first quarter of 2010.
Our “Operating Lease Obligations” reported in the table on page 53 of our Annual Report on Form 10-K for the year ended December 31, 2009 have increased by $0.2 million for 2010 and $1.1 million for 2011 and 2012 related to an agreement to renew a lease for rail cars to transport coal to Hoot Lake Plant from September 2010 through August 2012.
Our operating cash flow and access to capital markets can be impacted by macroeconomic factors outside our control. In addition, our borrowing costs can be impacted by changing interest rates on short-term and long-term debt and ratings assigned to us by independent rating agencies, which in part are based on certain credit measures such as interest coverage and leverage ratios. There can be no assurance that any additional required financing will be available through bank borrowings, debt or equity financing or otherwise, or that if such financing is available, it will be available on terms acceptable to us. If adequate funds are not available on acceptable terms, our businesses, results of operations and financial condition could be adversely affected.
On May 11, 2009 we filed a shelf registration statement with the Securities and Exchange Commission under which we may offer for sale, from time to time, either separately or together in any combination, equity, debt or other securities described in the shelf registration statement. On March 17, 2010, we entered into a Distribution Agreement (the Agreement) with J.P. Morgan Securities Inc. (JPMS). Pursuant to the terms of the Agreement, we may offer and sell our common shares from time to time through JPMS, as our distribution agent for the offer and sale of the shares, up to an aggregate sales price of $75,000,000. Under the Agreement, we will designate the minimum price and maximum number of shares to be sold through JPMS on any given trading day or over a specified period of trading days, and JPMS will use commercially reasonable efforts to sell such shares on such days, subject to certain conditions. We are not obligated to sell and JPMS is not obligated to buy or sell any of the shares under the Agreement. No assurance can be given that we will sell any of the shares under the Agreement, or, if we do, as to the price or amount of shares we sell, or the dates when such sales will take place. The shares, if issued, will be issued pursuant to our shelf registration statement, as amended.
On May 4, 2010 we entered into a $200 million Second Amended and Restated Credit Agreement (the Credit Agreement) with the banks named therein, including U.S. Bank National Association, a national banking association, as administrative agent for the Banks and as Lead Arranger, Bank of America, N.A. and JPMorgan Chase Bank, National Association, as Co-Syndication Agents, and KeyBank National Association, as Documentation Agent. The Credit Agreement amends and restates our $200 million credit agreement dated as of December 23, 2008, and is an unsecured revolving credit facility that we can draw on to support our nonelectric operations. Borrowings under the Credit Agreement bear interest at LIBOR plus 3.25%, subject to adjustment based on our senior unsecured credit ratings. The Credit Agreement expires on May 4, 2013. The Credit Agreement contains a number of restrictions on us and the businesses of Varistar and its material subsidiaries, including restrictions on their ability to merge, sell assets, incur indebtedness, create or incur liens on assets, guarantee the obligations of certain other parties and engage in transactions with related parties. The Credit Agreement also contains affirmative covenants and events of default. The Credit
33
Table of Contents
Agreement does not include provisions for the termination of the agreement or the acceleration of repayment of amounts outstanding due to changes in our credit ratings. Our obligations under the Credit Agreement are guaranteed by Varistar and its material subsidiaries. Outstanding letters of credit issued by us under the Credit Agreement can reduce the amount available for borrowing under the line by up to $50 million. The Credit Agreement has an accordion feature whereby the line can be increased to $250 million as described in the Credit Agreement.
OTP is the borrower under the $170 million credit agreement referred to in the table above (the OTP Credit Agreement) with an accordion feature whereby the line can be increased to $250 million as described in the OTP Credit Agreement. The credit agreement was entered into between OTP and JPMorgan Chase Bank, N.A., Wells Fargo Bank, National Association and Merrill Lynch Bank USA, as Banks, U.S. Bank National Association, as a Bank and as agent for the Banks, and Bank of America, N.A., as a Bank and as Syndication Agent. The OTP Credit Agreement is an unsecured revolving credit facility that OTP can draw on to support the working capital needs and other capital requirements of its operations. Borrowings under this line of credit bear interest at LIBOR plus 0.5%, subject to adjustment based on the ratings of the borrower’s senior unsecured debt. The OTP Credit Agreement contains a number of restrictions on the business of OTP, including restrictions on its ability to merge, sell assets, incur indebtedness, create or incur liens on assets, guarantee the obligations of any other party, and engage in transactions with related parties. The OTP Credit Agreement also contains affirmative covenants and events of default. The OTP Credit Agreement does not include provisions for the termination of the agreement or the acceleration of repayment of amounts outstanding due to changes in the borrower’s credit ratings. The OTP Credit Agreement is subject to renewal on July 30, 2011. The OTP Credit Agreement is an obligation of OTP.
In November 2009, OTP paid down $17 million of its two-year, $75 million term loan, originally due May 11, 2011. OTP paid off the remaining $58 million balance in January 2010 using lower cost funds available under the OTP Credit Agreement. OTP did not incur any penalties for the early repayments and retirement of this debt.
On May 3, 2010 we received a federal income tax refund of $42.3 million related to the carry-back of 2009 net operating losses for tax purposes to prior years. The majority of these funds were used to repay borrowings under the OTP Credit Agreement.
The note purchase agreement relating to the $90 million 6.63% senior notes due December 1, 2011, as amended (the 2001 Note Purchase Agreement), the note purchase agreement relating to the $50 million 8.89% senior note due November 30, 2017, as amended (the Cascade Note Purchase Agreement), and the note purchase agreement relating to the $155 million senior unsecured notes issued in four series consisting of $33 million aggregate principal amount of 5.95% Senior Unsecured Notes, Series A, due 2017; $30 million aggregate principal amount of 6.15% Senior Unsecured Notes, Series B, due 2022; $42 million aggregate principal amount of 6.37% Senior Unsecured Notes, Series C, due 2027; and $50 million aggregate principal amount of 6.47% Senior Unsecured Notes, Series D, due 2037, as amended (the 2007 Note Purchase Agreement) each states that the applicable obligor may prepay all or any part of the notes issued thereunder (in an amount not less than 10% of the aggregate principal amount of the notes then outstanding in the case of a partial prepayment) at 100% of the principal amount prepaid, together with accrued interest and a make-whole amount. Each of the Cascade Note Purchase Agreement and the 2001 Note Purchase Agreement states in the event of a transfer of utility assets put event, the noteholders thereunder have the right to require the applicable obligor to repurchase the notes held by them in full, together with accrued interest and a make-whole amount, on the terms and conditions specified in the respective note purchase agreements. The 2007 Note Purchase Agreement states the applicable obligor must offer to prepay all of the outstanding notes issued thereunder at 100% of the principal amount together with unpaid accrued interest in the event of a change of control of such obligor. The 2001 Note Purchase Agreement, the 2007 Note Purchase Agreement and the Cascade Note Purchase Agreement each contain a number of restrictions on the applicable obligor and its subsidiaries. These include restrictions on the obligor’s ability and the ability of the obligor’s subsidiaries to merge, sell assets, create or incur liens on assets, guarantee the obligations of any other party, and engage in transactions with related parties. Our obligations under the Cascade Note Purchase Agreement remain guaranteed by Varistar and certain of its material subsidiaries.
34
Table of Contents
Financial Covenants
As of March 31, 2010 the Company was in compliance with the financial statement covenants that existed in its debt agreements.
None of the Credit and Note Purchase Agreements contains any provisions that would trigger an acceleration of the related debt as a result of changes in the credit rating levels assigned to the related obligor by rating agencies.
Our borrowing agreements are subject to certain financial covenants. Specifically:
Our ratings at March 31, 2010 were:
Our disclosure of these securities ratings is not a recommendation to buy, sell or hold our securities. Downgrades in these securities ratings could adversely affect our company. Downgrades could increase our borrowing costs resulting in possible reductions to net income in future periods and increase the risk of default on our debt obligations.
We do not have any off-balance-sheet arrangements or any material relationships with unconsolidated entities or financial partnerships.
35
• Under the Credit Agreement, we may not permit the ratio of our Interest-bearing Debt to Total Capitalization to be greater than 0.60 to 1.00 or permit our Interest and Dividend Coverage Ratio to be less than 1.50 to 1.00 (each measured on a consolidated basis), as provided in the Credit Agreement.
• Under the Cascade Note Purchase Agreement, we may not permit our ratio of Consolidated Debt to Consolidated Total Capitalization to be greater than 0.60 to 1.00 or our Interest Charges Coverage Ratio to be less than 1.50 to 1.00 (each measured on a consolidated basis), permit the ratio of OTP’s Debt to OTP’s Total Capitalization to be greater than 0.60 to 1.00, or permit Priority Debt to exceed 20% of Varistar Consolidated Total Capitalization, as provided in the Cascade Note Purchase Agreement.
• Under the OTP Credit Agreement, OTP may not permit the ratio of its Interest-bearing Debt to Total Capitalization to be greater than 0.60 to 1.00 or permit its Interest and Dividend Coverage Ratio to be less than 1.50 to 1.00, as provided in the OTP Credit Agreement.
• Under the 2001 Note Purchase Agreement, the 2007 Note Purchase Agreement and the financial guaranty insurance policy with Ambac Assurance Corporation relating to certain pollution control refunding bonds, OTP may not permit the ratio of its Consolidated Debt to Total Capitalization to be greater than 0.60 to 1.00 or permit its Interest and Dividend Coverage Ratio (or, in the case of the 2001 Note Purchase Agreement, its Interest Charges Coverage Ratio) to be less than 1.50 to 1.00, in each case as provided in the related borrowing or insurance agreement. In addition, under the 2001 Note Purchase Agreement and the 2007 Note Purchase Agreement, OTP may not permit its Priority Debt to exceed 20% of its Total Capitalization, as provided in the related agreement.
Moody’s Investors Standard Otter Tail Corporation Service Fitch Ratings & Poor’s Corporate Credit/Long-Term Issuer Default Rating Baa3 BBB- BBB- Senior Unsecured Debt Baa3 BBB- BB+ 9.000% Notes Due 2016 Ba1 BBB- BB+ Outlook Stable Stable Stable Moody’s Investors Standard Otter Tail Power Company Service Fitch Ratings & Poor’s Corporate Credit/Long-Term Issuer Default Rating A3 BBB BBB- Senior Unsecured Debt A3 BBB+ BBB- Outlook Stable Stable Stable
Table of Contents
2010 EXPECTATIONS
The statements in this section are based on our current outlook for 2010 and are subject to risks and uncertainties described under “Forward Looking Information — Safe Harbor Statement Under the Private Securities Litigation Reform Act of 1995.”
We reaffirm our 2010 diluted earnings per share to be in the range of $1.00 to $1.40. This guidance considers the cyclical nature of some of our businesses and reflects challenges presented by current economic conditions, as well as our plans and strategies for improving operating results as the economy recovers. Our current consolidated capital expenditures expectation for 2010 is in the range of $75 million to $85 million. This compares with $177 million of capital expenditures in 2009. We continue to explore investments in generation and transmission projects for the electric segment that could have a positive impact on our earnings and returns on capital in the future.
Contributing to our earnings guidance for 2010 are the following:
36
• We expect lower levels of net income from our electric segment in 2010. This decrease is due to continued soft wholesale power markets, lower AFUDC earnings as there are no large construction projects expected this year, and increased operating and maintenance expense in 2010 due primarily to higher employee benefit costs. Expectations for 2010 reflect an interim rate increase of approximately $2.9 million in revenue in the Minnesota jurisdiction. OTP filed for a revenue increase in Minnesota on April 2, 2010 requesting an interim rate increase of 3.8%, approximately $5.0 million in annual revenue, effective June 1, 2010, and a final overall rate increase of 8.0%, approximately $10.6 million in annual revenue.
• We expect our plastics segment’s 2010 performance to improve from 2009 results, with net earnings now expected to be in a range from $0.7 million to $1.5 million.
• We expect earnings from our manufacturing segment to improve in 2010 as a result of the following:
o Improved earnings are expected at BTD in 2010 due to productivity improvements and cost reductions made in 2009.
o A reduction in net losses is expected at ShoreMaster in 2010 given the restructuring of costs that occurred in 2009. ShoreMaster continues to be affected by current depressed economic conditions and does not expect any significant improvement to overall business conditions until later in the cycle of economic recovery.
o Improved earnings are expected at DMI in 2010 due to a better backlog of business in 2010 and continued improvements in productivity from cost controls implemented in 2009.
o Slightly better earnings are expected at T. O. Plastics in 2010 compared with 2009.
o Backlog in place in the manufacturing segment is approximately $217 million for the remainder of 2010 compared with $152 million one year ago.
• We expect increased net income from our health services segment in 2010. In an effort to right-size its fleet of imaging assets, health services is not renewing leases on a large number of imaging assets that come off lease in 2010. This will result in a lower level of rental costs in 2010.
• We now expect net income from our food ingredient processing business in 2010 to be in the range of $5 million to $7 million.
• We expect our other business operations segment to have improved earnings in 2010 compared with 2009. Backlog in place for the construction businesses is $85 million for the remainder of 2010 compared with the same amount one year ago.
• We expect corporate general and administrative costs to return to more normal levels in 2010.
The discussion and analysis of the financial statements and results of operations are based on our consolidated financial statements, which have been prepared in accordance with accounting principles generally accepted in the United States of America. The preparation of these consolidated financial statements requires management to make estimates and judgments that affect the reported amounts of assets, liabilities, revenues and expenses, and related disclosure of contingent assets and liabilities.
We use estimates based on the best information available in recording transactions and balances resulting from business operations. Estimates are used for such items as depreciable lives, asset impairment evaluations, tax provisions, collectability of trade accounts receivable, self-insurance programs, unbilled electric revenues, accrued renewable resource and transmission rider revenues, valuations of forward energy contracts, service contract maintenance costs, percentage-of-completion and actuarially determined benefits costs and liabilities. As better information becomes available or actual amounts are known, estimates are revised. Operating results can be affected by revised estimates. Actual results may differ from these estimates under different assumptions or conditions. Management has discussed the application of these critical accounting policies and the development of these estimates with the Audit Committee of the Board of Directors. A discussion of critical accounting policies is included under the caption “Critical Accounting Policies Involving Significant Estimates” on pages 58 through 62 of our Annual Report on Form 10-K for the year ended December 31, 2009. There were no material changes in critical accounting policies or estimates during the quarter ended March 31, 2010.
GOODWILL IMPAIRMENT
We currently have $12.2 million of goodwill and $4.9 million in nonamortizable trade names recorded on our balance sheet related to the acquisition of ShoreMaster and its subsidiary companies. ShoreMaster produces and markets residential and commercial waterfront equipment, ranging from boatlifts and docks for lakefront property to full commercial marina projects. The business has experienced reduced demand for its products due to the recent economic recession and has incurred net losses. We considered these adverse developments in the business to be an indicator of potential impairment of ShoreMaster’s goodwill and other intangible assets.
Based on our goodwill review in January 2010, we concluded that no impairment charge was necessary. No events occurred in the first quarter of 2010 that would change our current conclusions on the impairment of this goodwill. We continue to monitor ShareMaster’s business conditions for any triggering event that would cause us to accelerate our goodwill review from our normal testing timeframes. If current economic conditions continue to impact the amount of sales of waterfront products and ShoreMaster is not successful with reorganizing and streamlining its business to improve operating margins according to our projections, the reductions in anticipated cash flows from this business may indicate, in a future period, that its fair value is less than its carrying amount resulting in an impairment of some or all of the goodwill and nonamortizable intangible assets associated with ShoreMaster along with a corresponding charge against earnings.
ShoreMaster’s operating plan calls for modest revenue growth in 2010 in line with growth in gross domestic product. With the cost reduction efforts that have occurred over the past year, a reduction in net losses is expected by ShoreMaster in 2010. Given the nature of ShoreMaster’s products and the markets it serves, our operating plans assume revenue and earnings growth will begin to occur in 2011. These revenue growth assumptions are consistent with ShoreMaster’s historical growth rates before the recent economic downturn. Inherent in these assumptions is that ShoreMaster’s manufacturing capacity utilization will increase from current utilization of 40% to approximately 70% of capacity for the year ending 2014. ShoreMaster is expecting its dealer base to grow during this period of time which is reasonable given its historic ability to grow its dealer base. ShoreMaster has not experienced any deterioration in its dealer base during the economic downturn. ShoreMaster continues to be affected by current depressed economic conditions, as evidenced by lower revenue in the first quarter of 2010 compared with the first quarter of 2009 and internal expectations for the first quarter of 2010.
The weighted average cost of capital used for this analysis was 13.3% which is reflective of the risks inherent in ShoreMaster’s industry. This compares with the previous weighted average cost of capital of 12% which was used in our 2008 annual goodwill review for ShoreMaster. We used a terminal value growth rate of 3% in this discounted cash flow analysis.
37
Table of Contents
The operating plan with its assumptions shows the following:
The following changes in our assumptions would have the following impact on these estimated values:
Should the assumptions used in these operating plans not materialize and the market value of ShoreMaster’s common equity be significantly below its book value, an impairment charge of up to $17.1 million could be recorded.
We currently have $12.0 million of goodwill and $0.7 million in nonamortizable trade names recorded on our balance sheet related to the acquisition of BTD and its subsidiary companies. BTD provides stamped metal parts and fabricated metal products to a number of equipment and product manufacturers and assemblers throughout the United States. We expect BTD to return to 2008 revenue and earnings levels by 2012. If current economic conditions continue to impact sales of manufactured metal products and BTD is not able to achieve sales and earnings consistent with 2008 levels as projected, the reductions in anticipated cash flows from this business may indicate, in a future period, that its fair value is less than its carrying value resulting in an impairment of some or all of the goodwill and nonamortizable intangible assets associated with BTD along with a corresponding charge against earnings.
No events occurred in the first quarter of 2010 that would change our current conclusions on the impairment of this goodwill. We continue to monitor BTD’s business conditions for any triggering event that would cause us to accelerate our goodwill review from our normal testing timeframes.
An impairment charge consisting of the goodwill and nonamortizable intangible assets of both ShoreMaster and BTD combined would not have a significant impact on our financial position and would not put us in violation of our debt covenants.
We evaluate goodwill for impairment on an annual basis and as conditions warrant. As of December 31, 2009 an assessment of the carrying amounts of our goodwill indicated no impairment and the fair values of our remaining reporting units are substantially in excess of their respective book values.
38
(in thousands)
Enterprise Value $ 48,600 Interest Bearing Debt 36,500
Market Value of Common Equity 12,100 Book Value of Common Equity 12,000
Excess of Market Value over Book Value $ 100
Impact on Fair Value Assumption Change (in thousands)
Annual Revenue Growth Rate Plus 1% $ 3,700 Annual Revenue Growth Rate Minus 1% (3,600 ) Annual Gross Margin Plus 1% 3,800 Annual Gross Margin Minus 1% (3,800 ) Discount Rate Plus .5% (2,200 ) Discount Rate Minus .5% 2,400
Table of Contents
Forward Looking Information — Safe Harbor Statement Under the Private Securities Litigation Reform Act of 1995
In connection with the “safe harbor” provisions of the Private Securities Litigation Reform Act of 1995 (the Act), we have filed cautionary statements identifying important factors that could cause our actual results to differ materially from those discussed in forward-looking statements made by or on behalf of the Company. When used in this Form 10-Q and in future filings by the Company with the Securities and Exchange Commission, in our press releases and in oral statements, words such as “may”, “will”, “expect”, “anticipate”, “continue”, “estimate”, “project”, “believes” or similar expressions are intended to identify forward-looking statements within the meaning of the Act and are included, along with this statement, for purposes of complying with the safe harbor provision of the Act.
The following factors, among others, could cause our actual results to differ materially from those discussed in the forward-looking statements:
39
• We are subject to federal and state legislation, regulations and actions that may have a negative impact on our business and results of operations.
• Federal and state environmental regulation could require us to incur substantial capital expenditures and increased operating costs.
• Volatile financial markets and changes in our debt ratings could restrict our ability to access capital and could increase borrowing costs and pension plan and postretirement health care expenses.
• We rely on access to the capital markets as a source of liquidity for capital requirements not satisfied by cash flows from operations. If we are not able to access capital at competitive rates, our ability to implement our business plans may be adversely affected.
• Disruptions, uncertainty or volatility in the financial markets can also adversely impact our results of operations, the ability of our customers to finance purchases of goods and services, and our financial condition, as well as exert downward pressure on stock prices and/or limit our ability to sustain our current common stock dividend level.
• The value of our defined benefit pension plan assets declined significantly in 2008 due to volatile equity markets. Asset values increased in 2009 and we made a $4 million discretionary contribution to the pension plan in 2009. If the market value of pension plan assets declines again as in 2008 or does not increase as projected and relief under the Pension Protection Act is no longer granted, we could be required to contribute additional capital to the pension plan in future years.
• Any significant impairment of goodwill would cause a decrease in our asset values and a reduction in our net operating performance.
• A sustained decline in our common stock price below book value or declines in projected operating cash flows at any of our operating companies may result in goodwill impairments that could adversely affect our results of operations and financial position, as well as credit facility covenants.
• Economic conditions could negatively impact our businesses.
• If we are unable to achieve the organic growth we expect, our financial performance may be adversely affected.
• Our plans to grow and diversify through acquisitions and capital projects may not be successful, which could result in poor financial performance.
• Our plans to acquire additional businesses and grow and operate our nonelectric businesses could be limited by state law.
• The terms of some of our contracts could expose us to unforeseen costs and costs not within our control, which may not be recoverable and could adversely affect our results of operations and financial condition.
• We are subject to risks associated with energy markets.
• Certain of our operating companies sell products to consumers that could be subject to recall.
• Competition is a factor in all of our businesses.
• We may experience fluctuations in revenues and expenses related to our electric operations, which may cause our financial results to fluctuate and could impair our ability to make distributions to our shareholders or scheduled payments on our debt obligations.
Table of Contents
40
• In September 2009, OTP announced its withdrawal as a participating utility and the lead developer for the planned construction of a second electric generating unit at its Big Stone Plant site. As of March 31, 2010 OTP had incurred $13.2 million in costs related to the project. OTP has deferred recognition of these costs as operating expenses pending determination of recoverability by the state and federal regulatory commissions that approve its rates. If OTP is denied recovery of all or any portion of these deferred costs, such costs would be subject to expense in the period they are deemed to be unrecoverable.
• Actions by the regulators of the electric segment could result in rate reductions, lower revenues and earnings or delays in recovering capital expenditures.
• OTP could be required to absorb a disproportionate share of costs for investments in transmission infrastructure required to provide independent power producers access to the transmission grid. These costs may not be recoverable through a transmission tariff and could result in reduced returns on invested capital and/or increased rates to OTP’s retail electric customers.
• OTP’s electric generating facilities are subject to operational risks that could result in unscheduled plant outages, unanticipated operation and maintenance expenses and increased power purchase costs.
• Fluctuations in wholesale electric sales and prices could result in earnings volatility.
• Wholesale sales of electricity from excess generation could be affected by reductions in coal shipments to the Big Stone and Hoot Lake plants due to supply constraints or rail transportation problems beyond our control.
• Changes to regulation of generating plant emissions, including but not limited to carbon dioxide (“CO 2 ”) emissions, could affect our operating costs and the costs of supplying electricity to our customers.
• Our plastics segment is highly dependent on a limited number of vendors for PVC resin, many of which are located in the Gulf Coast regions, and a limited supply of resin. The loss of a key vendor, or an interruption or delay in the supply of PVC resin, could result in reduced sales or increased costs for this business.
• Our plastic pipe companies compete against a large number of other manufacturers of PVC pipe and manufacturers of alternative products. Customers may not distinguish the pipe companies’ products from those of its competitors.
• Reductions in PVC resin prices can negatively impact PVC pipe prices, profit margins on PVC pipe sales and the value of PVC pipe held in inventory.
• Competition from foreign and domestic manufacturers, the price and availability of raw materials, fluctuations in foreign currency exchange rates and general economic conditions could affect the revenues and earnings of our manufacturing businesses.
• Changes in the rates or method of third-party reimbursements for diagnostic imaging services could result in reduced demand for those services or create downward pricing pressure, which would decrease revenues and earnings for our health services segment.
• Our health services businesses may be unable to continue to maintain agreements with Philips Medical from which the businesses derive significant revenues from the sale and service of Philips Medical diagnostic imaging equipment.
• Technological change in the diagnostic imaging industry could reduce the demand for diagnostic imaging services and require our health services operations to incur significant costs to upgrade equipment.
• Actions by regulators of our health services operations could result in monetary penalties or restrictions in our health services operations.
• Our food ingredient processing segment operates in a highly competitive market and is dependent on adequate sources of potatoes for processing. Should the supply of potatoes be affected by poor growing conditions, this could negatively impact the results of operations for this segment.
• Our food ingredient processing business could be adversely affected by changes in foreign currency exchange rates.
• A significant failure or an inability to properly bid or perform on projects by our construction or manufacturing businesses could lead to adverse financial results.
Table of Contents
Item 3. Quantitative and Qualitative Disclosures about Market Risk
At March 31, 2010 we had exposure to market risk associated with interest rates because we had $47.0 million in short-term debt outstanding subject to variable interest rates that are indexed to LIBOR plus 2.375% under our $200 million revolving credit facility and $63.5 million in short-term debt outstanding subject to variable interest rates that are indexed to LIBOR plus 0.5% under OTP’s $170 million revolving credit facility. At March 31, 2010 we had exposure to changes in foreign currency exchange rates. DMI has market risk related to changes in foreign currency exchange rates at its plant in Fort Erie, Ontario because the plant pays its operating expenses in Canadian dollars. Outstanding trade accounts receivable of the Canadian operations of IPH are not at risk of valuation change due to changes in foreign currency exchange rates because the Canadian company transacts all sales in U.S. dollars. However, IPH does have market risk related to changes in foreign currency exchange rates because approximately 12.1% of IPH sales in the first quarter of 2010 were outside the United States and the Canadian operation of IPH pays its operating expenses in Canadian dollars.
The majority of our consolidated long-term debt has fixed interest rates. The interest rate on variable rate long-term debt is reset on a periodic basis reflecting current market conditions. We manage our interest rate risk through the issuance of fixed-rate debt with varying maturities, through economic refunding of debt through optional refundings, limiting the amount of variable interest rate debt, and the utilization of short-term borrowings to allow flexibility in the timing and placement of long-term debt. As of March 31, 2010 we had $10.4 million of long-term debt subject to variable interest rates. Assuming no change in our financial structure, if variable interest rates were to average one percentage point higher or lower than the average variable rate on March 31, 2010, annualized interest expense and pre-tax earnings would change by approximately $104,000.
We have not used interest rate swaps to manage net exposure to interest rate changes related to our portfolio of borrowings. We maintain a ratio of fixed-rate debt to total debt within a certain range. It is our policy to enter into interest rate transactions and other financial instruments only to the extent considered necessary to meet our stated objectives. We do not enter into interest rate transactions for speculative or trading purposes.
The plastics companies are exposed to market risk related to changes in commodity prices for PVC resins, the raw material used to manufacture PVC pipe. The PVC pipe industry is highly sensitive to commodity raw material pricing volatility. Historically, when resin prices are rising or stable, sales volume has been higher and when resin prices are falling, sales volumes has been lower. Operating income may decline when the supply of PVC pipe increases faster than demand. Due to the commodity nature of PVC resin and the dynamic supply and demand factors worldwide, it is very difficult to predict gross margin percentages or to assume that historical trends will continue.
The companies in our manufacturing segment are exposed to market risk related to changes in commodity prices for steel, lumber, aluminum, cement and resin. The price and availability of these raw materials could affect the revenues and earnings of our manufacturing segment.
OTP has market, price and credit risk associated with forward contracts for the purchase and sale of electricity. As of March 31, 2010 OTP had recognized, on a pretax basis, $2,652,000 in net unrealized gains on open forward contracts for the purchase and sale of electricity and electricity generating capacity. Due to the nature of electricity and the physical aspects of the electricity transmission system, unanticipated events affecting the transmission grid can cause transmission constraints that result in unanticipated gains or losses in the process of settling transactions.
The market prices used to value OTP’s forward contracts for the purchases and sales of electricity and electricity generating capacity are determined by survey of counterparties or brokers used by OTP’s power services’ personnel responsible for contract pricing, as well as prices gathered from daily settlement prices published by the Intercontinental Exchange and NYMEX. For certain contracts, prices at illiquid trading points are based on a basis spread between that trading point and more liquid trading hub prices. These basis spreads are determined based on available market price information and the use of forward price curve models. The forward energy sales contracts that are marked to market as of March 31, 2010, are 100% offset by forward energy purchase contracts in terms of volumes and delivery periods but not in terms of delivery points. The differential in forward prices at the different delivery locations currently results in a mark-to-market unrealized gain on OTP’s open forward contracts.
We have in place an energy risk management policy with a goal to manage, through the use of defined risk management practices, price risk and credit risk associated with wholesale power purchases and sales. With the advent of the MISO Day 2
41
Table of Contents
market in April 2005, we made several changes to our energy risk management policy to recognize new trading opportunities created by this new market. Most of the changes were in new volumetric limits and loss limits to adequately manage the risks associated with these new opportunities. In addition, we implemented a Value at Risk (VaR) limit to further manage market price risk. There was price risk on open positions as of March 31, 2010 because the open purchases were not at the same delivery points as the open sales.
The following tables show the effect of marking to market forward contracts for the purchase and sale of electricity on our consolidated balance sheet as of March 31, 2010 and the change in our consolidated balance sheet position from December 31, 2009 to March 31, 2010:
The $2,652,000 in recognized but unrealized net gains on the forward energy and capacity purchases and sales marked to market on March 31, 2010 expected to be realized on settlement as scheduled over the following periods in the amounts listed:
OTP has credit risk associated with the nonperformance or nonpayment by counterparties to its forward energy and capacity purchases and sales agreements. We have established guidelines and limits to manage credit risk associated with wholesale power and capacity purchases and sales. Specific limits are determined by a counterparty’s financial strength. OTP’s credit risk with its largest counterparty on delivered and marked-to-market forward contracts as of March 31, 2010 was $1,062,000. As of March 31, 2010 OTP had a net credit risk exposure of $2,038,000 from six counterparties with investment grade credit ratings. OTP had no exposure at March 31, 2010 to counterparties with credit ratings below investment grade. Counterparties with investment grade credit ratings have minimum credit ratings of BBB- (Standard & Poor’s), Baa3 (Moody’s) or BBB- (Fitch).
The $2,038,000 credit risk exposure includes net amounts due to OTP on receivables/payables from completed transactions billed and unbilled plus marked-to-market gains/losses on forward contracts for the purchase and sale of electricity scheduled for delivery after March 31, 2010. Individual counterparty exposures are offset according to legally enforceable netting arrangements.
IPH has market risk associated with the price of fuel oil and natural gas used in its potato dehydration process as IPH may not be able to increase prices for its finished products to recover increases in fuel costs. In order to limit its exposure to fluctuations in future prices of natural gas, IPH entered into contracts with a fuel supplier in December 2009 for firm purchases of natural gas to cover portions of its anticipated natural gas needs in Ririe, Idaho through August 2010 at fixed prices. These contracts qualify for the normal purchase exception to mark-to-market accounting under Accounting Standards Codification 815-10-15.
Item 4. Controls and Procedures
Under the supervision and with the participation of the Company’s management, including the Chief Executive Officer and the Chief Financial Officer, the Company evaluated the effectiveness of the design and operation of its disclosure controls and procedures (as defined in Rule 13a-15(e) under the Securities Exchange Act of 1934 (the Exchange Act)) as of March 31, 2010, the end of the period covered by this report. Based on that evaluation, the Chief Executive Officer and Chief Financial Officer concluded that the Company’s disclosure controls and procedures were effective as of March 31, 2010.
During the fiscal quarter ended March 31, 2010, there were no changes in the Company’s internal control over financial reporting (as defined in Rule 13a-15(f) under the Exchange Act) that have materially affected, or are reasonably likely to materially affect, the Company’s internal control over financial reporting.
42
Year-to-Date (in thousands) March 31, 2010
Fair Value at Beginning of Year $ 1,030 Less: Amount Realized on Contracts Entered into in 2009 and Settled in 2010 126 Changes in Fair Value of Contracts Entered into in 2009 —
Net Fair Value of Contracts Entered into in 2009 at End of Period 904 Changes in Fair Value of Contracts Entered into in 2010 1,748
Net Fair Value End of Period $ 2,652
2nd Quarter 3rd Quarter 4th Quarter (in thousands) 2010 2010 2010 2011 2012 Total
Net Gain $ 1,209 $ 721 $ 81 $ 320 $ 321 $ 2,652
Table of Contents
PART II. OTHER INFORMATION
Item 1. Legal Proceedings
Sierra Club Complaint
On June 10, 2008 the Sierra Club filed a complaint in the U.S. District Court for the District of South Dakota (Northern Division) against the Company and two other co-owners of Big Stone Generating Station (Big Stone). The complaint alleged certain violations of the PSD and NSPS provisions of the CAA and certain violations of the South Dakota SIP. The action further alleged the defendants modified and operated Big Stone without obtaining the appropriate permits, without meeting certain emissions limits and NSPS requirements and without installing appropriate emission control technology, all allegedly in violation of the CAA and the South Dakota SIP. The Sierra Club alleged the defendants’ actions have contributed to air pollution and visibility impairment and have increased the risk of adverse health effects and environmental damage. The Sierra Club sought both declaratory and injunctive relief to bring the defendants into compliance with the CAA and the South Dakota SIP and to require the defendants to remedy the alleged violations. The Sierra Club also seeks unspecified civil penalties, including a beneficial mitigation project. The Company believes these claims are without merit and that Big Stone was and is being operated in compliance with the CAA and the South Dakota SIP.
The defendants filed a motion to dismiss the Sierra Club complaint on August 12, 2008. On March 31, 2009 and April 6, 2009, the U.S. District Court for the District of South Dakota (Northern Division) issued a Memorandum and Order and Amended Memorandum and Order, respectively, granting the defendants’ motion to dismiss the Sierra Club complaint. On April 17, 2009 the Sierra Club filed a motion for reconsideration of the Amended Memorandum Opinion and Order. The Sierra Club motion was opposed by the defendants. The Sierra Club motion for reconsideration was denied on July 22, 2009. On July 30, 2009 the Sierra Club filed a notice of appeal to the 8th U.S. Circuit Court of Appeals. The briefing schedule called for the appellant to submit its brief by mid-October, for appellees to submit their brief by mid-November and for the appellant to submit its reply brief by the end of November. On October 13, 2009, the United States Department of Justice filed a motion seeking a 30-day extension of the time to file an amicus brief in support of the Sierra Club’s position. The Court of Appeals granted this motion, as well as the appellees’ subsequent joint motion with the Sierra Club, extending the time to file the appellees’ brief and the Sierra Club’s reply brief. Briefing was complete on January 22, 2010 on filing of the Sierra Club’s reply brief. Oral arguments before the Court of Appeals are scheduled for May 11, 2010. The ultimate outcome of this matter cannot be determined at this time.
Federal Power Act Complaint
On August 29, 2008 Renewable Energy System Americas, Inc. (RES), a developer of wind generation, and PEAK Wind Development, LLC (PEAK Wind), a group of landowners in Barnes County, North Dakota, filed a complaint with the FERC alleging that OTP and Minnkota Power Cooperative, Inc. (Minnkota) had acted together in violation of the Federal Power Act (FPA) to deny RES and PEAK Wind access to the Pillsbury Line, an interconnection facility which Minnkota owns to interconnect generation projects being developed by OTP and NextEra Energy Resources, Inc. (fka FPL Energy, Inc.) (NextEra). RES and PEAK Wind asked that (1) the FERC order Minnkota to interconnect its Glacier Ridge project to the Pillsbury Line, or in the alternative, (2) the FERC direct MISO to interconnect the Glacier Ridge project to the Pillsbury Line. RES and Peak Wind also requested that OTP, Minnkota and NextEra pay any costs associated with interconnecting the Glacier Ridge Project to the MISO transmission system which would result from the interconnection of the Pillsbury Line to the Minnkota transmission system, and that the FERC assess civil penalties against OTP. OTP answered the complaint on September 29, 2008, denying the allegations of RES and PEAK Wind and requesting that the FERC dismiss the complaint. On October 14, 2008, RES and PEAK Wind filed an answer to OTP’s answer and, restated the allegations included in the initial complaint. RES and PEAK Wind also added a request that the FERC rescind both OTP’s waiver from the FERC Standards of Conduct and its market-based rate authority. On October 28, 2008, OTP filed a reply, denying the allegations made by RES and PEAK Wind in its answer. By order issued on December 19, 2008, the FERC set the complaint for hearing and established settlement procedures. A formal settlement agreement was filed with the FERC requesting approval of the settlement and withdrawal of the complaint. On May 6, 2010 the FERC issued an order approving the settlement and terminating the proceeding. The settlement did not have a material impact on OTP’s financial position, results of operations or cash flows.
Other
The Company is the subject of various pending or threatened legal actions and proceedings in the ordinary course of its business. Such matters are subject to many uncertainties and to outcomes that are not predictable with assurance. The Company records a liability in its consolidated financial statements for costs related to claims, including future legal costs, settlements and
43
Table of Contents
judgments, where it has assessed that a loss is probable and an amount can be reasonably estimated. The Company believes the final resolution of currently pending or threatened legal actions and proceedings, either individually or in the aggregate, will not have a material adverse effect on the Company’s consolidated financial position, results of operations or cash flows.
Item 1A. Risk Factors
There has been no material change in the risk factors set forth under Part I, Item 1A, “Risk Factors” on pages 29 through 35 of the Company’s Annual Report on Form 10-K for the year ended December 31, 2009.
Item 2. Unregistered Sales of Equity Securities and Use of Proceeds
The Company does not have a publicly announced stock repurchase program. The following table shows common shares that were surrendered to the Company by employees to pay taxes in connection with shares issued for stock performance awards granted to executive officers under the Company’s 1999 Stock Incentive Plan:
Item 6. Exhibits
SIGNATURES
Pursuant to the requirements of the Securities Exchange Act of 1934, the Registrant has duly caused this report to be signed on its behalf by the undersigned thereunto duly authorized.
Dated: May 7, 2010
44
Total Number of Average Price Paid Calendar Month Shares Purchased per Share
January 2010 — — February 2010 11,495 $ 22.77 March 2010 — —
Total 11,495
10.1
Distribution Agreement Dated March 17, 2010 between Otter Tail Corporation and J.P. Morgan Securities Inc. (incorporated by reference to Exhibit 1.1 to the Form 8-K filed by Otter Tail Corporation on March 17, 2010)
31.1 Certification of Chief Executive Officer Pursuant to Section 302 of the Sarbanes-Oxley Act of 2002. 31.2 Certification of Chief Financial Officer Pursuant to Section 302 of the Sarbanes-Oxley Act of 2002. 32.1 Certification of Chief Executive Officer Pursuant to Section 906 of the Sarbanes-Oxley Act of 2002. 32.2 Certification of Chief Financial Officer Pursuant to Section 906 of the Sarbanes-Oxley Act of 2002.
Distribution Agreement Dated March 17, 2010 between Otter Tail Corporation and J.P. Morgan Securities Inc. (incorporated by reference to Exhibit 1.1 to the Form 8-K filed by Otter Tail Corporation on March 17, 2010)
31.1 Certification of Chief Executive Officer Pursuant to Section 302 of the Sarbanes-Oxley Act of 2002 31.2 Certification of Chief Financial Officer Pursuant to Section 302 of the Sarbanes-Oxley Act of 2002 32.1 Certification of Chief Executive Officer Pursuant to Section 906 of the Sarbanes-Oxley Act of 2002 32.2 Certification of Chief Financial Officer Pursuant to Section 906 of the Sarbanes-Oxley Act of 2002
Exhibit 31.1
CERTIFICATION PURSUANT TO SECTION 302 OF THE SARBANES-OXLEY ACT OF 2002
I, John D. Erickson, certify that:
1. I have reviewed this quarterly report on Form 10-Q of Otter Tail Corporation;
2. Based on my knowledge, this report does not contain any untrue statement of a material fact or omit to state a material fact necessary to make the statements made, in light of the circumstances under which such statements were made, not misleading with respect to the period covered by this report;
3. Based on my knowledge, the financial statements, and other financial information included in this report, fairly present in all material respects the financial condition, results of operations and cash flows of the registrant as of, and for, the periods presented in this report;
4. The registrant’s other certifying officer and I are responsible for establishing and maintaining disclosure controls and procedures (as defined in Exchange Act Rules 13a-15(e) and 15d-15(e)) and internal control over financial reporting (as defined in Exchange Act Rules 13a-15(f) and 15d-15(f)) for the registrant and have:
(a) designed such disclosure controls and procedures, or caused such disclosure controls and procedures to be designed under our supervision, to ensure that material information relating to the registrant, including its consolidated subsidiaries, is made known to us by others within those entities, particularly during the period in which this report is being prepared;
(b) designed such internal control over financial reporting, or caused such internal control over financial reporting to be designed under our supervision, to provide reasonable assurance regarding the reliability of financial reporting and the preparation of financial statements for external purposes in accordance with generally accepted accounting principles;
(c) evaluated the effectiveness of the registrant’s disclosure controls and procedures and presented in this report our conclusions about the effectiveness of the disclosure controls and procedures, as of the end of the period covered by this report based on such evaluation; and
(d) disclosed in this report any change in the registrant’s internal control over financial reporting that occurred during the registrant’s most recent fiscal quarter (the registrant’s fourth fiscal quarter in the case of an annual report) that has materially affected, or is reasonably likely to materially affect, the registrant’s internal control over financial reporting; and
5. The registrant’s other certifying officer and I have disclosed, based on our most recent evaluation of internal control over financial reporting, to the registrant’s auditors and the audit committee of the registrant’s board of directors (or persons performing the equivalent functions):
(a) all significant deficiencies and material weaknesses in the design or operation of internal control over financial reporting which are reasonably likely to adversely affect the registrant’s ability to record, process, summarize and report financial information; and
(b) any fraud, whether or not material, that involves management or other employees who have a significant role in the registrant’s internal control over financial reporting.
Date: May 7, 2010
/s/ John D. Erickson John D. Erickson President and Chief Executive Officer
Exhibit 31.2
CERTIFICATION PURSUANT TO SECTION 302 OF THE SARBANES-OXLEY ACT OF 2002
I, Kevin G. Moug, certify that:
1. I have reviewed this quarterly report on Form 10-Q of Otter Tail Corporation;
2. Based on my knowledge, this report does not contain any untrue statement of a material fact or omit to state a material fact necessary to make the statements made, in light of the circumstances under which such statements were made, not misleading with respect to the period covered by this report;
3. Based on my knowledge, the financial statements, and other financial information included in this report, fairly present in all material respects the financial condition, results of operations and cash flows of the registrant as of, and for, the periods presented in this report;
4. The registrant’s other certifying officer and I are responsible for establishing and maintaining disclosure controls and procedures (as defined in Exchange Act Rules 13a-15(e) and 15d-15(e)) and internal control over financial reporting (as defined in Exchange Act Rules 13a-15(f) and 15d-15(f)) for the registrant and have:
(a) designed such disclosure controls and procedures, or caused such disclosure controls and procedures to be designed under our supervision, to ensure that material information relating to the registrant, including its consolidated subsidiaries, is made known to us by others within those entities, particularly during the period in which this report is being prepared;
(b) designed such internal control over financial reporting, or caused such internal control over financial reporting to be designed under our supervision, to provide reasonable assurance regarding the reliability of financial reporting and the preparation of financial statements for external purposes in accordance with generally accepted accounting principles;
(c) evaluated the effectiveness of the registrant’s disclosure controls and procedures and presented in this report our conclusions about the effectiveness of the disclosure controls and procedures, as of the end of the period covered by this report based on such evaluation; and
(d) disclosed in this report any change in the registrant’s internal control over financial reporting that occurred during the registrant’s most recent fiscal quarter (the registrant’s fourth fiscal quarter in the case of an annual report) that has materially affected, or is reasonably likely to materially affect, the registrant’s internal control over financial reporting; and
5. The registrant’s other certifying officer and I have disclosed, based on our most recent evaluation of internal control over financial reporting, to the registrant’s auditors and the audit committee of the registrant’s board of directors (or persons performing the equivalent functions):
(a) all significant deficiencies and material weaknesses in the design or operation of internal control over financial reporting which are reasonably likely to adversely affect the registrant’s ability to record, process, summarize and report financial information; and
(b) any fraud, whether or not material, that involves management or other employees who have a significant role in the registrant’s internal control over financial reporting.
Date: May 7, 2010
/s/ Kevin G. Moug Kevin G. Moug Chief Financial Officer
Exhibit 32.1
CERTIFICATION PURSUANT TO SECTION 906 OF THE SARBANES-OXLEY ACT OF 2002
In connection with the Annual Report of Otter Tail Corporation (the “Company”) on Form 10-Q for the period ended March 31, 2010 as filed with the Securities and Exchange Commission on the date hereof (the “Report”), I, John D. Erickson, President and Chief Executive Officer of the Company, certify, pursuant to 18 U.S.C. Section 1350, as adopted pursuant to Section 906 of the Sarbanes-Oxley Act of 2002, that:
1. The Report fully complies with the requirements of Section 13(a) or 15(d) of the Securities Exchange Act of 1934; and
2. The information contained in the Report fairly presents, in all material respects, the financial condition and results of operations of the Company.
/s/ John D. Erickson John D. Erickson President and Chief Executive Officer May 7, 2010
Exhibit 32.2
CERTIFICATION PURSUANT TO SECTION 906 OF THE SARBANES-OXLEY ACT OF 2002
In connection with the Annual Report of Otter Tail Corporation (the “Company”) on Form 10-Q for the period ended March 31, 2010 as filed with the Securities and Exchange Commission on the date hereof (the “Report”), I, Kevin G. Moug, Chief Financial Officer and Treasurer of the Company, certify, pursuant to 18 U.S.C. Section 1350, as adopted pursuant to Section 906 of the Sarbanes-Oxley Act of 2002, that:
1. The Report fully complies with the requirements of Section 13(a) or 15(d) of the Securities Exchange Act of 1934; and
2. The information contained in the Report fairly presents, in all material respects, the financial condition and results of operations of the Company.
/s/ Kevin G. Moug Kevin G. Moug Chief Financial Officer May 7, 2010