160
ANNUAL REPORT 2017 OUR BUSINESS PLATFORMS OUR GROWTH DRIVERS

A N N U A L R E P O R T 2 0 1 7
OUR BUSINESS PLATFORMSOUR GROWTH DRIVERS

CONTENTS02 Chairman’s Statement
06 Board of Directors
10 Key Management Personnel
11 Senior Executive Teams in Straits Trading and its subsidiaries
Year in Review
12 Group Financial Highlights
14 Real Estate
18 Hospitality
19 Resources
21 Sustainability Report
33 Financial Report & Other Information
- Report on Corporate Governance
- Directors’ Statement
- Independent Auditor’s Report
- Consolidated Income Statement
- Consolidated Statement of Comprehensive Income
- Balance Sheets
- Consolidated Statement of Changes in Equity
- Consolidated Cash Flow Statement
- Notes to the Financial Statements
- Additional Information Required under the Mainboard Rules of the Singapore Exchange Securities Trading Limited
- Shareholdings Information
- Notice of Annual General Meeting
- Proxy Form
CORPORATE PROFILE
The Straits Trading Company LimitedIncorporated in 1887, The Straits Trading Company Limited has stakes in real estate, hospitality, resources and investments that span the Asia Pacific region. It owns an 89.5% stake in Straits Real Estate, a co-investment vehicle that seeks out real estate related investments & opportunities globally. It also owns a 20.95% stake in ARA Asset Management Limited, a premier integrated real estate fund manager, and has a 30% interest in Far East Hospitality Holdings, an established international hospitality owner and operator. Straits Trading also engages in tin mining and smelting through its 54.8%-owned subsidiary, Malaysia Smelting Corporation Berhad, which is dual listed on Bursa Malaysia and SGX-ST.

We have transformed our investments into business platforms and are now focused on leveraging these platforms as
drivers for long-term growth.
OUR BUSINESS PLATFORMSOUR GROWTH DRIVERS
01THE STRAITS TRADING COMPANY LIMITEDANNUAL REPORT 2017

AS AT 31 DECEMBER 2017, NET ASSET VALUE PER SHARE FOR THE GROUP WAS $3.62, AN 8.3% INCREASE FROM $3.34 A YEAR AGO. THE GROUP ALSO GREW THE VALUE OF ITS TOTAL ASSETS FROM $2.2 BILLION IN FY2016 TO MORE THAN $2.4 BILLION IN FY2017, OF WHICH APPROXIMATELY 75% COMPRISED OUR REAL ESTATE AND HOSPITALITY ASSETS.
Chew Gek Khim PJG Executive ChairmanThe Straits Trading Company Limited
CHAIRMAN’S STATEMENT
OUR BUSINESS PLATFORMS OUR GROWTH DRIVERS02
Dear Shareholders,
On behalf of the Board of Directors, it is my pleasure to present to you the Annual Report of The Straits Trading Company Limited (“Straits Trading” or “the Group”) for the financial year ended 31 December 2017 (“FY2017”).
PROGRESSING IN LINE WITH GOALSIn 2009, we first articulated our goal to shape and transform our investments into sustainable platforms. This was achieved by the end of 2013. Over the last four years, we have reallocated capital to these platforms; and these platforms have made progress. However, we will remain vigilant with our investments given the uncertain and evolving macroeconomic backdrop.
In FY2017, our real estate segment delivered a Profit After Tax and Non-Controlling Interest (“PATNCI”) of $46.6 million. The performance of our hospitality segment is stable despite challenges in the hospitality market. On the resources front, Malaysia Smelting Corporation Berhad (“MSC”) continues to optimise efficiency and strengthen its position as one of the world’s leading integrated producers of tin metal.
Straits Real Estate Pte. Ltd. (“Straits Real Estate”)One of the key engines of the Group’s real estate ecosystem is Straits Real Estate, our 89.5%-held investment vehicle.
Key assets acquisitionsStraits Real Estate enlarged its footprint in Australia following the acquisition of two office buildings, namely 320 Pitt Street in Sydney in July 2017 and 45 St Georges Terrace in Perth in early 2018. These are quality assets located within the respective cities’ Central Business Districts and are income generating in nature.
Straits Real Estate continues to aggregate a larger portfolio of residential assets in Japan and in 2017, two properties were added, bringing the total units to 612. To grow the residential portfolio further, Straits Real Estate partnered Savills Investment Management Japan in January 2018 and committed JPY9 billion (approximately $106.5 million) in capital towards a pipeline of residential assets to be identified in the Greater Tokyo area.
More detailed information on developments in Straits Real Estate can be found on pages 14 to 16.
For more information on Straits Real Estate, please visit www.straitsrealestate.com
ARA Asset Management Limited (“ARA”) In 2017, Straits Trading, together with other consortium members, successfully privatised ARA at a scheme consideration of $1.78 per share, valuing ARA at around $1.8 billion. This transaction involved exchanging Straits Trading’s 20.1% stake in ARA for 20.95% of the privatised company and $48.2 million in cash proceeds.
Following the privatisation, ARA made a strategic investment of 20.94% in Kenedix Inc, one of the leading independent real estate fund managers in Japan, to jointly explore collaboration opportunities in the country and regionally. In July 2017, ARA raised $300 million from issuing perpetual securities, providing the company with greater financial flexibility to pursue opportunities.
ARA will continue to actively grow its assets under management (“AUM”) and deliver value for its shareholders.
For more information on ARA, please visit www.ara-asia.com
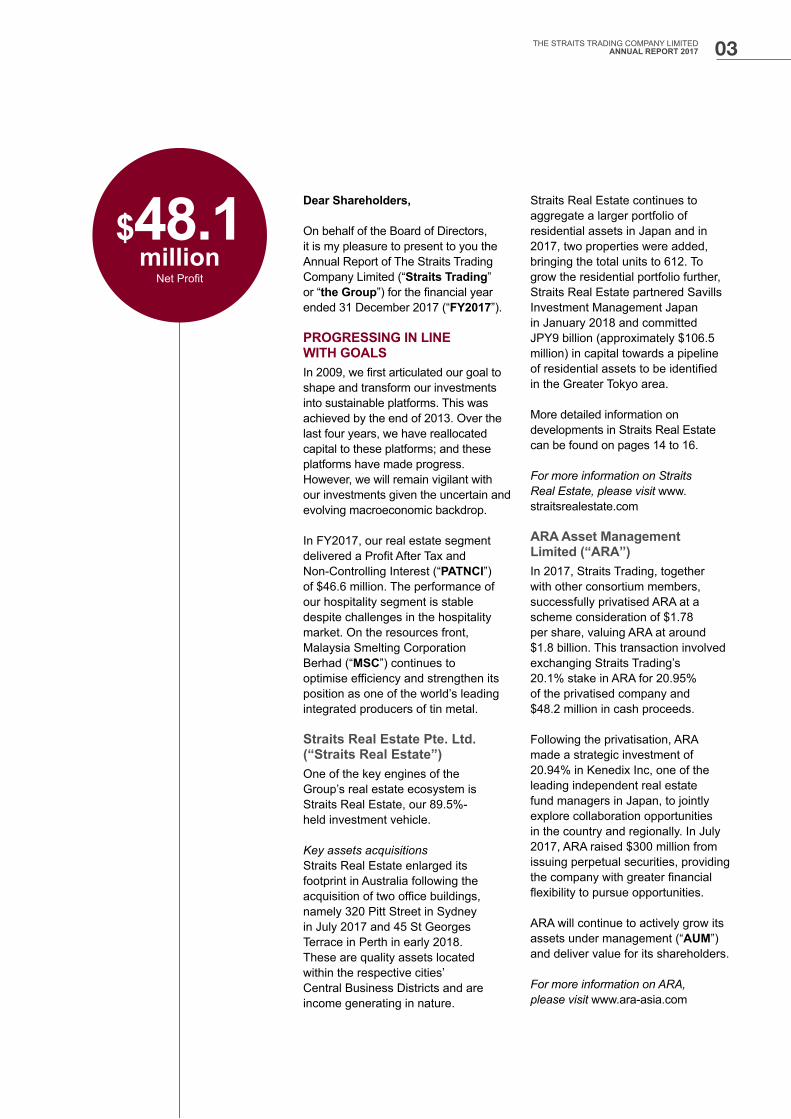
$48.1million
Net Profit
03THE STRAITS TRADING COMPANY LIMITEDANNUAL REPORT 2017

Far East Hospitality Holdings Pte. Ltd. (“Far East Hospitality”)Far East Hospitality, our 30%-owned associate, has a combined portfolio of over 14,000 rooms under management across more than 90 hotels and serviced residences spanning seven countries.
For more information on Far East Hospitality, please visit www.stayfareast.com.sg
Suntec Real Estate Investment Trust (“Suntec REIT”) Our shareholding in Suntec REIT, which is managed by ARA Trust Management (Suntec) Limited, a wholly-owned subsidiary of ARA, continues to strengthen our real estate ecosystem. This investment also provides a regular dividend income stream for Straits Trading.
For more information on Suntec REIT, please visit www.suntecreit.com
Malaysia Smelting Corporation Berhad2017 has been an eventful year for MSC following the acquisition of a production facility (“Klang Facility”) in Port Klang, Malaysia that is equipped with cutting-edge technology. MSC continues to work on optimising efficiencies for both its smelting and mining businesses. We are proud that MSC, with its existing smelter in Butterworth, Penang, has continued its leadership as the largest independent custom tin smelter in the world, which in itself, presents good intrinsic value to Straits Trading. Coupled with the acquisition of the Klang Facility, MSC’s competitive position in the tin industry will likely be enhanced in time to come.
We remain mindful of the opportunities ahead and seek to further enhance MSC’s value on various fronts, be it in smelting, mining or optimising its asset base.
For more information on MSC, please visit www.msmelt.com
SUSTAINABILITY As an investor, property owner and asset manager, we recognise our duty to deliver stable returns to our shareholders and other stakeholders in a sustainable manner. We have thus taken a proactive stance to mitigate environmental and social risks.
In FY2017, we increased our efforts to engage capital market participants through various investor roadshows and analyst briefings, and we intend to continue doing so on a regular basis.
The full report on our sustainability and investor relations efforts can be found on pages 21 to 32.
FINANCIAL PERFORMANCE AND FINANCIAL DISCIPLINEFor FY2017, Straits Trading posted a net profit of $48.1 million. As at 31 December 2017, net asset value per share for the Group was $3.62, an 8.3% increase from $3.34 a year ago. The Group also grew the value of its total assets from $2.2 billion in FY2016 to more than $2.4 billion in FY2017, of which approximately 75% comprised our real estate and hospitality assets. This result stands as a testament to the success of the Straits Trading real estate ecosystem, and highlights our commitment to grow our already sizable asset base. We are confident that the market will recognise the true value of the Group.
To maintain financial flexibility, Straits Trading issued $150 million of 3.73% notes due July 2021. We maintain a sound financial position with $362 million in cash and cash equivalents and a net gearing ratio of 25.9%.
DIVIDENDSWe have declared an interim dividend of 6 cents per share for FY2017 and will continue to work towards a sustainable dividend payout, as our businesses begin to generate stable income streams.
BOARD RENEWAL I would like to thank Mr Yap Chee Keong and Mr Tham Kui Seng, who are stepping down as Independent Directors on 27 April 2018, for their valuable contributions over their nine-year tenure. At the same time, we are pleased to welcome Mr Chua Tian Chu and Mr Tan Chian Khong, who joined Straits Trading as Independent and Non-Executive Directors in January 2018. I am confident that their expertise and experience in banking, hospitality and financial services will complement and augment the diverse strengths of the Board.
CHANGES TO THE EXECUTIVE TEAMWe regret that Ms Maggie Yeo has left the Group to pursue her personal interests. We wish to thank Ms Yeo for her contributions to the Group.The responsibilities of overseeing the financial and accounting functions of the Group will now be taken on by Ms Jennifer Chee Foong Fong, Group Financial Controller and Ms Goh Yah Huay, Group Treasurer.
LOOKING AHEAD The business climate is poised to become more challenging as markets continue to deal with greater uncertainties and disruptions. The Group will continue to adopt a disciplined approach in making investments, nurturing them and recycling capital efficiently into higher yielding investments.
We thank our business partners, bankers and shareholders for their confidence and support. We also thank our fellow Directors for their continued guidance, and fellow employees at Straits Trading and its subsidiaries, for their hard work, dedication and commitment.
Chew Gek Khim PJGExecutive Chairman28 March 2018
CHAIRMAN’S STATEMENT
04 OUR BUSINESS PLATFORMS OUR GROWTH DRIVERS
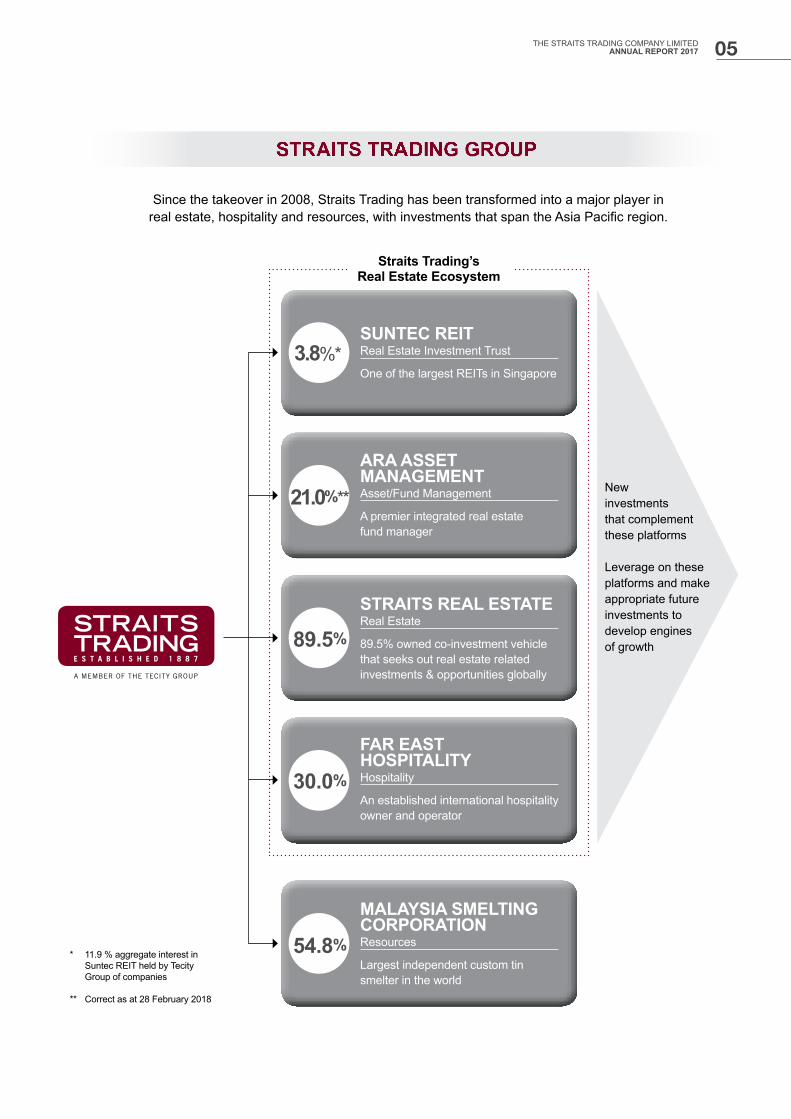
Since the takeover in 2008, Straits Trading has been transformed into a major player in real estate, hospitality and resources, with investments that span the Asia Pacific region.
New investments that complement these platforms
Leverage on these platforms and make appropriate future investments to develop engines of growth
Straits Trading’s Real Estate Ecosystem
SUNTEC REITReal Estate Investment Trust
One of the largest REITs in Singapore
ARA ASSET MANAGEMENTAsset/Fund Management
A premier integrated real estate fund manager
STRAITS REAL ESTATEReal Estate
89.5% owned co-investment vehicle that seeks out real estate related investments & opportunities globally
FAR EAST HOSPITALITYHospitality
An established international hospitality owner and operator
MALAYSIA SMELTING CORPORATIONResources
Largest independent custom tin smelter in the world
STRAITS TRADING GROUP
3.8%*
* 11.9 % aggregate interest in Suntec REIT held by Tecity Group of companies
** Correct as at 28 February 2018
21.0%**
89.5%
30.0%
54.8%
05THE STRAITS TRADING COMPANY LIMITEDANNUAL REPORT 2017

From left to right
Gary Hilton Weiss, Tan Chian Khong, Tan Tiong Cheng, Goh Kay Yong David, Chew Gek Khim Chew Gek Hiang, Tham Kui Seng, Chia Chee Ming Timothy, Yap Chee Keong, Chua Tian Chu
BOARD OF DIRECTORS
06 OUR BUSINESS PLATFORMS OUR GROWTH DRIVERS
CHEW GEK KHIM PJG, 56Executive ChairmanFirst appointed: 20 March 2008Last re-elected: 30 April 2015
Ms Chew Gek Khim is a lawyer by training. She has been Chairman of The Straits Trading Company Limited since 24 April 2008, first as Non-Executive and Non-Independent Chairman and then as Executive Chairman since 1 November 2009.
Ms Chew is also Executive Chairman of the Tecity Group, which she joined in 1987. She is Chairman of Malaysia Smelting Corporation Berhad and ARA Trust Management (Suntec) Limited, and sits on the Board of ARA Asset Management Holdings Pte. Ltd. and Singapore Exchange Limited.
Ms Chew is also Deputy Chairman of Tan Chin Tuan Foundation in Singapore and Chairman of Tan Sri Tan Foundation in Malaysia. She is a Member of the Securities Industry Council of Singapore and Board of Governors of S. Rajaratnam School of International Studies. She was the Chairman of the National Environment Agency Board of Singapore from 2008 to 2015. Ms Chew was also previously a Director of CapitaLand Retail China Trust (formerly CapitaRetail China Trust Management Limited), a Board Member of the Singapore Totalisator Board and a Member of the SSO Council.
Ms Chew graduated from the National University of Singapore in 1984. She was awarded the Chevalier de l’Ordre National du Mérite in 2010, the Singapore Businessman of the Year 2014 in 2015, and the Meritorious Service Medal at the National Day Awards in 2016.
CHEW GEK HIANG, 54Non-Independent and Non-Executive DirectorFirst appointed: 30 April 2008Last re-elected: 27 April 2017
Ms Chew Gek Hiang, an accountant by training, has been with the Tecity Group, the parent company of The Straits Trading Company Limited, since 1991. As Executive Director and Head of Finance, she is actively involved in the investment activities of the Tecity Group and is responsible for its securities trading portfolio. She also oversees the human resource and administrative functions in the Tecity Group.
Currently serving on the advisory panel of the GST Review Board, Ms Chew is also a Council Member of Tan Chin Tuan Foundation in Singapore and Tan Sri Tan Foundation in Malaysia. She is also President of Noah’s Ark CARES (Companion Animal Rescue and Education Society), a non-profit animal welfare charity which champions responsible pet ownership and active sterilisation and microchipping of stray dogs and cats in Singapore.
After her graduation from the National University of Singapore in 1986, Ms Chew worked with Ernst & Whinney in Singapore for a year. She then joined Ernst & Young (London) in 1987 to pursue chartered accountancy, and was admitted to the Institute of Chartered Accountants in England and Wales in October 1990.
07THE STRAITS TRADING COMPANY LIMITEDANNUAL REPORT 2017

GOH KAY YONG DAVID, 56Non-Independent and Non-Executive DirectorFirst appointed: 30 April 2008Last re-elected: 29 April 2016
Mr Goh Kay Yong David is the Chief Investment Officer and Chief Strategist of the Tecity Group, the parent company of The Straits Trading Company Limited.
Mr Goh started his investment career as an Investment Analyst with Great Eastern Life in 1986, and taught at Singapore’s Nanyang Technological University (“NTU”) in the Bachelor of Business Financial Analyst programme in 1991. After joining Tecity Group in 1997, he remained from 1997 to 2003, as Adjunct Associate Professor of Finance at NTU. Mr Goh also serves as Director of Stewardship Equity Pte Ltd, Commonwealth Capital Pte. Ltd. and NPE Print Communications Pte. Ltd.
Mr Goh holds a Bachelor of Arts (Hons) degree in Economics from York University, Canada; a Master of Science in Management (System Dynamics, Finance and Strategy) from Massachusetts Institute of Technology’s Sloan School of Management, and is a CFA Charter holder.
YAP CHEE KEONG, 57Independent and Non-Executive DirectorFirst appointed: 7 May 2009Last re-elected: 27 April 2017
Mr Yap Chee Keong is an Independent Non-Executive Director of Olam International Limited, Sembcorp Industries Ltd, Shangri-La Asia Limited, Citibank Singapore Limited, Certis CISCO Security Pte Ltd and MediaCorp Pte Ltd. He is also an Independent and Non-Executive Director of Malaysia Smelting Corporation Berhad.
Mr Yap was the Chairman of CityNet Infrastructure Management Pte Ltd (the trustee manager of NetLink Trust), the Lead Independent Director of Tiger Airways Holdings Limited and an Independent Non-Executive Director of CapitaMalls Asia Limited and a Non-Executive Director of ARA Asset Management Ltd. He was also a Board Member of the Accounting & Corporate Regulatory Authority and a Member of the Public Accountants Oversight Committee.
He was previously the Executive Director of The Straits Trading Company Limited and the Chief Financial Officer of Singapore Power Group.
He holds a Bachelor of Accountancy from the National University of Singapore and is a Fellow of the Institute of Singapore Chartered Accountants, CPA Australia and the Singapore Institute of Directors.
THAM KUI SENG, 60Independent and Non-Executive DirectorFirst appointed: 1 October 2009Last re-elected: 30 April 2015
Mr Tham Kui Seng is an Independent and Non-Executive Director of Sembcorp Industries Ltd, Banyan Tree Holdings Limited and Avanda Investment Management Pte. Ltd.
Mr Tham was the former Chief Corporate Officer of CapitaLand Limited, overseeing the corporate services functions of the real estate group from 2002 to 2008. He was previously a Member of the Board of the Singapore Land Authority.
Mr Tham graduated from the University of Oxford with a Bachelor of Arts (First Class Honours) in Engineering Science.
TAN TIONG CHENG, 67Independent and Non-Executive DirectorFirst appointed: 1 July 2013Last re-elected: 29 April 2016
Mr Tan Tiong Cheng is currently the Advisor to Knight Frank Pte Ltd and President of Knight Frank Asia Pacific Pte Ltd. He was the Executive Chairman of Knight Frank Pte Ltd’s Group of Companies until 31 March 2017. Over the last four decades, he has amassed an extensive and in-depth knowledge of real estate. He is an Independent and Non-Executive Director of UOL Group Limited and a Member of its Audit Committee. Mr Tan is also an Independent Director, Chairman of the Remuneration Committee and a Member of the Audit Committee of Heeton Holdings Limited.
A Colombo Plan Scholar, Mr Tan graduated top of his class with a Diploma in Urban Valuation from the University of Auckland, New Zealand. A Licensed Appraiser, he is also a Fellow Member of the Singapore Institute of Valuers and Surveyors, and the Association of Property and Facilities Management, an Associate Member of the New Zealand Institute of Valuers and a Senior Member of The Property Institute of New Zealand. He served as a Member of the Valuation Review Board until 30 April 2016.
GARY HILTON WEISS, 64Independent and Non-Executive DirectorFirst appointed: 1 June 2014 Last re-elected: 27 April 2017
Dr Gary Hilton Weiss is currently the Executive Director of Ariadne Australia Limited, a diversified investment company with investments in a variety of sectors, including insurance and financial services. The Chairman of Estia Health Ltd,
BOARD OF DIRECTORS
08 OUR BUSINESS PLATFORMS OUR GROWTH DRIVERS

Ardent Leisure Group and Ridley Corporation Ltd, and a Non-Executive Director of Premier Investments Ltd and Thorney Opportunities Ltd.
Dr Weiss is also a Commissioner of the Australian Rugby League Commission.
He was the former Chairman of Coats Plc, a former Executive Director of Whitlam, Turnbull & Co and Guinness Peat Group plc and sat on the board of Westfield Holdings Limited and a number of other public companies. Dr Weiss has also been involved in managing large businesses with operations in many regions including Europe, China and India and is familiar with investments across a wide range of industries, corporate finance and private equity type deals.
Dr Weiss holds an LLB (Hons) and LLM from Victoria University of Wellington and a Doctor of the Science of Law (JSD) from Cornell University. He was admitted as a Barrister and Solicitor of the Supreme Court of New Zealand, a Barrister and Solicitor of the Supreme Court of Victoria and as a Solicitor of the Supreme Court of New South Wales.
CHIA CHEE MING TIMOTHY, 68Independent and Non-Executive DirectorLead Independent DirectorFirst appointed: 27 February 2015Last re-elected: 30 April 2015
Mr Chia Chee Ming, Timothy is Chairman of Hup Soon Global Corporation Private Limited. He sits on the boards of several other private and public companies, including Banyan Tree Holdings Ltd, Fraser and Neave, Limited, Singapore Power Limited, Vertex Venture Holdings Ltd, Ceylon Guardian Investment Trust PLC, Ceylon Investment PLC and
Malaysia Smelting Corporation Berhad. He is also a Member of the Board of Trustees of the Singapore Management University, an Advisory Council Member of the ASEAN Business Club, a Member of the Advisory Board of the Asian Civilisations Museum and a Term Trustee of the Singapore Indian Development Association.
Mr Chia graduated with a Bachelor of Science cum laude, majoring in Management from Farleigh Dickinson University in the United States of America.
TAN CHIAN KHONG, 62Independent and Non-Executive DirectorFirst appointed: 1 January 2018
Mr Tan Chian Khong has approximately 35 years of experience in the audit industry. He joined Ernst & Young LLP (then known as Ernst & Whinney) in April 1981 and was a partner of the firm from July 1996 to June 2016. Currently an Independent Non-Executive Director of Alliance Bank Malaysia Berhad, which is listed on Bursa Malaysia, Mr Tan is also an Independent Non-Executive Director and Audit Committee Chairman of Xinghua Port Holdings Ltd, listed on the Hong Kong Stock Exchange, and an Independent Non-Executive Director of Hong Leong Asia Ltd. He is also an Honorary Executive Director of Trailblazer Foundation Ltd and a Member of the Board of the Casino Regulatory Authority of Singapore.
Mr Tan holds a Bachelor of Accountancy from the National University of Singapore, a Master of Business Administration from the University of South Australia and a Master of International Environmental Management from the University
of Adelaide. He is a Member of the American Institute of Certified Public Accountants, a Fellow of CPA Australia and a Fellow of the Institute of Singapore Chartered Accountants.
CHUA TIAN CHU, 58Independent and Non-Executive DirectorFirst appointed: 1 January 2018
Mr Chua Tian Chu was the Deputy Chief Executive Officer of Meritus Hotels & Resorts from 2012 to 2013. Prior to this, Mr Chua held the positions of Executive Vice President of International Sector and Greater China Region, as well as Head, Global Financial Institutions Group of United Overseas Bank Limited, and Managing Director and Head of Investment Finance of Citigroup Private Bank (Asia Pacific Region) as well as Head of Citigroup Corporate Banking in Singapore. He was also formerly the Group Managing Director and Chief Executive Officer of Far East Orchard Limited (then known as Orchard Parade Holdings Limited).
Mr Chua holds a Master in Business Administration from the National University of Singapore, a Master in Theological Studies (magna cum laude) from the Asia Theological Center, and a Master of Divinity from the East Asia School of Theology. Mr Chua also has a Bachelor Degree in Civil Engineering from the National University of Singapore. He has also attended the Advanced Management Program of Harvard Business School.
09THE STRAITS TRADING COMPANY LIMITEDANNUAL REPORT 2017
JENNIFER CHEE FOONG FONGGroup Financial Controller
Ms Jennifer Chee Foong Fong joined Straits Trading in August 1993 as an Accountant. Over the years, she rose through the ranks and was in charge of financial and management reporting, tax matters, budget, cash and risk management, system implementations and compliance. She was also actively involved in some of the Group’s acquisitions and disposals, as well as other corporate actions. Her last position held was Vice President, Finance. She was appointed Group Financial Controller in January 2018 and is responsible for accounting, financial, tax and risk management matters of Straits Trading and its group of companies.
She has more than 20 years of experience in the finance, accounting and tax functions, in addition to areas of auditing.
Ms Chee is a graduate of the Association of Chartered Certified Accountants (“ACCA”). She is a Chartered Accountant of Singapore and is a Fellowship member of ACCA.
GOH YAH HUAYGroup Treasurer
Ms Goh Yah Huay has been Group Treasurer of Straits Trading since January 2018. She is also Director of Finance at Straits Real Estate Pte. Ltd. where she is responsible for all accounting, treasury and finance related functions. Prior to joining Straits Real Estate, Ms Goh was Vice President of Finance at Straits Trading where she was responsible for cashflow management, financial analysis, statutory/management reporting and financial consolidation activities for the Hospitality Division.
Ms Goh has more than 20 years of experience in the field of Accounting, Controllership, Treasury, Financial Planning and Analysis. Prior to joining Straits Trading, she was Financial Controller South Asia for Imation Singapore Pte Limited. Before that, she spent 10 years at BMC Software. An accountant by training, Ms Goh has a strong track record of identifying, analysing and evaluating business and financial challenges and recommending financial models to strategically address these challenges. She is well versed in managing financial activities across the Asia Pacific region. Ms Goh has been a Chartered Accountant of Singapore since 1998 and holds a Bachelor of Accountancy degree from the Nanyang Technological University.
CHEW GEK KHIM PJGExecutive Chairman (Please refer to page 7 for profile)
KEY MANAGEMENT PERSONNEL
PERSONNEL
OUR BUSINESS PLATFORMS OUR GROWTH DRIVERS10

SENIOR EXECUTIVE TEAMS IN STRAITS TRADING AND ITS SUBSIDIARIES
DR ALLEN TANVice President
Portfolio Management
JAMES KWIEVice President
Portfolio Management
LOW YEW JOOVice President
Portfolio Management
ALDRIC TANCompany Secretary
TOH CHEE LENGVice President
Human Resource & Administration
DESMOND TANGChief Executive Officer
ANDY LIMDirector
Business Development & Operations
GOH YAH HUAYDirector Finance
ADELINE FONGDirector
Asset Management
PAUL YIChief Investment Officer
MADZLAN ZAMChief Operating Officer
Mining
DATO’ DR IR PATRICK YONG MIAN THONGChief Executive Officer
IR RAVEENTIRAN KRISHNAN
Chief Operating Officer Smelting
DR TEY JOO GUANDeputy Chief
Executive Officer I
NICOLAS CHENDeputy Chief
Executive Officer II
T. RANDY CHITTYGroup Chief
Financial Officer
YOON CHOON KONGInternal Auditor
THE STRAITS TRADING COMPANY LIMITED
STEVEN ANGVice President
Information Technology
WONG WAI YEEVice President
Corporate Communications
TAN HWEI YEEVice President
Property Development
MANISH BHARGAVAVice President
Public Market Investments
STRAITS REAL ESTATE PTE. LTD.
MALAYSIA SMELTING CORPORATION BERHAD
11THE STRAITS TRADING COMPANY LIMITEDANNUAL REPORT 2017
2017$’000
2016$’000
2015$’000
2014$’000
2013$’000
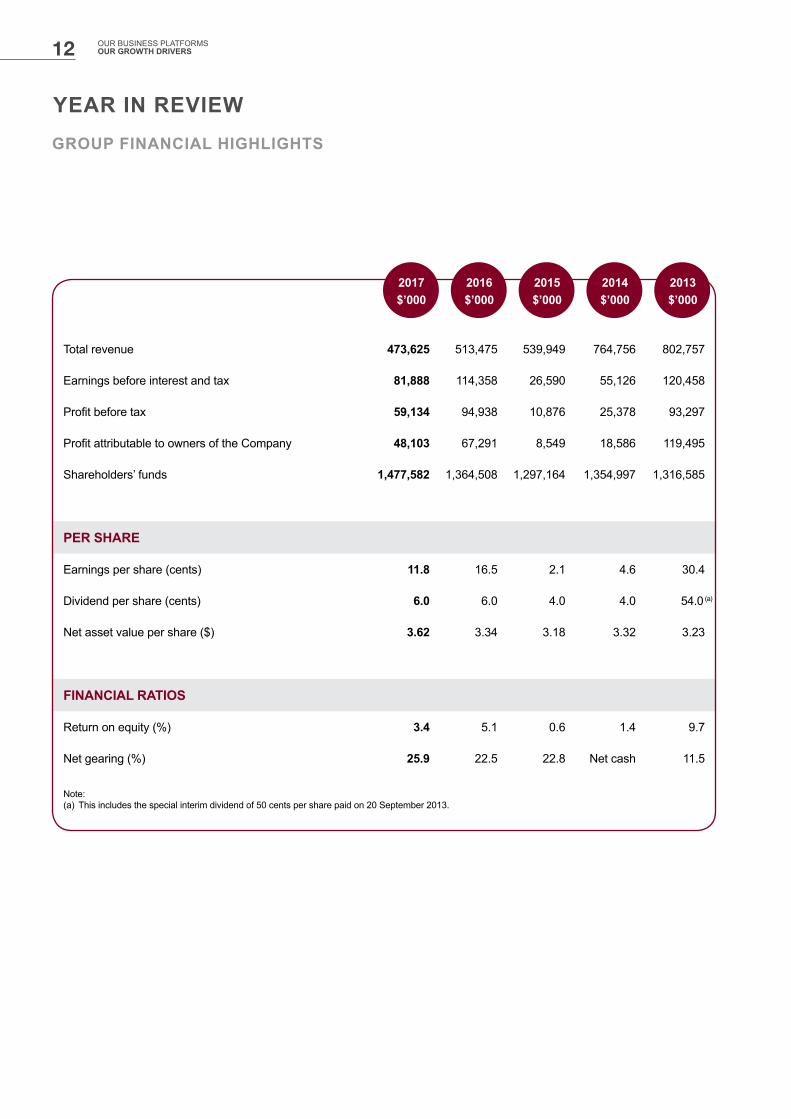
Total revenue 473,625 513,475 539,949 764,756 802,757
Earnings before interest and tax 81,888 114,358 26,590 55,126 120,458
Profit before tax 59,134 94,938 10,876 25,378 93,297
Profit attributable to owners of the Company 48,103 67,291 8,549 18,586 119,495
Shareholders’ funds 1,477,582 1,364,508 1,297,164 1,354,997 1,316,585
PER SHARE
Earnings per share (cents) 11.8 16.5 2.1 4.6 30.4
Dividend per share (cents) 6.0 6.0 4.0 4.0 54.0 (a)
Net asset value per share ($) 3.62 3.34 3.18 3.32 3.23
FINANCIAL RATIOS
Return on equity (%) 3.4 5.1 0.6 1.4 9.7
Net gearing (%) 25.9 22.5 22.8 Net cash 11.5
Note: (a) This includes the special interim dividend of 50 cents per share paid on 20 September 2013.
GROUP FINANCIAL HIGHLIGHTS
2017$’000
2016$’000
2015$’000
2014$’000
2013$’000
YEAR IN REVIEW
OUR BUSINESS PLATFORMS OUR GROWTH DRIVERS12
2017$’000
2016$’000
2015$’000
2014$’000
2013$’000
BALANCE SHEET
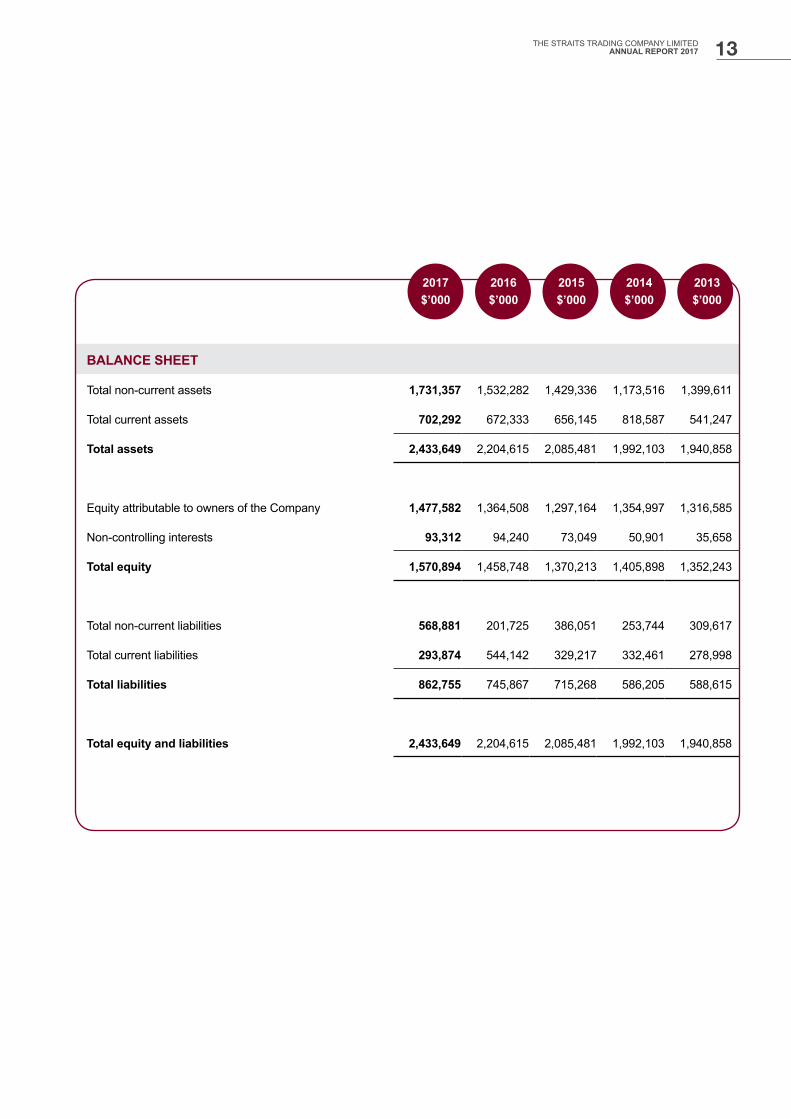
Total non-current assets 1,731,357 1,532,282 1,429,336 1,173,516 1,399,611
Total current assets 702,292 672,333 656,145 818,587 541,247
Total assets 2,433,649 2,204,615 2,085,481 1,992,103 1,940,858
Equity attributable to owners of the Company 1,477,582 1,364,508 1,297,164 1,354,997 1,316,585
Non-controlling interests 93,312 94,240 73,049 50,901 35,658
Total equity 1,570,894 1,458,748 1,370,213 1,405,898 1,352,243
Total non-current liabilities 568,881 201,725 386,051 253,744 309,617
Total current liabilities 293,874 544,142 329,217 332,461 278,998
Total liabilities 862,755 745,867 715,268 586,205 588,615
Total equity and liabilities 2,433,649 2,204,615 2,085,481 1,992,103 1,940,858
2017$’000
2016$’000
2015$’000
2014$’000
2013$’000
13THE STRAITS TRADING COMPANY LIMITEDANNUAL REPORT 2017
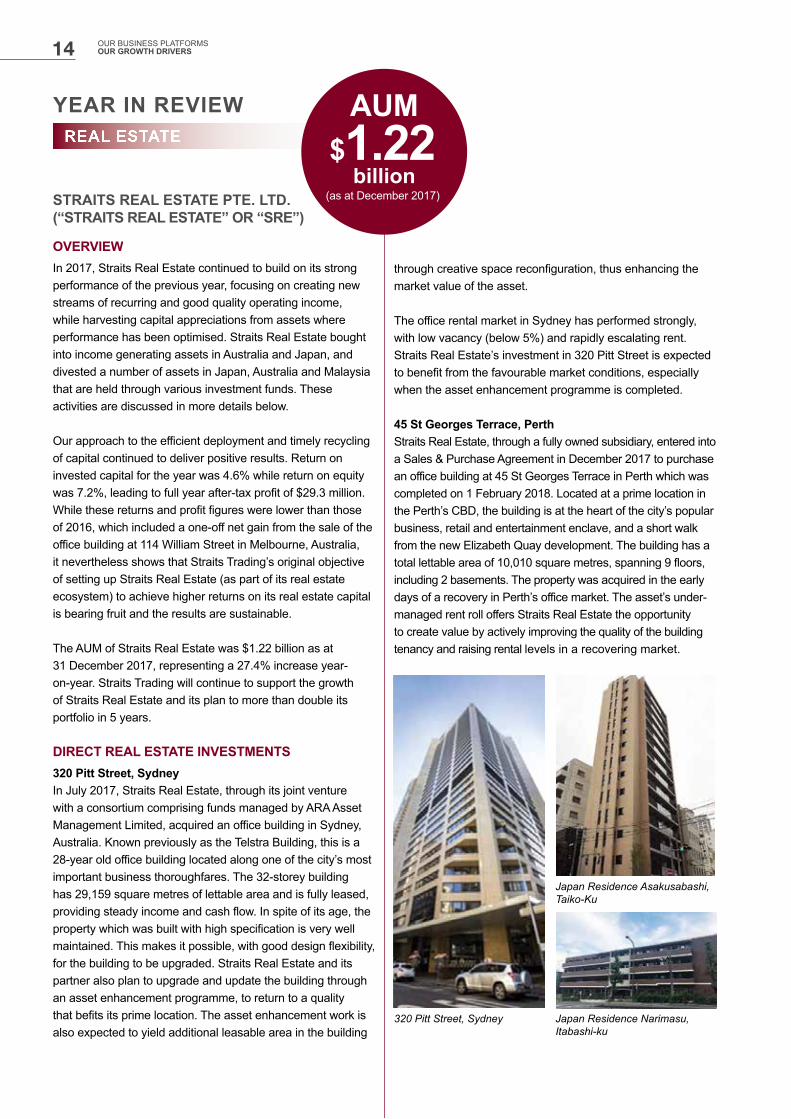
OVERVIEWIn 2017, Straits Real Estate continued to build on its strong performance of the previous year, focusing on creating new streams of recurring and good quality operating income, while harvesting capital appreciations from assets where performance has been optimised. Straits Real Estate bought into income generating assets in Australia and Japan, and divested a number of assets in Japan, Australia and Malaysia that are held through various investment funds. These activities are discussed in more details below.
Our approach to the efficient deployment and timely recycling of capital continued to deliver positive results. Return on invested capital for the year was 4.6% while return on equity was 7.2%, leading to full year after-tax profit of $29.3 million. While these returns and profit figures were lower than those of 2016, which included a one-off net gain from the sale of the office building at 114 William Street in Melbourne, Australia, it nevertheless shows that Straits Trading’s original objective of setting up Straits Real Estate (as part of its real estate ecosystem) to achieve higher returns on its real estate capital is bearing fruit and the results are sustainable.
The AUM of Straits Real Estate was $1.22 billion as at 31 December 2017, representing a 27.4% increase year-on-year. Straits Trading will continue to support the growth of Straits Real Estate and its plan to more than double its portfolio in 5 years.
DIRECT REAL ESTATE INVESTMENTS320 Pitt Street, SydneyIn July 2017, Straits Real Estate, through its joint venture with a consortium comprising funds managed by ARA Asset Management Limited, acquired an office building in Sydney, Australia. Known previously as the Telstra Building, this is a 28-year old office building located along one of the city’s most important business thoroughfares. The 32-storey building has 29,159 square metres of lettable area and is fully leased, providing steady income and cash flow. In spite of its age, the property which was built with high specification is very well maintained. This makes it possible, with good design flexibility, for the building to be upgraded. Straits Real Estate and its partner also plan to upgrade and update the building through an asset enhancement programme, to return to a quality that befits its prime location. The asset enhancement work is also expected to yield additional leasable area in the building
through creative space reconfiguration, thus enhancing the market value of the asset.
The office rental market in Sydney has performed strongly, with low vacancy (below 5%) and rapidly escalating rent. Straits Real Estate’s investment in 320 Pitt Street is expected to benefit from the favourable market conditions, especially when the asset enhancement programme is completed.
45 St Georges Terrace, PerthStraits Real Estate, through a fully owned subsidiary, entered into a Sales & Purchase Agreement in December 2017 to purchase an office building at 45 St Georges Terrace in Perth which was completed on 1 February 2018. Located at a prime location in the Perth’s CBD, the building is at the heart of the city’s popular business, retail and entertainment enclave, and a short walk from the new Elizabeth Quay development. The building has a total lettable area of 10,010 square metres, spanning 9 floors, including 2 basements. The property was acquired in the early days of a recovery in Perth’s office market. The asset’s under-managed rent roll offers Straits Real Estate the opportunity to create value by actively improving the quality of the building tenancy and raising rental levels in a recovering market.
STRAITS REAL ESTATE PTE. LTD. (“STRAITS REAL ESTATE” OR “SRE”)
REAL ESTATE
320 Pitt Street, Sydney
Japan Residence Asakusabashi, Taiko-Ku
Japan Residence Narimasu, Itabashi-ku
YEAR IN REVIEW
$1.22billion
OUR BUSINESS PLATFORMS OUR GROWTH DRIVERS14
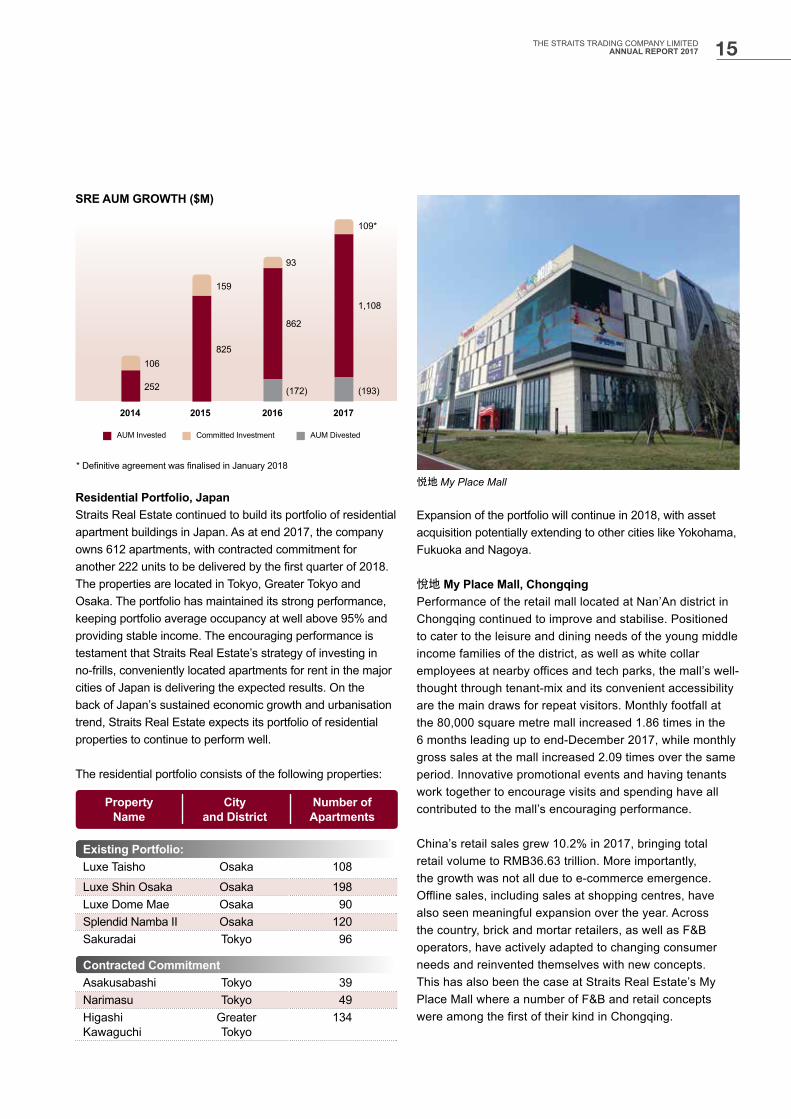
Residential Portfolio, JapanStraits Real Estate continued to build its portfolio of residential apartment buildings in Japan. As at end 2017, the company owns 612 apartments, with contracted commitment for another 222 units to be delivered by the first quarter of 2018. The properties are located in Tokyo, Greater Tokyo and Osaka. The portfolio has maintained its strong performance, keeping portfolio average occupancy at well above 95% and providing stable income. The encouraging performance is testament that Straits Real Estate’s strategy of investing in no-frills, conveniently located apartments for rent in the major cities of Japan is delivering the expected results. On the back of Japan’s sustained economic growth and urbanisation trend, Straits Real Estate expects its portfolio of residential properties to continue to perform well.
The residential portfolio consists of the following properties:
Expansion of the portfolio will continue in 2018, with asset acquisition potentially extending to other cities like Yokohama, Fukuoka and Nagoya.
悅地 My Place Mall, ChongqingPerformance of the retail mall located at Nan’An district in Chongqing continued to improve and stabilise. Positioned to cater to the leisure and dining needs of the young middle income families of the district, as well as white collar employees at nearby offices and tech parks, the mall’s well- thought through tenant-mix and its convenient accessibility are the main draws for repeat visitors. Monthly footfall at the 80,000 square metre mall increased 1.86 times in the 6 months leading up to end-December 2017, while monthly gross sales at the mall increased 2.09 times over the same period. Innovative promotional events and having tenants work together to encourage visits and spending have all contributed to the mall’s encouraging performance.
China’s retail sales grew 10.2% in 2017, bringing total retail volume to RMB36.63 trillion. More importantly, the growth was not all due to e-commerce emergence. Offline sales, including sales at shopping centres, have also seen meaningful expansion over the year. Across the country, brick and mortar retailers, as well as F&B operators, have actively adapted to changing consumer needs and reinvented themselves with new concepts. This has also been the case at Straits Real Estate’s My Place Mall where a number of F&B and retail concepts were among the first of their kind in Chongqing.
SRE AUM GROWTH ($M)
悦地 My Place Mall
AUM Invested Committed Investment AUM Divested
2014 2015 2016 2017
252
825
(172) (193)
1,108
109*
862
93
159
106
Property Name
City and District
Number of Apartments
Existing Portfolio:Luxe Taisho Osaka 108
Luxe Shin Osaka Osaka 198Luxe Dome Mae Osaka 90Splendid Namba II Osaka 120Sakuradai Tokyo 96
Contracted CommitmentAsakusabashi Tokyo 39Narimasu Tokyo 49Higashi Kawaguchi
Greater Tokyo
134
15THE STRAITS TRADING COMPANY LIMITEDANNUAL REPORT 2017
* Definitive agreement was finalised in January 2018

FUND INVESTMENTSGreater Tokyo Office FundThe Greater Tokyo Office Fund, which had a portfolio of seven assets, successfully divested two assets at a profit during the year. The divested assets include a building located in the Shinagawa area and another in the Tokyo Bay vicinity. Both exits delivered IRRs that were above 15% per annum and equity multiples of 1.5x or higher.
The divestments made by the Greater Tokyo Office Fund to date has out-performed their original targets. Straits Real Estate is confident that the fund will perform well for its remaining assets, which include properties in Yokohama City, Tokyo Ota Ward, Tokyo Shibuya Ward, Tokyo Koto Ward and in Chiba Prefecture.
SRE Committed Capital (December 2017) – JPY7,200.0 million
SRE Contributed Capital (December 2017) – JPY6,828.6 million
ARA Summit Development Fund The ARA Summit Development Fund had a portfolio of three mezzanine loans made to residential development projects in Sydney and Melbourne. During the year, the fund successfully exited its investment in the York & George project in downtown Sydney, delivering an IRR of 20% per annum and an equity multiple of 1.5x based on USD terms. The fund’s remaining investments include its mezzanine loans made to the Victoria One project and the Heidelburg project, both located in Melbourne.
SRE Committed Capital (December 2017) – USD80.0 million
SRE Contributed Capital (December 2017) – USD34.1 million
ARA Harmony Fund IIIThe ARA Harmony Fund III divested the Mont Kiara Office Tower in 2017. The investment in this suburban office building produced an IRR of 16.8% per annum and an equity multiple of 1.5x based on SGD terms.
The fund continues to actively manage the remaining assets in the portfolio, which include the Ipoh Parade Mall in Perak, the Klang Parade Mall and Citta Mall in Selangor, the AEON Bandaraya in Malacca, and the 1 Mont Kiara Mall in Kuala Lumpur.
SRE Committed Capital (December 2017) – SGD72.8 million
SRE Contributed Capital (December 2017) – SGD70.2 million
ARA ASSET MANAGEMENT LIMITED (“ARA”)
ARA, an indirectly owned associate of Straits Trading, is a premier integrated real estate fund manager focused on the management of REITs and private real estate funds. ARA manages listed REITs in Singapore and Hong Kong, and also invests in and manages private real estate funds in the Asia Pacific region. Its real estate portfolio spans the office, retail, logistics/industrial, hospitality and residential sectors. ARA’s real estate management services division comprising property management and convention & exhibition services complements its fund management business.
In 2017, Straits Trading, together with the other consortium members comprising JL Investment Group (“JLIG”), CK Asset Holdings Limited (“CKAH”), Warburg Pincus LLC (“Warburg Pincus”) and AVIC Trust Co. Ltd (“AVIC Trust”), successfully privatised ARA at a scheme consideration of $1.78 per share, valuing ARA at around $1.8 billion. This transaction involved exchanging Straits Trading’s 20.1% stake in ARA for 20.95% of ARA Asset Management Holdings Pte. Ltd. (“ARA Holdco”) and $48.2 million in cash proceeds. Today, ARA has the long-term commitment of two new strategic partners, Warburg Pincus and AVIC Trust. Warburg Pincus is a leading global private equity firm focused on growth investing. It has more than USD40 billion in private equity AUM and is experienced in partnering management teams seeking to build durable companies with sustainable value. AVIC Trust is a leading investment and trust manager in China with AUM of over RMB470 billion.
The privatised ARA is expected to gain increased access to capital for growth given Warburg Pincus’ investment track record in real estate platforms around the world and its global network of business and investor relationships. In addition, ARA will look to tap on AVIC Trust’s unique distribution capability, which provides ARA the access to Chinese capital markets and other business opportunities in China.
YEAR IN REVIEW
OUR BUSINESS PLATFORMS OUR GROWTH DRIVERS16
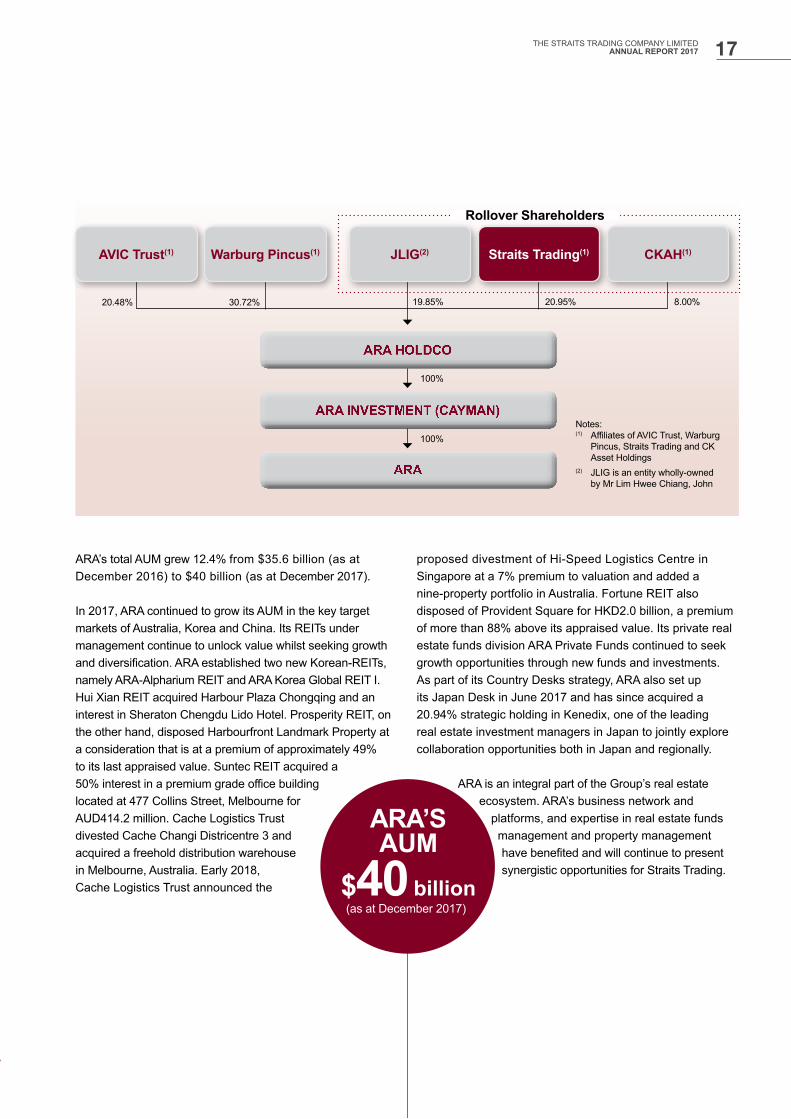
ARA’s total AUM grew 12.4% from $35.6 billion (as at December 2016) to $40 billion (as at December 2017). In 2017, ARA continued to grow its AUM in the key target markets of Australia, Korea and China. Its REITs under management continue to unlock value whilst seeking growth and diversification. ARA established two new Korean-REITs, namely ARA-Alpharium REIT and ARA Korea Global REIT I. Hui Xian REIT acquired Harbour Plaza Chongqing and an interest in Sheraton Chengdu Lido Hotel. Prosperity REIT, on the other hand, disposed Harbourfront Landmark Property at a consideration that is at a premium of approximately 49% to its last appraised value. Suntec REIT acquired a 50% interest in a premium grade office building located at 477 Collins Street, Melbourne for AUD414.2 million. Cache Logistics Trust divested Cache Changi Districentre 3 and acquired a freehold distribution warehouse in Melbourne, Australia. Early 2018, Cache Logistics Trust announced the
proposed divestment of Hi-Speed Logistics Centre in Singapore at a 7% premium to valuation and added a nine-property portfolio in Australia. Fortune REIT also disposed of Provident Square for HKD2.0 billion, a premium of more than 88% above its appraised value. Its private real estate funds division ARA Private Funds continued to seek growth opportunities through new funds and investments. As part of its Country Desks strategy, ARA also set up its Japan Desk in June 2017 and has since acquired a 20.94% strategic holding in Kenedix, one of the leading real estate investment managers in Japan to jointly explore collaboration opportunities both in Japan and regionally.
ARA is an integral part of the Group’s real estate ecosystem. ARA’s business network and
platforms, and expertise in real estate funds management and property management have benefited and will continue to present synergistic opportunities for Straits Trading.
AVIC Trust(1) Warburg Pincus(1)
Rollover Shareholders
JLIG(2) Straits Trading(1) CKAH(1)
ARA HOLDCO
ARA INVESTMENT (CAYMAN)
ARA
20.48% 30.72% 19.85% 20.95% 8.00%
100%
100%Notes:(1) Affiliates of AVIC Trust, Warburg
Pincus, Straits Trading and CK Asset Holdings
(2) JLIG is an entity wholly-owned by Mr Lim Hwee Chiang, John
17THE STRAITS TRADING COMPANY LIMITEDANNUAL REPORT 2017
YEAR IN REVIEWHOSPITALITY
FAR EAST HOSPITALITY HOLDINGS PTE LTD(“FAR EAST HOSPITALITY”)
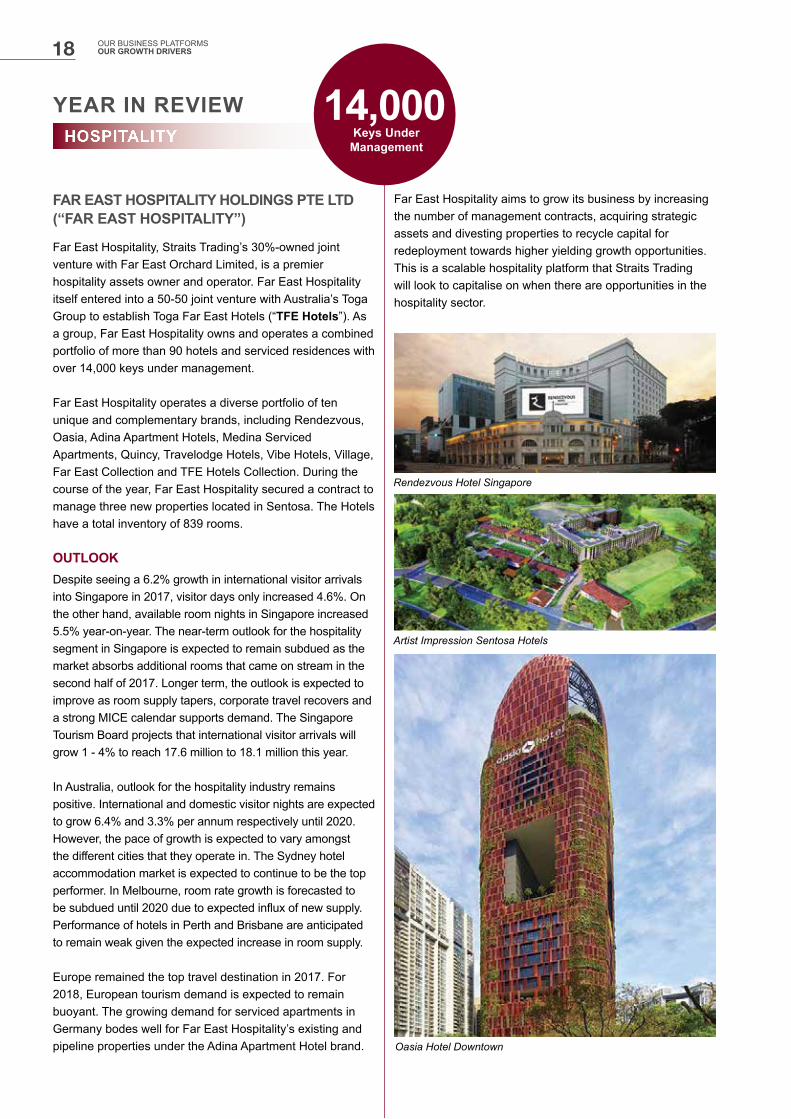
Far East Hospitality, Straits Trading’s 30%-owned joint venture with Far East Orchard Limited, is a premier hospitality assets owner and operator. Far East Hospitality itself entered into a 50-50 joint venture with Australia’s Toga Group to establish Toga Far East Hotels (“TFE Hotels”). As a group, Far East Hospitality owns and operates a combined portfolio of more than 90 hotels and serviced residences with over 14,000 keys under management.
Far East Hospitality operates a diverse portfolio of ten unique and complementary brands, including Rendezvous, Oasia, Adina Apartment Hotels, Medina Serviced Apartments, Quincy, Travelodge Hotels, Vibe Hotels, Village, Far East Collection and TFE Hotels Collection. During the course of the year, Far East Hospitality secured a contract to manage three new properties located in Sentosa. The Hotels have a total inventory of 839 rooms.
OUTLOOKDespite seeing a 6.2% growth in international visitor arrivals into Singapore in 2017, visitor days only increased 4.6%. On the other hand, available room nights in Singapore increased 5.5% year-on-year. The near-term outlook for the hospitality segment in Singapore is expected to remain subdued as the market absorbs additional rooms that came on stream in the second half of 2017. Longer term, the outlook is expected to improve as room supply tapers, corporate travel recovers and a strong MICE calendar supports demand. The Singapore Tourism Board projects that international visitor arrivals will grow 1 - 4% to reach 17.6 million to 18.1 million this year.
In Australia, outlook for the hospitality industry remains positive. International and domestic visitor nights are expected to grow 6.4% and 3.3% per annum respectively until 2020. However, the pace of growth is expected to vary amongst the different cities that they operate in. The Sydney hotel accommodation market is expected to continue to be the top performer. In Melbourne, room rate growth is forecasted to be subdued until 2020 due to expected influx of new supply. Performance of hotels in Perth and Brisbane are anticipated to remain weak given the expected increase in room supply.
Europe remained the top travel destination in 2017. For 2018, European tourism demand is expected to remain buoyant. The growing demand for serviced apartments in Germany bodes well for Far East Hospitality’s existing and pipeline properties under the Adina Apartment Hotel brand.
Far East Hospitality aims to grow its business by increasing the number of management contracts, acquiring strategic assets and divesting properties to recycle capital for redeployment towards higher yielding growth opportunities. This is a scalable hospitality platform that Straits Trading will look to capitalise on when there are opportunities in the hospitality sector.
Rendezvous Hotel Singapore
Oasia Hotel Downtown
Artist Impression Sentosa Hotels
14,000Keys Under Management
18 OUR BUSINESS PLATFORMS OUR GROWTH DRIVERS
Straits Trading’s 54.8%-owned resources subsidiary, Malaysia Smelting Corporation Berhad (“MSC” together with its subsidiaries, “MSC Group”) is one of the three largest refined tin producers in the world.
MSC Group is involved in both downstream and upstream activities of the tin value chain through its international tin smelting business at Butterworth and tin mining operations at Rahman Hydraulic Tin (“RHT”) in the state of Perak.
Despite the challenging business climate in 2017, MSC Group remained resilient and for the first time in ten years, reported a profitable set of financial results for two consecutive years. Stronger tin prices led to improved earnings from the tin mining division at RHT, however this was weighed down by inefficiencies in its international tin smelting operations due to aged equipment. This will be addressed as the MSC Group moves closer to the completion of the smelting facility upgrade with state-of-the-art extractive technology in its new location in Pulau Indah, Port Klang.
FINANCIAL PERFORMANCEFor the year ended 31 December 2017 (“FY2017”), MSC Group reported a pre-tax profit and net profit of RM28.2 million and RM16.1 million respectively. Group revenue marginally decreased to RM1.4 billion in FY2017, compared to RM1.5 billion in the previous year due to lower sales volume of refined tin during the year.
International Tin Smelting OperationsMSC Group’s international tin smelting operations recorded a net loss of RM18.8 million in FY2017 as compared to a net profit of RM14.3 million in FY2016. The tin smelting division’s performance was impacted by higher cost of sales and operating expenses as well as lower recovery of tin from the aged smelting equipment at the Butterworth facility. The absence of a favourable stock valuation adjustment of RM17.4 million (which occurred in FY2016) further contributed to the performance difference.
Moving forward, the performance of the tin smelting division is expected to turnaround as extraction yields, operational efficiencies and manpower costs are set to improve once the new production facility in Pulau Indah is fully operational.
The tin smelting operations achieved higher production output of 27,172 tonnes of refined tin for FY2017, up from 26,802 tonnes in the previous year that was mainly attributable to an increase in supply of feed materials during the year.
Rahman Hydraulic Tin (“RHT”) RHT, which operates Malaysia’s biggest hard-rock open-pit mine in the state of Perak, maintained its position as the country’s largest producer of tin-in concentrates in 2017 by far.
For 2017, RHT’s production volume of tin-in concentrates remained stable at approximately 2,226 tonnes as all processing plants at the mine operated at close to full capacity throughout the year treating ore material mined from the open-pit operation.
RHT reported a 19% increase in net profit to RM34.6 million in FY2017 from RM29.0 million
in FY2016. The growth was on the back of higher average tin prices during the year, which increased by 12% to USD20,036/tonne from USD17,867/tonne in 2016 (Source : Kuala Lumpur Tin Market).
MALAYSIA SMELTING CORPORATION BERHAD (“MSC”)
YEAR IN REVIEWRESOURCES
Tin ingots ready for delivery
19THE STRAITS TRADING COMPANY LIMITEDANNUAL REPORT 2017

OUTLOOKGoing into 2018, MSC Group is cautiously optimistic on its outlook as it foresees market conditions to remain challenging with global metal prices and currencies continuing to fluctuate. In order to remain competitive, MSC Group is focused on the execution of the ongoing rationalisation measures to improve cost and operational efficiencies.
MSC Group looks forward to the completion of the upgrade of its existing smelting technology with the relocation of the smelting operations from Butterworth to Pulau Indah. The production facility in Pulau Indah houses an advance smelting technology using the Top Submerged Lance furnace which employs a more comprehensive single stage continuous
YEAR IN REVIEWRESOURCES
smelting process, enabling higher operating efficiency and lower operating expenditure while bringing about a much smaller carbon footprint. The transition is currently underway and MSC Group expects the new plant to be fully operational in the medium term.
With the smelter upgrade, MSC Group is well-positioned to leverage on the rising demand of tin, which is expected to be driven by new applications of tin in various technologies such as lithium-ion batteries for electronic vehicles.
Furthermore, MSC Group continues to carry out exploration activities of new tin mine deposits to ensure a sustainable supply of feed intake to support its smelting activities.
Rahman Hydraulic
20 OUR BUSINESS PLATFORMS OUR GROWTH DRIVERS

SUSTAINABILITY REPORT
INTRODUCTIONThis is Straits Trading’s second Sustainability Report, detailing our sustainability-related initiatives over the past financial year covering issues related to governance, stakeholder engagement, community projects and the environment.
Through this report, we also hope to identify opportunities for improvement to our sustainability management as well as issues that are integral to our business in order to address them effectively and appropriately. Together with relevant partners within our businesses, we hope to explore ways to improve sustainable practices across all aspects of our businesses.
Scope of this report This report covers the activities and Environmental, Social and Governance (“ESG”) performance of Straits Trading
with a focus on Straits Real Estate, our largest investment platform, as well as Malaysia Smelting Corporation (“MSC”), another of our key subsidiaries. Our corporate governance and human capital related policies and data refer to Straits Trading and Straits Real Estate.
COMPANY OVERVIEWAbout Straits TradingThe history of Straits Trading dates back to 1887. Founded 131 years ago as a tin smelting company, it is today, an investment company with diversified interests in Real Estate, Hospitality and Resources across the Asia Pacific.
The Straits Trading Mission To shape and transform our investments into businesses of enhanced value.
HISTORICAL TIMELINE OF STRAITS TRADING
1887
Founded as a tin smelting company, Straits Trading is one of the oldest companies listed on the Singapore Exchange.
2008-09
2013-14
Tecity Group acquired a majority stake in Straits Trading and began transforming its investments into businesses of enhanced value.
Straits Trading sold its stake in WBL to United Engineers at a significant premium and reinvested into new businesses.
It formed Far East Hospitality Holdings, a joint venture with Far East Orchard Limted. It also acquired a 20% stake in ARA Asset Management and formed Straits Real Estate Pte Ltd.
2016-17
Straits Trading strengthened its real estate portfolio with key acquisitions across Australia and Japan.
Together with a consortium comprising JL Investment Group, CK Asset Holdings,Warburg Pincus and AVIC Trust, it sucessfully privatised ARA Asset Management and became the only publicly-listed entity in Singapore to hold a significant stake.
1965-92
As the first Asian Chairman, Tan Sri (Dr) Tan Chin Tuan led Straits Trading to diversify globally, extending its business globally and beyond.
21THE STRAITS TRADING COMPANY LIMITEDANNUAL REPORT 2017
SUSTAINABILITY REPORT
WHAT SUSTAINABILITY MEANS TO USAt Straits Trading, we believe that a sustainable business is dependent on economic vitality, social equity and environmental well-being. We do not see these goals as mutually exclusive, but inextricably linked. As business leaders, we are committed to developing sustainable business practices that meet the needs of the present without compromising the welfare of future generations.
Sustainability to us is about looking ahead and managing our responsibilities towards our shareholders and other stakeholders. This means managing the various business risks and opportunities that come our way, including those relating to ESG trends.
Defining the Content of this ReportThe business activities of Straits Trading and Straits Real Estate focus on investments in real estate and real estate funds. We place priority on the interests and fair treatment of our investors and shareholders and we have taken these activities and values into consideration when conducting our materiality assessment. We began the process by identifying the various direct and indirect ESG impacts of our activities. We also carefully considered where Straits Trading and Straits Real Estate have control and influence over the various ESG impacts of these activities in order to identify opportunities for us to most effectively manage those impacts.
We believe we have the most control in three areas:• Investing in a responsible manner• Practising good compliance• Engaging and developing our staff
In addition, we acknowledge that our position as a provider of capital gives us a certain influence with our business partners. As an investor in different funds, we do not have direct control over how fund managers invest our capital or how asset managers manage our properties. Nonetheless, we aim to select managers that operate in a responsible manner and engage with them regularly to create and increase awareness.
These conclusions formed a basis for our ESG materiality assessment.
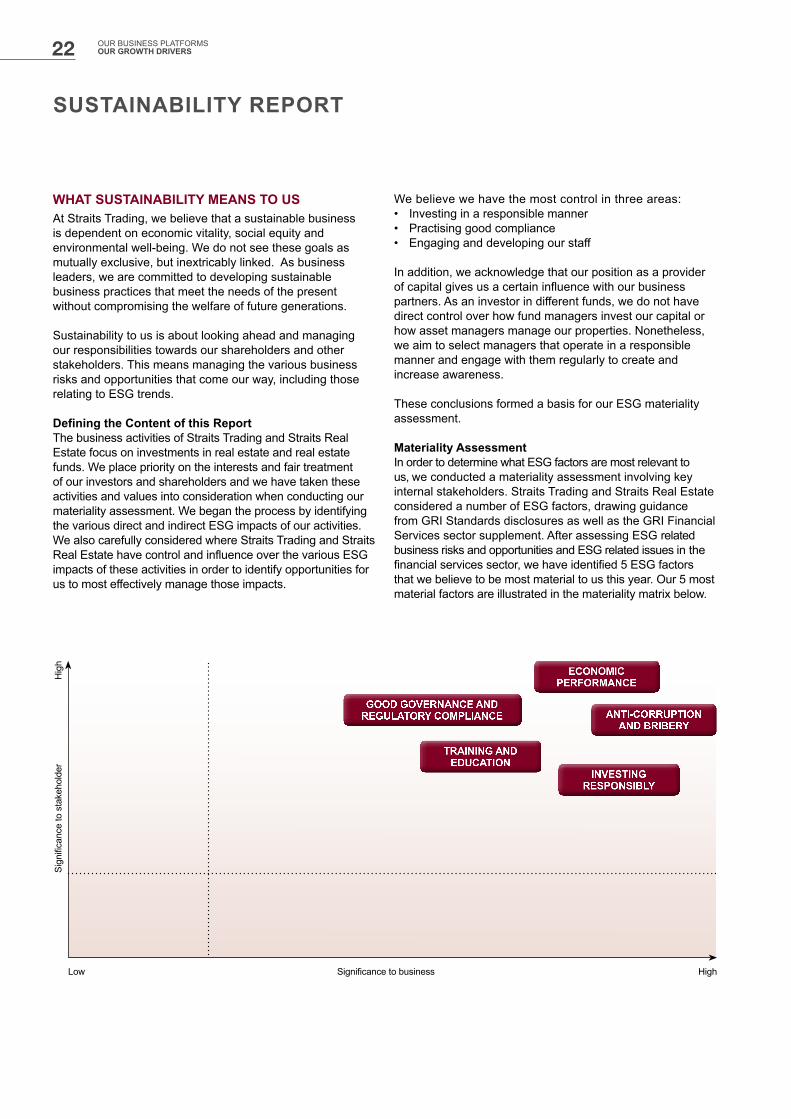
Materiality AssessmentIn order to determine what ESG factors are most relevant to us, we conducted a materiality assessment involving key internal stakeholders. Straits Trading and Straits Real Estateconsidered a number of ESG factors, drawing guidance from GRI Standards disclosures as well as the GRI Financial Services sector supplement. After assessing ESG related business risks and opportunities and ESG related issues in the financial services sector, we have identified 5 ESG factors that we believe to be most material to us this year. Our 5 most material factors are illustrated in the materiality matrix below.
Sign
ifica
nce
to s
take
hold
erH
igh
Low HighSignificance to business
ECONOMIC PERFORMANCE
ANTI-CORRUPTION AND BRIBERY
INVESTING RESPONSIBLY
TRAINING AND EDUCATION
GOOD GOVERNANCE AND REGULATORY COMPLIANCE
22 OUR BUSINESS PLATFORMS OUR GROWTH DRIVERS
SUSTAINABILITY REPORT
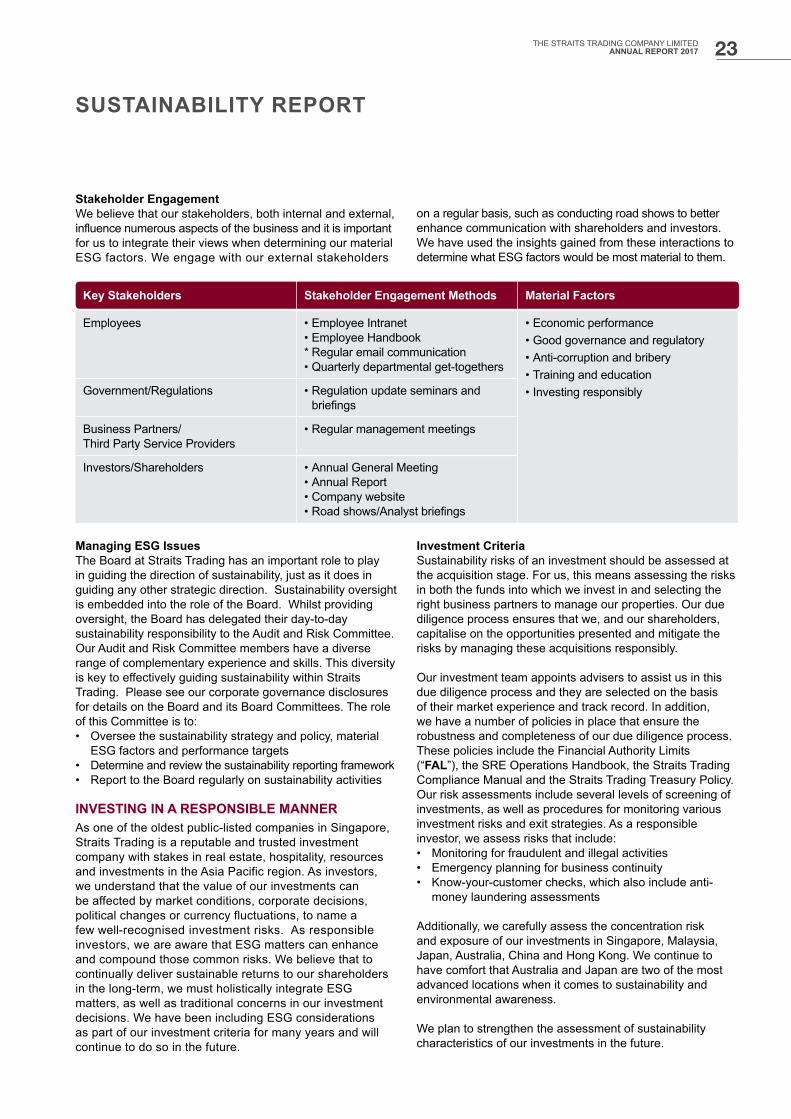
Stakeholder EngagementWe believe that our stakeholders, both internal and external, influence numerous aspects of the business and it is important for us to integrate their views when determining our material ESG factors. We engage with our external stakeholders
on a regular basis, such as conducting road shows to better enhance communication with shareholders and investors. We have used the insights gained from these interactions to determine what ESG factors would be most material to them.
Managing ESG IssuesThe Board at Straits Trading has an important role to play in guiding the direction of sustainability, just as it does in guiding any other strategic direction. Sustainability oversight is embedded into the role of the Board. Whilst providing oversight, the Board has delegated their day-to-day sustainability responsibility to the Audit and Risk Committee. Our Audit and Risk Committee members have a diverse range of complementary experience and skills. This diversity is key to effectively guiding sustainability within Straits Trading. Please see our corporate governance disclosures for details on the Board and its Board Committees. The role of this Committee is to:• Oversee the sustainability strategy and policy, material
ESG factors and performance targets• Determine and review the sustainability reporting framework• Report to the Board regularly on sustainability activities
INVESTING IN A RESPONSIBLE MANNERAs one of the oldest public-listed companies in Singapore, Straits Trading is a reputable and trusted investment company with stakes in real estate, hospitality, resources and investments in the Asia Pacific region. As investors, we understand that the value of our investments can be affected by market conditions, corporate decisions, political changes or currency fluctuations, to name a few well-recognised investment risks. As responsible investors, we are aware that ESG matters can enhance and compound those common risks. We believe that to continually deliver sustainable returns to our shareholders in the long-term, we must holistically integrate ESG matters, as well as traditional concerns in our investment decisions. We have been including ESG considerations as part of our investment criteria for many years and will continue to do so in the future.
Investment CriteriaSustainability risks of an investment should be assessed at the acquisition stage. For us, this means assessing the risks in both the funds into which we invest in and selecting the right business partners to manage our properties. Our due diligence process ensures that we, and our shareholders, capitalise on the opportunities presented and mitigate the risks by managing these acquisitions responsibly.
Our investment team appoints advisers to assist us in this due diligence process and they are selected on the basis of their market experience and track record. In addition, we have a number of policies in place that ensure the robustness and completeness of our due diligence process. These policies include the Financial Authority Limits (“FAL”), the SRE Operations Handbook, the Straits Trading Compliance Manual and the Straits Trading Treasury Policy. Our risk assessments include several levels of screening of investments, as well as procedures for monitoring various investment risks and exit strategies. As a responsible investor, we assess risks that include:• Monitoring for fraudulent and illegal activities• Emergency planning for business continuity• Know-your-customer checks, which also include anti-
money laundering assessments
Additionally, we carefully assess the concentration risk and exposure of our investments in Singapore, Malaysia, Japan, Australia, China and Hong Kong. We continue to have comfort that Australia and Japan are two of the most advanced locations when it comes to sustainability and environmental awareness.
We plan to strengthen the assessment of sustainability characteristics of our investments in the future.
Key Stakeholders Stakeholder Engagement Methods Material Factors
Employees • Employee Intranet• Employee Handbook* Regular email communication• Quarterly departmental get-togethers
• Economic performance• Good governance and regulatory• Anti-corruption and bribery• Training and education• Investing responsiblyGovernment/Regulations • Regulation update seminars and
briefings
Business Partners/ Third Party Service Providers
• Regular management meetings
Investors/Shareholders • Annual General Meeting• Annual Report• Company website• Road shows/Analyst briefings
23THE STRAITS TRADING COMPANY LIMITEDANNUAL REPORT 2017
SUSTAINABILITY REPORT
FAL – Financial Authority Limits, formalised in May 2015.The Financial Authority Limits (“FAL”) Policy is the mechanism through which the Board or its delegate approves transactions and financial commitments within the Group.
The FAL covers the authorisation limits of Investment Activities including Investment Portfolio Management, Financing and Debt Management, Foreign Exchange and Interest Rate Risk Management, Capital Expenditure and Operating Expenditure.
The objectives of FAL are to define the authorisation limits of the Group’s activities and ensure that all staff of the Group are clear on the limits of their authority, and are aware of the process for getting approval for financial commitments.
The FAL is applicable to Straits Trading and all non-listed subsidiaries of the Group. Straits Real Estate also has its own FAL to govern its authorisation matrix.
Active InvestmentsOur responsibility does not end upon acquisition. We continue to be involved in ensuring the sustainable performance of our investments through the life of those investments.
Management of Our Assets As owners and landlords, we do not always have direct control on operational management aspect of the buildings, including energy, water and waste management, health and safety of staff, tenants and visitors or compliance with management and tenant regulations. However, we do recognise that we can influence these matters through careful selection of our third party service providers and working closely with our property managers and tenants. We set out our procedure for selecting third party service providers as well as our leasing contracts in our Operations Handbook and we ensure that we follow this procedure each time.
Specifically, we encourage our property managers to manage our properties in an eco-efficient manner from day-to-day maintenance to larger scale refurbishments.
At 悦地 My Place Mall in Chongqing, Straits Real Estate is both the owner and mall manager and we are proud to say that we have commenced a number of environmental initiatives at this location. In addition, we have various features at our Klang Parade and Ipoh Parade that improve their sustainability performances which were completed in March 2017. Please see our case studies on pages 24 to 25. We intend to deepen our sustainability engagement on all our properties and investments where opportunities allow us to do so.
In the future, we plan to continue to encourage our third party service providers to increase their focus in their respective sustainability performances by engaging them regularly on this subject and through sharing of knowledge.
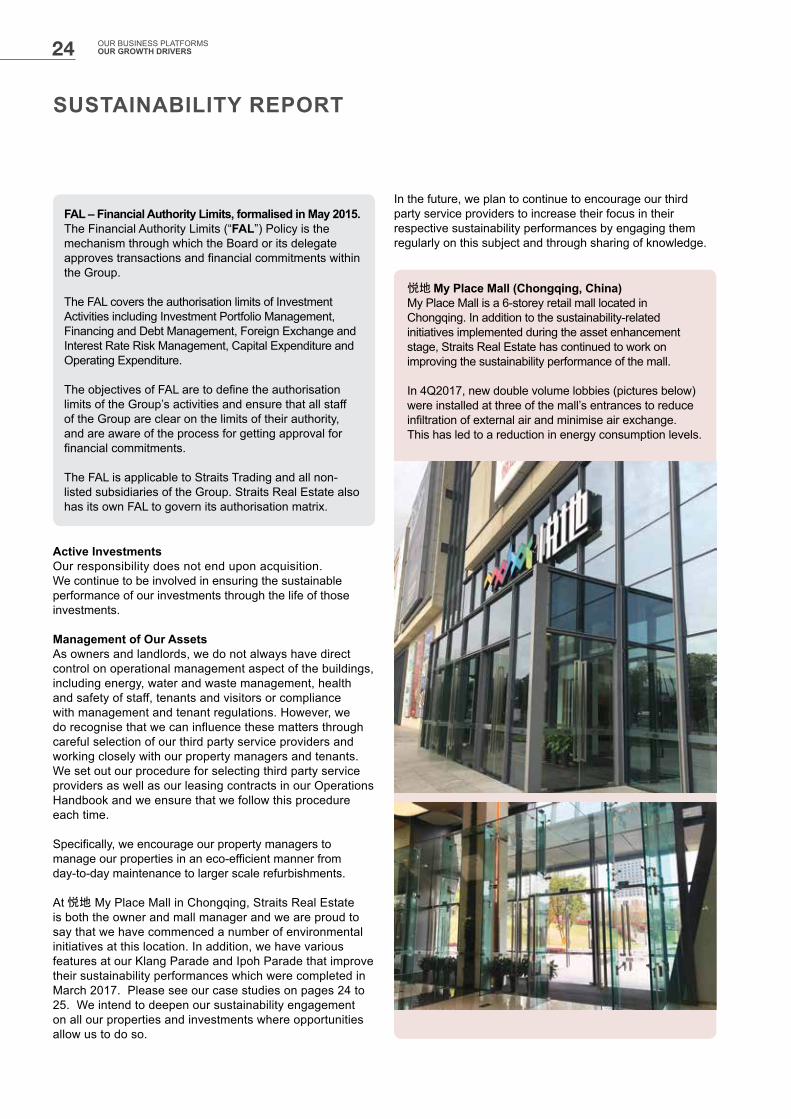
悦地 My Place Mall (Chongqing, China)My Place Mall is a 6-storey retail mall located in Chongqing. In addition to the sustainability-related initiatives implemented during the asset enhancement stage, Straits Real Estate has continued to work on improving the sustainability performance of the mall. In 4Q2017, new double volume lobbies (pictures below) were installed at three of the mall’s entrances to reduce infiltration of external air and minimise air exchange. This has led to a reduction in energy consumption levels.
24 OUR BUSINESS PLATFORMS OUR GROWTH DRIVERS
SUSTAINABILITY REPORT
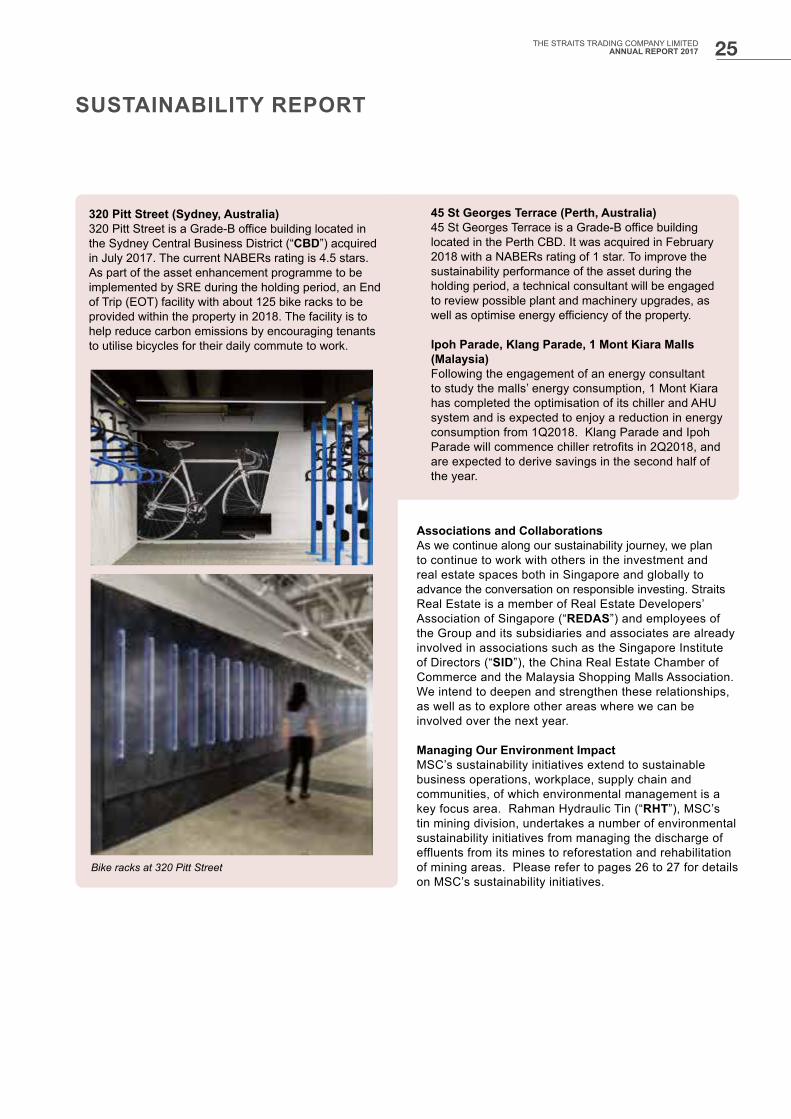
320 Pitt Street (Sydney, Australia)320 Pitt Street is a Grade-B office building located in the Sydney Central Business District (“CBD”) acquired in July 2017. The current NABERs rating is 4.5 stars. As part of the asset enhancement programme to be implemented by SRE during the holding period, an End of Trip (EOT) facility with about 125 bike racks to be provided within the property in 2018. The facility is to help reduce carbon emissions by encouraging tenants to utilise bicycles for their daily commute to work.
45 St Georges Terrace (Perth, Australia)45 St Georges Terrace is a Grade-B office building located in the Perth CBD. It was acquired in February 2018 with a NABERs rating of 1 star. To improve the sustainability performance of the asset during the holding period, a technical consultant will be engaged to review possible plant and machinery upgrades, as well as optimise energy efficiency of the property. Ipoh Parade, Klang Parade, 1 Mont Kiara Malls (Malaysia)Following the engagement of an energy consultant to study the malls’ energy consumption, 1 Mont Kiara has completed the optimisation of its chiller and AHU system and is expected to enjoy a reduction in energy consumption from 1Q2018. Klang Parade and Ipoh Parade will commence chiller retrofits in 2Q2018, and are expected to derive savings in the second half of the year.
Associations and CollaborationsAs we continue along our sustainability journey, we plan to continue to work with others in the investment and real estate spaces both in Singapore and globally to advance the conversation on responsible investing. Straits Real Estate is a member of Real Estate Developers’ Association of Singapore (“REDAS”) and employees of the Group and its subsidiaries and associates are already involved in associations such as the Singapore Institute of Directors (“SID”), the China Real Estate Chamber of Commerce and the Malaysia Shopping Malls Association. We intend to deepen and strengthen these relationships, as well as to explore other areas where we can be involved over the next year.
Managing Our Environment ImpactMSC’s sustainability initiatives extend to sustainable business operations, workplace, supply chain and communities, of which environmental management is a key focus area. Rahman Hydraulic Tin (“RHT”), MSC’s tin mining division, undertakes a number of environmental sustainability initiatives from managing the discharge of effluents from its mines to reforestation and rehabilitation of mining areas. Please refer to pages 26 to 27 for details on MSC’s sustainability initiatives.
Bike racks at 320 Pitt Street
25THE STRAITS TRADING COMPANY LIMITEDANNUAL REPORT 2017

SUSTAINABILITY REPORT
Energy Management• To conserve energy at the mines, a 1.0MW mini hydro
plant (picture below) is used to optimise the usage of power. MSC is one of the few mining companies which uses hydro plants to generate electricity, which currently accounts for 19% of its total energy needs.
• MSC’s newly acquired TSL furnace at Pulau Indah, Port Klang will further optimise the utilisation of electricity moving forward as it will significantly reduce the number of rounds involved in the smelting process.
• An outsourced Certified Energy Manager was employed to advise on matters relating to the effective and efficient use of electrical supply at the mines who will also submit official monthly report to the Energy Commission for monitoring.
• To raise the level of MSC’s in-house knowledge on energy management, the company also trains its managers to be Certified Energy Managers.
Air Quality• An air pollution control system installed at the smelter
since 2012 to mitigate the impact of greenhouse gas and particulate matter emissions into the environment.
• New air quality monitoring system implemented in 2017 to filter out the plume released into the atmosphere.
• Regular air quality monitoring conducted to ensure that the levels are in compliance with the Department of Environment’s (“DOE”) requirements.
Waste Management• Non-hazardous waste materials at the mine comprising
tailing and processed water from ore processing plants are stored or recycled within its operations.
• Overburden waste from mine pits are disposed by hydraulic excavators and dump trucks at the waste dump located at the Southern slopes and foothill of Gunung Paku.
• A scheduled waste management system which is in accordance with the Environmental Quality (Scheduled Wastes) Regulations 2005 of the Environmental Quality Act (EQA) 1974 is in place.
• The process of disposing waste generated at the mines is closely supervised by a Competent Person in Scheduled Waste Management (“CePSWaM”) registered under DOE. In 2017, there were no incident reported involving the spillage of hazardous waste materials.
• To encourage recycling of waste, research and development efforts are underway in collaboration with a leading local university to explore the usage of slimy tailing materials in other industries.
Mine RehabilitationExperimental and progressive mine rehabilitation and greening works are being done well in advance of the mines’ closure when and where it is possible to do so.
Rehabilitation and reforestation initiatives implemented include:• A collaboration with the Forest Research Institute,
Malaysia for a period of five years beginning 2011 on afforestation and reforestation of a total area of 4 hectares with selected high value timber species. The project has been extended until 2020.
• Extensive green works carried out on the slopes of tailing bunds, river banks and waste dump through planting grasses, hydroseeding, as well as planting trees to avoid erosion and sedimentation into the nearby rivers.
• To date, 32 hectares of inactive and mined-out area have been successfully rehabilitated.
SUSTAINABILITY INITIATIVES UNDERTAKEN BY MSC IN 2017:
26 OUR BUSINESS PLATFORMS OUR GROWTH DRIVERS

SUSTAINABILITY REPORT
Water ManagementTo promote efficient management of water, processed water are recycled in the tailing ponds by pumping back clear water from the last tailing pond to the water storage pond, where the water will be re-directed to the plants for utilisation.
As a result, while 8.9 billion gallons of recycled water were consumed by the mining operations, only 528 million gallons were pumped from the nearby river, Sg Kijang to the tailing ponds to make up for the losses from evapotranspiration and water seepages.
Water Quality• To ensure no contamination of water is discharged
from the mine operations, the water quality of the surrounding rivers is closely monitored.
• Water sampling exercises are carried out every fortnight and sent to the Department of Mineral and Geoscience’s laboratory for analysis on PH and heavy metals content.
• In 2017, no contamination of water discharged from the mine operation was reported.
For more information on MSC’s sustainability initiatives, please refer to the MSC Annual Report.
Anti-corruption and BriberyAnti-corruption is part of Straits Trading’s culture, both as part of our practice of being a good corporate citizen and because we understand the otherwise grave consequence on the Group’s reputation and business operations. We have developed and continue to regularly review our Employee Handbook which covers work ethics when dealing with matters that may give rise to conflicts of interest. The Employee Handbook is made available to all our employees. This document covers procedures for mitigating as well as dealing with corruption and bribery incidents, including our Whistleblower Policy. This policy establishes procedures and guidance for the receipt and treatment of verbal or written complaints received by the Group regarding accounting, internal controls, fraud and unethical business practices or conduct, whether submitted by employees or third parties. Additionally, Straits Trading provides quarterly updates to the Audit and Risk Committee on its whistleblowing results.
Straits Trading is pleased that there has been no incident of breaches of anti-corruption laws over the 12 months of this reporting period. We once again target zero breaches in the coming period.
Compliance with Relevant Local Laws and RegulationsAs part of the financial sector, our business activities are subject to numerous laws and regulations covering our business conduct, use of our products and services and environmental regulation in all locations where we operate in. Our Employee Handbook covers our internal rules and policies which aims to govern the actions and behaviours of our employees. This includes work ethics and employee conduct, as well as manage compliance with regulations and conflicts of interest.
In addition, we comply with the Personal Data Protection Act (“PDPA”). We have a PDPA compliance manual and PDPA policy to ensure that employees understand what they need to do to comply with this legislation. We also request that all employees, consultants and suppliers complete the relevant PDPA consent form.
ENGAGING AND DEVELOPING OUR STAFFAt Straits Trading we believe in cultivating an inclusive workplace with a strong emphasis on staff engagement, talent development, career advancement and skills training, while caring for the physical and emotional well-being of our employees. We aim to continuously fine-tune our people management practices to ensure the long-term success and well-being of our staff and businesses.
We provide our employees with an Employee Handbook that provides them with information, including working hours, remuneration, leave and benefits. We review our handbook regularly to keep it up-to-date so that employees are always clear on our policies. We also ensure that our employees understand and buy into our values by including our work ethics in the Employee Handbook.
PRACTISING GOOD COMPLIANCECompliance with the relevant laws and regulations is not just a legal requirement for Straits Trading, but also a duty to our investors and other stakeholders. We recognise that ensuring compliance requires management and regular monitoring. Therefore, we continue to implement our Board Assurance Framework, which identifies, mitigates and manages significant risks, including compliance related risks.
We also have a robust internal audit process with several levels of controls, under the responsibility of the Audit and Risk Committee. We regularly review the adequacy and effectiveness of the Group’s internal controls in relation to the significant risks, including financial, operational, compliance and information technology controls, and risk management systems. Please see the Report on Corporate Governance for details.
27THE STRAITS TRADING COMPANY LIMITEDANNUAL REPORT 2017
SUSTAINABILITY REPORT
We care for employees’ health and wellness. To promote a healthy lifestyle and general wellness, employees are rewarded for staying healthy and employees above 40 years of age are encouraged to go for regular health screening subsidised by the Company.
To ensure that our employees’ concerns and issues are always heard and addressed, we have implemented a grievance process in the Employee Handbook. This process is in place because the Company recognises the value and importance of employees having the opportunity to voice their questions, complaints or grievances, and holding discussions to resolve any misunderstanding so as to preserve harmonious relations between the employees.
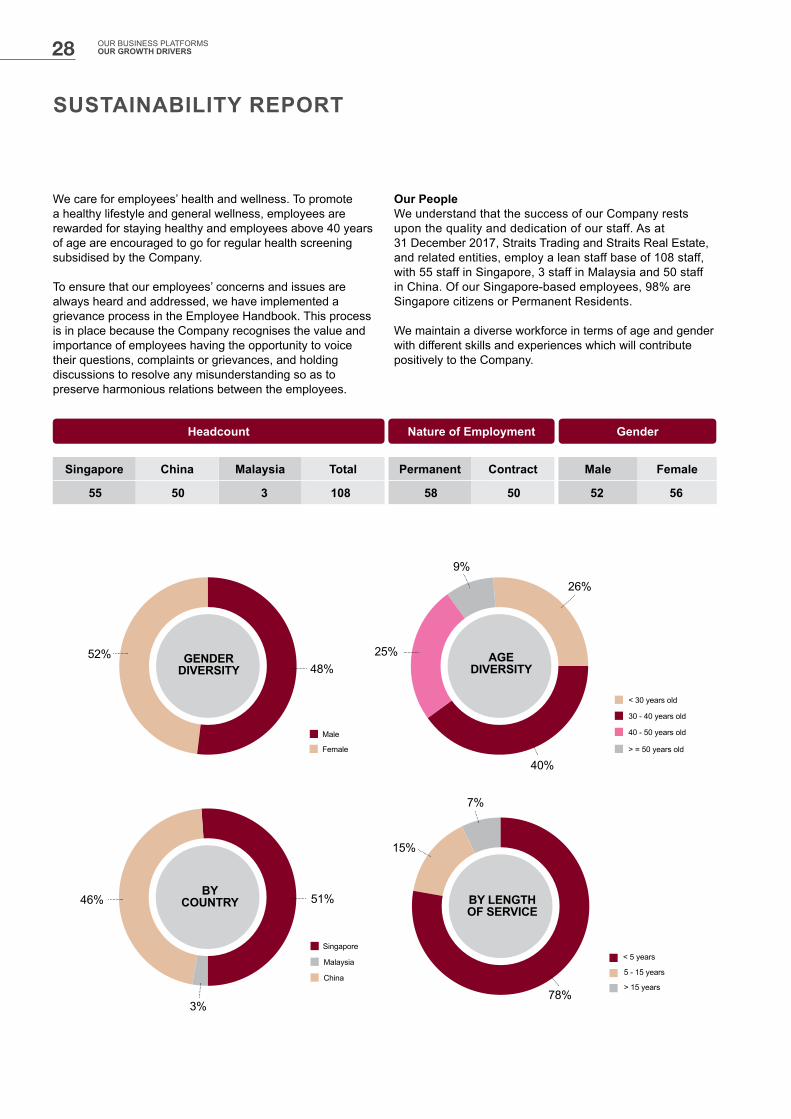
Our PeopleWe understand that the success of our Company rests upon the quality and dedication of our staff. As at 31 December 2017, Straits Trading and Straits Real Estate, and related entities, employ a lean staff base of 108 staff, with 55 staff in Singapore, 3 staff in Malaysia and 50 staff in China. Of our Singapore-based employees, 98% are Singapore citizens or Permanent Residents.
We maintain a diverse workforce in terms of age and gender with different skills and experiences which will contribute positively to the Company.
Headcount Nature of Employment Gender
Singapore China Malaysia Total Permanent Contract Male Female
55 50 3 108 58 50 52 56
Male
Female
48%52% GENDER
DIVERSITY
< 30 years old
30 - 40 years old
40 - 50 years old
> = 50 years old
25%
9%
26%
40%
AGE DIVERSITY
Singapore
Malaysia
China
46% 51%
3%
BY COUNTRY
< 5 years
5 - 15 years
> 15 years
15%
7%
78%
BY LENGTH OF SERVICE
28 OUR BUSINESS PLATFORMS OUR GROWTH DRIVERS

SUSTAINABILITY REPORT
Our employees are fairly evenly split between male and female, as well as both permanent and contract staff. The majority of our employees are in the 30 – 40 years age group, which constitutes 40% of our workforce. A substantial portion of the organisation’s work is performed by our direct employees although we do occasionally engage advisers, consultants and contractors for advisory or ad hoc projects. The majority of our contract staff is in China.
Training and EducationEmployees are encouraged to attend relevant training courses to improve themselves. Yearly budgets are provided for training and development programmes. All employees have to complete their individual development plan with their relevant superiors at the beginning of each year to review gaps in their skillsets as well as their training and development needs. Relevant and suitable courses will be sourced for employees.
Discussions are held between managers and employees to define long-term objectives. Employees are given assignments and skill-building opportunities to expand their work scope and achieve their long-term goals. We groom our employees so that they can grow with the Company and be promoted to take on bigger roles and assume greater responsibilities.
The types of training attended by employees include soft skills, technical skills and update of industry practices and regulations. We also support employees in taking up relevant professional courses and post-graduate courses such as ACCA, CFA and Masters programme, where course fees and examination fees are sponsored in full or in parts by the Company. Employees are also given study leave and examination leave. We target to continue providing diverse and relevant training schedule for our employees.
Rewarding PerformanceAt Straits Trading, we prioritise performance improvement and employee development. In order to do so, we align these business priorities with competitive fixed and variable remuneration. All employees are given annual performance appraisals and their performances are reviewed on a one-on-one basis with their superiors. Performance bonuses are awarded for individual performance and contributions. We also conduct regular benchmarking exercises to provide competitive remuneration packages and benefits.
Engaging EmployeesWe keep employees informed of the latest news, policies, and happenings via internal emails, intranet and town hall meetings. Our well-established group-wide intranet platform allows employees to access human resource policies, forms, and templates, and share news and information. They can also participate in polls and surveys, as well as a forum to share their thoughts and provide feedback. Quarterly bonding sessions are also organised on a departmental basis.
Human Resource Policies are reviewed from time to time by the Human Resource department to ensure that they are relevant and updated; any changes will be communicated to the employees.
Code of Work Ethics All employees are expected to uphold and ensure that they do not engage in any interest that conflicts with any of the Company’s businesses. The code of work ethics is published on our Company’s corporate intranet as well as Employee Handbook.
Non-DiscriminationWe are proud to institute a strict equal opportunities and non-discrimination policy, as we believe every employee has a right to be judged on merit only and to be free from harassment or discrimination in their place of work. We have had no incidents of discrimination over the last 12 months and we intend to maintain this for the upcoming year.
CORPORATE SOCIAL RESPONSIBILITYStraits Trading is committed to be a socially responsible organisation and has been contributing towards educational and social causes as far back as the early 1900s. In tandem with its financial growth and prosperity, the Company has also fostered a culture of giving back to the community in various ways, such as gifting the clock and chimes for the Victoria Memorial Hall in 1905, donating towards the building of a new school for St. Joseph’s Institution in 1907 and 1912, and setting up the Straits Trading-Howe Yoon Chong Bursary Fund at the National University of Singapore Department of Economics in 2008 to support financially needy university students. We continue to support projects and causes that are sustainable, and which possess definable social outcomes. We also participate in activities that facilitate active engagement and interaction and which deliver a rich and meaningful experience to our volunteers and beneficiaries alike.
29THE STRAITS TRADING COMPANY LIMITEDANNUAL REPORT 2017
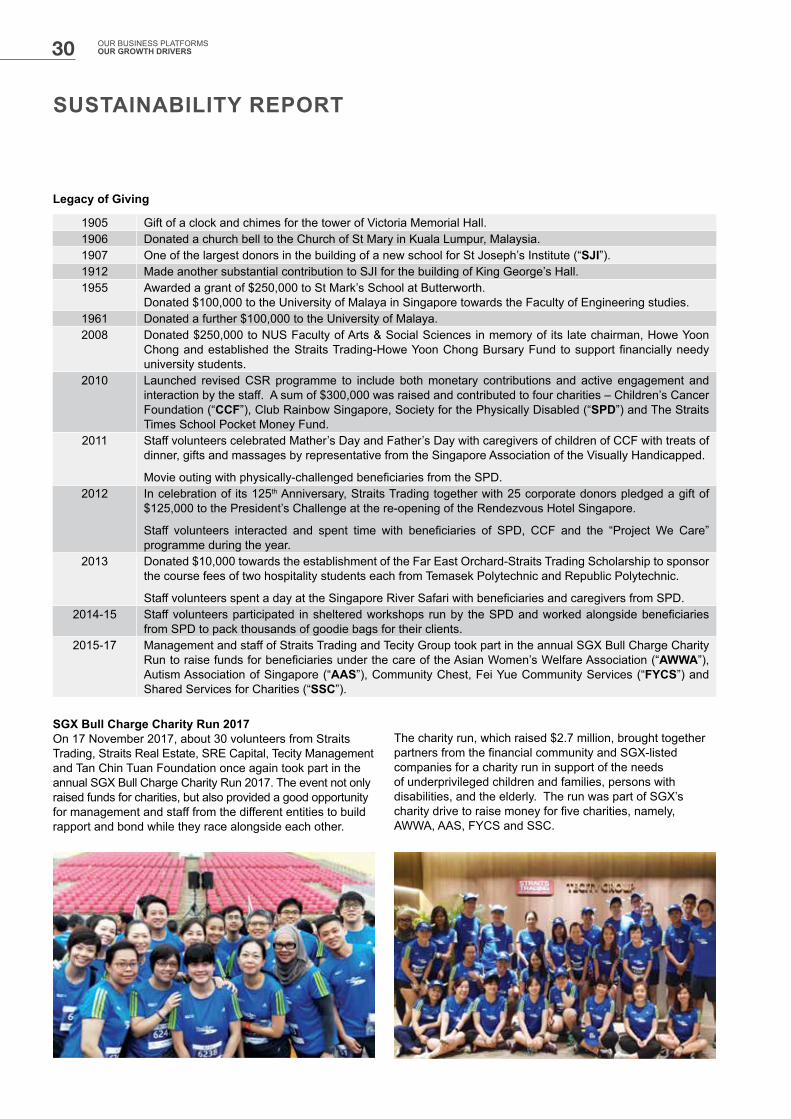
SUSTAINABILITY REPORT
Legacy of Giving
1905 Gift of a clock and chimes for the tower of Victoria Memorial Hall.1906 Donated a church bell to the Church of St Mary in Kuala Lumpur, Malaysia.1907 One of the largest donors in the building of a new school for St Joseph’s Institute (“SJI”).1912 Made another substantial contribution to SJI for the building of King George’s Hall.1955 Awarded a grant of $250,000 to St Mark’s School at Butterworth.
Donated $100,000 to the University of Malaya in Singapore towards the Faculty of Engineering studies.1961 Donated a further $100,000 to the University of Malaya.2008 Donated $250,000 to NUS Faculty of Arts & Social Sciences in memory of its late chairman, Howe Yoon
Chong and established the Straits Trading-Howe Yoon Chong Bursary Fund to support financially needy university students.
2010 Launched revised CSR programme to include both monetary contributions and active engagement and interaction by the staff. A sum of $300,000 was raised and contributed to four charities – Children’s Cancer Foundation (“CCF”), Club Rainbow Singapore, Society for the Physically Disabled (“SPD”) and The Straits Times School Pocket Money Fund.
2011 Staff volunteers celebrated Mather’s Day and Father’s Day with caregivers of children of CCF with treats of dinner, gifts and massages by representative from the Singapore Association of the Visually Handicapped.
Movie outing with physically-challenged beneficiaries from the SPD.2012 In celebration of its 125th Anniversary, Straits Trading together with 25 corporate donors pledged a gift of
$125,000 to the President’s Challenge at the re-opening of the Rendezvous Hotel Singapore.
Staff volunteers interacted and spent time with beneficiaries of SPD, CCF and the “Project We Care” programme during the year.
2013 Donated $10,000 towards the establishment of the Far East Orchard-Straits Trading Scholarship to sponsor the course fees of two hospitality students each from Temasek Polytechnic and Republic Polytechnic.
Staff volunteers spent a day at the Singapore River Safari with beneficiaries and caregivers from SPD.2014-15 Staff volunteers participated in sheltered workshops run by the SPD and worked alongside beneficiaries
from SPD to pack thousands of goodie bags for their clients.2015-17 Management and staff of Straits Trading and Tecity Group took part in the annual SGX Bull Charge Charity
Run to raise funds for beneficiaries under the care of the Asian Women’s Welfare Association (“AWWA”), Autism Association of Singapore (“AAS”), Community Chest, Fei Yue Community Services (“FYCS”) and Shared Services for Charities (“SSC”).
SGX Bull Charge Charity Run 2017On 17 November 2017, about 30 volunteers from Straits Trading, Straits Real Estate, SRE Capital, Tecity Management and Tan Chin Tuan Foundation once again took part in the annual SGX Bull Charge Charity Run 2017. The event not only raised funds for charities, but also provided a good opportunity for management and staff from the different entities to build rapport and bond while they race alongside each other.
The charity run, which raised $2.7 million, brought together partners from the financial community and SGX-listed companies for a charity run in support of the needs of underprivileged children and families, persons with disabilities, and the elderly. The run was part of SGX’s charity drive to raise money for five charities, namely, AWWA, AAS, FYCS and SSC.
30 OUR BUSINESS PLATFORMS OUR GROWTH DRIVERS

SUSTAINABILITY REPORT
GRI INDEX
GRI STANDARDS DETAILS/NOTES/PAGE NO.General DisclosureOrganisational profile 102-1 Name of the organisation AR, Inside back cover
102-2 Activities, brands, products, and services AR, Page 2-5 and 14-20
102-3 Location of headquarter AR, Inside back cover
102-4 Location of operations AR, Page 14-20
102-5 Ownership and legal form AR, Page 147-148
102-6 Markets served AR, Page 2-5 and 14-20
102-7 Scale of the organisation Our People, Page 28 AR, Page 6-11
102-8 Information on employees and other workers See “Our People”, Page 28We do not have any significant variations in employment numbers.
102-9 Supply chain Supply chain is minimal and not significant to report on
102-10 Significant changes to organisation and its supply chain
AR, Page 2-5 and 14-20
102-11 Precautionary principle or approach STC do not specifically address the principles of the Precautionary approach
102-12 External initiatives None
102-13 Membership of associations Associations and Collaborations, Page 25
Strategy102-14 Statement from senior decision-maker AR, Page 2-5
Ethics and integrity102-16 Values, principles, standards, and norms
of behaviourStraits Trading Mission, Page 21What Sustainability means to us, Page 22
102-18 Governance structure Managing ESG issues, Page 23
102-40 List of stakeholder groups Shareholder Information, Page 147-148
102-41 Collective bargaining agreements Report the percentage of total employees covered by collective bargaining agreements.
102-42 Identifying and selecting stakeholders N.A.
102-43 Approach to stakeholder engagement Stakeholder engagement, Page 23
102-44 Key topics and concerns raised Stakeholder engagement, Page 23
102-45 Entities included in the consolidated financial statements
Corporate Profile, Inside cover pageCorporate Structure, AR, Page 5Introduction, Page 21
102-46 Defining report content and topic Boundaries Materiality Assessment, Page 22
102-47 List of material topics Materiality assessment, Page 22
102-48 Restatements of information None
102-49 Changes in reporting Introduction, Page 21
102-50 Reporting period 1st January - 31st December 2017
102-51 Date of most recent report N.A.
102-52 Reporting cycle Annual
102-53 Contact point for questions regarding the report
Wai Yee WongVice President, Corporate CommunicationsThe Straits Trading Company Limited
102-54 Claims of reporting in accordance with GRI Standards
This report is prepared in reference to the GRI Standards
31THE STRAITS TRADING COMPANY LIMITEDANNUAL REPORT 2017
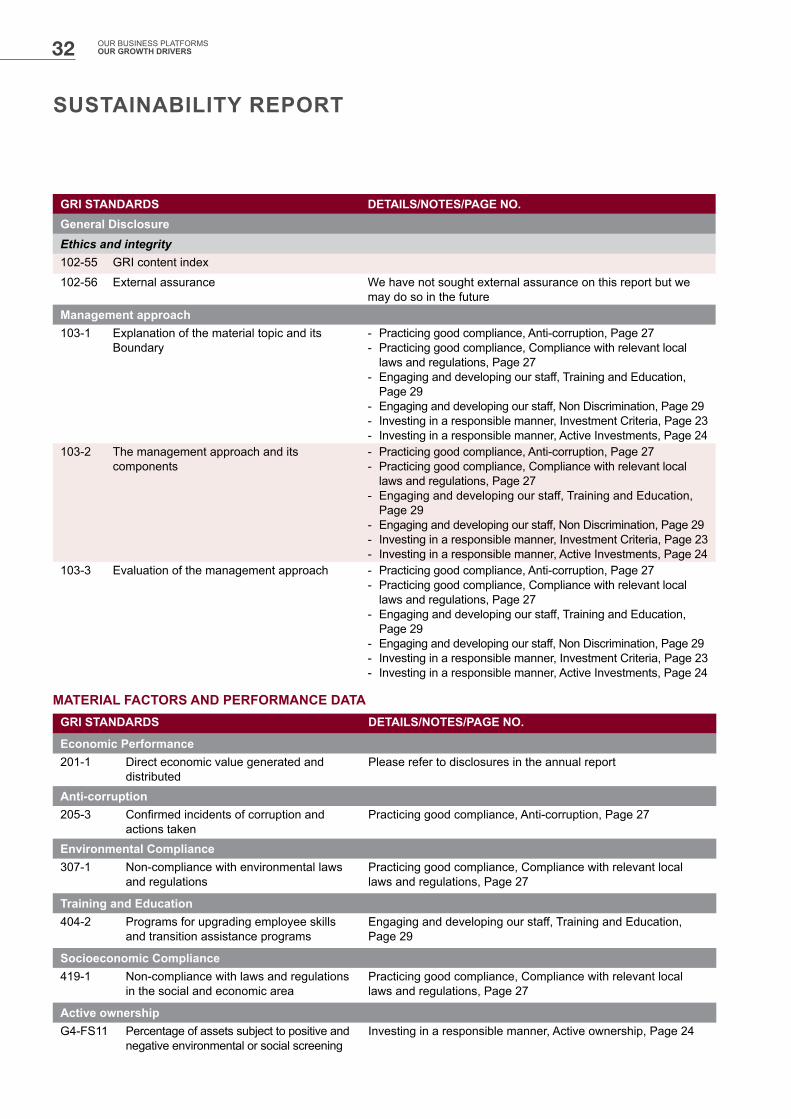
GRI STANDARDS DETAILS/NOTES/PAGE NO.General DisclosureEthics and integrity102-55 GRI content index
102-56 External assurance We have not sought external assurance on this report but we may do so in the future
Management approach103-1 Explanation of the material topic and its
Boundary- Practicing good compliance, Anti-corruption, Page 27- Practicing good compliance, Compliance with relevant local
laws and regulations, Page 27- Engaging and developing our staff, Training and Education,
Page 29- Engaging and developing our staff, Non Discrimination, Page 29- Investing in a responsible manner, Investment Criteria, Page 23- Investing in a responsible manner, Active Investments, Page 24
103-2 The management approach and its components
- Practicing good compliance, Anti-corruption, Page 27- Practicing good compliance, Compliance with relevant local
laws and regulations, Page 27- Engaging and developing our staff, Training and Education,
Page 29- Engaging and developing our staff, Non Discrimination, Page 29- Investing in a responsible manner, Investment Criteria, Page 23- Investing in a responsible manner, Active Investments, Page 24
103-3 Evaluation of the management approach - Practicing good compliance, Anti-corruption, Page 27- Practicing good compliance, Compliance with relevant local
laws and regulations, Page 27- Engaging and developing our staff, Training and Education,
Page 29- Engaging and developing our staff, Non Discrimination, Page 29- Investing in a responsible manner, Investment Criteria, Page 23- Investing in a responsible manner, Active Investments, Page 24
MATERIAL FACTORS AND PERFORMANCE DATAGRI STANDARDS DETAILS/NOTES/PAGE NO.
Economic Performance201-1 Direct economic value generated and
distributedPlease refer to disclosures in the annual report
Anti-corruption205-3 Confirmed incidents of corruption and
actions takenPracticing good compliance, Anti-corruption, Page 27
Environmental Compliance307-1 Non-compliance with environmental laws
and regulationsPracticing good compliance, Compliance with relevant local laws and regulations, Page 27
Training and Education404-2 Programs for upgrading employee skills
and transition assistance programsEngaging and developing our staff, Training and Education, Page 29
Socioeconomic Compliance419-1 Non-compliance with laws and regulations
in the social and economic areaPracticing good compliance, Compliance with relevant local laws and regulations, Page 27
Active ownershipG4-FS11 Percentage of assets subject to positive and
negative environmental or social screeningInvesting in a responsible manner, Active ownership, Page 24
SUSTAINABILITY REPORT
32 OUR BUSINESS PLATFORMS OUR GROWTH DRIVERS
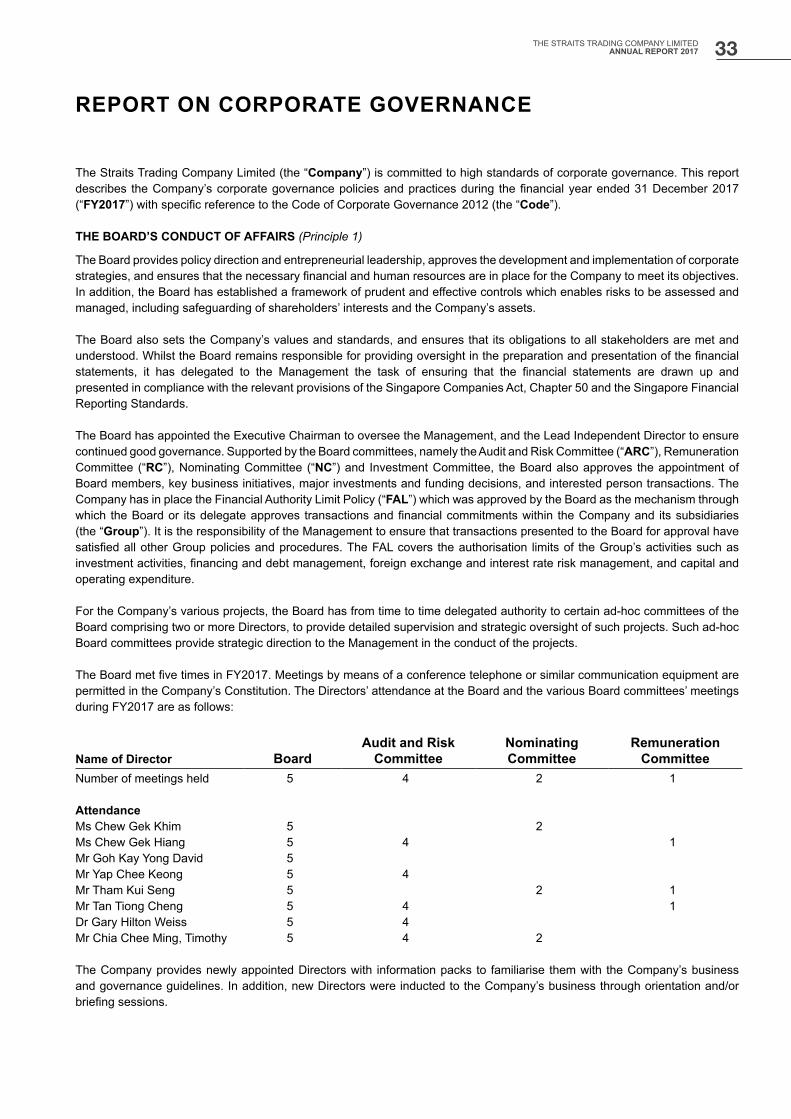
The Straits Trading Company Limited (the “Company”) is committed to high standards of corporate governance. This report describes the Company’s corporate governance policies and practices during the financial year ended 31 December 2017 (“FY2017”) with specific reference to the Code of Corporate Governance 2012 (the “Code”).
THE BOARD’S CONDUCT OF AFFAIRS (Principle 1)
The Board provides policy direction and entrepreneurial leadership, approves the development and implementation of corporate strategies, and ensures that the necessary financial and human resources are in place for the Company to meet its objectives. In addition, the Board has established a framework of prudent and effective controls which enables risks to be assessed and managed, including safeguarding of shareholders’ interests and the Company’s assets.
The Board also sets the Company’s values and standards, and ensures that its obligations to all stakeholders are met and understood. Whilst the Board remains responsible for providing oversight in the preparation and presentation of the financial statements, it has delegated to the Management the task of ensuring that the financial statements are drawn up and presented in compliance with the relevant provisions of the Singapore Companies Act, Chapter 50 and the Singapore Financial Reporting Standards.
The Board has appointed the Executive Chairman to oversee the Management, and the Lead Independent Director to ensure continued good governance. Supported by the Board committees, namely the Audit and Risk Committee (“ARC”), Remuneration Committee (“RC”), Nominating Committee (“NC”) and Investment Committee, the Board also approves the appointment of Board members, key business initiatives, major investments and funding decisions, and interested person transactions. The Company has in place the Financial Authority Limit Policy (“FAL”) which was approved by the Board as the mechanism through which the Board or its delegate approves transactions and financial commitments within the Company and its subsidiaries (the “Group”). It is the responsibility of the Management to ensure that transactions presented to the Board for approval have satisfied all other Group policies and procedures. The FAL covers the authorisation limits of the Group’s activities such as investment activities, financing and debt management, foreign exchange and interest rate risk management, and capital and operating expenditure.
For the Company’s various projects, the Board has from time to time delegated authority to certain ad-hoc committees of the Board comprising two or more Directors, to provide detailed supervision and strategic oversight of such projects. Such ad-hoc Board committees provide strategic direction to the Management in the conduct of the projects.
The Board met five times in FY2017. Meetings by means of a conference telephone or similar communication equipment are permitted in the Company’s Constitution. The Directors’ attendance at the Board and the various Board committees’ meetings during FY2017 are as follows:
Name of Director BoardAudit and Risk
CommitteeNominating Committee
Remuneration Committee
Number of meetings held
AttendanceMs Chew Gek KhimMs Chew Gek HiangMr Goh Kay Yong DavidMr Yap Chee KeongMr Tham Kui SengMr Tan Tiong ChengDr Gary Hilton WeissMr Chia Chee Ming, Timothy
5
55555555
4
4
4
444
2
2
2
2
1
1
11
The Company provides newly appointed Directors with information packs to familiarise them with the Company’s business and governance guidelines. In addition, new Directors were inducted to the Company’s business through orientation and/or briefing sessions.
REPORT ON CORPORATE GOVERNANCE
33THE STRAITS TRADING COMPANY LIMITEDANNUAL REPORT 2017
BOARD COMPOSITION AND GUIDANCE (Principle 2)
The Board currently has 10 Directors. For FY2017, the Board comprised eight Directors, seven of whom were non-executive and four were considered independent. Mr Tan Chian Khong and Mr Chua Tian Chu were appointed as Directors of the Company on 1 January 2018. The Board, in concurrence with the NC, was of the view that, taking into account the Company’s scope of operations and its business requirements, the current size of the Board is appropriate. The Board considers an independent Director to be one who has no relationship with the Company, its related corporations, its 10% shareholders or its officers that could interfere, or be reasonably perceived to interfere, with the exercise of the Director’s independent business judgement with a view to the best interests of the Company.
The Directors provided objective and independent judgement to the decision making of the Board. The non-executive Directors of the Company participated constructively and reviewed the Group’s operations, budgets and strategies. They also assessed the effectiveness of the Board’s processes and activities in meeting set objectives and corporate governance standards.
The Board as a group has the core competencies, such as accounting or finance, business or management experience, legal and industry knowledge, and strategic planning experience. Key information on the Directors are set out in pages 6 to 9.
EXECUTIVE CHAIRMAN (Principle 3)
The Board is led by Ms Chew Gek Khim as the Executive Chairman. Ms Chew assumed the Chair on 24 April 2008 and was appointed Executive Chairman on 1 November 2009.
As Chairman of the Board, Ms Chew’s duties include leading the Board, setting the Board agenda and ensuring that all Directors receive sufficient relevant information (both financial and non-financial) to enable them to participate and contribute effectively in Board discussions and decisions. She aims to promote openness and constructive relations between the Board members, and between the Board and the Management, and ensures effective communication with shareholders. Ms Chew also advocates high standards of corporate governance.
As the Executive Chairman, Ms Chew takes on executive oversight of the Management of the business segments. The Management is responsible for the daily management of the businesses and implementation of the Board’s policies and decisions as well as ensuring compliance with the corporate governance policies of the Company as these relate to the respective business segments. The Management reports to the Board and is managed through the strategies adopted and monitored through the key performance indicators set for them.
LEAD INDEPENDENT DIRECTOR (Principle 3)
In line with the recommendations set out in the Code, the Company has appointed a Lead Independent Director. Mr Chia Chee Ming, Timothy was appointed as an Independent Non-Executive Director and the Lead Independent Director on 27 February 2015.
The Lead Independent Director’s role includes being available to shareholders to address any of their concerns and acting as the principal liaison between the independent Directors and the Executive Chairman on critical issues.
BOARD MEMBERSHIP (Principle 4)
The Company has an NC comprising three Directors, the majority of whom, including the NC Chairman, are independent. The NC is currently chaired by Mr Chia Chee Ming, Timothy and the other members of the NC are Ms Chew Gek Khim and Mr Chua Tian Chu. Mr Tham Kui Seng was a member of the NC until 31 December 2017.
The Company has adopted a formal and transparent process for the appointment of new Directors through the NC which reviews the background of and conducts interviews with all candidates and makes recommendations accordingly to the Board for approval.
The functions of the NC include the evaluation of the Board’s effectiveness, each Director’s contributions and independence, as well as making recommendations on the appointment and re-nomination of Directors for the Board. The role and functions of the NC are set out in its Terms of Reference.
REPORT ON CORPORATE GOVERNANCE
34 OUR BUSINESS PLATFORMS OUR GROWTH DRIVERS

The NC reviews and assesses the independence of the Directors at least once a year. The Directors are required to submit declarations of independence annually and report to the Company immediately on any changes to their external appointments, interest in shares and other relevant information. For FY2017, the Board, having taken into account the views of the NC, considered Mr Tham Kui Seng, Mr Tan Tiong Cheng, Dr Gary Hilton Weiss and Mr Chia Chee Ming, Timothy to be independent.
During FY2017, the Directors were updated on the relevant changes in financial reporting standards, regulatory requirements and governance practices. The Directors also participated in appropriate courses and discussion forums.
As the Directors have given sufficient time and effort to the Company’s matters, notwithstanding their multiple directorships and appointments, the Board was of the view that there was no necessity to regulate the maximum number of listed company board representations that the Directors may hold.
BOARD PERFORMANCE (Principle 5)
The Company has in place a process to assess the Board’s effectiveness as a whole. The evaluation is carried out annually with each Director making his or her assessment by providing feedback to the NC through a Board assessment questionnaire.
In evaluating the performance of the individual Directors and the Board, the NC considers, amongst others, the Directors’ attendance, contribution and participation at the Board and Board committee meetings, Directors’ individual evaluations and the overall effectiveness of the Board.
ACCESS TO INFORMATION (Principle 6)
Information is important to the Board’s understanding of the Group’s businesses and essential to preparing the Board members for effective meetings. Where required, the Management supplements the meeting papers with presentations on active operations and strategic issues to provide the Directors with a better understanding of the Group’s operations. The Management is invited to attend the meetings to answer enquiries from the Directors. The Directors have access to Board and Board committees’ papers through a secure web-based portal.
The Directors have separate and independent access to the Management and the services of the Company Secretary, who is responsible for ensuring that Board procedures are followed and applicable rules and regulations are complied with. The Company Secretary also assists the Chairman by ensuring good information flows within the Board and its committees, and between the Management and the non-executive Directors. The Company Secretary attends all Board and Board committees’ meetings and his appointment or removal is subject to the Board’s approval.
In the furtherance of their duties and if the Management’s explanations are not satisfactory, the Directors may seek independent professional advice at the Company’s expense.
PROCEDURES FOR DEVELOPING REMUNERATION POLICIES (Principle 7)LEVEL AND MIX OF REMUNERATION (Principle 8)
The Board has an RC comprising three non-executive Directors, the majority of whom, including the RC Chairman, are independent. Up till 31 December 2017, the RC was chaired by Mr Tham Kui Seng and Ms Chew Gek Hiang and Mr Tan Tiong Cheng were the other two members. Following the change of composition of the RC with effect from 1 January 2018, the RC is chaired by Dr Gary Hilton Weiss and Mr Goh Kay Yong David and Mr Tan Tiong Cheng are the other members of the RC.
The functions of the RC include the recommendation of a framework of remuneration for the Board and key management personnel, and the recommendation of specific remuneration packages for the Executive Chairman and key management personnel for the Board’s approval. The role and functions of the RC are set out in the Terms of Reference of the RC.
The Company has adopted a performance-based approach to compensation where employees’ remuneration is linked to individual and corporate performances. The RC sees the importance of a market competitive remuneration strategy to attract, retain and motivate employees to high performance levels that creates value for the shareholders. Remuneration is determined according to the following general components: salary, contractual bonus and performance bonus. Presently, the Company does not have any share-based incentive scheme.
REPORT ON CORPORATE GOVERNANCE
35THE STRAITS TRADING COMPANY LIMITEDANNUAL REPORT 2017

Taking into account the performance of the Group and the responsibilities and performance of the Directors, Directors’ fees (for the Board and the various Board committees) were set in accordance with a remuneration framework comprising responsibility fees and attendance fees. The Executive Chairman does not receive any Director’s fees. Non-executive Directors are paid Director’s fees, subject to approval at the annual general meeting. The non-executive Directors have no service contracts. No individual Director fixes his or her own remuneration.
DISCLOSURE ON REMUNERATION (Principle 9)
The summary remuneration table for the Directors of the Company in all capacities for FY2017 is as follows:
Name of Director Salary Bonus Benefits in kind Directors’ fees TotalS$1,250,001 – S$1,500,000Ms Chew Gek Khim
S$250,000 and belowMs Chew Gek HiangMr Goh Kay Yong DavidMr Yap Chee KeongMr Tham Kui SengMr Tan Tiong ChengDr Gary Hilton WeissMr Chia Chee Ming, Timothy
67%
−−−−−−−
33%
−−−−−−−
−
−−−−−−−
−
100%100%100%100%100%100%100%
100%
100%100%100%100%100%100%100%
There are no employees of the Group who are immediate family members of a Director, and whose remuneration exceeds S$50,000 a year.
The summary remuneration table for the key management personnel (who are not Directors) in bands of S$250,000 for FY2017 is as follows:
Name of Key Management Personnel Salary Bonus Benefits in kind TotalS$250,001 – S$500,000Ms Yeo Sock Koon 91% − 9% 100%
Based on the current organisation and reporting structure of the Group, it is more appropriate for one executive, who is not a Director of the Company, to be identified as the Group’s top key management personnel instead of five as required under the Code for FY2017.
Given the sensitive nature of employee remuneration, as well as possible pressures from both within and outside the Group upon disclosing such information, the Board has decided that the detailed disclosure of each Director’s and key management personnel’s remuneration is not in the interests of the Company. The total remuneration paid to the key management personnel (including the Executive Chairman) in FY2017 amounted to S$1,658,418.
ACCOUNTABILITY (Principle 10)
In presenting the annual financial statements and quarterly announcements to shareholders, it is the aim of the Board to provide shareholders with a balanced and detailed analysis, explanations and assessment of the Company’s and the Group’s performance, financial position and prospects.
The Management currently provides the Board with balanced and understandable accounts of the Company’s performance, financial position and business prospects on a monthly basis.
REPORT ON CORPORATE GOVERNANCE
36 OUR BUSINESS PLATFORMS OUR GROWTH DRIVERS

AUDIT AND RISK COMMITTEE (Principle 12)
For FY2017, the ARC comprised five non-executive Directors, the majority of whom were independent. The ARC was chaired by Dr Gary Hilton Weiss and the other members of the ARC were Ms Chew Gek Hiang, Mr Yap Chee Keong, Mr Tan Tiong Cheng and Mr Chia Chee Ming, Timothy. Following the re-composition of the ARC with effect from 1 January 2018 which Dr Gary Hilton Weiss continues to chair, the other members of the ARC are Ms Chew Gek Hiang, Mr Chia Chee Ming, Timothy and Mr Tan Chian Khong.
All members of the ARC are financially literate and have accounting or related financial management expertise or experience.
The role of the ARC is documented in the Terms of Reference approved by the Board. The Terms of Reference defines the purpose, authority and responsibilities of the ARC. The duties of the ARC include:
• reviewing annually the external audit scope, audit plans and relevant processes, and the results of the external audit work with regard to the adequacy, cost effectiveness, and appropriateness of the accounting and financial controls of the Company;
• making recommendations to the Board on the appointment and re-appointment of the external auditor, and reviewing the terms of engagement of the external auditor, including their compensation, performance evaluation and independence;
• reviewing the adequacy and effectiveness of the Company’s internal accounting controls and the financial reporting process;
• reviewing the significant accounting and reporting principles, practices and procedures applied by the Company in preparing its financial statements;
• reviewing interested person transactions from time to time to determine if they are carried out on normal commercial terms and are not prejudicial to the interests of the Company and its minority shareholders;
• reviewing annually and as may be necessary from time to time, the internal audit scope, internal audit plans, relevant processes and the focus on risk; and
• reviewing and evaluating annually the adequacy and effectiveness of the Company’s risk management and internal control systems, including financial, operational, compliance and information technology controls and processes for assessing significant risks or exposures and the procedures Management has taken to monitor, control and minimise such risks or exposures to the Company.
The ARC has the power to conduct or authorise investigations into any matters within its scope of responsibilities. The Board is updated by the ARC Chairman on the significant issues discussed at the ARC meetings.
In performing its functions, the ARC reviews the overall scope of both internal and external audits and the assistance given by the Company’s officers to the internal and external auditors. The ARC also meets with the internal and external auditors on a quarterly basis to review their findings and effectiveness.
To assist the discharging of its functions, the ARC is provided with adequate resources, has full access to and co-operation of the Management and the internal auditor, and has full discretion to invite any Director or executive officer to attend its meetings. All major findings and recommendations are brought to the attention of the Board of Directors.
The ARC reviews interested person transactions to ensure that they are carried out on normal commercial terms and are not prejudicial to the interests of the Company and its minority shareholders. The ARC also reviews the consolidated financial statements and the auditor’s report, as well as related announcements to shareholders and the Singapore Exchange Securities Trading Limited (“SGX-ST”) before submission to the Board.
REPORT ON CORPORATE GOVERNANCE
37THE STRAITS TRADING COMPANY LIMITEDANNUAL REPORT 2017
The ARC has reviewed and is satisfied that the independence and objectivity of the external auditor have not been compromised by the provision of non-audit services. Accordingly, it has recommended to the Board the nomination of the external auditor, Ernst & Young LLP, for re-appointment at the forthcoming Annual General Meeting to be held on 27 April 2018. In FY2017, the ARC met once with the external auditor without the presence of the Management.
The details of the remuneration paid to the external auditor for FY2017 are as follows:
S$’000
Audit fees paid/payable to:− Auditor of the Company 416− Overseas affiliates of the auditor of the Company 319
Non-audit fees paid/payable to:− Auditor of the Company 109− Overseas affiliates of the auditor of the Company 53
The ARC, having reviewed the nature and quantum of the non-audit fees, was satisfied that the independence of the external auditor had not been compromised by the provision of the non-audit services.
In appointing the audit firms for the Group, the ARC is satisfied that the Company has complied with the Listing Rules 712, 715 and 716.
KEY AUDIT MATTERS
The external auditor have set out the key audit matters in respect of FY2017 in the Independent Auditor’s Report on pages 45 to 50 of the Annual Report. The ARC concurs with the basis and conclusions included in the Independent Auditor’s Report with respect to the key audit matters.
WHISTLEBLOWER POLICY
In line with Guideline 12.7 of the Code, the Company has a whistle-blowing procedure in place for employees to raise, in confidence, possible improprieties in matters of financial reporting or other matters. The policy, available on the Company’s intranet and employee handbook, aims to foster a workplace conducive to open communication regarding the Company’s business practices and to protect the employees from unlawful retaliation and discrimination for the proper disclosing or reporting of illegal or unethical conduct in good faith.
Complaints may be made to the designated officers by telephone, email or under confidential mail. All cases reported will be investigated objectively and thoroughly and appropriate action will be taken where warranted. A summary of the reports received, investigation results and subsequent actions taken are reported to the ARC on a quarterly basis. Under certain circumstances, the ARC will be informed of any complaint, as soon as practicable.
RISK MANAGEMENT AND INTERNAL CONTROLS (Principle 11)
The Board recognises that it is responsible for risk governance and ensuring that the Management maintains a sound system of risk management and internal controls to safeguard shareholders’ investments and the Group’s assets. The Board appreciates that risk management is an on-going process in which the Management continuously participate to evaluate, monitor and report to the Board and ARC on significant risks.
The ARC under its Terms of Reference as delegated by the Board, has the responsibility to oversee the Group’s risk management framework and policies.
The Group has engaged KPMG Services Pte. Ltd. to develop and implement a Board Assurance Framework which includes an enterprise risk management framework to identify the significant risks facing each major business segment, the potential impact and likelihood of those risks occurring, the control effectiveness and action plans taken to mitigate those risks. The Group has also developed a risk governance structure, which provides details on the roles and responsibilities for the Board and Management in risk monitoring, escalation, mitigation and reporting.
REPORT ON CORPORATE GOVERNANCE
38 OUR BUSINESS PLATFORMS OUR GROWTH DRIVERS
The Group has established key risks indicators with tolerance limits to monitor movements in its significant risks and to proactively manage them within acceptable levels. These key risk indicators have been reviewed and approved by the Board and they are also monitored on a quarterly basis.
The internal auditor regularly reviews all significant controls, policies and procedures and highlight all significant matters to the Management and the ARC.
During FY2017, the Board and ARC reviewed the adequacy and effectiveness of the Group’s internal controls in relation to the significant risks, including financial, operational, compliance and information technology controls, and risk management systems. Based on the work performed by the external and internal auditors, the Management’s representations and the Board’s enquiries and discussions, the Board is assured that the Group’s risk management and internal controls systems are adequate and effective. In addition, the Board has received assurance from the Executive Chairman and Group Financial Controller that the financial records have been properly maintained and properly drawn up in accordance with the Companies Act and Singapore Financial Reporting Standards. The financial records give a true and fair view of the Group’s operations and finances that are not misleading in any material aspect, and that the Group’s risk management and internal control systems are effective.
Based on the internal controls established and maintained by the Group, work performed by the internal and external auditors, and reviews performed by and assurance from the Executive Chairman and Group Financial Controller, the internal auditor, the ARC and the Board, the Board, with the concurrence of the ARC, is of the opinion that the Group’s system of risk management and internal controls, addressing financial, operational, compliance and information technology risks, were adequate and effective as at 31 December 2017.
However, the Board is also aware that such a system can only provide reasonable, but not absolute, assurance that the Group will not be adversely affected by any event that could be reasonably foreseen as it strives to achieve its business objectives. The Board also notes that no system of internal controls and risk management can provide a complete assurance against human error, poor judgement in decision making, losses, fraud or other irregularities.
INTERNAL AUDIT (Principle 13)
The Company’s internal audit function has been outsourced to KPMG Services Pte. Ltd. The internal auditor’s primary line of reporting is to the Chairman of the ARC. All internal audit reports are submitted to the ARC for consideration, with copies of those reports extended to senior management. In order to ensure timely and adequate closure of internal audit findings, the status of implementation of the actions as agreed by senior management is tracked and discussed with the ARC.
In carrying out its duties, the internal auditor has adopted the International Standards for the Professional Practice of Internal Auditing set by The Institute of Internal Auditors.
For FY2017, the ARC reviewed and approved the annual internal audit plans and ensured that the internal audit functions were adequately resourced. The internal auditor has unrestricted direct access to the ARC and unfettered access to documents, records, properties and personnel within the Group to carry out its duties effectively.
COMMUNICATION WITH SHAREHOLDERS (Principle 15)
The Company takes a serious view of maintaining full and adequate disclosure, in a timely manner, of material events and matters concerning its businesses through SGXNET announcements, press releases, circulars to shareholders and annual reports.
In addition, shareholders and the public can access information pertaining to the Company’s businesses, media releases and other corporate information via its website. The Company’s Corporate Communications department also facilitate effective and unbiased communications with shareholders, analysts, fund managers and the media through Company presentations, and non-deal roadshows and investment conference organised by major banks and brokerage firms. The Company’s website provides the contact details for investors to submit their feedback and queries.
The Company endeavours to provide as much and as prompt information as is possible to its shareholders, taking into account the legal and regulatory framework governing the release of material and price-sensitive information. The Company releases all price-sensitive information through SGXNET.
REPORT ON CORPORATE GOVERNANCE
39THE STRAITS TRADING COMPANY LIMITEDANNUAL REPORT 2017
REPORT ON CORPORATE GOVERNANCE
At the Company’s annual general meeting in 2017, a presentation on the Company’s business was made to the shareholders. These presentation slides were also uploaded on SGX-ST through SGXNET and the Company’s website. Shareholders are encouraged to ask questions both about the resolutions being proposed and about the Group’s operations in general. The Constitution of the Company permits a member of the Company to appoint not more than two proxies to attend and vote instead of the member. As there is still a major concern on the security of information transmitted over the Internet, the Board has decided that it is not appropriate, for the time being, to amend its Constitution to allow for in absentia voting methods.
The Company ensures that separate resolutions are proposed at general meetings on each distinct issue. The external auditor, the chairpersons of the various Board committees and where necessary, the legal advisers are present to assist the Directors in addressing any relevant queries by shareholders.
To enhance participation by shareholders, the Company puts all resolutions at general meetings to vote by poll and announces the detailed results showing the number of votes cast for and against each resolution and the respective percentages. The polling results are also announced on SGX-ST and the Company’s website.
DEALINGS IN SECURITIES
The Group has issued internal guidelines on dealings in the securities of the Company to the Directors and employees of the Company and its subsidiaries, advising them, amongst others, not to deal in the securities of the Company on short-term considerations. On a quarterly basis, the Directors and employees are advised of the prohibitions in dealings in the securities of the Company during the period commencing two weeks before the announcement of the Group’s quarterly financial statements, and one month before the Group’s full year financial statements, and ending on the respective announcement dates, and while they are in possession of material price-sensitive information which is generally not available.
40 OUR BUSINESS PLATFORMS OUR GROWTH DRIVERS
FINANCIALSTATEMENTS
42 Directors’ Statement45 Independent Auditor’s Report51 Consolidated Income Statement52 Consolidated Statement of Comprehensive Income53 Balance Sheets55 Consolidated Statement of Changes in Equity57 Consolidated Cash Flow Statement59 Notes to the Financial Statements

DIRECTORS’ STATEMENT
The Directors have pleasure in submitting their statement to the members together with the audited financial statements of The Straits Trading Company Limited (the “Company”) and consolidated financial statements of the Group for the year ended 31 December 2017.
OPINION OF THE DIRECTORS
In the opinion of the Directors,
(i) the accompanying balance sheets, consolidated income statement, consolidated statement of comprehensive income, consolidated statement of changes in equity and consolidated cash flow statement together with notes thereto are drawn up so as to give a true and fair view of the financial position of the Group and of the Company as at 31 December 2017 and the financial performance, changes in equity and cash flows of the Group for the year ended on that date; and
(ii) at the date of this statement there are reasonable grounds to believe that the Company will be able to pay its debts as and when they fall due.
DIRECTORATE
The Directors in office at the date of this report are:
Ms Chew Gek Khim (Executive Chairman)Ms Chew Gek HiangMr Goh Kay Yong DavidMr Yap Chee KeongMr Tham Kui SengMr Tan Tiong ChengDr Gary Hilton WeissMr Chia Chee Ming, TimothyMr Tan Chian KhongMr Chua Tian Chu
Ms Chew Gek Khim, Mr Chia Chee Ming, Timothy and Mr Tham Kui Seng will retire pursuant to Article 99 of the Constitution. Ms Chew Gek Khim and Mr Chia Chee Ming, Timothy, being eligible, offer themselves for re-election. Mr Tham Kui Seng has notified the Company that he will not be seeking re-election.
Mr Tan Chian Khong and Mr Chua Tian Chu retire pursuant to Article 103 of the Constitution and being eligible, offer themselves for re-election.
ARRANGEMENTS TO ENABLE DIRECTORS TO ACQUIRE SHARES AND DEBENTURES
Neither at the end of nor at any time during the financial year was the Company a party to any arrangement whose objects are, or one of whose objects is, to enable the Directors of the Company to acquire benefits by means of the acquisition of shares or debentures of the Company or any other body corporate.
42 OUR BUSINESS PLATFORMS OUR GROWTH DRIVERS
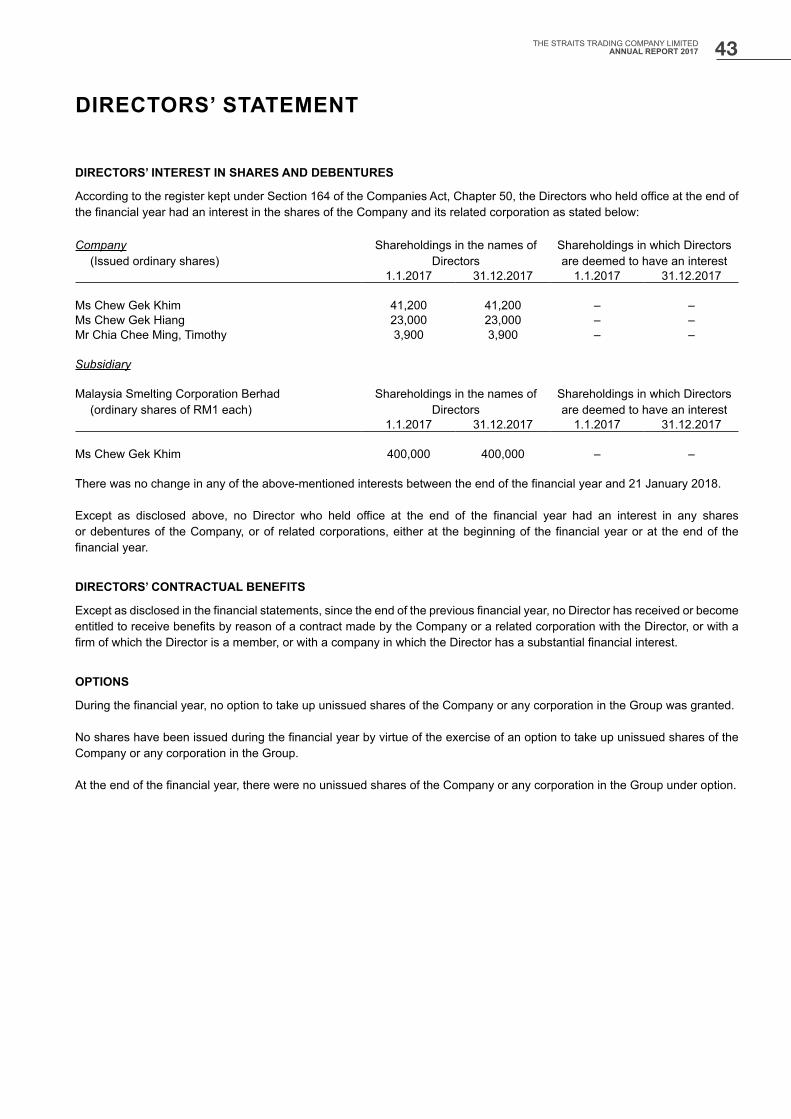
DIRECTORS’ STATEMENT
DIRECTORS’ INTEREST IN SHARES AND DEBENTURES
According to the register kept under Section 164 of the Companies Act, Chapter 50, the Directors who held office at the end of the financial year had an interest in the shares of the Company and its related corporation as stated below:
Company (Issued ordinary shares)
Shareholdings in the names of Directors
Shareholdings in which Directors are deemed to have an interest
1.1.2017 31.12.2017 1.1.2017 31.12.2017
Ms Chew Gek Khim 41,200 41,200 – –Ms Chew Gek Hiang 23,000 23,000 – –Mr Chia Chee Ming, Timothy 3,900 3,900 – –
Subsidiary
Malaysia Smelting Corporation Berhad (ordinary shares of RM1 each)
Shareholdings in the names of Directors
Shareholdings in which Directors are deemed to have an interest
1.1.2017 31.12.2017 1.1.2017 31.12.2017
Ms Chew Gek Khim 400,000 400,000 – –
There was no change in any of the above-mentioned interests between the end of the financial year and 21 January 2018.
Except as disclosed above, no Director who held office at the end of the financial year had an interest in any shares or debentures of the Company, or of related corporations, either at the beginning of the financial year or at the end of the financial year.
DIRECTORS’ CONTRACTUAL BENEFITS
Except as disclosed in the financial statements, since the end of the previous financial year, no Director has received or become entitled to receive benefits by reason of a contract made by the Company or a related corporation with the Director, or with a firm of which the Director is a member, or with a company in which the Director has a substantial financial interest.
OPTIONS
During the financial year, no option to take up unissued shares of the Company or any corporation in the Group was granted.
No shares have been issued during the financial year by virtue of the exercise of an option to take up unissued shares of the Company or any corporation in the Group.
At the end of the financial year, there were no unissued shares of the Company or any corporation in the Group under option.
43THE STRAITS TRADING COMPANY LIMITEDANNUAL REPORT 2017

AUDIT AND RISK COMMITTEE
The Audit and Risk Committee performs the functions specified in Section 201B(5) of the Companies Act, Chapter 50. The Audit and Risk Committee reviews the overall scope of both internal and external audits and the assistance given by the Company’s officers to the auditors. It meets the Company’s internal and external auditors to discuss the results of their respective examinations and the internal auditor’s evaluation of the Company’s system of internal accounting and financial controls. The Audit and Risk Committee reviews interested person transactions to ensure that they are carried out on normal commercial terms and are not prejudicial to the interests of the Company and its minority shareholders. The Audit and Risk Committee also reviews the consolidated financial statements and the auditor’s report, as well as announcements to shareholders and the Singapore Exchange Securities Trading Limited before submission to the Board. During the financial year, the Audit and Risk Committee met once with the external auditor without the presence of the Management. The Audit and Risk Committee annually reviews the independence of the external auditor and recommends to the Board, the external auditor to be appointed. Further details on the Audit and Risk Committee are disclosed in the Report on Corporate Governance.
AUDITOR
Ernst & Young LLP have expressed their willingness to accept re-appointment as auditor.
On behalf of the Board
Chew Gek Khim Gary Hilton WeissDirector Director
Singapore27 March 2018
DIRECTORS’ STATEMENT
44 OUR BUSINESS PLATFORMS OUR GROWTH DRIVERS
INDEPENDENT AUDITOR’S REPORTTO THE MEMBERS OF THE STRAITS TRADING COMPANY LIMITED
For the financial year ended 31 December 2017
REPORT ON THE AUDIT OF THE FINANCIAL STATEMENTS
Opinion
We have audited the financial statements of The Straits Trading Company Limited (the “Company”) and its subsidiaries (collectively, the “Group”), which comprise the balance sheets of the Group and the Company as at 31 December 2017, the consolidated income statement, consolidated statement of comprehensive income, consolidated statement of changes in equity and consolidated cash flow statement of the Group for the year then ended, and notes to the financial statements, including a summary of significant accounting policies.
In our opinion, the accompanying consolidated financial statements of the Group and the balance sheet of the Company are properly drawn up in accordance with the provisions of the Companies Act, Chapter 50 (the “Act”) and Financial Reporting Standards in Singapore (“FRSs”) so as to give a true and fair view of the consolidated financial position of the Group and the financial position of the Company as at 31 December 2017 and of the consolidated financial performance, consolidated changes in equity and consolidated cash flows of the Group for the year ended on that date.
Basis for Opinion
We conducted our audit in accordance with Singapore Standards on Auditing (“SSAs”). Our responsibilities under those standards are further described in the Auditor’s Responsibilities for the Audit of the Financial Statements section of our report. We are independent of the Group in accordance with the Accounting and Corporate Regulatory Authority (“ACRA”) Code of Professional Conduct and Ethics for Public Accountants and Accounting Entities (“ACRA Code”) together with the ethical requirements that are relevant to our audit of the financial statements in Singapore, and we have fulfilled our other ethical responsibilities in accordance with these requirements and the ACRA Code. We believe that the audit evidence we have obtained is sufficient and appropriate to provide a basis for our opinion.
Key Audit Matters
Key audit matters are those matters that, in our professional judgement, were of most significance in our audit of the financial statements of the current period. These matters were addressed in the context of our audit of the financial statements as a whole, and in forming our opinion thereon, and we do not provide a separate opinion on these matters. For each matter below, our description of how our audit addressed the matter is provided in that context.
We have fulfilled our responsibilities described in the Auditor’s Responsibilities for the Audit of the Financial Statements section of our report, including in relation to these matters. Accordingly, our audit included the performance of procedures designed to respond to our assessment of the risks of material misstatement of the financial statements. The results of our audit procedures, including the procedures performed to address the matters below, provide the basis for our audit opinion on the accompanying financial statements.
45THE STRAITS TRADING COMPANY LIMITEDANNUAL REPORT 2017
Key Audit Matters (cont’d)
1. Fair value of investment properties, land and buildings
At 31 December 2017, the Group’s investment properties, land and buildings are carried at $586.7 million and $30.8 million respectively, representing 35.7% of the Group’s total non-current assets and 39.3% of equity in aggregate.
The Group carries its investment properties, land and buildings at their fair values based on independent external valuations. The valuation process is considered a key audit matter because it involves significant judgement in determining the appropriate valuation methodology to be used and in estimating the underlying assumptions to be applied. The valuations are highly sensitive to changes in the key assumptions applied, particularly those relating to capitalisation, discount and terminal yield rates, and price per square foot. Accordingly, we have identified this as an area of focus.
In addressing this area of focus, we considered the objectivity, independence and expertise of the external appraisers engaged by management and inquired the external appraisers on their valuation techniques. We have reviewed the valuation reports obtained from the external appraisers and considered the appropriateness of the valuation model, property related data, including estimates used by management and the external appraisers. We considered the reasonableness of the assumptions and estimates based on the current property market outlook and macroeconomic developments and corroborated inputs used in the estimates such as rental value, vacancy rates and maintenance status against our understanding of the tenancy profile and performance of the respective properties.
We reviewed the sufficiency of the disclosures of the properties included in notes 15, 16, 40(a)(iii) and 41 in light of the current circumstances.
2. Impairment testing for goodwill
At 31 December 2017, the Group’s goodwill arising from the acquisition of Malaysia Smelting Corporation Berhad (“MSC”) is carried at $17.6 million, representing 1.0% of the Group’s total non-current assets and 1.1% of equity. Based on the latest annual impairment testing, the estimated recoverable amount is in excess of the carrying value. Accordingly, management is satisfied that no goodwill impairment is required as at 31 December 2017.
Management has determined the recoverable amount of MSC based on its fair value less cost to sell which is calculated using its listed share price on the Bursa Malaysia Securities Berhad adjusted for a control premium. We have identified this as an area of focus because the determination of the control premium requires significant management judgement as the determination of the control premium is affected by expected future market and economic conditions.
In addressing this area of focus, we engaged our internal valuation specialist to support us in assessing the reasonableness of the control premium applied in the impairment assessment. This includes cross-checking the control premium applied to the mean control premium in historical acquisitions of targets in Malaysia. Furthermore, we assessed the sensitivity of the recoverable amount to changes in the control premium.
We reviewed the adequacy of the note disclosures to assess if they provide sufficient insight concerning those key assumptions underlying the valuation to which the outcome of the impairment test is most sensitive. The note on goodwill and related disclosures are included in notes 17(a) and 40(a)(i) to the financial statements.
INDEPENDENT AUDITOR’S REPORTTO THE MEMBERS OF THE STRAITS TRADING COMPANY LIMITED
For the financial year ended 31 December 2017
46 OUR BUSINESS PLATFORMS OUR GROWTH DRIVERS
Key Audit Matters (cont’d)
3. Provision for mine restoration costs
As disclosed in note 30 to the financial statements, the Group recorded a provision for mine restoration costs of $9.3 million in respect of restoration and rehabilitation obligations of its subsidiary as at 31 December 2017. Under the Mineral (Perak) Enactment 2003, the Group is required to submit its mine restoration plan for approval by the Perak State Mineral Resources Committee. The Group engaged an external consultant specialising in mine restoration to carry out an assessment of the required restoration and to formulate a mine restoration plan. As at the reporting date, the mine restoration plan has been submitted and is pending approval. The Group estimates the costs required to fulfil this obligation according to the plan formulated by the external consultant and recognised a provision for these costs at each reporting date.
A provision by its nature is more inherently uncertain as the estimates of the outcome and financial effects are determined by the judgement of the management in consultation with the external consultant. This was an area of focus in our audit due to the long timescales and significant management judgement and estimates involved in determining the intended method of restoration and amount of future cash outflows.
In addressing this area of focus, we considered the objectivity, independence, expertise and experience of the external mine restoration consultant engaged by the Group. We obtained an understanding of the methodology adopted by the consultant in formulating the restoration plan and assessed whether such methodology is consistent with those used in the industry. We also evaluated the significant cost components through enquiries with the external consultant and, where relevant, we compared the cost components to past actual experience or quotations obtained from third party contractors and suppliers.
We also reviewed the adequacy of the note disclosure about the significant judgement and estimation involved in determining the provision. The note disclosures on the provision for mine restoration costs are included in notes 30 and 40(a)(v).
4. Inventories
At 31 December 2017, the Group’s inventories are carried at $154.9 million, representing 22.1% of the Group’s total current assets and 9.9% of equity.
The Group contracts with various suppliers on different terms and conditions for the purchases of tin-in-concentrates. The timing of recognition of purchase of tin-in-concentrates and the corresponding liability is dependent on the terms of the contracts. Given the high number of different purchase contracts, we identified timing of recognition of tin-in-concentrates to be an area of focus. In addition, we also identified valuation of tin-in-concentrates, tin-in-process and refined tin metal as an area of focus due to the magnitude of the balances and the nature of tin-in-process and refined tin metal requires management to apply valuation techniques which involve subjective judgements and estimates.
In addressing the area of focus in respect of the timing of recognition of tin-in-concentrates, we, amongst other procedures, read the significant purchase contracts to obtain an understanding of the terms and conditions to establish the Group’s rights and obligations over tin-in-concentrates purchased. We tested the relevant internal controls over the accuracy and timing of recognition of tin-in-concentrates. We inspected, on a sample basis, documents which evidenced the receipt of tin-in-concentrates from suppliers. We also focused on testing purchase transactions close to the year end to establish whether the transactions were recorded in the correct accounting period.
In addressing the area of focus in respect of valuation of tin-in-concentrates, tin-in-process and refined tin metal, we obtained an understanding of the Group’s production process and the types of costs included in the valuation of tin-in-concentrates, tin-in-process and refined tin metal. We also obtained an understanding of and tested the internal controls over the recording of tin-in-concentrates consumed and the valuation of different stages of tin-in-process. We attended the physical inventory counts and observed whether the counts were conducted according to inventory count procedures. We tested the arithmetic calculation of the valuation of inventories. We also reviewed the adequacy of the note disclosure about the significant judgement and estimation involved in determining the valuation of inventories. The note disclosures on the inventories are included in note 40(a)(iv).
INDEPENDENT AUDITOR’S REPORTTO THE MEMBERS OF THE STRAITS TRADING COMPANY LIMITED
For the financial year ended 31 December 2017
47THE STRAITS TRADING COMPANY LIMITEDANNUAL REPORT 2017

Other information
Management is responsible for other information. The other information comprises the information included in the Annual Report, but does not include the financial statements and our auditor’s report thereon.
Our opinion on the financial statements does not cover the other information and we do not express any form of assurance conclusion thereon.
In connection with our audit of the financial statements, our responsibility is to read the other information and, in doing so, consider whether the other information is materially inconsistent with the financial statements or our knowledge obtained in the audit or otherwise appears to be materially misstated. If, based on the work we have performed, we conclude that there is a material misstatement of this other information, we are required to report that fact. We have nothing to report in this regard.
Responsibilities of Management and Directors for the Financial Statements
Management is responsible for the preparation of financial statements that give a true and fair view in accordance with the provisions of the Act and FRSs, and for devising and maintaining a system of internal accounting controls sufficient to provide a reasonable assurance that assets are safeguarded against loss from unauthorised use or disposition; and transactions are properly authorised and that they are recorded as necessary to permit the preparation of true and fair financial statements and to maintain accountability of assets.
In preparing the financial statements, management is responsible for assessing the Group’s ability to continue as a going concern, disclosing, as applicable, matters related to going concern and using the going concern basis of accounting unless management either intends to liquidate the Group or to cease operations, or has no realistic alternative but to do so.
The Directors’ responsibilities include overseeing the Group’s financial reporting process.
INDEPENDENT AUDITOR’S REPORTTO THE MEMBERS OF THE STRAITS TRADING COMPANY LIMITED
For the financial year ended 31 December 2017
48 OUR BUSINESS PLATFORMS OUR GROWTH DRIVERS

Auditor’s Responsibilities for the Audit of the Financial Statements
Our objectives are to obtain reasonable assurance about whether the financial statements as a whole are free from material misstatement, whether due to fraud or error, and to issue an auditor’s report that includes our opinion. Reasonable assurance is a high level of assurance, but is not a guarantee that an audit conducted in accordance with SSAs will always detect a material misstatement when it exists. Misstatements can arise from fraud or error and are considered material if, individually or in the aggregate, they could reasonably be expected to influence the economic decisions of users taken on the basis of these financial statements.
As part of an audit in accordance with SSAs, we exercise professional judgement and maintain professional scepticism throughout the audit. We also:
• Identify and assess the risks of material misstatement of the financial statements, whether due to fraud or error, design and perform audit procedures responsive to those risks, and obtain audit evidence that is sufficient and appropriate to provide a basis for our opinion. The risk of not detecting a material misstatement resulting from fraud is higher than for one resulting from error, as fraud may involve collusion, forgery, intentional omissions, misrepresentations, or the override of internal control.
• Obtain an understanding of internal control relevant to the audit in order to design audit procedures that are appropriate in the circumstances, but not for the purpose of expressing an opinion on the effectiveness of the Group’s internal control.
• Evaluate the appropriateness of accounting policies used and the reasonableness of accounting estimates and related disclosures made by management.
• Conclude on the appropriateness of management’s use of the going concern basis of accounting and, based on the audit evidence obtained, whether a material uncertainty exists related to events or conditions that may cast significant doubt on the Group’s ability to continue as a going concern. If we conclude that a material uncertainty exists, we are required to draw attention in our auditor’s report to the related disclosures in the financial statements or, if such disclosures are inadequate, to modify our opinion. Our conclusions are based on the audit evidence obtained up to the date of our auditor’s report. However, future events or conditions may cause the Group to cease to continue as a going concern.
• Evaluate the overall presentation, structure and content of the financial statements, including the disclosures, and whether the financial statements represent the underlying transactions and events in a manner that achieves fair presentation.
• Obtain sufficient appropriate audit evidence regarding the financial information of the entities or business activities within the Group to express an opinion on the consolidated financial statements. We are responsible for the direction, supervision and performance of the group audit. We remain solely responsible for our audit opinion.
INDEPENDENT AUDITOR’S REPORTTO THE MEMBERS OF THE STRAITS TRADING COMPANY LIMITED
For the financial year ended 31 December 2017
49THE STRAITS TRADING COMPANY LIMITEDANNUAL REPORT 2017
Auditor’s Responsibilities for the Audit of the Financial Statements (cont’d)
We communicate with the Directors regarding, among other matters, the planned scope and timing of the audit and significant audit findings, including any significant deficiencies in internal control that we identify during our audit.
We also provide the Directors with a statement that we have complied with relevant ethical requirements regarding independence, and to communicate with them all relationships and other matters that may reasonably be thought to bear on our independence, and where applicable, related safeguards.
From the matters communicated with the Directors, we determine those matters that were of most significance in the audit of the financial statements of the current period and are therefore the key audit matters. We describe these matters in our auditor’s report unless law or regulation precludes public disclosure about the matter or when, in extremely rare circumstances, we determine that a matter should not be communicated in our report because the adverse consequences of doing so would reasonably be expected to outweigh the public interest benefits of such communication.
Report on Other Legal and Regulatory Requirements
In our opinion, the accounting and other records required by the Act to be kept by the Company and by those subsidiary corporations incorporated in Singapore of which we are the auditors have been properly kept in accordance with the provisions of the Act.
The engagement partner on the audit resulting in this independent auditor’s report is Lim Tze Yuen.
Ernst & Young LLP Public Accountants andChartered Accountants Singapore27 March 2018
INDEPENDENT AUDITOR’S REPORTTO THE MEMBERS OF THE STRAITS TRADING COMPANY LIMITED
For the financial year ended 31 December 2017
50 OUR BUSINESS PLATFORMS OUR GROWTH DRIVERS
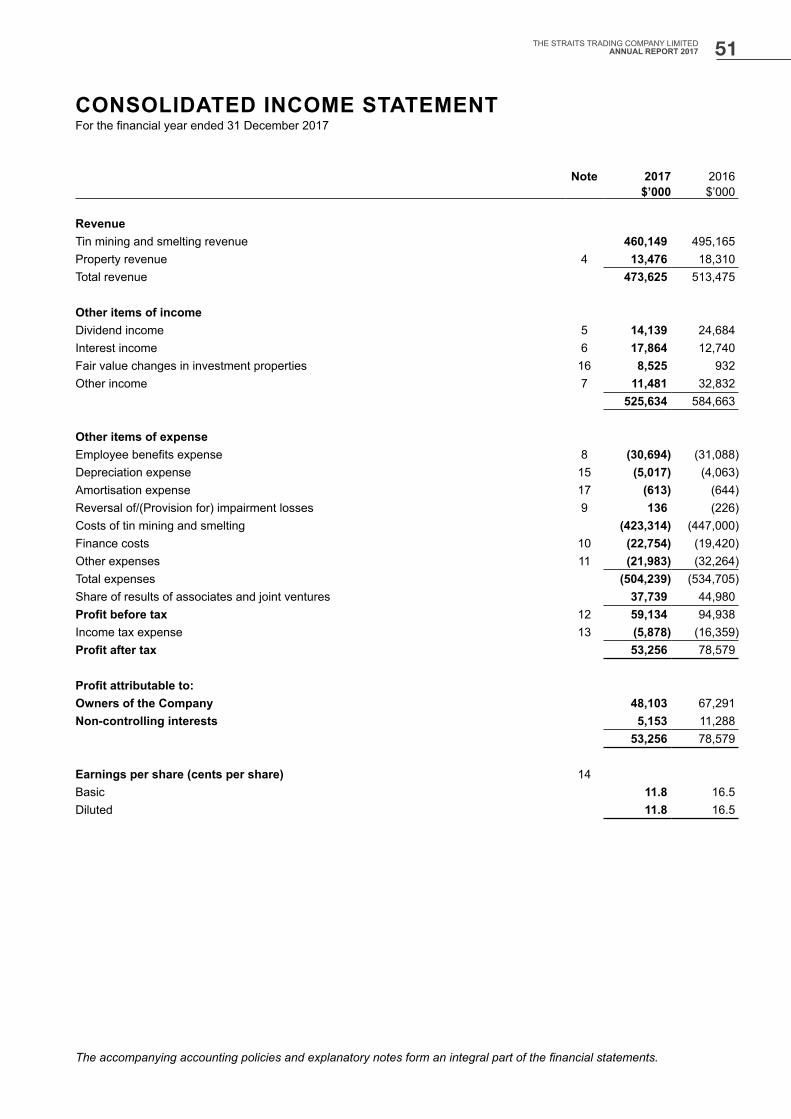
Note 2017 2016$’000 $’000
RevenueTin mining and smelting revenue 460,149 495,165Property revenue 4 13,476 18,310Total revenue 473,625 513,475
Other items of incomeDividend income 5 14,139 24,684Interest income 6 17,864 12,740Fair value changes in investment properties 16 8,525 932Other income 7 11,481 32,832
525,634 584,663
Other items of expenseEmployee benefits expense 8 (30,694) (31,088)Depreciation expense 15 (5,017) (4,063)Amortisation expense 17 (613) (644)Reversal of/(Provision for) impairment losses 9 136 (226)Costs of tin mining and smelting (423,314) (447,000)Finance costs 10 (22,754) (19,420)Other expenses 11 (21,983) (32,264)Total expenses (504,239) (534,705)Share of results of associates and joint ventures 37,739 44,980Profit before tax 12 59,134 94,938Income tax expense 13 (5,878) (16,359)Profit after tax 53,256 78,579
Profit attributable to:Owners of the Company 48,103 67,291Non-controlling interests 5,153 11,288
53,256 78,579
Earnings per share (cents per share) 14Basic 11.8 16.5Diluted 11.8 16.5
CONSOLIDATED INCOME STATEMENTFor the financial year ended 31 December 2017
The accompanying accounting policies and explanatory notes form an integral part of the financial statements.
51THE STRAITS TRADING COMPANY LIMITEDANNUAL REPORT 2017
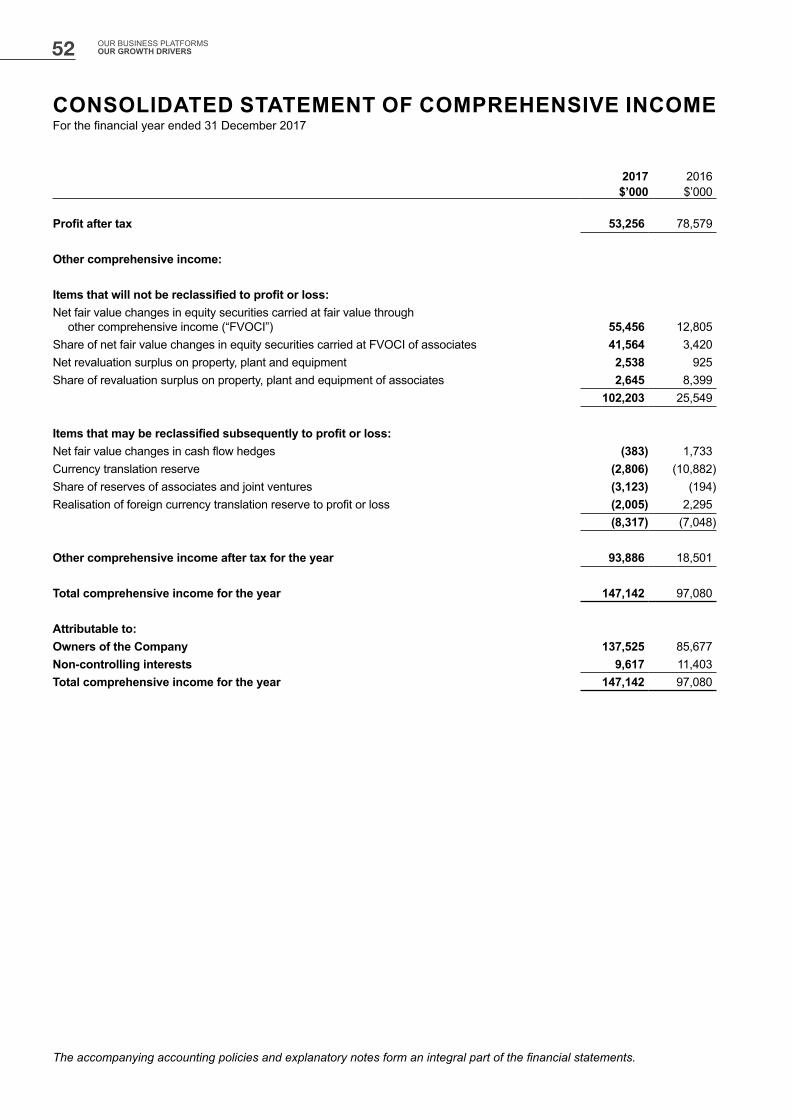
2017 2016$’000 $’000
Profit after tax 53,256 78,579
Other comprehensive income:
Items that will not be reclassified to profit or loss:Net fair value changes in equity securities carried at fair value through
other comprehensive income (“FVOCI”) 55,456 12,805Share of net fair value changes in equity securities carried at FVOCI of associates 41,564 3,420Net revaluation surplus on property, plant and equipment 2,538 925Share of revaluation surplus on property, plant and equipment of associates 2,645 8,399
102,203 25,549
Items that may be reclassified subsequently to profit or loss:Net fair value changes in cash flow hedges (383) 1,733Currency translation reserve (2,806) (10,882)Share of reserves of associates and joint ventures (3,123) (194)Realisation of foreign currency translation reserve to profit or loss (2,005) 2,295
(8,317) (7,048)
Other comprehensive income after tax for the year 93,886 18,501
Total comprehensive income for the year 147,142 97,080
Attributable to: Owners of the Company 137,525 85,677Non-controlling interests 9,617 11,403Total comprehensive income for the year 147,142 97,080
CONSOLIDATED STATEMENT OF COMPREHENSIVE INCOMEFor the financial year ended 31 December 2017
The accompanying accounting policies and explanatory notes form an integral part of the financial statements.
52 OUR BUSINESS PLATFORMS OUR GROWTH DRIVERS

Group CompanyNote 2017 2016 2017 2016
$’000 $’000 $’000 $’000
AssetsNon-current assetsProperty, plant and equipment 15 54,788 52,737 112 143Investment properties 16 586,694 554,337 33,110 32,314Goodwill 17(a) 17,629 17,298 – –Other intangible assets 17(b) 6,718 7,100 – –Subsidiaries 18 – – 124,237 125,237Associates and joint ventures 19 789,409 639,379 1,997 2,708Deferred tax assets 20 7,750 3,731 – –Other non-current receivables 21 – – – –Derivative financial instruments 23 – 551 – –Investment securities 22(a) 264,395 256,179 – –Other non-current assets 24 3,974 970 – –Total non-current assets 1,731,357 1,532,282 159,456 160,402
Current assetsAssets classified as held for sale 25 5,000 17,464 – 17,464Development properties for sale – 66 – –Inventories 26 154,880 119,554 – –Income tax receivables 6,734 3,611 297 –Prepayments and accrued income 1,132 2,409 14 15Trade related prepayments 16,377 13,685 – –Trade receivables 21 5,282 37,565 23 50Other receivables 21 73,315 74,027 979,031 837,184Investment securities 22(b) 76,879 112,548 – –Derivative financial instruments 23 255 313 – –Cash and cash equivalents 27 362,438 291,091 258,760 99,374Total current assets 702,292 672,333 1,238,125 954,087
Total assets 2,433,649 2,204,615 1,397,581 1,114,489
BALANCE SHEETSAs at 31 December 2017
The accompanying accounting policies and explanatory notes form an integral part of the financial statements.
53THE STRAITS TRADING COMPANY LIMITEDANNUAL REPORT 2017

Group CompanyNote 2017 2016 2017 2016
$’000 $’000 $’000 $’000
Equity and liabilitiesEquityShare capital 28 568,968 568,968 568,968 568,968Retained earnings 29 874,014 832,222 64,565 73,372Other reserves 29 34,600 (36,682) (17,968) (19,404)Equity attributable to owners of the Company 1,477,582 1,364,508 615,565 622,936Non-controlling interests 93,312 94,240 – –Total equity 1,570,894 1,458,748 615,565 622,936
Non-current liabilitiesProvisions 30 9,196 8,644 – –Deferred tax liabilities 20 5,421 5,672 1,692 2,751Borrowings 31 552,904 185,770 149,694 –Derivative financial instruments 23 899 374 – –Other non-current liabilities 32 461 1,265 – –Total non-current liabilities 568,881 201,725 151,386 2,751
Current liabilitiesProvisions 30 4,058 3,116 – –Income tax payable 3,166 13,426 197 75Trade and other payables 33 70,083 92,445 630,433 488,727Borrowings 31 215,757 434,041 – –Derivative financial instruments 23 810 1,114 – –Total current liabilities 293,874 544,142 630,630 488,802
Total liabilities 862,755 745,867 782,016 491,553
Total equity and liabilities 2,433,649 2,204,615 1,397,581 1,114,489
BALANCE SHEETSAs at 31 December 2017
The accompanying accounting policies and explanatory notes form an integral part of the financial statements.
54 OUR BUSINESS PLATFORMS OUR GROWTH DRIVERS

CONSOLIDATED STATEMENT OF CHANGES IN EQUITYFor the financial year ended 31 December 2017
The accompanying accounting policies and explanatory notes form an integral part of the financial statements.
Totalequity
Equity attributable
to ownersof the
CompanyShare
capitalRetained earnings
FVOCIreserve
Hedging reserve
Revaluation reserve
Translation reserve
Non-controlling
interests$’000 $’000 $’000 $’000 $’000 $’000 $’000 $’000 $’000
Opening balance at 1 January 2017 1,458,748 1,364,508 568,968 832,222 (10,178) (672) 24,044 (49,876) 94,240
Total comprehensive income for the year 147,142 137,525 – 48,103 93,646 (370) 4,022 (7,876) 9,617
Contributions by and distributions to owners
Dividend on ordinary shares (note 34) (24,486) (24,486) – (24,486) – – – – –
Dividend to non-controlling interests (4,119) – – – – – – – (4,119)
Contribution of capital by non-controlling interests 1,805 – – – – – – – 1,805
Return of capital to non- controlling interests (1,219) – – – – – – – (1,219)
Total contributions by and distributions to owners (28,019) (24,486) – (24,486) – – – – (3,533)
Changes in ownership interests in subsidiaries
Disposal of a subsidiary (6,977) – – – – – – – (6,977)Increase in ownership in a
subsidiary – 35 – 35 – – – – (35)Total changes in ownership
interests in subsidiaries (6,977) 35 – 35 – – – – (7,012)
Total transactions with owners in their capacity as owners (34,996) (24,451) – (24,451) – – – – (10,545)
Others Share of associate’s realisation
of FVOCI reserve – – – 18,140 (18,140) – – – –Total others – – – 18,140 (18,140) – – – –
Closing balance at 31 December 2017 1,570,894 1,477,582 568,968 874,014 65,328 (1,042) 28,066 (57,752) 93,312
55THE STRAITS TRADING COMPANY LIMITEDANNUAL REPORT 2017
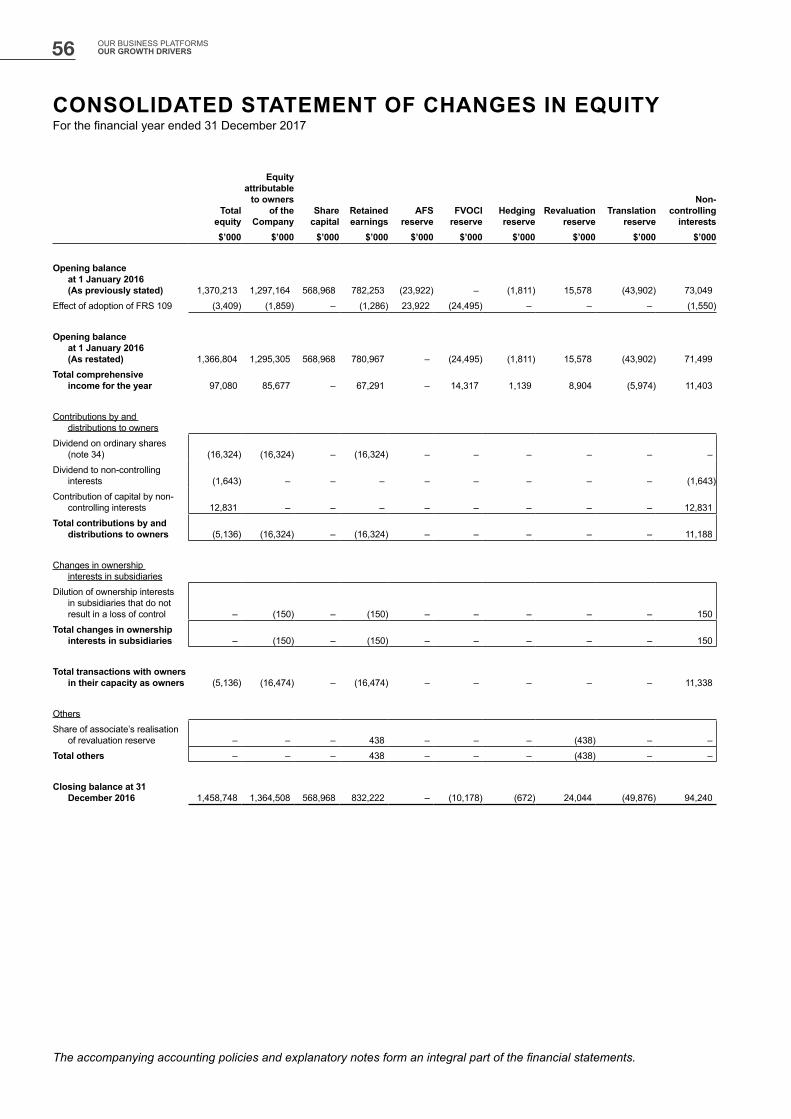
CONSOLIDATED STATEMENT OF CHANGES IN EQUITYFor the financial year ended 31 December 2017
Totalequity
Equity attributable
to ownersof the
CompanyShare
capitalRetained earnings
AFS reserve
FVOCIreserve
Hedging reserve
Revaluation reserve
Translation reserve
Non-controlling
interests$’000 $’000 $’000 $’000 $’000 $’000 $’000 $’000 $’000 $’000
Opening balance at 1 January 2016
(As previously stated) 1,370,213 1,297,164 568,968 782,253 (23,922) – (1,811) 15,578 (43,902) 73,049Effect of adoption of FRS 109 (3,409) (1,859) – (1,286) 23,922 (24,495) – – – (1,550)
Opening balance at 1 January 2016 (As restated) 1,366,804 1,295,305 568,968 780,967 – (24,495) (1,811) 15,578 (43,902) 71,499
Total comprehensive income for the year 97,080 85,677 – 67,291 – 14,317 1,139 8,904 (5,974) 11,403
Contributions by and distributions to owners
Dividend on ordinary shares (note 34) (16,324) (16,324) – (16,324) – – – – – –
Dividend to non-controlling interests (1,643) – – – – – – – – (1,643)
Contribution of capital by non-controlling interests 12,831 – – – – – – – – 12,831
Total contributions by and distributions to owners (5,136) (16,324) – (16,324) – – – – – 11,188
Changes in ownership interests in subsidiaries
Dilution of ownership interests in subsidiaries that do not result in a loss of control – (150) – (150) – – – – – 150
Total changes in ownership interests in subsidiaries – (150) – (150) – – – – – 150
Total transactions with owners in their capacity as owners (5,136) (16,474) – (16,474) – – – – – 11,338
Others Share of associate’s realisation
of revaluation reserve – – – 438 – – – (438) – –Total others – – – 438 – – – (438) – –
Closing balance at 31 December 2016 1,458,748 1,364,508 568,968 832,222 – (10,178) (672) 24,044 (49,876) 94,240
The accompanying accounting policies and explanatory notes form an integral part of the financial statements.
56 OUR BUSINESS PLATFORMS OUR GROWTH DRIVERS
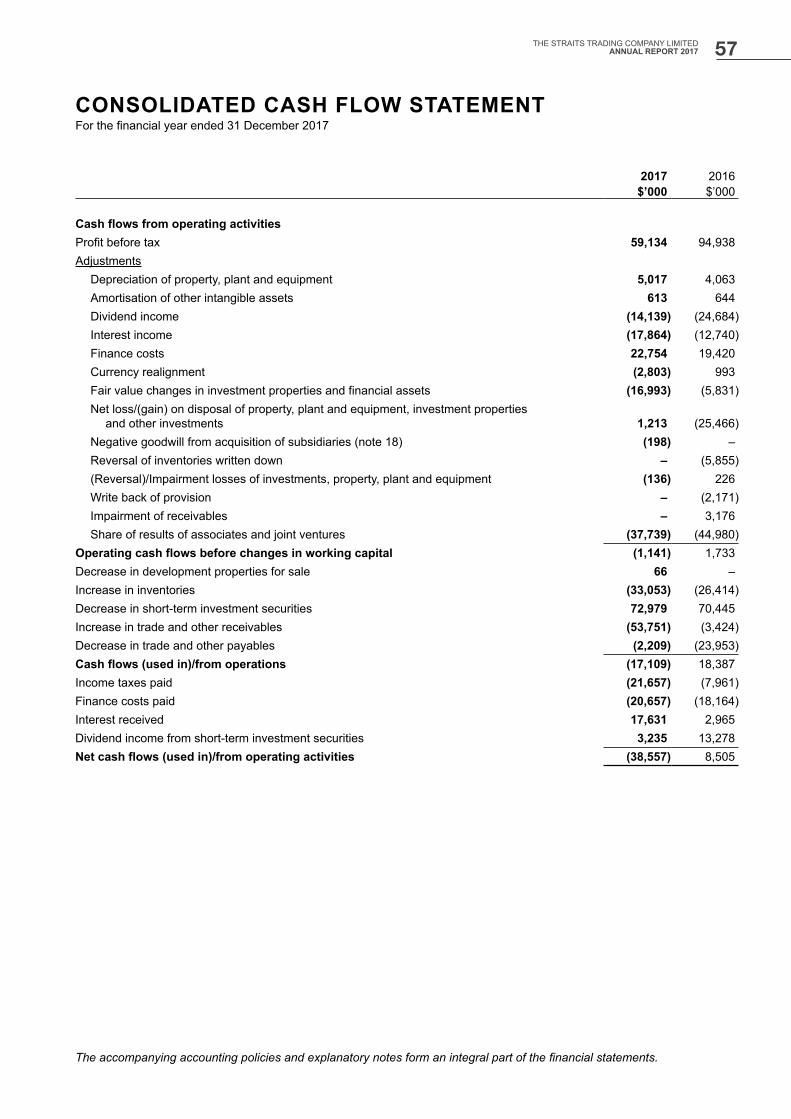
CONSOLIDATED CASH FLOW STATEMENTFor the financial year ended 31 December 2017
2017 2016$’000 $’000
Cash flows from operating activitiesProfit before tax 59,134 94,938Adjustments
Depreciation of property, plant and equipment 5,017 4,063Amortisation of other intangible assets 613 644Dividend income (14,139) (24,684)Interest income (17,864) (12,740)Finance costs 22,754 19,420Currency realignment (2,803) 993Fair value changes in investment properties and financial assets (16,993) (5,831)Net loss/(gain) on disposal of property, plant and equipment, investment properties
and other investments 1,213 (25,466)Negative goodwill from acquisition of subsidiaries (note 18) (198) –Reversal of inventories written down – (5,855)(Reversal)/Impairment losses of investments, property, plant and equipment (136) 226Write back of provision – (2,171)Impairment of receivables – 3,176Share of results of associates and joint ventures (37,739) (44,980)
Operating cash flows before changes in working capital (1,141) 1,733Decrease in development properties for sale 66 –Increase in inventories (33,053) (26,414)Decrease in short-term investment securities 72,979 70,445Increase in trade and other receivables (53,751) (3,424)Decrease in trade and other payables (2,209) (23,953)Cash flows (used in)/from operations (17,109) 18,387Income taxes paid (21,657) (7,961)Finance costs paid (20,657) (18,164)Interest received 17,631 2,965Dividend income from short-term investment securities 3,235 13,278Net cash flows (used in)/from operating activities (38,557) 8,505
The accompanying accounting policies and explanatory notes form an integral part of the financial statements.
57THE STRAITS TRADING COMPANY LIMITEDANNUAL REPORT 2017

2017 2016$’000 $’000
Cash flows from investing activitiesProceeds from disposal of property, plant and equipment,
other intangible assets and investment properties 25,115 174,927Proceeds from redemption of a debt instrument 36,412 –Cost incurred on property, plant and equipment (3,944) (18,703)Cost incurred on investment properties (21,855) (114,595)Initial payment on a property (2,773) –Investment in an associate and a joint venture (151,415) (55,902)Purchase of investment securities (38,775) (31,199)Return of capital from associates 64,816 –Payment for deferred mine exploration and evaluation
expenditure, mine properties and other intangible assets (157) (1,217)Net cash outflow on acquisition of subsidiaries (note 18) (2,212) –Net cash inflow from sale of a subsidiary (note 18) 75,689 –Dividend income from investment securities and associates 19,761 23,003Currency realignment 2,667 1,684Net cash flows from/(used in) investing activities 3,329 (22,002)
Cash flows from financing activitiesDividend paid to shareholders (note 34) (24,486) (16,324)Dividend paid to non-controlling shareholders of subsidiaries (4,380) (1,443)Repayment of loan to a non-controlling shareholder of a subsidiary (4,077) –(Repayment)/Drawdown of short-term borrowings (32,604) 34,865Drawdown of long-term borrowings 274,113 117,154Repayment of long-term borrowings (248,849) (81,748)Proceeds from issuance of fixed rate notes 150,000 –Net proceeds from issuance of shares by subsidiaries to non-controlling shareholders 1,805 12,831Return of capital to non-controlling shareholders of a subsidiary (1,219) –Currency realignment (2,608) 457Net cash flows from financing activities 107,695 65,792
Net increase in cash and cash equivalents 72,467 52,295Effect of exchange rate changes on cash and cash equivalents (1,120) (529)Cash and cash equivalents, beginning balance 291,091 239,325Cash and cash equivalents, ending balance (note 27) 362,438 291,091
CONSOLIDATED CASH FLOW STATEMENTFor the financial year ended 31 December 2017
The accompanying accounting policies and explanatory notes form an integral part of the financial statements.
58 OUR BUSINESS PLATFORMS OUR GROWTH DRIVERS
1. CORPORATE INFORMATION
The financial statements of The Straits Trading Company Limited (the “Company”) for the year ended 31 December 2017 were authorised for issue in accordance with a resolution of the Directors on 27 March 2018.
The Straits Trading Company Limited is a limited liability company incorporated and domiciled in Singapore. The registered office of the Company is located at 1 Wallich Street #15-01, Guoco Tower, Singapore 078881. The Company is listed on the Singapore Exchange Securities Trading Limited.
The immediate holding company is The Cairns Pte. Ltd. and the ultimate holding company is Tan Chin Tuan Pte. Ltd.. Both companies are incorporated in Singapore.
The principal activity of the Company is that of an investment company. The principal activities of the subsidiaries are disclosed in note 44 to the financial statements.
The consolidated financial statements relate to the Company and its subsidiaries (referred to as the “Group”) and the Group’s interests in associates and joint ventures.
2. SUMMARY OF SIGNIFICANT ACCOUNTING POLICIES
2.1 Basis of preparation
The consolidated financial statements of the Group and the balance sheet of the Company have been prepared in accordance with Singapore Financial Reporting Standards (“FRSs”).
The financial statements have been prepared on a historical cost basis except as disclosed in the accounting policies below.
The financial statements are presented in Singapore dollars (SGD or $) and all values are rounded to the nearest thousand ($’000) except when otherwise indicated. The financial statements of the Company includes the operations of its Malaysia branch.
Convergence with International Financial Reporting Standards
For annual financial period beginning on or after 1 January 2018, Singapore-incorporated companies listed on the Singapore Exchange will apply Singapore Financial Reporting Framework (International) (“SFRS(I)”), a new financial reporting framework identical to International Financial Reporting Standards. The Group will adopt SFRS(I) on 1 January 2018.
On transition to the new financial reporting framework, the Group expects to elect the option to deem cumulative translation differences for foreign operations to be zero on 1 January 2017, and accordingly, the gain or loss that will be recognised on a subsequent disposal of the foreign operations will exclude cumulative translation differences that arose before 1 January 2017. The Group and the Company expects to reclassify an amount of $49,876,000 and $19,607,000 respectively of foreign currency translation reserve to the opening retained earnings as at 1 January 2017.
Other than the effects of the matter as described above and in note 2.3, the Group expects that the adoption of the new financial reporting framework will have no material impact on the financial statements in the year of initial application.
NOTES TO THE FINANCIAL STATEMENTSFor the financial year ended 31 December 2017
59THE STRAITS TRADING COMPANY LIMITEDANNUAL REPORT 2017

2. SUMMARY OF SIGNIFICANT ACCOUNTING POLICIES (CONT’D)
2.2 Changes in accounting policies
The accounting policies adopted are consistent with those of the previous financial year except that in the current financial year, the Group has adopted all the new and revised standards which are effective for annual financial periods beginning on or after 1 January 2017.
The following FRSs are effective for the annual period beginning on or after 1 January 2017:
Amendments to FRS 7 Disclosure Initiative Amendments to FRS 12 Recognition of Deferred Tax Assets for Unrealised Losses Improvements to FRSs (December 2016)– Amendments to FRS 112 Disclosure of Interests in Other Entities
The adoption of these standards did not have any significant financial impact on the financial performance or position of the Group and the Company.
2.3 Standards issued but not yet effective
The Group has not adopted the following standards and interpretations that have been issued but not yet effective:
Description
Effective for annualperiods beginning
on or after
Improvements to FRSs (December 2016)- Amendments to FRS 28 Investments in Associates and Joint Ventures 1 January 2018Amendments to FRS 40 Transfers of Investment Property 1 January 2018Amendments to FRS 102 Classification and Measurement of Share-based Payment Transactions 1 January 2018INT FRS 122 Foreign Currency Transactions and Advance Consideration 1 January 2018Amendments to FRS 104 Applying FRS 109 Financial Instruments with
FRS 104 Insurance Contracts1 January 2018
FRS 115 Revenue from Contracts with Customers 1 January 2018 Amendments to FRS 115 Clarifications to FRS 115 Revenue from Contracts with Customers 1 January 2018FRS 116 Leases 1 January 2019Amendments to FRS 109 Prepayment Features with Negative Compensation 1 January 2019Amendments to FRS 28 Long-term Interests in Associates and Joint Ventures 1 January 2019Improvements to FRSs (March 2018)- Amendments to FRS 103 Business Combinations 1 January 2019- Amendments to FRS 111 Joint Arrangements 1 January 2019- Amendments to FRS 12 Income Taxes 1 January 2019- Amendments to FRS 23 Borrowing Costs 1 January 2019INT FRS 123 Uncertainty over Income Tax Treatments 1 January 2019Amendments to FRS 110 & FRS 28 Sale or Contribution of Assets between an Investor and its
Associate or Joint VentureDate to be
determined
As disclosed in note 2.1, the Group will adopt SFRS(I) on 1 January 2018. Upon adoption of SFRS(I) on 1 January 2018, the SFRS(I) equivalent of the above standards that are effective on 1 January 2018 will be adopted at the same time.
The Directors expect that the adoption of the SFRS(I) equivalent of the above standards will have no material impact on the financial statements in the period of initial application except as discussed below:
FRS 115 Revenue from Contracts with Customers
FRS 115 establishes a new five-step model that will apply to revenue arising from contracts with customers. FRS 115 will supersede the current revenue recognition guidance including FRS 18 Revenue, FRS 11 Construction Contracts and the related interpretations when it becomes effective.
NOTES TO THE FINANCIAL STATEMENTSFor the financial year ended 31 December 2017
60 OUR BUSINESS PLATFORMS OUR GROWTH DRIVERS
NOTES TO THE FINANCIAL STATEMENTSFor the financial year ended 31 December 2017
2. SUMMARY OF SIGNIFICANT ACCOUNTING POLICIES (CONT’D)
2.3 Standards issued but not yet effective (cont’d)
FRS 115 Revenue from Contracts with Customers (cont’d)
The core principle of FRS 115 is that an entity should recognise revenue which depict the transfer of promised goods or services to customers in an amount that reflects the consideration to which the entity expects to be entitled in exchange for those goods or services.
Under FRS 115, an entity recognises revenue when (or as) a performance obligation is satisfied, i.e. when “control” of the goods or services underlying the particular performance obligation is transferred to the customer.
The Group will be applying the changes in accounting policies retrospectively to each reporting year presented, using the full retrospective approach.
The Group has established a project team to evaluate the potential impact of adopting this standard. The implementation efforts included identifying main revenue streams, selecting individual contracts to analyse the accounting differences and potential statement impact based on the new five-step model, assessing transition method to be used in adoption, and developing updated disclosures.
Based on the completed contracts reviews to date, the Group’s assessment of the impact of FRS 115 is set out below:
• Revenue relating to sales of goods will be recognised when control of the goods has transferred, being the point when the goods are delivered to the customer. As the transfer of risks and rewards generally coincides with the transfer of control at a point in time, the timing and amount of revenue recognised for the sale of goods under FRS 115 is unlikely to be materially different from its current practice.
• Revenue relating to other service charge will be recognised in the accounting period in which the services are rendered. The Group does not expect the revenue recognition for services under FRS 115 to be materially different from its current practice.
• The adoption of FRS 115 will result in changes in accounting policies for revenue recognition and disclosures made in the Group’s financial statements.
The project team is developing additional quantitative and qualitative disclosures that will be required upon the adoption of the new revenue recognition standard.
FRS 116 Leases
FRS 116 requires lessees to recognise most leases on balance sheets to reflect the rights to use the leased assets and the associated obligations for lease payments as well as the corresponding interest expense and depreciation charges. The standard includes two recognition exemption for lessees – leases of ‘low value’ assets and short-term leases. The new standard is effective for annual periods beginning on or after 1 January 2019.
The Group has performed a preliminary assessment of the new standard on its existing operating lease arrangements as a lessee, in particular, on its rented office premises.
Based on the preliminary assessment, the Group expects these operating leases to be recognised as right of use assets with corresponding lease liabilities under the new standard. The Group is currently assessing the quantitative impact on the financial statements.
2.4 Basis of consolidation and business combinations
(a) Basis of consolidation
The financial statements of the Company includes the operations of its Malaysia branch. The consolidated financial statements comprise the financial statements of the Company and its subsidiaries as at the end of the reporting period. The financial statements of the subsidiaries used in the preparation of the consolidated financial statements are prepared for the same reporting date as the Company. Consistent accounting policies are applied to like transactions and events in similar circumstances.
61THE STRAITS TRADING COMPANY LIMITEDANNUAL REPORT 2017

2. SUMMARY OF SIGNIFICANT ACCOUNTING POLICIES (CONT’D)
2.4 Basis of consolidation and business combinations (cont’d)
(a) Basis of consolidation (cont’d)
All intra-group balances, income and expenses and unrealised gains and losses resulting from intra-group transactions and dividends are eliminated in full.
Subsidiaries are consolidated from the date of acquisition, being the date on which the Group obtains control, and continue to be consolidated until the date that such control ceases.
Losses within a subsidiary are attributed to the non-controlling interest even if that results in a deficit balance.
A change in the ownership interest of a subsidiary, without a loss of control, is accounted for as an equity transaction. If the Group loses control over a subsidiary, it:
‒ Derecognises the assets (including goodwill) and liabilities of the subsidiary at their carrying amounts at the date when control is lost;
‒ Derecognises the carrying amount of any non-controlling interest;‒ Derecognises the cumulative translation differences recorded in equity;‒ Recognises the fair value of the consideration received;‒ Recognises the fair value of any investment retained;‒ Recognises any surplus or deficit in profit or loss;‒ Reclassifies the Group’s share of components previously recognised in other comprehensive income to profit
or loss or retained earnings, as appropriate.
(b) Business combinations and goodwill
Business combinations are accounted for by applying the acquisition method. Identifiable assets acquired and liabilities assumed in a business combination are measured initially at their fair values at the acquisition date. Acquisition-related costs are recognised as expenses in the periods in which the costs are incurred and the services are received.
Any contingent consideration to be transferred by the acquirer will be recognised at fair value at the acquisition date. Subsequent changes to the fair value of the contingent consideration which is deemed to be an asset or liability will be recognised in profit or loss.
The Group elects for each individual business combination, whether non-controlling interest in the acquiree (if any), that are present ownership interests and entitle their holders to a proportionate share of net assets in the event of liquidation, is recognised on the acquisition date at fair value, or at the non-controlling interest’s proportionate share of the acquiree’s identifiable net assets. Other components of non-controlling interests are measured at their acquisition date fair value, unless another measurement basis is required by another FRS.
Any excess of the sum of the fair value of the consideration transferred in the business combination, the amount of non-controlling interest in the acquiree (if any), and the fair value of the Group’s previously held equity interest in the acquiree (if any), over the net fair value of the acquiree’s identifiable assets and liabilities is recorded as goodwill. In instances where the latter amount exceeds the former, the excess is recognised as gain on bargain purchase in profit or loss on the acquisition date.
Goodwill
Goodwill is initially measured at cost. Following initial recognition, goodwill is measured at cost less any accumulated impairment losses.
For purpose of impairment testing, goodwill acquired in a business combination is, from the acquisition date, allocated to the Group’s cash-generating units that are expected to benefit from the synergies of the combination, irrespective of whether other assets or liabilities of the acquiree are assigned to those units.
NOTES TO THE FINANCIAL STATEMENTSFor the financial year ended 31 December 2017
62 OUR BUSINESS PLATFORMS OUR GROWTH DRIVERS
2. SUMMARY OF SIGNIFICANT ACCOUNTING POLICIES (CONT’D)
2.4 Basis of consolidation and business combinations (cont’d)
(b) Business combinations and goodwill (cont’d)
Goodwill (cont’d)
The cash-generating units to which goodwill have been allocated is tested for impairment annually and whenever there is an indication that the cash-generating unit may be impaired. Impairment is determined for goodwill by assessing the recoverable amount of each cash-generating unit (or group of cash-generating units) to which the goodwill relates.
2.5 Transactions with non-controlling interests
Non-controlling interest represents the equity in subsidiaries not attributable, directly or indirectly, to owners of the Company.
Changes in the Company’s ownership interest in a subsidiary that do not result in a loss of control are accounted for as equity transactions. In such circumstances, the carrying amounts of the controlling and non-controlling interests are adjusted to reflect the changes in their relative interests in the subsidiary. Any difference between the amount by which the non-controlling interest is adjusted and the fair value of the consideration paid or received is recognised directly in equity and attributed to owners of the Company.
2.6 Foreign currency
The financial statements are presented in Singapore Dollars, which is also the Company’s functional currency. Each entity in the Group determines its own functional currency and items included in the financial statements of each entity are measured using that functional currency.
(a) Transactions and balances
Transactions in foreign currencies are measured in the respective functional currencies of the Company and its subsidiaries and are recorded on initial recognition in the functional currencies at exchange rates approximating those ruling at the transaction dates. Monetary assets and liabilities denominated in foreign currencies are translated at the rate of exchange ruling at the end of the reporting period. Non-monetary items that are measured in terms of historical cost in a foreign currency are translated using the exchange rates as at the dates of the initial transactions. Non-monetary items measured at fair value in a foreign currency are translated using the exchange rates at the date when the fair value was measured.
Exchange differences arising on the settlement of monetary items or on translating monetary items at the end of the reporting period are recognised in profit or loss.
Exchange differences arising on monetary items that form part of the Group’s net investment in foreign operations are recognised initially in other comprehensive income and accumulated under foreign currency translation reserve in equity. The foreign currency translation reserve is reclassified from equity to profit or loss of the Group on disposal of the foreign operation.
(b) Consolidated financial statements
For consolidation purpose, the assets and liabilities of foreign operations are translated into SGD at the rate of exchange ruling at the end of the reporting period and their profit or loss are translated at the exchange rates prevailing at the date of the transactions. The exchange differences arising on the translation are recognised in other comprehensive income. On disposal of a foreign operation, the component of other comprehensive income relating to that particular foreign operation is recognised in profit or loss.
In the case of a partial disposal without loss of control of a subsidiary that includes a foreign operation, the proportionate share of the cumulative amount of the exchange differences are re-attributed to non-controlling interest and are not recognised in profit or loss. For partial disposals of associates or jointly controlled entities that are foreign operations, the proportionate share of the accumulated exchange differences is reclassified to profit or loss.
NOTES TO THE FINANCIAL STATEMENTSFor the financial year ended 31 December 2017
63THE STRAITS TRADING COMPANY LIMITEDANNUAL REPORT 2017
2. SUMMARY OF SIGNIFICANT ACCOUNTING POLICIES (CONT’D)
2.7 Subsidiaries
A subsidiary is an investee that is controlled by the Group. The Group controls an investee when it is exposed, or has rights, to variable returns from its involvement with the investee and has the ability to affect those returns through its power over the investee.
In the Company’s separate financial statements, investments in subsidiaries are accounted for at cost less impairment losses.
2.8 Joint ventures and associates
An associate is an entity over which the Group has the power to participate in the financial and operating policy decisions of the investee but does not have control or joint control of those policies.
The Group accounts for its investments in associates and joint ventures using the equity method from the date on which it becomes an associate or joint venture.
On acquisition of the investment, any excess of the cost of the investment over the Group’s share of the net fair value of the investee’s identifiable assets and liabilities is accounted as goodwill and is included in the carrying amount of the investment. Any excess of the Group’s share of the net fair value of the investee’s identifiable assets and liabilities over the cost of the investment is included as income in the determination of the entity’s share of the associate or joint venture’s profit or loss in the period in which the investment is acquired.
Under the equity method, the investment in associates or joint ventures are carried in the balance sheet at cost plus post-acquisition changes in the Group’s share of net assets of the associates or joint ventures. The profit or loss reflects the share of results of the operations of the associates or joint ventures. Distributions received from joint ventures or associates reduce the carrying amount of the investment. Where there has been a change recognised in other comprehensive income by the associates or joint ventures, the Group recognises its share of such changes in other comprehensive income. Unrealised gains and losses resulting from transactions between the Group and associates or joint ventures are eliminated to the extent of the interest in the associates or joint ventures.
When the Group’s share of losses in an associate or joint venture equals or exceeds its interest in the associate or joint venture, the Group does not recognise further losses, unless it has incurred obligations or made payments on behalf of the associate or joint venture.
After application of the equity method, the Group determines whether it is necessary to recognise an additional impairment loss on the Group’s investment in associates or joint ventures. The Group determines at the end of each reporting period whether there is any objective evidence that the investment in the associate or joint venture is impaired. If this is the case, the Group calculates the amount of impairment as the difference between the recoverable amount of the associate or joint venture and its carrying value and recognises the amount in profit or loss.
Net assets of the associates and joint ventures are included in the consolidated financial statements under the equity method based on their latest audited financial statements. Where their financial periods do not end on 31 December, management accounts to 31 December are used. Where necessary, adjustments are made to bring the accounting policies in line with those of the Group.
2.9 Property, plant and equipment
All items of property, plant and equipment are initially recorded at cost. Such cost includes the cost of replacing part of the property, plant and equipment and borrowing costs that are directly attributable to the acquisition, construction or production of a qualifying property, plant and equipment. The accounting policy for borrowing costs is set out in note 2.20. The cost of an item of property, plant and equipment is recognised as an asset if, and only if, it is probable that future economic benefits associated with the item will flow to the Group and the cost of the item can be measured reliably.
NOTES TO THE FINANCIAL STATEMENTSFor the financial year ended 31 December 2017
64 OUR BUSINESS PLATFORMS OUR GROWTH DRIVERS
2. SUMMARY OF SIGNIFICANT ACCOUNTING POLICIES (CONT’D)
2.9 Property, plant and equipment (cont’d)
Subsequent to recognition, property, plant and equipment other than land and buildings are measured at cost less accumulated depreciation and any accumulated impairment losses. When significant parts of property, plant and equipment are required to be replaced in intervals, the Group recognises such parts as individual assets with specific useful lives and depreciation, respectively. Likewise, when a major inspection is performed, its cost is recognised in the carrying amount of the plant and equipment as a replacement if the recognition criteria are satisfied. All other repair and maintenance costs are recognised in profit or loss as incurred.
Land and buildings are measured at fair value less accumulated depreciation and impairment losses recognised after the date of the revaluation. Valuations are performed with sufficient regularity to ensure that the carrying amount does not differ materially from the fair value of the land and buildings at the end of the reporting period.
Any revaluation surplus is recognised in other comprehensive income and accumulated in equity under the asset revaluation reserve, except to the extent that it reverses a revaluation decrease of the same asset previously recognised in profit or loss, in which case the increase is recognised in profit or loss. A revaluation deficit is recognised in profit or loss, except to the extent that it offsets an existing surplus on the same asset carried in the asset revaluation reserve.
Any accumulated depreciation as at the revaluation date is eliminated against the gross carrying amount of the asset and the net amount is restated to the revalued amount of the asset. The revaluation surplus included in the asset revaluation reserve in respect of an asset is transferred directly to retained earnings on retirement or disposal of the asset.
An item of property, plant and equipment is derecognised upon disposal or when no future economic benefits are expected from its use or disposal. Any gain or loss on derecognition of the asset is included in the profit or loss in the year the asset is derecognised.
2.10 Depreciation and residual values
In the tin mining subsidiaries, plant and equipment used in mining are depreciated using the unit-of-production method based on economically recoverable ore reserves and resources over the estimated useful lives of the assets. Changes in the estimated economically recoverable ore reserves and resources and useful lives of plant and equipment are accounted for on a prospective basis.
Freehold land has an unlimited useful life and therefore is not depreciated. Depreciation for the remaining assets of the Group is provided on the straight-line method to write off the cost or valuation of relevant assets to their residual values, if any, over their estimated useful lives or life of the mine where appropriate, whichever is shorter. The estimated useful lives for these remaining assets are as follows:
Leasehold land – remaining lease term of 6 to 95 yearsBuildings – 8 to 40 yearsPlant, equipment and vehicles – 3 to 40 yearsFurniture – 3 to 10 yearsMine restoration – 15 years, or remaining life of mine, whichever is shorter
Capital work-in-progress included in property, plant and equipment are not depreciated as these assets are not yet available for use.
The carrying values of property, plant and equipment are reviewed for impairment when events or changes in circumstances indicate that the carrying value may not be recoverable.
The residual value, useful life and depreciation method are reviewed at each financial year-end and adjusted prospectively, if appropriate.
NOTES TO THE FINANCIAL STATEMENTSFor the financial year ended 31 December 2017
65THE STRAITS TRADING COMPANY LIMITEDANNUAL REPORT 2017
2. SUMMARY OF SIGNIFICANT ACCOUNTING POLICIES (CONT’D)
2.11 Investment properties
Investment properties are properties that are either owned by the Group or leased under a finance lease that are held to earn rentals or for capital appreciation, or both, rather than for use in the production or supply of goods or services, or for administrative purposes, or in the ordinary course of business. Investment properties comprise completed investment properties and properties that are being constructed or developed for future use as investment properties. Properties held under operating leases are classified as investment properties when the definition of investment properties is met.
Investment properties are initially measured at cost, including transaction costs. Subsequent to initial recognition, investment properties are measured at fair value. Gains or losses arising from changes in the fair values of investment properties are included in profit or loss in the year in which they arise.
Investment properties are derecognised when either they have been disposed of or when the investment property is permanently withdrawn from use and no future economic benefit is expected from its disposal. Any gain or loss on the retirement or disposal of an investment property is recognised in profit or loss in the year of retirement or disposal.
For properties that are being redeveloped for continued future use as investment properties, they are stated at fair values and the associated redevelopment expenditures are stated at cost until redevelopment is completed.
2.12 Intangible assets
Intangible assets acquired separately are measured initially at cost. Following initial acquisition, intangible assets are carried at cost less any accumulated amortisation and any accumulated impairment losses. Internally generated intangible assets, excluding capitalised development costs, are not capitalised and expenditure is reflected in profit or loss in the year in which the expenditure is incurred.
The useful lives of intangible assets are assessed as either finite or indefinite.
Intangible assets with finite useful lives are amortised over the estimated useful lives and assessed for impairment whenever there is an indication that the intangible asset may be impaired. The amortisation period and the amortisation method are reviewed at least at each financial year-end. Changes in the expected useful life or the expected pattern of consumption of future economic benefits embodied in the asset is accounted for by changing the amortisation period or method, as appropriate, and are treated as changes in accounting estimates.
Intangible assets with indefinite useful lives or not yet available for use are tested for impairment annually, or more frequently if the events and circumstances indicate that the carrying value may be impaired either individually or at the cash-generating unit level. Such intangible assets are not amortised. The useful life of an intangible asset with an indefinite useful life is reviewed annually to determine whether the useful life assessment continues to be supportable. If not, the change in useful life from indefinite to finite is made on a prospective basis.
Gains or losses arising from derecognition of an intangible asset are measured as the difference between the net disposal proceeds and the carrying amount of the asset and are recognised in profit or loss when the asset is derecognised.
(a) Mining rights
Mining rights acquired are stated at their fair values as at the date of acquisition. Following initial recognition, mining rights are carried at cost less accumulated amortisation and impairment losses, if any. Mining rights are amortised based on the unit-of-production method so as to write off the mining rights in proportion to the depletion of the estimated economically recoverable ore reserves and resources. Changes in the estimated economically recoverable ore reserves and resources are accounted for on a prospective basis from the beginning of the year in which the change arises. The amortisation period and the amortisation method are reviewed at least at each financial year-end.
NOTES TO THE FINANCIAL STATEMENTSFor the financial year ended 31 December 2017
66 OUR BUSINESS PLATFORMS OUR GROWTH DRIVERS

2. SUMMARY OF SIGNIFICANT ACCOUNTING POLICIES (CONT’D)
2.12 Intangible assets (cont’d)
(b) Deferred mine exploration and evaluation expenditure
Exploration and evaluation activity involves the search for mineral resources, the determination of technical feasibility and the assessment of commercial viability of an identified resource.
Exploration and evaluation activity includes:
‒ Researching and analysing historical exploration data‒ Gathering exploration data through geophysical studies‒ Exploratory drilling and sampling‒ Determining and examining the volume and grade of the resource‒ Surveying transportation and infrastructure requirements‒ Conducting market and finance studies
Licence costs paid in connection with a right to explore in an existing exploration area are capitalised and amortised based on the unit-of-production method.
Mine exploration and evaluation expenditures incurred for a new area of interest are accumulated in respect of each identifiable area of interest. These costs are only carried forward to the extent that they are expected to be recouped through the successful development of the area or where activities in the area have not yet reached a stage that permits a reasonable assessment of the existence of economically recoverable ore reserves and resources. These costs also include directly attributable employee remuneration, materials used and overhead costs.
Once an economically mineable resource for an area of interest is established and development is sanctioned, such exploration and evaluation expenditure is transferred to mine properties. No amortisation is charged during the exploration and evaluation phase.
A review is carried out annually on the carrying amount of deferred mine exploration and evaluation expenditure to determine whether there is any indication of impairment. Any impairment loss is recognised as an expense in profit or loss.
(c) Mine properties
Mine properties are stated at cost less accumulated amortisation and accumulated impairment losses, if any.
All expenditures incurred in connection with development activities in respect of each mine property, which includes all activities conducted in the preparation of economically recoverable ore reserves and resources until commercial production are accumulated in respect of each mine property. Exploration and evaluation expenditure is also transferred to mine properties once the work completed to date for the area supports the future development of the property and such development received appropriate approvals. These costs are only deferred to the extent that they are expected to be recouped through the successful development of the area.
Waste removal (stripping) costs incurred during the production phase of a surface mine (production stripping costs) are only capitalised to mine property expenditure when all the following criteria are met:-
(i) It is probable that the future economic benefits (improved access to an ore body) associated with the stripping activity will flow to the entity;
(ii) The entity can identify the component of an ore body for which access has been improved; and(iii) The costs relating to the improved access to that component can be measured reliably.
Expenditure for a mine property which is considered to provide minimal benefit to future periods is recognised as an expense in profit or loss.
NOTES TO THE FINANCIAL STATEMENTSFor the financial year ended 31 December 2017
67THE STRAITS TRADING COMPANY LIMITEDANNUAL REPORT 2017
2. SUMMARY OF SIGNIFICANT ACCOUNTING POLICIES (CONT’D)
2.12 Intangible assets (cont’d)
(c) Mine properties (cont’d)
When production for a mine property commences, the accumulated cost for the mine property is amortised based on the unit-of-production method so as to write off the expenditure in proportion to the depletion of the estimated economically recoverable ore reserves and resources. Changes in the estimated economically recoverable ore reserves and resources are accounted for on a prospective basis.
A review is carried out annually on the carrying amount of a mine property to determine whether there is any indication of impairment. Any impairment loss is recognised as an expense in profit or loss.
(d) Mine restoration expenditure
Restoration expenditure incurred during the production phase of operations is recognised in profit or loss as part of the cost of production of the mine property concerned.
Significant mine restoration expenditure to be incurred subsequent to the cessation of production of each mine property is provided based on the present value of the estimated expenditure to be incurred.
(e) Club memberships
Club memberships acquired separately are amortised on a straight-line basis over their finite useful lives.
2.13 Financial instruments
(a) Financial assets
(i) Initial recognition and measurement
Financial assets are recognised when, and only when the Group becomes a party to the contractual provisions of the instruments.
When financial assets are recognised initially, they are measured at fair value plus, in the case of financial assets not at fair value through profit or loss, transaction costs that are directly attributable to the acquisition of the financial assets. Transaction costs of financial assets carried at fair value through profit or loss are expensed in profit or loss.
Trade receivables are measured at the amount of consideration to which the Group expects to be entitled in exchange for transferring promised goods or services to a customer, excluding amounts collected on behalf of third party if the trade receivables do not contain a significant financing component at initial recognition.
(ii) Subsequent measurement
Debt instruments
Subsequent measurement of debt instruments depends on the Group’s business model for managing the asset and the contractual cash flow characteristics of the asset.
Debt instruments measured at amortised cost
Financial assets that are held for the collection of contractual cash flows where those cash flows represent solely payments of principal and interest are measured at amortised cost. Financial assets are measured at amortised cost using the effective interest method, less impairment. Gains and losses are recognised in profit or loss when the assets are derecognised or impaired, and through amortisation process.
NOTES TO THE FINANCIAL STATEMENTSFor the financial year ended 31 December 2017
68 OUR BUSINESS PLATFORMS OUR GROWTH DRIVERS

2. SUMMARY OF SIGNIFICANT ACCOUNTING POLICIES (CONT’D)
2.13 Financial instruments (cont’d)
(a) Financial assets (cont’d)
(ii) Subsequent measurement (cont’d)
Equity instruments
The Group subsequently measures all equity instruments at fair value. On initial recognition of an equity instruments that is not held for trading, the Group may irrevocably elect to present subsequent changes in fair value in other comprehensive income (“OCI”). Dividends from such investments are to be recognised in profit or loss when the Group’s right to receive payments is established.
Equity securities that are held-for-trading are classified as financial assets at fair value through profit or loss. Changes in fair value of financial assets at fair value through profit or loss are recognised in profit or loss.
Changes in fair value of financial assets at FVOCI are recognised in OCI.
Derivatives
Derivatives are initially recognised at fair value on the date a derivative contract is entered into and are subsequently remeasured to their fair value at the end of each reporting period. Changes in fair value of derivatives are recognised in profit or loss.
(iii) Impairment
The Group assesses on a forward looking basis the expected credit losses (“ECL”) associated with its debt instrument assets carried at amortised cost and FVOCI.
For trade receivables only, the Group measures the loss allowance at an amount equal to the lifetime expected credit losses.
(iv) Derecognition
A financial asset is derecognised where the contractual right to receive cash flows from the asset has expired. On derecognition of a financial asset in its entirety, the difference between the carrying amount and the sum of the consideration received for financial instrument is recognised in profit or loss.
(b) Financial liabilities
(i) Initial recognition and measurement
Financial liabilities are recognised when, and only when, the Group becomes a party to the contractual provisions of the financial instruments. The Group determines the classification of its financial liabilities at initial recognition.
All financial liabilities are recognised initially at fair value plus, in the case of financial liabilities not at fair value through profit or loss, directly attributable transaction costs.
NOTES TO THE FINANCIAL STATEMENTSFor the financial year ended 31 December 2017
69THE STRAITS TRADING COMPANY LIMITEDANNUAL REPORT 2017

2. SUMMARY OF SIGNIFICANT ACCOUNTING POLICIES (CONT’D)
2.13 Financial instruments (cont’d)
(b) Financial liabilities (cont’d)
(ii) Subsequent measurement
After initial recognition, financial liabilities that are not carried at fair value through profit or loss are subsequently measured at amortised cost using the effective interest method. Gains and losses are recognised in profit or loss when the liabilities are derecognised, and through the amortisation process.
(iii) Derecognition
A financial liability is derecognised when the obligation under the liability is discharged or cancelled or expires. When an existing financial liability is replaced by another from the same lender on substantially different terms, or the terms of an existing liability are substantially modified, such an exchange or modification is treated as a derecognition of the original liability and the recognition of a new liability, and the difference in the respective carrying amounts is recognised in profit or loss.
2.14 Financial guarantee
A financial guarantee contract is a contract that requires the issuer to make specified payments to reimburse the holder for a loss it incurs because a specified debtor fails to make payment when due in accordance with the terms of a debt instrument.
Financial guarantees are recognised initially as a liability at fair value, adjusted for transaction costs that are directly attributable to the issuance of the guarantee. Subsequent to initial recognition, financial guarantees are measured at the higher of the amount of the loss allowance determined in accordance with the impairment model under FRS 109 and the amount initially recognised less, when appropriate, the cumulative amount of income recognised.
2.15 Base inventory
Base inventory is the base recirculating inventory in the smelting process.
2.16 Non-current assets held for sale
Non-current assets and disposal group classified as held for sale are measured at the lower of their carrying amount and fair value less costs to sell. Non-current assets and disposal group are classified as held for sale if their carrying amounts will be recovered principally through a sale transaction rather than through continuing use. A component of the Group is classified as a “discontinued operation” when the criteria to be classified as held for sale have been met or it has been disposed of and such a component represents a separate major line of business or geographical area of operations or is part of a single coordinated plan to dispose of a separate major line of business or geographical area of operations.
Property, plant and equipment and intangible assets once classified as held for sale are not depreciated or amortised.
2.17 Inventories
Inventories are stated at the lower of cost and net realisable value.
Cost of trading inventory of refined tin metal is determined on a first-in first-out basis. Cost of inventories of tin-in-concentrates and tin-in-process which have matching sales contract for refined tin metal from tin smelting operations, are stated at the value of such contract less cost for conversion. This value is consistent with cost, as it is the practice of tin smelting operations of the subsidiary to buy tin-in-concentrates and sell refined tin metal on a back to back price basis. Cost of tin inventories which has no matching sales contract is calculated using the weighted average cost method less allowance for conversion.
Absorption costing is used in the mining operations to assign costs to tin inventories using the weighted average cost method which includes both variable and fixed overhead cost components.
NOTES TO THE FINANCIAL STATEMENTSFor the financial year ended 31 December 2017
70 OUR BUSINESS PLATFORMS OUR GROWTH DRIVERS

2. SUMMARY OF SIGNIFICANT ACCOUNTING POLICIES (CONT’D)
2.17 Inventories (cont’d)
Cost of other inventories comprising stores, spares, fuels, coal and saleable by-products is determined on the weighted average cost method.
Where necessary, allowance is provided for damaged, obsolete and slow moving items to adjust the carrying value of inventories to the lower of cost and net realisable value.
Net realisable value is the estimated selling price in the ordinary course of business, less estimated costs of completion and the estimated costs necessary to make the sale.
2.18 Cash and cash equivalents
Cash and cash equivalents comprise cash at bank and on hand, short-term deposits that are readily convertible to cash and which are subject to an insignificant risk of changes in value. These also include bank overdrafts that form an integral part of the Group’s cash management.
2.19 Impairment of non-financial assets
An assessment is made at each reporting date to determine whether there is an indication that an asset may be impaired. If any indication exists, or when annual impairment testing for an asset is required, the estimated recoverable amount of that asset is determined.
Where the carrying amount of an asset or cash-generating unit exceeds its recoverable amount, the asset is considered impaired and is written down to its recoverable amount. Impairment losses of continuing operations are recognised in the profit or loss except for assets that are previously revalued where the revaluation was taken to other comprehensive income. In this case, the impairment is also recognised in other comprehensive income up to the amount of any previous revaluation.
Calculation of recoverable amount
An asset’s recoverable amount is the higher of an asset’s or cash-generating unit’s fair value less costs of disposal and its value in use and is determined for an individual asset. If the asset does not generate cash inflows that are largely independent of those from other assets or groups of assets, the recoverable amount is determined for the cash-generating unit to which the asset belongs to. In assessing value in use, the estimated future cash flows expected to be generated by the asset are discounted to their present value using a pre-tax discount rate that reflects current market assessments of the time value of money and the risks specific to the asset. In determining fair value less costs of disposal, recent market transactions are taken into account, if available. If no such transactions can be identified, an appropriate valuation model is used.
The Group bases its impairment calculation on detailed budgets and forecast calculations which are prepared separately for each of the Group’s cash-generating units to which the individual assets are allocated. These budgets and forecast calculations generally cover a period of five years. For longer periods, a long-term growth rate is calculated and applied to project future cash flows after the fifth year.
Reversal of impairment
For assets excluding goodwill, an assessment is made at each reporting date as to whether there is any indication that previously recognised impairment losses may no longer exist or may have decreased. If such indication exists, the Group estimates the asset’s or cash-generating unit’s recoverable amount. A previously recognised impairment loss is reversed only if there has been a change in the estimates used to determine the asset’s recoverable amount since the last impairment loss was recognised. If that is the case, the carrying amount of the asset is increased to its recoverable amount. That increase cannot exceed the carrying amount that would have been determined, net of depreciation, had no impairment loss been recognised previously. Such reversal is recognised in profit or loss unless the asset is measured at revalued amount, in which case the reversal is treated as a revaluation increase.
NOTES TO THE FINANCIAL STATEMENTSFor the financial year ended 31 December 2017
71THE STRAITS TRADING COMPANY LIMITEDANNUAL REPORT 2017
2. SUMMARY OF SIGNIFICANT ACCOUNTING POLICIES (CONT’D)
2.20 Borrowing costs
Borrowing costs are capitalised as part of the cost of a qualifying asset if they are directly attributable to the acquisition, construction or production of that asset. Capitalisation of borrowing costs commences when the activities to prepare the asset for its intended use or sale are in progress and the expenditures and borrowing costs are incurred. Borrowing costs are capitalised until the assets are substantially completed for their intended use or sale. All other borrowing costs are expensed in the period they occur. Borrowing costs consist of interest and other costs that an entity incurs in connection with the borrowing of funds.
2.21 Provisions
Provisions are recognised when the Group has a present obligation (legal or constructive) as a result of a past event, it is probable that an outflow of resources embodying economic benefits will be required to settle the obligation and the amount of obligation can be estimated reliably.
Provisions are reviewed at the end of each reporting period and adjusted to reflect the current best estimate. If it is no longer probable that an outflow of economic resources will be required to settle the obligation, the provision is reversed.
If the effect of the time value of money is material, provisions are discounted using a current pre-tax rate that reflects, where appropriate, the risks specific to the liability. When discounting is used, the increase in the provision due to the passage of time is recognised as a finance cost.
2.22 Employee benefits
(a) Defined contribution plan
The Group participates in the national pension schemes as defined by the laws of the countries in which it has operations. In particular, the Singapore companies in the Group make contributions to the Central Provident Fund scheme in Singapore, a defined contribution pension scheme. Contributions to defined contribution pension schemes are recognised as an expense in the period in which the related service is performed.
(b) Employee leave entitlement
Employee entitlements to annual leave are recognised as a liability when they are accrued to the employees. The estimated liability for leave is recognised for services rendered by employees up to the end of the reporting period.
(c) Termination benefits
Termination benefits are payable when employment is terminated before the normal retirement date or whenever an employee accepts voluntary redundancy in exchange for these benefits. Termination benefits are recognised when commitment is demonstrated to either terminate the employment of current employees according to a detailed plan without possibility of withdrawal; or providing termination benefits as a result of an offer made to encourage voluntary redundancy. In the case of an offer made to encourage voluntary redundancy, the measurement of termination benefits is based on the number of employees expected to accept the offer. Benefits falling due more than 12 months after the reporting date are discounted to present value.
2.23 Leases
(a) Where the group is the lessee
Leases where the lessor effectively retains substantially all the risks and benefits of ownership of the leased item are classified as operating leases. Operating lease payments (net of any incentives received from the lessor) are recognised as an expense in profit or loss on a straight-line basis over the lease term. Contingent rents, if any, are recognised as expenses in profit or loss in the periods in which they are incurred.
NOTES TO THE FINANCIAL STATEMENTSFor the financial year ended 31 December 2017
72 OUR BUSINESS PLATFORMS OUR GROWTH DRIVERS
2. SUMMARY OF SIGNIFICANT ACCOUNTING POLICIES (CONT’D)
2.23 Leases (cont’d)
(b) Where the group is the lessor
Leases in which the Group does not transfer substantially all the risks and rewards of ownership of the asset are classified as operating leases.
Assets leased out under operating leases are included in property, plant and equipment and investment properties.
Rental income from operating leases (net of any incentives given to lessees) is recognised in profit or loss on a straight-line basis over the lease term.
Initial direct costs incurred by the Group in negotiating and arranging an operating lease are added to the carrying amount of the leased asset and recognised as an expense in profit or loss over the lease term on the same basis as rental income.
Contingent rents are recognised as income in profit or loss in the periods in which they are earned.
2.24 Income recognition
Revenue is recognised to the extent that it is probable that the economic benefits will flow to the Group and the revenue can be reliably measured, regardless of when the payment is made. Revenue is measured at the fair value of consideration received or receivable, taking into account contractually defined terms of payment and excluding discounts, rebates, taxes or duties. The Group assesses its revenue arrangements to determine if it is acting as principal or agent.
Interest income is recognised as interest accrues (using the effective interest method) unless collectibility is in doubt.
Revenue from sale and delivery of refined tin metal and by-products is recognised upon transfer of significant risks and rewards of ownership to the buyer. Revenue is not recognised to the extent where there are significant uncertainties regarding recovery of the consideration due, associated costs or the possible return of goods.
Revenue from other service charges are recognised upon performance of services.
Rental income arising from operating leases on investment properties is accounted for on a straight-line basis over the lease terms. The aggregate costs of incentives provided to lessees are recognised as a reduction of rental income over the lease term on a straight-line basis.
Profits from sale of investment securities are recognised upon conclusion of the contract for sale.
Profits from sale of completed properties are recognised when the significant risks and rewards of ownership of the properties have been transferred to the buyer.
Dividend income from investments is recognised when the Group’s right to receive payment is established.
NOTES TO THE FINANCIAL STATEMENTSFor the financial year ended 31 December 2017
73THE STRAITS TRADING COMPANY LIMITEDANNUAL REPORT 2017
2. SUMMARY OF SIGNIFICANT ACCOUNTING POLICIES (CONT’D)
2.25 Taxes
(a) Current income tax
Current income tax assets and liabilities for the current and prior periods are measured at the amount expected to be recovered from or paid to the taxation authorities. The tax rates and tax laws used to compute the amount are those that are enacted or substantively enacted at the end of the reporting period, in the countries where the Group operates and generates taxable income.
Current income taxes are recognised in profit or loss except to the extent that the tax relates to items recognised outside profit or loss, either in other comprehensive income or directly in equity. Management periodically evaluates positions taken in the tax returns with respect to situations in which applicable tax regulations are subject to interpretation and establishes provisions where appropriate.
(b) Deferred tax
Deferred tax is provided using the liability method on temporary differences at the end of the reporting period between the tax bases of assets and liabilities and their carrying amounts for financial reporting purposes.
Deferred tax liabilities are recognised for all temporary differences, except:
‒ Where the deferred tax liability arises from the initial recognition of goodwill or of an asset or liability in a transaction that is not a business combination and, at the time of the transaction, affects neither the accounting profit nor taxable profit or loss; and
‒ In respect of taxable temporary differences associated with investments in subsidiaries, associates and joint ventures, where the timing of the reversal of the temporary differences can be controlled and it is probable that the temporary differences will not reverse in the foreseeable future.
Deferred tax assets are recognised for all deductible temporary differences, carry forward of unused tax credits and unused tax losses, to the extent that it is probable that taxable profit will be available against which the deductible temporary differences and the carry forward of unused tax credits and unused tax losses can be utilised except:
‒ Where the deferred tax asset relating to the deductible temporary difference arises from the initial recognition of an asset or liability in a transaction that is not a business combination and, at the time of the transaction, affects neither the accounting profit nor taxable profit or loss; and
‒ In respect of deductible temporary differences associated with investments in subsidiaries, associates and joint ventures, deferred tax assets are recognised only to the extent that it is probable that the temporary differences will reverse in the foreseeable future and taxable profit will be available against which the temporary differences can be utilised.
The carrying amount of deferred tax assets is reviewed at the end of each reporting period and reduced to the extent that it is no longer probable that sufficient taxable profit will be available to allow all or part of the deferred tax asset to be utilised. Unrecognised deferred tax assets are reassessed at the end of each reporting period and are recognised to the extent that it has become probable that future taxable profit will allow the deferred tax asset to be recovered.
Deferred tax assets and liabilities are measured at the tax rates that are expected to apply in the year when the asset is realised or the liability is settled, based on tax rates (and tax laws) that have been enacted or substantively enacted at the end of each reporting period.
Deferred tax relating to items recognised outside profit or loss is recognised outside profit or loss. Deferred tax items are recognised in correlation to the underlying transaction either in other comprehensive income or directly in equity and deferred tax arising from a business combination is adjusted against goodwill on acquisition.
NOTES TO THE FINANCIAL STATEMENTSFor the financial year ended 31 December 2017
74 OUR BUSINESS PLATFORMS OUR GROWTH DRIVERS
2. SUMMARY OF SIGNIFICANT ACCOUNTING POLICIES (CONT’D)
2.25 Taxes (cont’d)
(b) Deferred tax (cont’d)
Deferred tax assets and deferred tax liabilities are offset, if a legally enforceable right exists to set off current income tax assets against current income tax liabilities and the deferred taxes relate to the same taxable entity and the same taxation authority.
Tax benefits acquired as part of a business combination, but not satisfying the criteria for separate recognition at that date, would be recognised subsequently if new information about facts and circumstances changed. The adjustment would either be treated as a reduction to goodwill (as long as it does not exceed goodwill) if it is incurred during the measurement period or in profit or loss.
(c) Goods and services tax
Revenues, expenses and assets are recognised net of the amount of goods and services tax except:
‒ Where the goods and services tax incurred on a purchase of assets or services is not recoverable from the taxation authority, in which case the goods and services tax is recognised as part of the cost of acquisition of the asset or as part of the expense item as applicable; and
‒ Receivables and payables that are stated with the amount of goods and services tax included.
The net amount of goods and services tax recoverable from, or payable to, the taxation authority is included as part of receivables or payables in the balance sheet.
2.26 Derivative financial instruments and hedging
Initial recognition and subsequent measurement
The Group has chosen to continue to apply the existing hedge accounting requirements in FRS 39 as its policy choice on initial adoption of FRS 109.
The Group uses derivative financial instruments such as forward currency contracts, interest rate swaps and forward commodity contracts, to manage their foreign currency risks, interest rate risks and commodity price risks respectively. Such derivative financial instruments are initially recognised at fair value on the date on which a derivative contract is entered into and are subsequently remeasured at fair value. Derivatives are carried as financial assets when the fair value is positive and as financial liabilities when the fair value is negative.
Any gains or losses arising from changes in the fair value of derivatives are taken directly to profit or loss, except for the effective portion of cash flow hedges, which is recognised in other comprehensive income.
For the purpose of hedge accounting, hedges are classified as:
‒ Fair value hedges when hedging the exposure to changes in the fair value of a recognised asset or liability or an unrecognised firm commitment
‒ Cash flow hedges when hedging the exposure to variability in cash flows that is either attributable to a particular risk associated with a recognised asset or liability or a highly probable forecast transaction or the foreign currency risk in an unrecognised firm commitment
‒ Hedges of a net investment in a foreign operation
NOTES TO THE FINANCIAL STATEMENTSFor the financial year ended 31 December 2017
75THE STRAITS TRADING COMPANY LIMITEDANNUAL REPORT 2017
2. SUMMARY OF SIGNIFICANT ACCOUNTING POLICIES (CONT’D)
2.26 Derivative financial instruments and hedging (cont’d)
Initial recognition and subsequent measurement (cont’d)
At the inception of a hedge relationship, the Group formally designate and document the hedge relationship to which the Group wishes to apply hedge accounting and the risk management objective and strategy for undertaking the hedge. The documentation includes identification of the hedging instrument, the hedged item or transaction, the nature of the risk being hedged and how the entity will assess the effectiveness of changes in the hedging instrument’s fair value in offsetting the exposure to changes in the hedged item’s fair value or cash flows attributable to the hedged risk. Such hedges are expected to be highly effective in achieving offsetting changes in fair value or cash flows and are assessed on an ongoing basis to determine that they actually have been highly effective throughout the financial reporting periods for which they were designated.
Hedge accounting will be discontinued in a situation where a derivative, which has been designated as a hedging instrument, is novated to effect clearing within a central counterparty as a result of laws or regulation, if specific conditions are met (in this context, a novation indicates that parties to a contract agree or replace their original counterparty with a new one). Any change to the fair value of the derivative designated as a hedging instrument arising from the novation should be included in the assessment and measure of hedge effectiveness with retrospective application.
Hedges that meet the strict criteria for hedge accounting are accounted for as described below:
(a) Fair value hedges
The change in the fair value of a hedging derivative is recognised in profit or loss. The change in the fair value of the hedged item attributable to the risk hedged is recorded as part of the carrying value of the hedged item and is also recognised in profit or loss.
For fair value hedges relating to items carried at amortised cost, any adjustment to carrying value is amortised through profit or loss over the remaining term of the hedge using the effective interest rate method. Effective interest rate amortisation may begin as soon as an adjustment exists and no later than when the hedged item ceases to be adjusted for changes in its fair value attributable to the risk being hedged.
If the hedge item is derecognised, the unamortised fair value is recognised immediately in profit or loss.
When an unrecognised firm commitment is designated as a hedged item, the subsequent cumulative change in the fair value of the firm commitment attributable to the hedged risk is recognised as an asset or liability with a corresponding gain or loss recognised in profit or loss.
(b) Cash flow hedges
The effective portion of the gain or loss on the hedging instrument is recognised directly in other comprehensive income in the hedging reserve, while any ineffective portion is recognised immediately in profit or loss.
The Group uses forward currency contracts as hedges of its exposure to foreign currency risk in forecasted transactions and firm commitments, as well as forward commodity contracts for its exposure to volatility in the commodity prices. The ineffective portion relating to foreign currency contracts and the ineffective portion relating to commodity contracts is recognised in profit or loss.
Amounts recognised as other comprehensive income are transferred to profit or loss when the hedged transaction affects profit or loss, such as when the hedged interest income or interest expense is recognised or when a forecast sale or purchase occurs. When the hedged item is the cost of a non-financial asset or non-financial liability, the amounts recognised as other comprehensive income are transferred to the initial carrying amount of the non-financial asset or liability.
NOTES TO THE FINANCIAL STATEMENTSFor the financial year ended 31 December 2017
76 OUR BUSINESS PLATFORMS OUR GROWTH DRIVERS
2. SUMMARY OF SIGNIFICANT ACCOUNTING POLICIES (CONT’D)
2.26 Derivative financial instruments and hedging (cont’d)
Initial recognition and subsequent measurement (cont’d)
(b) Cash flow hedges (cont’d)
If the forecast transaction or firm commitment is no longer expected to occur, the cumulative gain or loss previously recognised in equity is transferred to profit or loss. If the hedging instrument expires or is sold, terminated or exercised without replacement or rollover, or if its designation as a hedge is revoked, any cumulative gain or loss previously recognised in other comprehensive income remains in other comprehensive income until the forecast transaction or firm commitment affects profit or loss.
(c) Hedges of a net investment
Hedges of a net investment in a foreign operation, including a hedge of a monetary item that is accounted for as part of the net investment, are accounted for in a way similar to cash flow hedges. Gains or losses on the hedging instrument relating to the effective portion of the hedge are recognised as other comprehensive income while any gains or losses relating to the ineffective portion are recognised in profit or loss. On disposal of the foreign operation, the cumulative value of any such gains or losses recorded in equity is transferred to profit or loss.
2.27 Contingencies
A contingent liability is:
(a) a possible obligation that arises from past events and whose existence will be confirmed only by the occurrence or non-occurrence of one or more uncertain future events not wholly within the control of the Group; or
(b) a present obligation that arises from past events but is not recognised because:
(i) It is not probable that an outflow of resources embodying economic benefits will be required to settle the obligation; or
(ii) The amount of the obligation cannot be measured with sufficient reliability.
A contingent asset is a possible asset that arises from past events and whose existence will be confirmed only by the occurrence or non-occurrence of one or more uncertain future events not wholly within the control of the Group.
Contingent liabilities and assets are not recognised on the balance sheet of the Group, except for contingent liabilities assumed in a business combination that are present obligations and which the fair values can be reliably determined.
3. SIGNIFICANT ACCOUNTING ESTIMATES AND JUDGEMENTS
The preparation of the Group’s consolidated financial statements requires management to make judgements, estimates and assumptions that affect the reported amounts of revenues, expenses, assets and liabilities, and the disclosure of contingent liabilities at the end of each reporting period. Uncertainty about these assumptions and estimates could result in outcomes that require a material adjustment to the carrying amount of the asset or liability affected in the future periods.
Judgements made by management in the application of accounting policies that have a significant effect on the financial statements and in arriving at estimates with a significant risk of material adjustment in the following year are discussed in note 40.
NOTES TO THE FINANCIAL STATEMENTSFor the financial year ended 31 December 2017
77THE STRAITS TRADING COMPANY LIMITEDANNUAL REPORT 2017

4. PROPERTY REVENUE
Group2017 2016$’000 $’000
Rental and related income 13,140 18,310Sale of development properties 336 –
13,476 18,310
5. DIVIDEND INCOME
Group2017 2016$’000 $’000
Dividend income from:– Investment securities at FVTPL 3,235 14,335– Investment securities at FVOCI 10,904 10,349
14,139 24,684
6. INTEREST INCOME
Group2017 2016$’000 $’000
Interest income from:– Financial assets at amortised cost 9,160 8,936– Deposits at amortised cost 2,332 1,903– Receivables from associates and joint ventures at amortised cost 6,273 1,387– Receivables at amortised cost 99 514
17,864 12,740
7. OTHER INCOME
Group2017 2016$’000 $’000
Net gain on disposal of investment properties 510 23,887Write back of provision (note 30) – 2,195Net gain/(loss) on disposal of subsidiaries, associates and joint ventures – Foreign exchange impact on capital reduction 2,803 1,727– Others (4,544) –Net loss on disposal of equity securities at FVTPL (1,726) (3,261)Net loss on disposal of derivatives at FVTPL (107) (2,183)Fair value changes in financial assets:– Held-for-trading equity securities at FVTPL 8,509 4,710– Derivatives at FVTPL 225 366– Ineffective portion of derivatives designated as hedging instruments in cash flow hedge (266) (177)Negative goodwill from acquisition of subsidiaries (note 18) 198 –Other operating income 5,879 5,568
11,481 32,832
NOTES TO THE FINANCIAL STATEMENTSFor the financial year ended 31 December 2017
78 OUR BUSINESS PLATFORMS OUR GROWTH DRIVERS
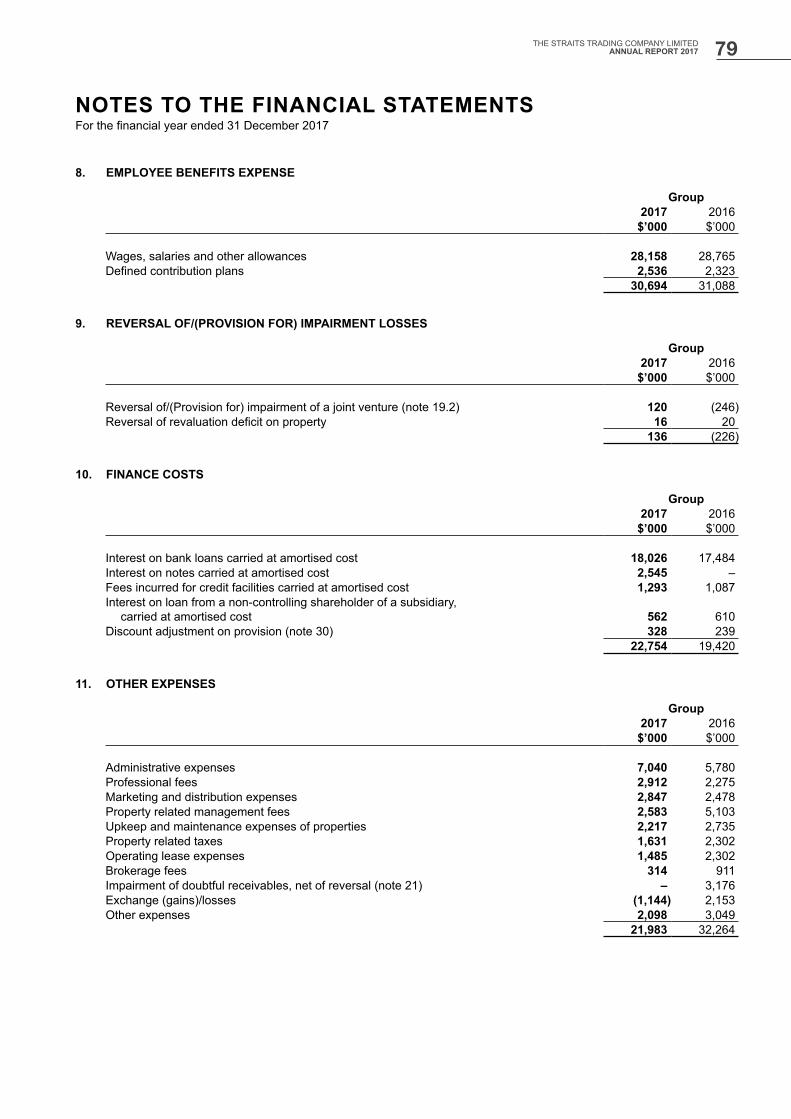
8. EMPLOYEE BENEFITS EXPENSE
Group2017 2016
$’000 $’000
Wages, salaries and other allowances 28,158 28,765Defined contribution plans 2,536 2,323
30,694 31,088
9. REVERSAL OF/(PROVISION FOR) IMPAIRMENT LOSSES
Group2017 2016
$’000 $’000
Reversal of/(Provision for) impairment of a joint venture (note 19.2) 120 (246)Reversal of revaluation deficit on property 16 20
136 (226)
10. FINANCE COSTS
Group2017 2016
$’000 $’000
Interest on bank loans carried at amortised cost 18,026 17,484Interest on notes carried at amortised cost 2,545 –Fees incurred for credit facilities carried at amortised cost 1,293 1,087Interest on loan from a non-controlling shareholder of a subsidiary, carried at amortised cost 562 610Discount adjustment on provision (note 30) 328 239
22,754 19,420
11. OTHER EXPENSES
Group2017 2016
$’000 $’000
Administrative expenses 7,040 5,780Professional fees 2,912 2,275Marketing and distribution expenses 2,847 2,478Property related management fees 2,583 5,103Upkeep and maintenance expenses of properties 2,217 2,735Property related taxes 1,631 2,302Operating lease expenses 1,485 2,302Brokerage fees 314 911Impairment of doubtful receivables, net of reversal (note 21) – 3,176Exchange (gains)/losses (1,144) 2,153Other expenses 2,098 3,049
21,983 32,264
NOTES TO THE FINANCIAL STATEMENTSFor the financial year ended 31 December 2017
79THE STRAITS TRADING COMPANY LIMITEDANNUAL REPORT 2017

12. PROFIT BEFORE TAX
Profit before tax is stated after charging/(crediting) the following:
Group2017 2016$’000 $’000
Audit fees paid/payable: (a) Auditor of the Company 416 438(b) Overseas affiliates of the auditor of the Company 319 305(c) Other auditors 38 29
Non-audit fees paid/payable: (a) Auditor of the Company 109 84(b) Overseas affiliates of the auditor of the Company 53 44(c) Other auditors 566 504
1,501 1,404
Gain on disposal of property, plant and equipment (49) (19)Property, plant and equipment written off 28 24
13. INCOME TAX EXPENSE
(a) Major components of income tax expense
The major components of income tax expense for the years ended 31 December 2017 and 2016 are:
Group2017 2016$’000 $’000
(i) Consolidated income statement:
Income tax – Current income tax 10,425 19,704 – (Over)/Under provision in respect of prior years (379) 485
– Benefits from previously unrecognised tax losses and unutilised capital allowances (370) (565)
9,676 19,624 Deferred tax – Originating and reversal of temporary differences (3,991) (1,584) – Under/(Over) provision in respect of prior years 193 (1,681) (note 20) (3,798) (3,265)
Income tax expense recognised in profit or loss 5,878 16,359
(ii) Statement of comprehensive income:
Deferred tax related to other comprehensive income – Net change on revaluation of property, plant and equipment 223 72 – Net change in hedging reserve for derivatives designated as
hedging instruments in cash flow hedges 170 571 – Net change in investment securities at FVOCI (185) 838
208 1,481
NOTES TO THE FINANCIAL STATEMENTSFor the financial year ended 31 December 2017
80 OUR BUSINESS PLATFORMS OUR GROWTH DRIVERS
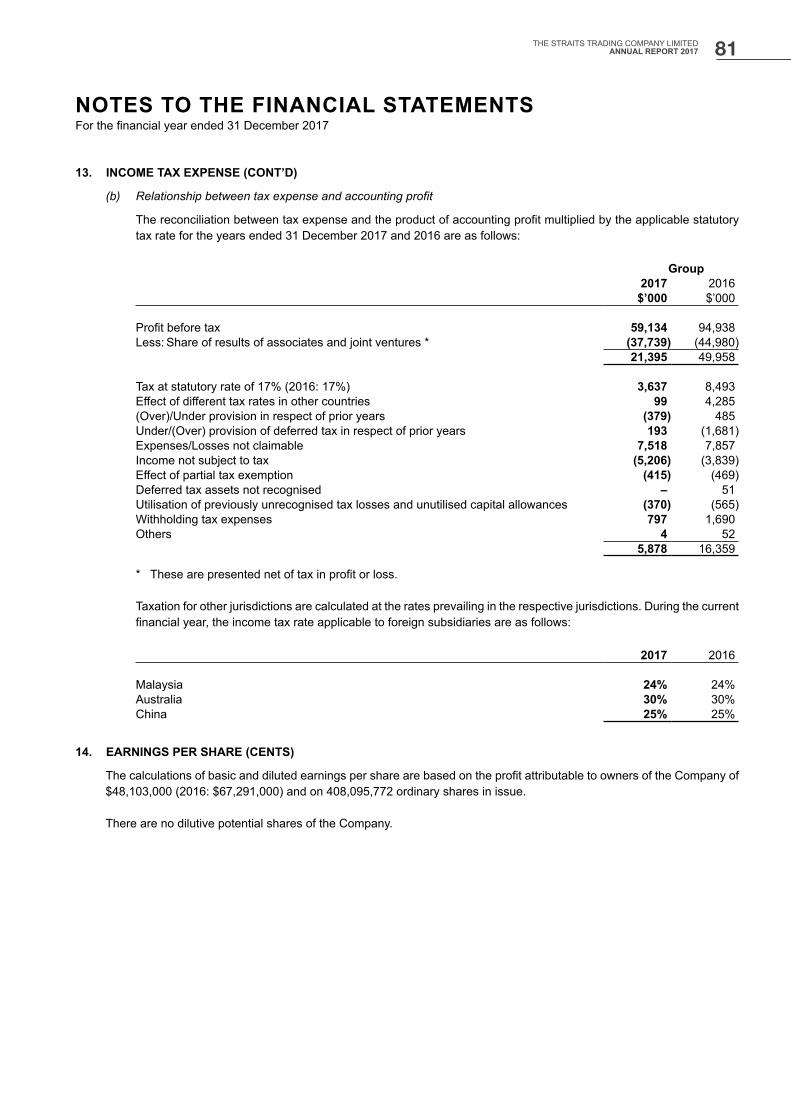
13. INCOME TAX EXPENSE (CONT’D)
(b) Relationship between tax expense and accounting profit
The reconciliation between tax expense and the product of accounting profit multiplied by the applicable statutory tax rate for the years ended 31 December 2017 and 2016 are as follows:
Group2017 2016
$’000 $’000
Profit before tax 59,134 94,938Less: Share of results of associates and joint ventures * (37,739) (44,980)
21,395 49,958
Tax at statutory rate of 17% (2016: 17%) 3,637 8,493Effect of different tax rates in other countries 99 4,285(Over)/Under provision in respect of prior years (379) 485Under/(Over) provision of deferred tax in respect of prior years 193 (1,681)Expenses/Losses not claimable 7,518 7,857Income not subject to tax (5,206) (3,839)Effect of partial tax exemption (415) (469)Deferred tax assets not recognised – 51Utilisation of previously unrecognised tax losses and unutilised capital allowances (370) (565)Withholding tax expenses 797 1,690Others 4 52
5,878 16,359
* These are presented net of tax in profit or loss.
Taxation for other jurisdictions are calculated at the rates prevailing in the respective jurisdictions. During the current financial year, the income tax rate applicable to foreign subsidiaries are as follows:
2017 2016
Malaysia 24% 24%Australia 30% 30%China 25% 25%
14. EARNINGS PER SHARE (CENTS)
The calculations of basic and diluted earnings per share are based on the profit attributable to owners of the Company of $48,103,000 (2016: $67,291,000) and on 408,095,772 ordinary shares in issue.
There are no dilutive potential shares of the Company.
NOTES TO THE FINANCIAL STATEMENTSFor the financial year ended 31 December 2017
81THE STRAITS TRADING COMPANY LIMITEDANNUAL REPORT 2017

15. PROPERTY, PLANT AND EQUIPMENT
Freehold land
Leasehold land Buildings
Plant, equipment,
vehicles and
furniture
Capital work-in-
progressMine
restoration Total$’000 $’000 $’000 $’000 $’000 $’000 $’000
At valuation
GroupAt cost or valuationAt 1 January 2017 9,761 8,212 9,472 40,659 512 7,966 76,582Additions – – 817 1,194 1,630 143 3,784Disposals – – – (790) – – (790)Transfer – – – 1,626 (1,626) – –Revaluation surplus, net 2,163 118 474 – – – 2,755Elimination of accumulated
depreciation on revaluation – (118) (609) – – – (727)
Exchange adjustment 201 162 193 712 31 152 1,451At 31 December 2017 12,125 8,374 10,347 43,401 547 8,261 83,055
Accumulated depreciationAt 1 January 2017 – – – 22,166 – 1,679 23,845Depreciation charge
for the year – 110 589 3,165 – 1,153 5,017Disposals – – – (423) – – (423)Elimination of accumulated
depreciation on revaluation – (118) (609) – – – (727)
Exchange adjustment – 8 20 465 – 62 555At 31 December 2017 – – – 25,373 – 2,894 28,267
Net carrying amountAt 31 December 2017 12,125 8,374 10,347 18,028 547 5,367 54,788
NOTES TO THE FINANCIAL STATEMENTSFor the financial year ended 31 December 2017
82 OUR BUSINESS PLATFORMS OUR GROWTH DRIVERS
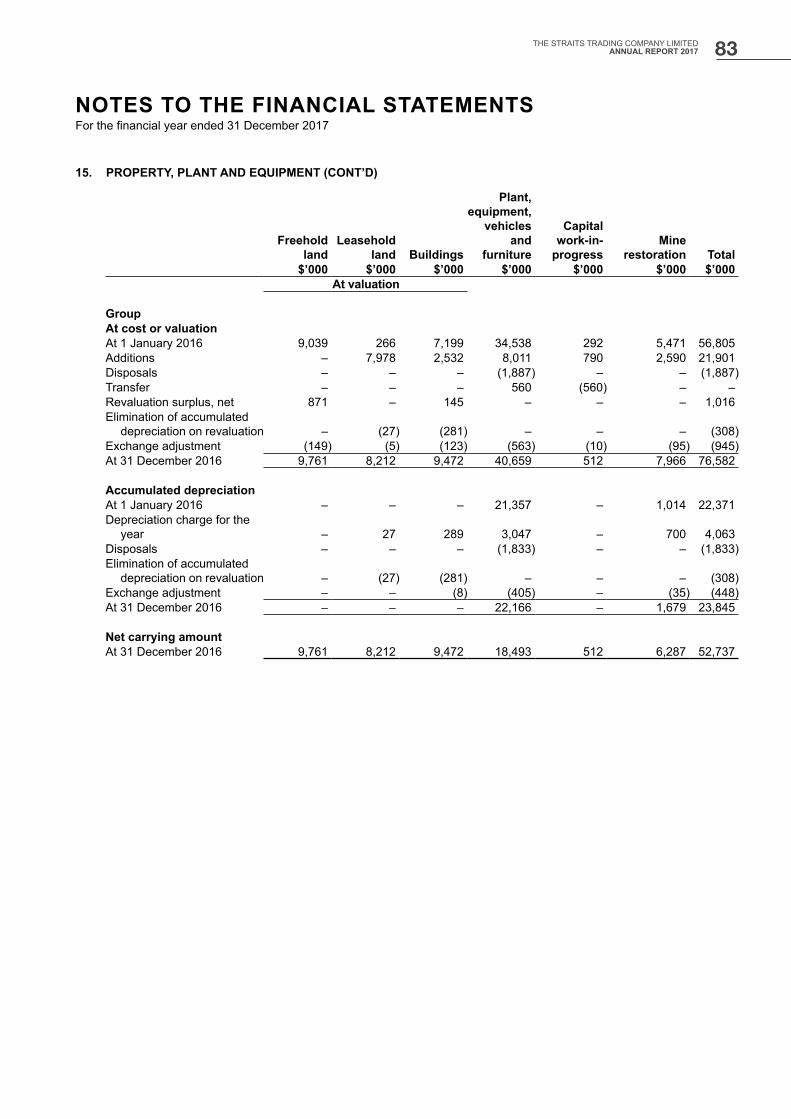
15. PROPERTY, PLANT AND EQUIPMENT (CONT’D)
Freehold land
Leasehold land Buildings
Plant, equipment,
vehicles and
furniture
Capital work-in-
progressMine
restoration Total$’000 $’000 $’000 $’000 $’000 $’000 $’000
At valuation
GroupAt cost or valuationAt 1 January 2016 9,039 266 7,199 34,538 292 5,471 56,805Additions – 7,978 2,532 8,011 790 2,590 21,901Disposals – – – (1,887) – – (1,887)Transfer – – – 560 (560) – –Revaluation surplus, net 871 – 145 – – – 1,016Elimination of accumulated
depreciation on revaluation – (27) (281) – – – (308)Exchange adjustment (149) (5) (123) (563) (10) (95) (945)At 31 December 2016 9,761 8,212 9,472 40,659 512 7,966 76,582
Accumulated depreciationAt 1 January 2016 – – – 21,357 – 1,014 22,371Depreciation charge for the
year – 27 289 3,047 – 700 4,063Disposals – – – (1,833) – – (1,833)Elimination of accumulated
depreciation on revaluation – (27) (281) – – – (308)Exchange adjustment – – (8) (405) – (35) (448)At 31 December 2016 – – – 22,166 – 1,679 23,845
Net carrying amountAt 31 December 2016 9,761 8,212 9,472 18,493 512 6,287 52,737
NOTES TO THE FINANCIAL STATEMENTSFor the financial year ended 31 December 2017
83THE STRAITS TRADING COMPANY LIMITEDANNUAL REPORT 2017

15. PROPERTY, PLANT AND EQUIPMENT (CONT’D)
Freehold land Buildings
Plant, equipment,
vehicles and
furniture Total$’000 $’000 $’000 $’000At valuation
CompanyAt cost or valuationAt 1 January 2017 29 81 219 329Additions – – 1 1Disposals – – (111) (111)Revaluation surplus/(deficit) 12 (1) – 11Elimination of accumulated depreciation on revaluation – (12) – (12)Exchange adjustment – 1 4 5At 31 December 2017 41 69 113 223
Accumulated depreciationAt 1 January 2017 – – 186 186Depreciation charge for the year – 12 8 20Disposals – – (85) (85)Elimination of accumulated depreciation on revaluation – (12) – (12)Exchange adjustment – – 2 2At 31 December 2017 – – 111 111
Net carrying amountAt 31 December 2017 41 69 2 112
At cost or valuationAt 1 January 2016 29 95 223 347Additions – – 1 1Revaluation deficit – (1) – (1)Elimination of accumulated depreciation on revaluation – (12) – (12)Exchange adjustment – (1) (5) (6)At 31 December 2016 29 81 219 329
Accumulated depreciationAt 1 January 2016 – – 173 173Depreciation charge for the year – 12 17 29Elimination of accumulated depreciation on revaluation – (12) – (12)Exchange adjustment – – (4) (4)At 31 December 2016 – – 186 186
Net carrying amountAt 31 December 2016 29 81 33 143
(a) Land and buildings are stated at fair value, which have been determined based on valuations at the end of the reporting period. Valuations are performed by accredited independent valuers with recent experience in the location and category of the properties being valued. Details of valuation techniques and inputs used are disclosed in note 41D.
NOTES TO THE FINANCIAL STATEMENTSFor the financial year ended 31 December 2017
84 OUR BUSINESS PLATFORMS OUR GROWTH DRIVERS

15. PROPERTY, PLANT AND EQUIPMENT (CONT’D)
(b) If the land and buildings stated at valuation are included in the financial statements using the cost model, the net carrying amounts would be:
Group Company2017 2016 2017 2016
$’000 $’000 $’000 $’000
Freehold land 4,513 4,429 1 1Leasehold land 8,375 8,212 – –Buildings 7,222 6,607 – –
(c) Details of properties included in property, plant and equipment as at 31 December 2017 are as follows:
Description of properties Tenure
Unexpired lease term
(year)Existing use
Professional valuers
Valuation method
MalaysiaWavertree Bungalow at Jalan Lady Maxwell, 49000 Bukit Fraser, Pahang
Leasehold 6 Holiday bungalow
C H Williams Talhar & Wong Sdn Bhd
Comparison method
Lot 448, Mukim of Sabai,District of Bentong, Pahang
Freehold Agricultural Jones Lang Wootton
Comparison method
No. 27 Jalan Pantai, 12000 Butterworth, Penang:
(i) Offices and factory buildings at Lot 142 - 187 and 362
Freehold Office and factory
Knight Frank Malaysia Sdn Bhd
Comparison method and depreciated replacement cost method
(ii) Carpark shed at Lot 268 Leasehold 11 Carpark shed Knight Frank Malaysia Sdn Bhd
Comparison method and depreciated replacement cost method
(iii) Seabed leases with main wharf at PT 686
Leasehold 52 Main wharf Knight Frank Malaysia Sdn Bhd
Comparison method and depreciated replacement cost method
Offices at unit No. B-15-6, B-15-7, B-15-11, Megan Avenue II, 12 Jalan Yap Kwan Seng, 50450 Kuala Lumpur
Freehold Office Knight Frank Malaysia Sdn Bhd
Comparison method
80 units of flats at Taman Desa Palma, Alma, 14000 Bukit Mertajam, Penang
Freehold Residential Knight Frank Malaysia Sdn Bhd
Comparison method
NOTES TO THE FINANCIAL STATEMENTSFor the financial year ended 31 December 2017
85THE STRAITS TRADING COMPANY LIMITEDANNUAL REPORT 2017
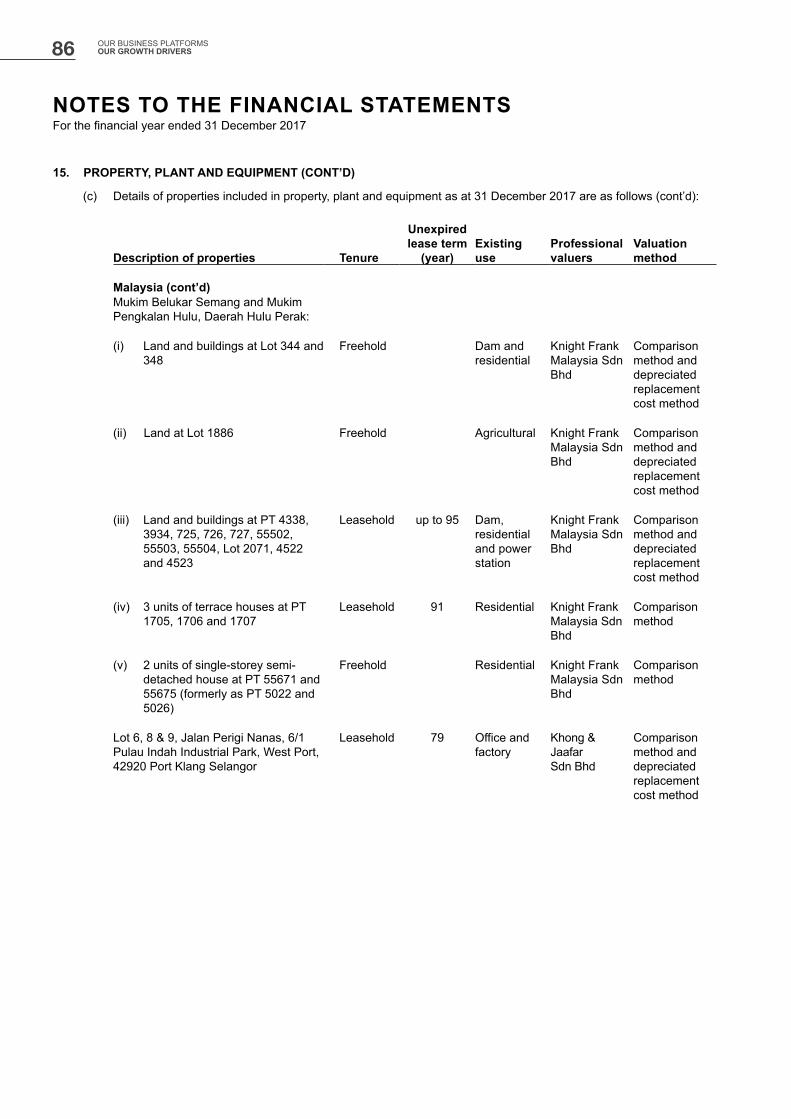
15. PROPERTY, PLANT AND EQUIPMENT (CONT’D)
(c) Details of properties included in property, plant and equipment as at 31 December 2017 are as follows (cont’d):
Description of properties Tenure
Unexpired lease term
(year)Existing use
Professional valuers
Valuation method
Malaysia (cont’d)Mukim Belukar Semang and Mukim Pengkalan Hulu, Daerah Hulu Perak:
(i) Land and buildings at Lot 344 and 348
Freehold Dam and residential
Knight Frank Malaysia Sdn Bhd
Comparison method and depreciated replacement cost method
(ii) Land at Lot 1886 Freehold Agricultural Knight Frank Malaysia Sdn Bhd
Comparison method and depreciated replacement cost method
(iii) Land and buildings at PT 4338, 3934, 725, 726, 727, 55502, 55503, 55504, Lot 2071, 4522 and 4523
Leasehold up to 95 Dam, residential and power station
Knight Frank Malaysia Sdn Bhd
Comparison method and depreciated replacement cost method
(iv) 3 units of terrace houses at PT 1705, 1706 and 1707
Leasehold 91 Residential Knight Frank Malaysia Sdn Bhd
Comparison method
(v) 2 units of single-storey semi-detached house at PT 55671 and 55675 (formerly as PT 5022 and 5026)
Freehold Residential Knight Frank Malaysia Sdn Bhd
Comparison method
Lot 6, 8 & 9, Jalan Perigi Nanas, 6/1 Pulau Indah Industrial Park, West Port, 42920 Port Klang Selangor
Leasehold 79 Office and factory
Khong & Jaafar Sdn Bhd
Comparison method and depreciated replacement cost method
NOTES TO THE FINANCIAL STATEMENTSFor the financial year ended 31 December 2017
86 OUR BUSINESS PLATFORMS OUR GROWTH DRIVERS

16. INVESTMENT PROPERTIES
Group Company2017 2016 2017 2016
$’000 $’000 $’000 $’000
Balance sheets:At fair value:Balance as at 1 January 554,337 606,010 32,314 32,371Fair value changes recognised in profit or loss 8,525 932 1,375 499Acquisition of properties 20,810 106,020 – –Acquisition of subsidiaries (note 18) 21,500 – – –Reclassified to asset held for sale (note 25) (5,000) – – –Disposal during the year (6,900) (150,934) (1,174) –Exchange adjustment (6,578) (7,691) 595 (556)Balance as at 31 December 586,694 554,337 33,110 32,314
Group2017 2016
$’000 $’000
Income statement:Rental income from investment properties– Minimum lease payments 12,360 18,202
Direct operating expenses (including repairs and maintenance) arising from:– Rental generating properties (9,212) (11,089)– Non-rental generating properties (105) (236)
(9,317) (11,325)
(a) Except as disclosed in note 16(c), the Group has no restrictions on the realisability of its investment properties.
(b) Investment properties are stated at fair value. Valuations of investment properties have been determined based on valuations at the end of the reporting period. Valuations are performed by accredited independent valuers with recent experience in the location and category of the properties being valued. Details of valuation techniques and inputs used are disclosed in note 41D.
(c) Certain investment properties are mortgaged to secure bank facilities (note 31).
(d) Details of investment properties as at 31 December 2017 are as follows:
Description of properties Tenure
Unexpired lease term
(year)Site area
sq.m.Net floor
area sq.m.Existing use
Professional valuers
Valuation method
Singapore7 residential units at Gallop Green condominium
Freehold – 2,592 (strata)
Residential Savills Valuation And Professional Services (S) Pte Ltd
Comparison method
6A/8/8A/10/12 at Cable Road Freehold 7,432 4,327(gross)
Residential Savills Valuation And Professional Services (S) Pte Ltd
Comparison method
NOTES TO THE FINANCIAL STATEMENTSFor the financial year ended 31 December 2017
87THE STRAITS TRADING COMPANY LIMITEDANNUAL REPORT 2017
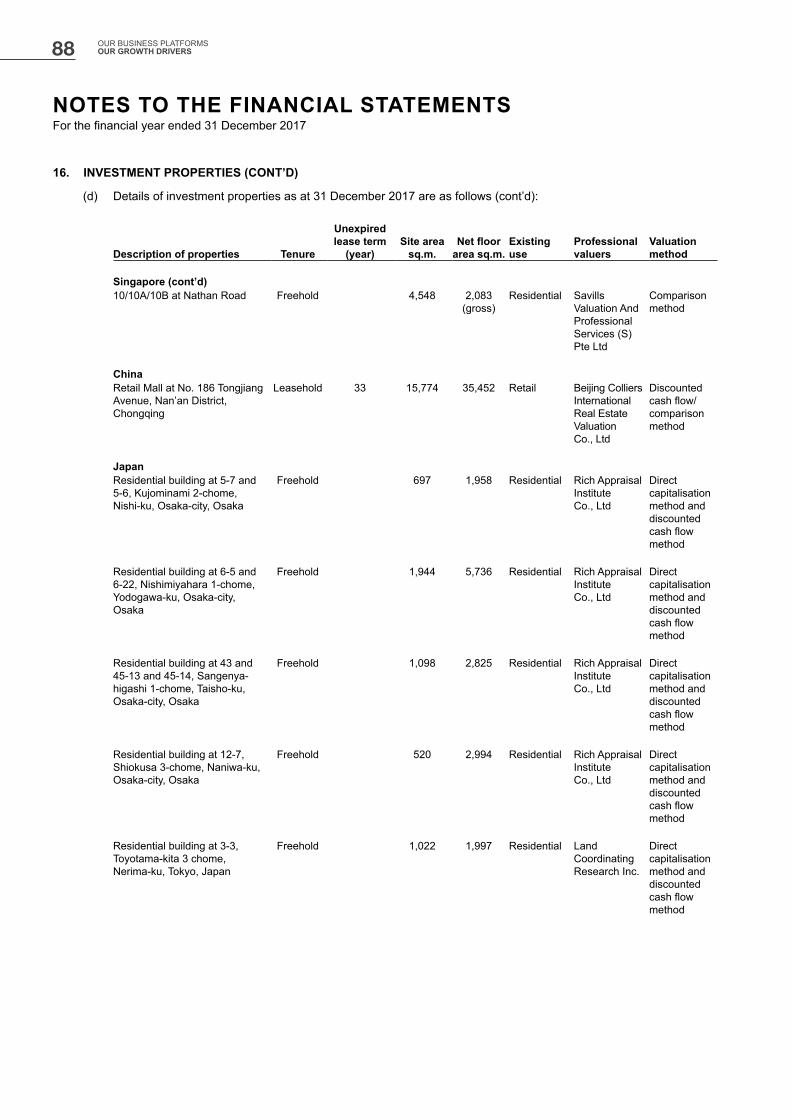
16. INVESTMENT PROPERTIES (CONT’D)
(d) Details of investment properties as at 31 December 2017 are as follows (cont’d):
Description of properties Tenure
Unexpired lease term
(year)Site area
sq.m.Net floor
area sq.m.Existing use
Professional valuers
Valuation method
Singapore (cont’d)10/10A/10B at Nathan Road Freehold 4,548 2,083
(gross)Residential Savills
Valuation And Professional Services (S) Pte Ltd
Comparison method
ChinaRetail Mall at No. 186 Tongjiang Avenue, Nan’an District, Chongqing
Leasehold 33 15,774 35,452 Retail Beijing Colliers International Real Estate Valuation Co., Ltd
Discounted cash flow/comparison method
JapanResidential building at 5-7 and 5-6, Kujominami 2-chome, Nishi-ku, Osaka-city, Osaka
Freehold 697 1,958 Residential Rich Appraisal Institute Co., Ltd
Direct capitalisation method and discounted cash flow method
Residential building at 6-5 and 6-22, Nishimiyahara 1-chome, Yodogawa-ku, Osaka-city, Osaka
Freehold 1,944 5,736 Residential Rich Appraisal Institute Co., Ltd
Direct capitalisation method and discounted cash flow method
Residential building at 43 and 45-13 and 45-14, Sangenya-higashi 1-chome, Taisho-ku, Osaka-city, Osaka
Freehold 1,098 2,825 Residential Rich Appraisal Institute Co., Ltd
Direct capitalisation method and discounted cash flow method
Residential building at 12-7, Shiokusa 3-chome, Naniwa-ku, Osaka-city, Osaka
Freehold 520 2,994 Residential Rich Appraisal Institute Co., Ltd
Direct capitalisation method and discounted cash flow method
Residential building at 3-3, Toyotama-kita 3 chome, Nerima-ku, Tokyo, Japan
Freehold 1,022 1,997 Residential Land Coordinating Research Inc.
Direct capitalisation method and discounted cash flow method
NOTES TO THE FINANCIAL STATEMENTSFor the financial year ended 31 December 2017
88 OUR BUSINESS PLATFORMS OUR GROWTH DRIVERS

16. INVESTMENT PROPERTIES (CONT’D)
(d) Details of investment properties as at 31 December 2017 are as follows (cont’d):
Description of properties Tenure
Unexpired lease term
(year)Site area
sq.m.Net floor
area sq.m.Existing use
Professional valuers
Valuation method
Malaysia A parcel of residential land Lot No. 11260, Mukim of Hulu Kinta, District of Kinta, Perak
999 years Leasehold
877 11,255 – Residential C H Williams Talhar & Wong Sdn Bhd
Comparison method
A parcel of residential land, Lot No. 34612 Town of Ipoh(S), District of Kinta, Perak
999 years Leasehold
876 12,892 – Residential C H Williams Talhar & Wong Sdn Bhd
Comparison method
Parcels of commercial land, Lot Nos. 1105 to 1110, 2122 and 2123 Town of Seremban, District of Seremban, Negeri Sembilan
Freehold 3,826 – Retail C H Williams Talhar & Wong Sdn Bhd
Comparison method
Lot Nos. 197 and 199, Section 4 Town of Butterworth, Penang
Freehold 7,948 – Carpark/Car showroom
C H Williams Talhar & Wong Sdn Bhd
Comparison method and investment method
Lot Nos. 2569 and 2626, Section 4 Town of Butterworth, Penang
Freehold 6,535 – Carpark C H Williams Talhar & Wong Sdn Bhd
Comparison method and investment method
Lot Nos. 2499, 189, 190 and 270, Section 4 Town of Butterworth, Penang; accommodating a single-storey club house and 1½ storey squash court and vacant plots
Freehold with two
minor leasehold
plots
9 and 13 37,215 1,000 (gross)
Commercial C H Williams Talhar & Wong Sdn Bhd
Comparison method andinvestment method
Lot Nos. 195, 2502 and 2570, Section 4 Town of Butterworth, Penang
Freehold 54,301(1) – Commercial C H Williams Talhar & Wong Sdn Bhd
Comparison method, investment method and residual method
8 units of 3-storey shophouses, No. 4819 to 4826 Jalan Pantai, Taman Selat, 12000 Butterworth, Penang
Freehold 1,322 2,587 Commercial C H Williams Talhar & Wong Sdn Bhd
Comparison method
(1) Included in Lot No. 2570 is land with site area of 4,656 sq.m. under development for hotel with podium accommodating shoplots and car park.
NOTES TO THE FINANCIAL STATEMENTSFor the financial year ended 31 December 2017
89THE STRAITS TRADING COMPANY LIMITEDANNUAL REPORT 2017
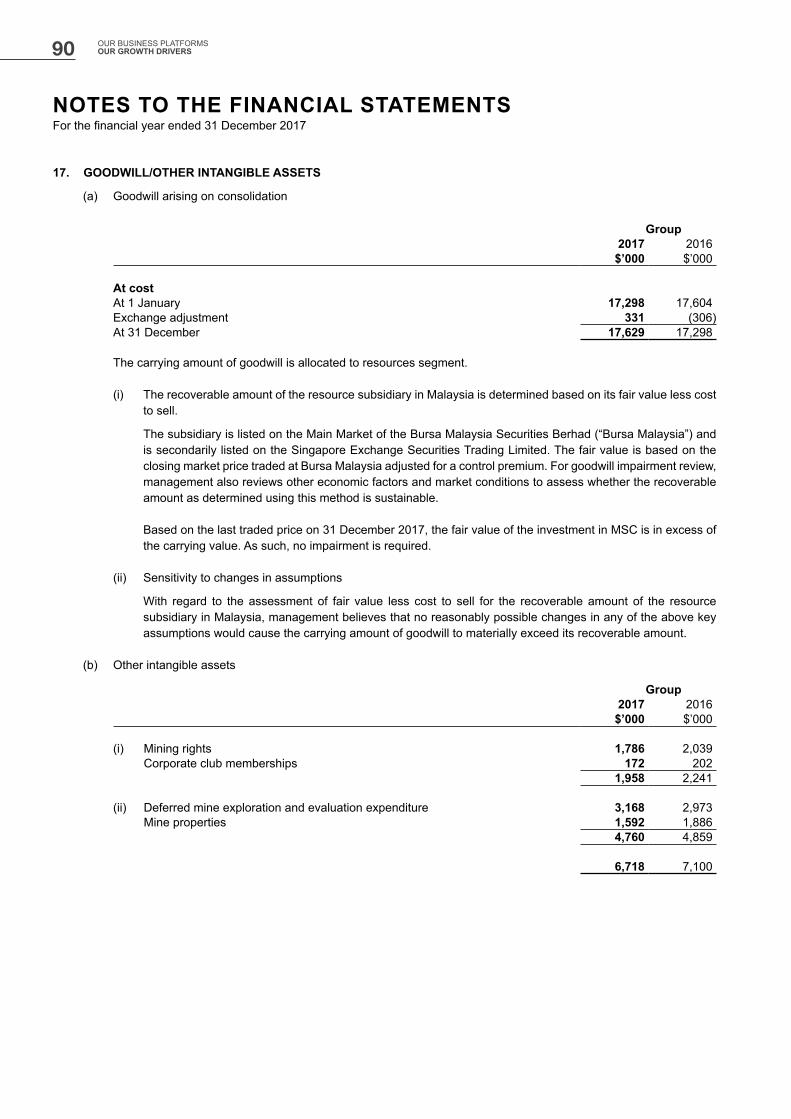
17. GOODWILL/OTHER INTANGIBLE ASSETS
(a) Goodwill arising on consolidation
Group2017 2016$’000 $’000
At costAt 1 January 17,298 17,604Exchange adjustment 331 (306)At 31 December 17,629 17,298
The carrying amount of goodwill is allocated to resources segment.
(i) The recoverable amount of the resource subsidiary in Malaysia is determined based on its fair value less cost to sell.
The subsidiary is listed on the Main Market of the Bursa Malaysia Securities Berhad (“Bursa Malaysia”) and is secondarily listed on the Singapore Exchange Securities Trading Limited. The fair value is based on the closing market price traded at Bursa Malaysia adjusted for a control premium. For goodwill impairment review, management also reviews other economic factors and market conditions to assess whether the recoverable amount as determined using this method is sustainable.
Based on the last traded price on 31 December 2017, the fair value of the investment in MSC is in excess of the carrying value. As such, no impairment is required.
(ii) Sensitivity to changes in assumptions
With regard to the assessment of fair value less cost to sell for the recoverable amount of the resource subsidiary in Malaysia, management believes that no reasonably possible changes in any of the above key assumptions would cause the carrying amount of goodwill to materially exceed its recoverable amount.
(b) Other intangible assets
Group2017 2016$’000 $’000
(i) Mining rights 1,786 2,039 Corporate club memberships 172 202
1,958 2,241
(ii) Deferred mine exploration and evaluation expenditure 3,168 2,973 Mine properties 1,592 1,886
4,760 4,859
6,718 7,100
NOTES TO THE FINANCIAL STATEMENTSFor the financial year ended 31 December 2017
90 OUR BUSINESS PLATFORMS OUR GROWTH DRIVERS

17. GOODWILL/OTHER INTANGIBLE ASSETS (CONT’D)
(b) Other intangible assets (cont’d)
(i) Mining rights and corporate club memberships
Mining rights
Corporate club
memberships Total$’000 $’000 $’000
GroupAt costAt 1 January 2017 3,847 286 4,133Additions – 21 21Disposals – (122) (122)Exchange adjustment 73 2 75At 31 December 2017 3,920 187 4,107
Accumulated amortisationAt 1 January 2017 1,808 84 1,892Amortisation charge for the year 285 6 291Disposals – (75) (75)Exchange adjustment 41 – 41At 31 December 2017 2,134 15 2,149
Net carrying amountAt 31 December 2017 1,786 172 1,958
At costAt 1 January 2016 3,915 291 4,206Exchange adjustment (68) (5) (73)At 31 December 2016 3,847 286 4,133
Accumulated amortisationAt 1 January 2016 1,548 76 1,624Amortisation charge for the year 294 10 304Exchange adjustment (34) (2) (36)At 31 December 2016 1,808 84 1,892
Net carrying amountAt 31 December 2016 2,039 202 2,241
NOTES TO THE FINANCIAL STATEMENTSFor the financial year ended 31 December 2017
91THE STRAITS TRADING COMPANY LIMITEDANNUAL REPORT 2017
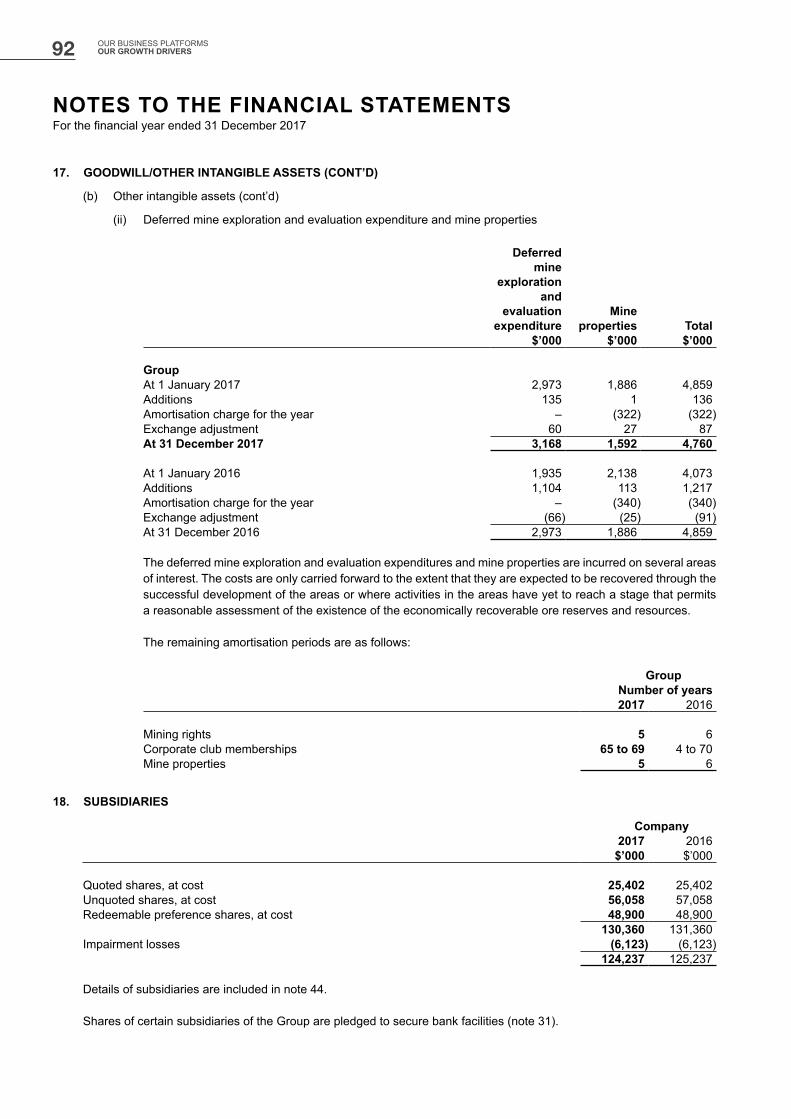
17. GOODWILL/OTHER INTANGIBLE ASSETS (CONT’D)
(b) Other intangible assets (cont’d)
(ii) Deferred mine exploration and evaluation expenditure and mine properties
Deferred mine
exploration and
evaluation expenditure
Mine properties Total
$’000 $’000 $’000
GroupAt 1 January 2017 2,973 1,886 4,859Additions 135 1 136Amortisation charge for the year – (322) (322)Exchange adjustment 60 27 87At 31 December 2017 3,168 1,592 4,760
At 1 January 2016 1,935 2,138 4,073Additions 1,104 113 1,217Amortisation charge for the year – (340) (340)Exchange adjustment (66) (25) (91)At 31 December 2016 2,973 1,886 4,859
The deferred mine exploration and evaluation expenditures and mine properties are incurred on several areas of interest. The costs are only carried forward to the extent that they are expected to be recovered through the successful development of the areas or where activities in the areas have yet to reach a stage that permits a reasonable assessment of the existence of the economically recoverable ore reserves and resources.
The remaining amortisation periods are as follows:
GroupNumber of years2017 2016
Mining rights 5 6Corporate club memberships 65 to 69 4 to 70Mine properties 5 6
18. SUBSIDIARIES
Company2017 2016
$’000 $’000
Quoted shares, at cost 25,402 25,402Unquoted shares, at cost 56,058 57,058Redeemable preference shares, at cost 48,900 48,900
130,360 131,360Impairment losses (6,123) (6,123)
124,237 125,237
Details of subsidiaries are included in note 44.
Shares of certain subsidiaries of the Group are pledged to secure bank facilities (note 31).
NOTES TO THE FINANCIAL STATEMENTSFor the financial year ended 31 December 2017
92 OUR BUSINESS PLATFORMS OUR GROWTH DRIVERS
18. SUBSIDIARIES (CONT’D)
Incorporation of subsidiaries
During the financial year, through the Company’s 89.5% indirectly-owned subsidiary, Straits Real Estate Pte. Ltd. (“Straits Real Estate”), the following subsidiaries were incorporated:
(i) Through SRE Venture 8 Pte. Ltd., SRE Australia 2 Pte. Ltd. with 1 ordinary share at the price of $1 per share and subsequently enlarged its share capital to $12,000,001;
(ii) SRE Venture 11 Pte. Ltd. with 1 ordinary share at the price of $1 per share;
(iii) Through SRE Venture 11 Pte. Ltd., SRE Japan 11 Pte. Ltd. with 1 ordinary share at the price of $1 per share. SRE Japan 11 Pte. Ltd. subsequently entered into a tokumei kumiai agreement (or silent partnership agreement) with SIM Residence One GK, a godo kaisha incorporated in Japan (the “TK Operator”) to acquire a 98.5% stake of the distributions from the TK Operator for JPY448,021,000 ($5,555,000);
(iv) SRE Venture 12 Pte. Ltd. with 1 ordinary share at the price of $1 per share;
(v) Through SRE Venture 12 Pte. Ltd., SRE Korea 1 Pte. Ltd. with 1 ordinary share at the price of $1 per share. SRE Korea 1 Pte. Ltd. was subsequently renamed to SRE Australia 3 Pte. Ltd.; and
(vi) Through SRE Australia 3 Pte. Ltd., 45SGT Unit Trust with 95 ordinary share at the price of A$1 per share. SRE Australia 3 Pte. Ltd. has a 95.0% stake in 45SGT Unit Trust.
In 2016, through the Company’s 89.5% indirectly-owned subsidiary, Straits Real Estate, the following subsidiaries were incorporated:
(i) Through SRE Venture 9 Pte. Ltd., Straits Real Estate (Beijing) Business Consulting Co.,Ltd. with a paid-up capital of RMB1,300,000 and registered capital of RMB9,000,000; and
(ii) SRE Venture 10 Pte. Ltd. (“SRE Venture 10”) with 1 ordinary share at the price of $1 per share. Subsequently, SRE Venture 10 incorporated two subsidiaries, SRE Japan 1 Pte. Ltd. (“SRE Japan 1”) and SRE Japan 2 Pte. Ltd., each with 1 ordinary share at the price of $1 per share. SRE Japan 1 incorporated two other subsidiaries, SRE Luxe 1 Pte. Ltd. (“SRE Luxe 1”) and SRE Luxe 2 Pte. Ltd. (“SRE Luxe 2”) each with 1 ordinary share at the price of $1 per share.
In 2016, SRE Luxe 1 acquired one specified share of JHT TMK, a Japanese tokutei mokuteki kaisha incorporated in 2015. At the date of acquisition, JHT TMK has a capital amount of JPY10,000 divided into four specified shares, all of which have been fully paid up.
Subsequently, SRE Luxe 1 and SRE Luxe 2 (through its branch in Japan), subscribed for 4,990 preferred shares at subscription amount of JPY1,147,700,000 and 5,010 preferred shares at subscription amount of JPY1,152,300,000 in JHT TMK respectively.
In 2014, Chongqing Xinchuang Mall Management Co., Ltd (“CXMM”) acquired a retail mall in Chongqing, China (the “Acquisition”). As part of the Acquisition, SRE China 1 Pte. Ltd. (“SRE China”) was given the option to sell the entire shareholdings in CXMM to the seller of the retail mall should the retail mall fail to generate a certain internal rate of return over the investments contributed by SRE China for the Acquisition, within an agreed time frame. The effect of the option is not expected to be material to the financial statements.
Capital injection by a subsidiary
During the financial year, the Group increased its contribution in Straits Real Estate to $353,855,000 (2016: $333,540,000) increasing Straits Real Estate’s share capital to $395,485,000 (2016: $372,780,000).
NOTES TO THE FINANCIAL STATEMENTSFor the financial year ended 31 December 2017
93THE STRAITS TRADING COMPANY LIMITEDANNUAL REPORT 2017
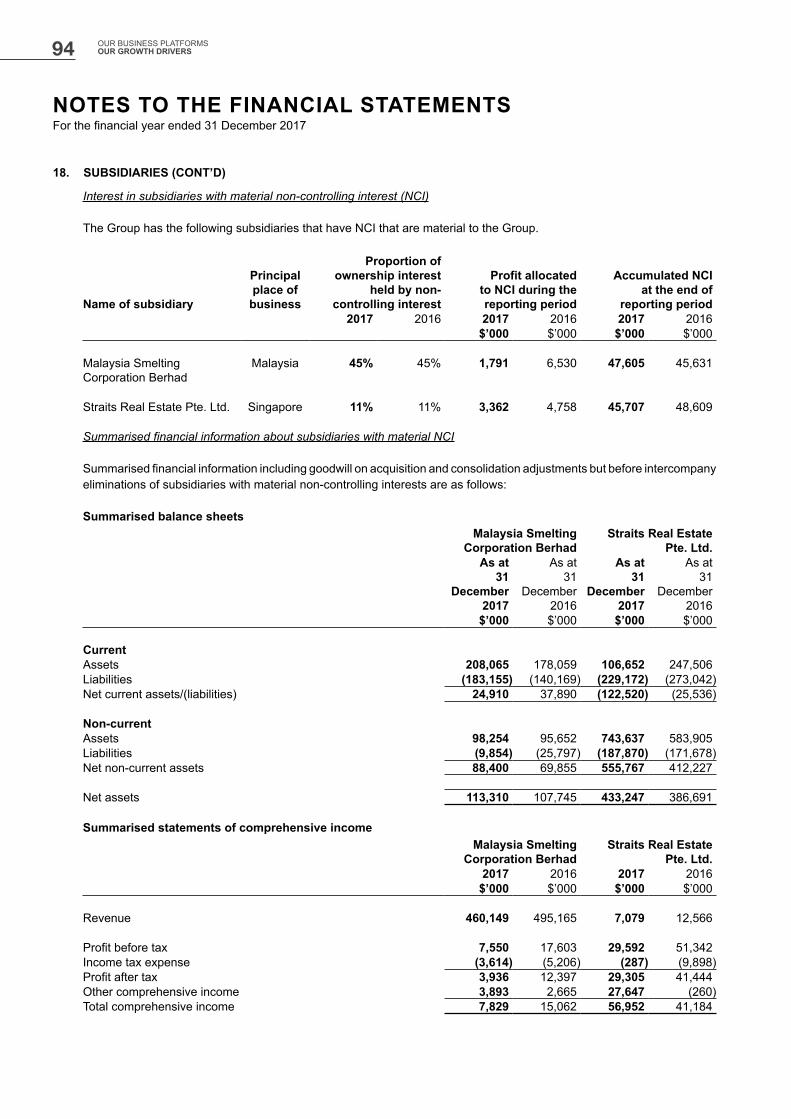
18. SUBSIDIARIES (CONT’D)
Interest in subsidiaries with material non-controlling interest (NCI)
The Group has the following subsidiaries that have NCI that are material to the Group.
Name of subsidiary
Principal place of business
Proportion of ownership interest
held by non-controlling interest
Profit allocated to NCI during the reporting period
Accumulated NCIat the end of
reporting period2017 2016 2017 2016 2017 2016
$’000 $’000 $’000 $’000
Malaysia Smelting Corporation Berhad
Malaysia 45% 45% 1,791 6,530 47,605 45,631
Straits Real Estate Pte. Ltd. Singapore 11% 11% 3,362 4,758 45,707 48,609
Summarised financial information about subsidiaries with material NCI
Summarised financial information including goodwill on acquisition and consolidation adjustments but before intercompany eliminations of subsidiaries with material non-controlling interests are as follows:
Summarised balance sheetsMalaysia Smelting
Corporation BerhadStraits Real Estate
Pte. Ltd.As at
31 December
2017
As at31
December 2016
As at31
December 2017
As at31
December 2016
$’000 $’000 $’000 $’000
CurrentAssets 208,065 178,059 106,652 247,506Liabilities (183,155) (140,169) (229,172) (273,042)Net current assets/(liabilities) 24,910 37,890 (122,520) (25,536)
Non-currentAssets 98,254 95,652 743,637 583,905Liabilities (9,854) (25,797) (187,870) (171,678)Net non-current assets 88,400 69,855 555,767 412,227
Net assets 113,310 107,745 433,247 386,691
Summarised statements of comprehensive incomeMalaysia Smelting
Corporation BerhadStraits Real Estate
Pte. Ltd.2017 2016 2017 2016
$’000 $’000 $’000 $’000
Revenue 460,149 495,165 7,079 12,566
Profit before tax 7,550 17,603 29,592 51,342Income tax expense (3,614) (5,206) (287) (9,898)Profit after tax 3,936 12,397 29,305 41,444Other comprehensive income 3,893 2,665 27,647 (260)Total comprehensive income 7,829 15,062 56,952 41,184
NOTES TO THE FINANCIAL STATEMENTSFor the financial year ended 31 December 2017
94 OUR BUSINESS PLATFORMS OUR GROWTH DRIVERS

18. SUBSIDIARIES (CONT’D)
Summarised financial information about subsidiaries with material NCI (cont’d)
Other summarised information
Malaysia Smelting Corporation Berhad
Straits Real Estate Pte. Ltd.
2017 2016 2017 2016$’000 $’000 $’000 $’000
Net cash flows (used in)/from operations (35,486) 18,261 (2,656) (12,071)Net cash flows used in investing activities (2,456) (17,068) (42,545) (7,532)Net cash flows from/(used in) financing activities 34,128 (17,872) (20,705) 71,826
Analysis of acquisition of subsidiaries
On 31 January 2017, Straits Real Estate, through its wholly-owned subsidiary SRE Japan 2 Pte. Ltd., acquired the entire issued share capital in two Singapore incorporated companies, Nikko AM Japan Property I-I Pte. Ltd. (now known as SRE Luxe 3 Pte. Ltd.) and Nikko AM Japan Property I-II Pte. Ltd. (now known as SRE Luxe 4 Pte. Ltd.) (collectively, the “Acquirees”) which own 100% trust beneficiary interest in a freehold 14 storey rental residential property in Osaka, Japan through Tokutei Mokuteki Kaisha JP 2 (formerly known as Tokutei Mokuteki Kaisha Nikko AM Japan Property 1-2).
The acquisition of the Acquirees has contributed the following results to the Group from the date of acquisition:
Group2017
$’000
Revenue 1,096Profit after tax from continuing operations 403
If the acquisition had occurred on 1 January 2017, the Group’s revenue would have been increased by $102,000 and profit after tax from continuing operations would have been reduced by $117,000. Transaction costs of $125,000 related to the acquisition were expensed and included in “other expenses” line item in the Group’s profit or loss for the year ended 31 December 2017. The fair values of the net identifiable assets and liabilities of the Acquirees as at the acquisition date were:
$’000
Assets:Investment properties (note 16) 21,500Trade and other receivables, including prepayments 75Cash and cash equivalents 5,185
26,760Liabilities:Trade and other payables (4,313)Borrowings (note 31) (14,852)
(19,165)
Net assets acquired 7,595Less: Cash consideration, net of expenses (7,397)Negative goodwill (note 7) 198
NOTES TO THE FINANCIAL STATEMENTSFor the financial year ended 31 December 2017
95THE STRAITS TRADING COMPANY LIMITEDANNUAL REPORT 2017

18. SUBSIDIARIES (CONT’D)
Analysis of acquisition of subsidiaries (cont’d)
Cash flow effect on acquisition of the Acquirees:
Group2017
$’000
Total consideration for entire equity interest acquired 7,397Less: Cash and cash equivalent of the subsidiaries acquired (5,185)Net cash outflow 2,212
Analysis of sale of a subsidiary
On 1 June 2017, Straits Real Estate, through its wholly-owned subsidiary SRE Venture 6 Pte. Ltd., redeemed its entire investment in the Class A, Class B and Class C shares in SRE Asian Asset Income Fund.
The transaction had the following effects on the financial position of the Group as at 31 December 2017:
$’000
Assets:Trade and other receivables, including prepayments 89,072Investment securities 14,271Cash and cash equivalents 34,309
137,652Liabilities:Income tax payable (54)Trade and other payables (20,623)
(20,677)Equity:Non-controlling interests (6,977)
Net assets disposed 109,998Cash consideration, net of expenses 109,998
–
Cash and cash equivalents of the subsidiary disposed (34,309)Net cash inflow 75,689
19. ASSOCIATES AND JOINT VENTURES
Group Company2017 2016 2017 2016
$’000 $’000 $’000 $’000
Associates 660,669 636,283 1,997 2,708Joint ventures 128,740 3,096 – –
789,409 639,379 1,997 2,708
NOTES TO THE FINANCIAL STATEMENTSFor the financial year ended 31 December 2017
96 OUR BUSINESS PLATFORMS OUR GROWTH DRIVERS

19. ASSOCIATES AND JOINT VENTURES (CONT’D)
19.1 Associates
Group Company2017 2016 2017 2016
$’000 $’000 $’000 $’000
Quoted shares, at cost – 323,855 – –Share of post-acquisition reserves – 26,899 – –
– 350,754 – –
Unquoted shares, at cost 469,045 183,608 2,462 2,708Shareholder loans (d) 71,910 71,910 – –Share of post-acquisition reserves 132,311 39,417 – –Exchange adjustment (7,614) (4,423) – –
665,652 290,512 2,462 2,708Impairment losses (4,983) (4,983) (465) –
660,669 285,529 1,997 2,708
660,669 636,283 1,997 2,708
Market value of quoted shares – 341,822 – –
(a) Details of associates are included in note 44.
(b) During the financial year, ARA Asset Management Limited (“ARA”) was privatised and delisted from the SGX-ST via a Scheme of Arrangement. In accordance with the subscription and rollover agreement, the Group received $48.2 million cash and $308.6 million is reinvested as rollover shares in a newly incorporated holding company of ARA, ARA Asset Management Holdings Pte. Ltd. (“ARAH”) (formerly known as Athena Investment Company (Singapore) Pte. Limited). On completion of the transaction in April 2017, the Group’s effective interest in ARA increased from 20.1% to 20.95%.
(c) During the financial year, Greater Tokyo Office Fund (Jersey) L.P. (“GTOF”) made a final increase in its fund’s size which the Group did not participate in. The Group’s stake after the increase was diluted from 45.2% to 37.6% at 31 December 2017.
(d) This relates to the Group’s shareholder loans to Far East Hospitality Holdings Pte. Ltd. (“FEHH”), a 30/70 joint venture with Far East Orchard Limited. The shareholder loans to FEHH are unsecured and non-interest bearing.
(e) Movement in the allowance account:
Group Company2017 2016 2017 2016
$’000 $’000 $’000 $’000
At 1 January (4,983) (4,983) – –Impairment for the year – – (465) –At 31 December (4,983) (4,983) (465) –
(f) Aggregate information about the Group’s associates that are not individually material are as follows:
Group2017 2016
$’000 $’000
Profit after tax 118 709Other comprehensive income (131) 251Total comprehensive income (13) 960
NOTES TO THE FINANCIAL STATEMENTSFor the financial year ended 31 December 2017
97THE STRAITS TRADING COMPANY LIMITEDANNUAL REPORT 2017

19. ASSOCIATES AND JOINT VENTURES (CONT’D)
19.1 Associates (cont’d)
(g) The summarised financial information in respect of ARAH/ARA, FEHH, GTOF and ARA Harmony Fund III, L.P. (“H3”), based on their financial statements and a reconciliation with the carrying amount of the investments in the consolidated financial statements are as follows:
Summarised balance sheets
ARAH/ARA FEHH GTOF H3$’000 $’000 $’000 $’000
As at 31 December 2017Current assets 237,528 79,860 83,211 520,944Non-current assets 2,462,264 610,724 568,571 86,866Total assets 2,699,792 690,584 651,782 607,810
Current liabilities (160,554) (292,031) (37,692) (69,998)Non-current liabilities (532,836) (281,920) (312,945) (341,899)Total liabilities (693,390) (573,951) (350,637) (411,897)
Net assets 2,006,402 116,633 301,145 195,913Perpetual securities holders (304,077) – – –Non-controlling interests (31,389) – (30,686) –
1,670,936 116,633 270,459 195,913
As at 31 December 2016Current assets 205,002 71,553 98,598 24,313Non-current assets 556,210 612,170 205,621 611,530Total assets 761,212 683,723 304,219 635,843
Current liabilities (88,991) (295,518) (18,587) (69,201)Non-current liabilities (82,747) (282,864) (112,560) (358,432)Total liabilities (171,738) (578,382) (131,147) (427,633)
Net assets 589,474 105,341 173,072 208,210Non-controlling interests (7,052) – – –
582,422 105,341 173,072 208,210
Summarised statements of comprehensive income
ARAH/ARA FEHH GTOF H3$’000 $’000 $’000 $’000
2017Revenue 207,757 91,294 25,186 44,322
Profit/(Loss) after tax 82,647 399 71,351 (7,587)Other comprehensive income 174,939 10,893 – 4,062Total comprehensive income 257,586 11,292 71,351 (3,525)
Dividends received from the associates during the year – – 5,095 3,509
2016Revenue 176,831 127,488 8,482 46,695
Profit after tax 92,117 11,749 16,526 43,852Other comprehensive income 24,114 31,099 – (5,994)Total comprehensive income 116,231 42,848 16,526 37,858
Dividends received from the associates during the year 10,024 – – 2,627
NOTES TO THE FINANCIAL STATEMENTSFor the financial year ended 31 December 2017
98 OUR BUSINESS PLATFORMS OUR GROWTH DRIVERS

19. ASSOCIATES AND JOINT VENTURES (CONT’D)
19.1 Associates (cont’d)
Reconciliation of the summarised financial information presented above to the carrying amount of the Group’s interest in associates:
ARAH/ARA FEHH GTOF H3$’000 $’000 $’000 $’000
Net assets at 31 December 2017 1,670,936 116,633 270,459 195,913Interest in associates 20.95% 30% 37.57% 40%Group’s share of net assets 350,061 34,990 101,611 78,365Goodwill on acquisition 121,889 – – –Intangible assets 110,101 10,291 – –Step acquisition adjustment (180,222) – – –Capital return arising from privatisation (48,211) – – –Other adjustments (61) – – –Carrying value of the Group’s interest in associates 353,557 45,281 101,611 78,365
Net assets at 31 December 2016 582,422 105,341 173,072 208,210Interest in associates 20.1% 30% 45.17% 40%Group’s share of net assets 117,067 31,602 78,177 83,284Goodwill on acquisition 127,232 – – –Intangible assets 106,008 10,441 – –Other adjustments 447 – – –Carrying value of the Group’s interest in associates 350,754 42,043 78,177 83,284
Step acquisition adjustment and capital return arising from privatisation arose from the privatisation of ARA in April 2017.
In 2016, certain shares in an associate were pledged to secure bank facilities (note 31).
19.2 Joint ventures
Group2017 2016
$’000 $’000
Unquoted shares, at cost 3,868 3,868Shareholder notes (b) 126,003 –Share of post-acquisition reserves 9,016 9,077Exchange adjustment (7,906) (7,488)
130,981 5,457Impairment losses (2,241) (2,361)
128,740 3,096
(a) Details of joint ventures are included in note 44.
(b) During the financial year, Straits Real Estate, through its wholly owned subsidiary, SRE Australia 2 Pte. Ltd. (“SRE Australia 2”), invested A$119.2 million ($125.0 million) in notes issued by 320P Trust. The notes are unsecured, repayable by 2027 and entitles SRE Australia 2 to the higher of a fixed interest per annum or a percentage of profits in 320P Trust. As unanimous approval is required for key operating, investing and financing matters, the Group has accounted for 320P Trust as a joint venture.
NOTES TO THE FINANCIAL STATEMENTSFor the financial year ended 31 December 2017
99THE STRAITS TRADING COMPANY LIMITEDANNUAL REPORT 2017
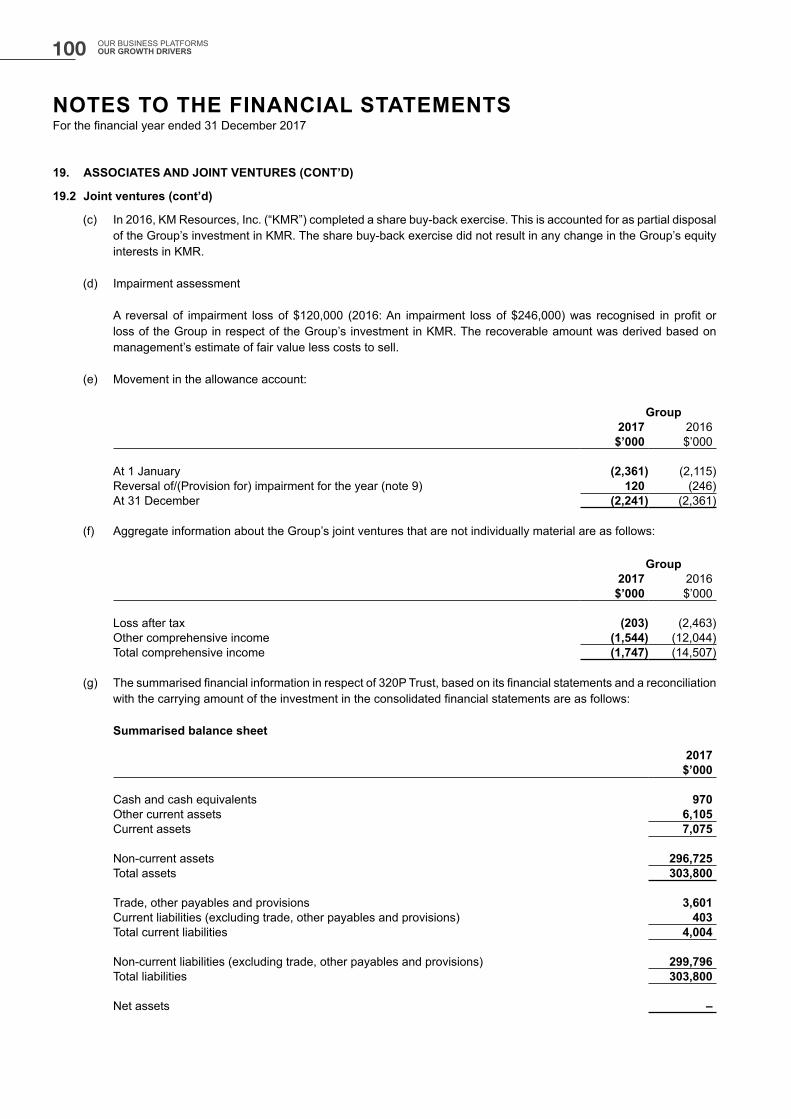
19. ASSOCIATES AND JOINT VENTURES (CONT’D)
19.2 Joint ventures (cont’d)
(c) In 2016, KM Resources, Inc. (“KMR”) completed a share buy-back exercise. This is accounted for as partial disposal of the Group’s investment in KMR. The share buy-back exercise did not result in any change in the Group’s equity interests in KMR.
(d) Impairment assessment
A reversal of impairment loss of $120,000 (2016: An impairment loss of $246,000) was recognised in profit or loss of the Group in respect of the Group’s investment in KMR. The recoverable amount was derived based on management’s estimate of fair value less costs to sell.
(e) Movement in the allowance account:
Group2017 2016$’000 $’000
At 1 January (2,361) (2,115)Reversal of/(Provision for) impairment for the year (note 9) 120 (246)At 31 December (2,241) (2,361)
(f) Aggregate information about the Group’s joint ventures that are not individually material are as follows:
Group2017 2016$’000 $’000
Loss after tax (203) (2,463)Other comprehensive income (1,544) (12,044)Total comprehensive income (1,747) (14,507)
(g) The summarised financial information in respect of 320P Trust, based on its financial statements and a reconciliation with the carrying amount of the investment in the consolidated financial statements are as follows:
Summarised balance sheet
2017$’000
Cash and cash equivalents 970 Other current assets 6,105Current assets 7,075
Non-current assets 296,725 Total assets 303,800
Trade, other payables and provisions 3,601 Current liabilities (excluding trade, other payables and provisions) 403Total current liabilities 4,004
Non-current liabilities (excluding trade, other payables and provisions) 299,796 Total liabilities 303,800
Net assets –
NOTES TO THE FINANCIAL STATEMENTSFor the financial year ended 31 December 2017
100 OUR BUSINESS PLATFORMS OUR GROWTH DRIVERS
19. ASSOCIATES AND JOINT VENTURES (CONT’D)
19.2 Joint ventures (cont’d)
Summarised statement of comprehensive income
2017$’000
Revenue 8,846Interest income –
Profit before tax –Income tax expense –Profit after tax –Other comprehensive income –Total comprehensive income –
Reconciliation of the summarised financial information presented above to the carrying amount of the Group’s interest in 320P Trust:
2017$’000
Net assets at 31 December –Interest in joint venture 26%Carrying value of the Group’s interest in joint venture –
Certain shares and shareholder notes in a joint venture are pledged to secure bank facilities (note 31).
20. DEFERRED TAX ASSETS AND LIABILITIES
Group Company2017 2016 2017 2016
$’000 $’000 $’000 $’000
Deferred tax assets 7,750 3,731 – –Deferred tax liabilities (5,421) (5,672) (1,692) (2,751)
2,329 (1,941) (1,692) (2,751)
NOTES TO THE FINANCIAL STATEMENTSFor the financial year ended 31 December 2017
101THE STRAITS TRADING COMPANY LIMITEDANNUAL REPORT 2017
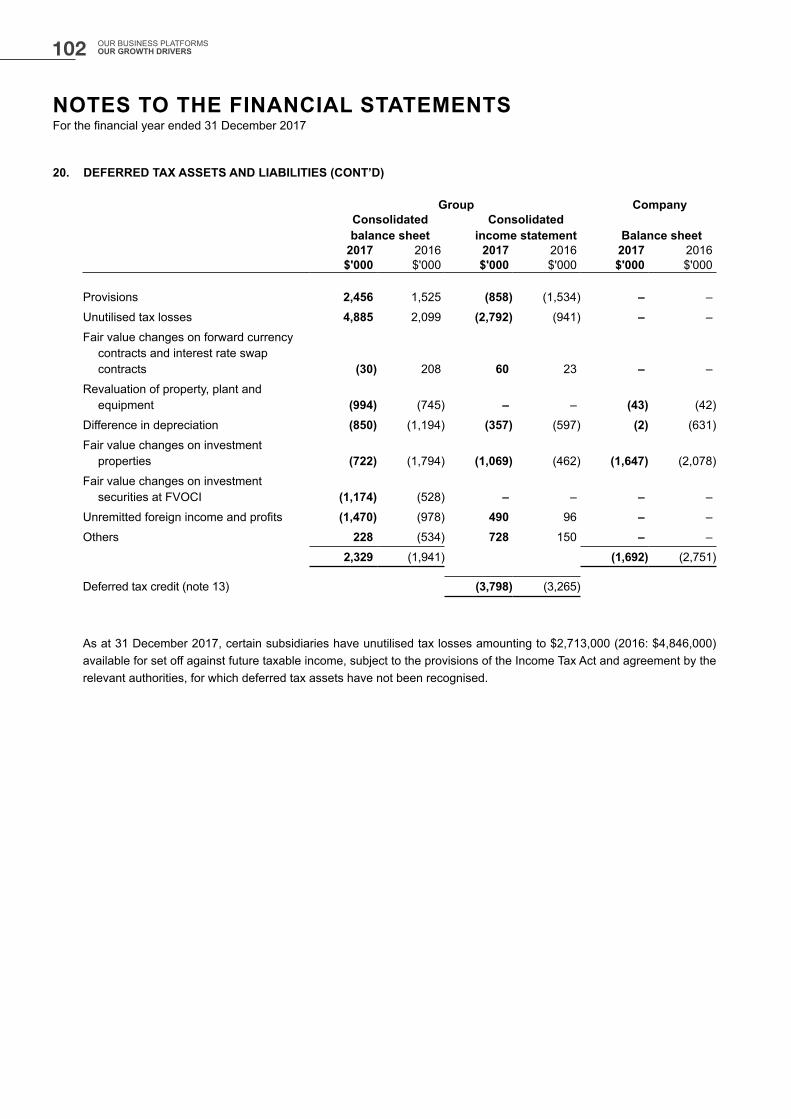
20. DEFERRED TAX ASSETS AND LIABILITIES (CONT’D)
Group CompanyConsolidated balance sheet
Consolidated income statement Balance sheet
2017 2016 2017 2016 2017 2016$'000 $'000 $'000 $'000 $'000 $'000
Provisions 2,456 1,525 (858) (1,534) – –
Unutilised tax losses 4,885 2,099 (2,792) (941) – –
Fair value changes on forward currency contracts and interest rate swap contracts (30) 208 60 23 – –
Revaluation of property, plant and equipment (994) (745) – – (43) (42)
Difference in depreciation (850) (1,194) (357) (597) (2) (631)
Fair value changes on investment properties (722) (1,794) (1,069) (462) (1,647) (2,078)
Fair value changes on investment securities at FVOCI (1,174) (528) – – – –
Unremitted foreign income and profits (1,470) (978) 490 96 – –
Others 228 (534) 728 150 – –
2,329 (1,941) (1,692) (2,751)
Deferred tax credit (note 13) (3,798) (3,265)
As at 31 December 2017, certain subsidiaries have unutilised tax losses amounting to $2,713,000 (2016: $4,846,000) available for set off against future taxable income, subject to the provisions of the Income Tax Act and agreement by the relevant authorities, for which deferred tax assets have not been recognised.
NOTES TO THE FINANCIAL STATEMENTSFor the financial year ended 31 December 2017
102 OUR BUSINESS PLATFORMS OUR GROWTH DRIVERS
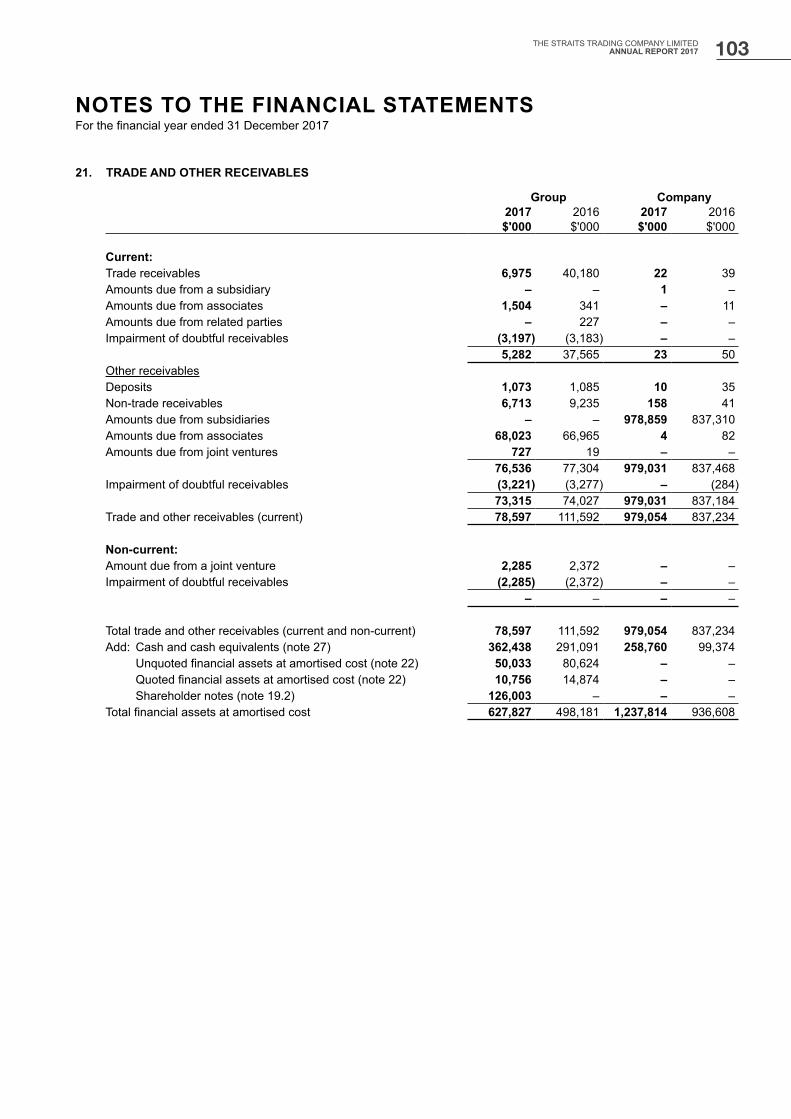
21. TRADE AND OTHER RECEIVABLES
Group Company2017 2016 2017 2016$'000 $'000 $'000 $'000
Current:Trade receivables 6,975 40,180 22 39Amounts due from a subsidiary – – 1 –Amounts due from associates 1,504 341 – 11Amounts due from related parties – 227 – –Impairment of doubtful receivables (3,197) (3,183) – –
5,282 37,565 23 50Other receivablesDeposits 1,073 1,085 10 35Non-trade receivables 6,713 9,235 158 41Amounts due from subsidiaries – – 978,859 837,310Amounts due from associates 68,023 66,965 4 82Amounts due from joint ventures 727 19 – –
76,536 77,304 979,031 837,468Impairment of doubtful receivables (3,221) (3,277) – (284)
73,315 74,027 979,031 837,184Trade and other receivables (current) 78,597 111,592 979,054 837,234
Non-current:Amount due from a joint venture 2,285 2,372 – –Impairment of doubtful receivables (2,285) (2,372) – –
– – – –
Total trade and other receivables (current and non-current) 78,597 111,592 979,054 837,234Add: Cash and cash equivalents (note 27) 362,438 291,091 258,760 99,374
Unquoted financial assets at amortised cost (note 22) 50,033 80,624 – –Quoted financial assets at amortised cost (note 22) 10,756 14,874 – –Shareholder notes (note 19.2) 126,003 – – –
Total financial assets at amortised cost 627,827 498,181 1,237,814 936,608
NOTES TO THE FINANCIAL STATEMENTSFor the financial year ended 31 December 2017
103THE STRAITS TRADING COMPANY LIMITEDANNUAL REPORT 2017
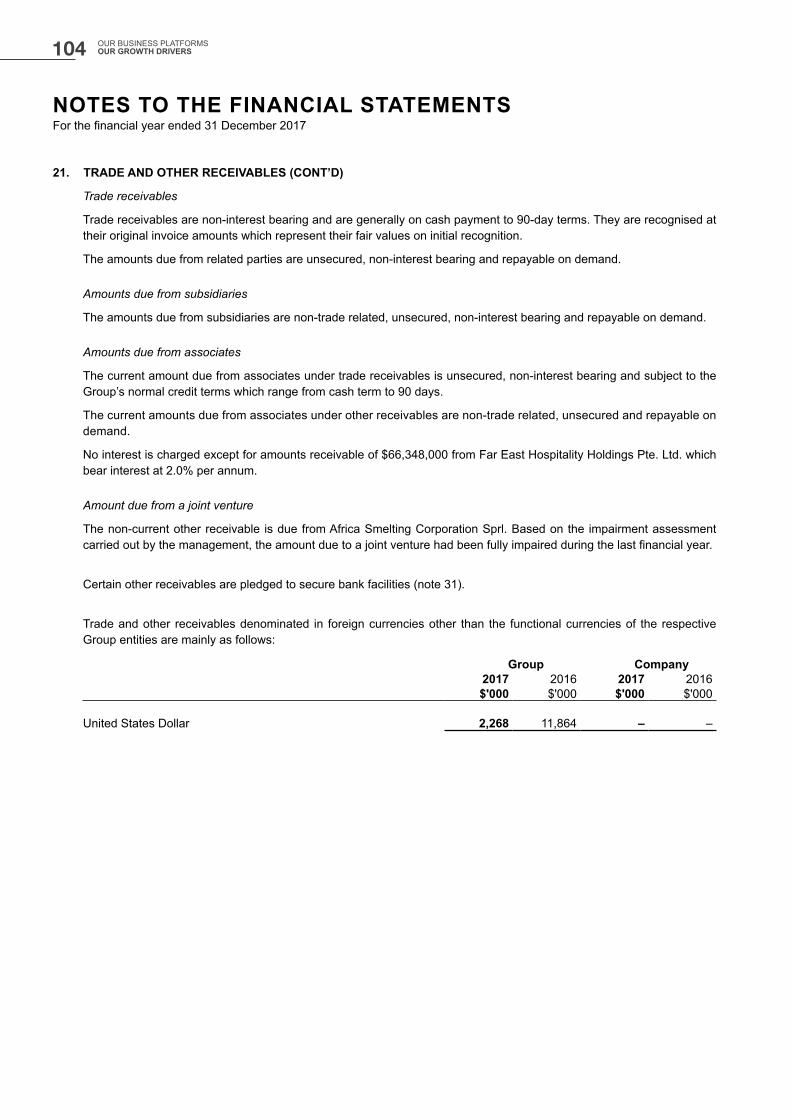
21. TRADE AND OTHER RECEIVABLES (CONT’D)
Trade receivables
Trade receivables are non-interest bearing and are generally on cash payment to 90-day terms. They are recognised at their original invoice amounts which represent their fair values on initial recognition.
The amounts due from related parties are unsecured, non-interest bearing and repayable on demand.
Amounts due from subsidiaries
The amounts due from subsidiaries are non-trade related, unsecured, non-interest bearing and repayable on demand.
Amounts due from associates
The current amount due from associates under trade receivables is unsecured, non-interest bearing and subject to the Group’s normal credit terms which range from cash term to 90 days.
The current amounts due from associates under other receivables are non-trade related, unsecured and repayable on demand.
No interest is charged except for amounts receivable of $66,348,000 from Far East Hospitality Holdings Pte. Ltd. which bear interest at 2.0% per annum.
Amount due from a joint venture
The non-current other receivable is due from Africa Smelting Corporation Sprl. Based on the impairment assessment carried out by the management, the amount due to a joint venture had been fully impaired during the last financial year.
Certain other receivables are pledged to secure bank facilities (note 31).
Trade and other receivables denominated in foreign currencies other than the functional currencies of the respective Group entities are mainly as follows:
Group Company2017 2016 2017 2016$'000 $'000 $'000 $'000
United States Dollar 2,268 11,864 – –
NOTES TO THE FINANCIAL STATEMENTSFor the financial year ended 31 December 2017
104 OUR BUSINESS PLATFORMS OUR GROWTH DRIVERS
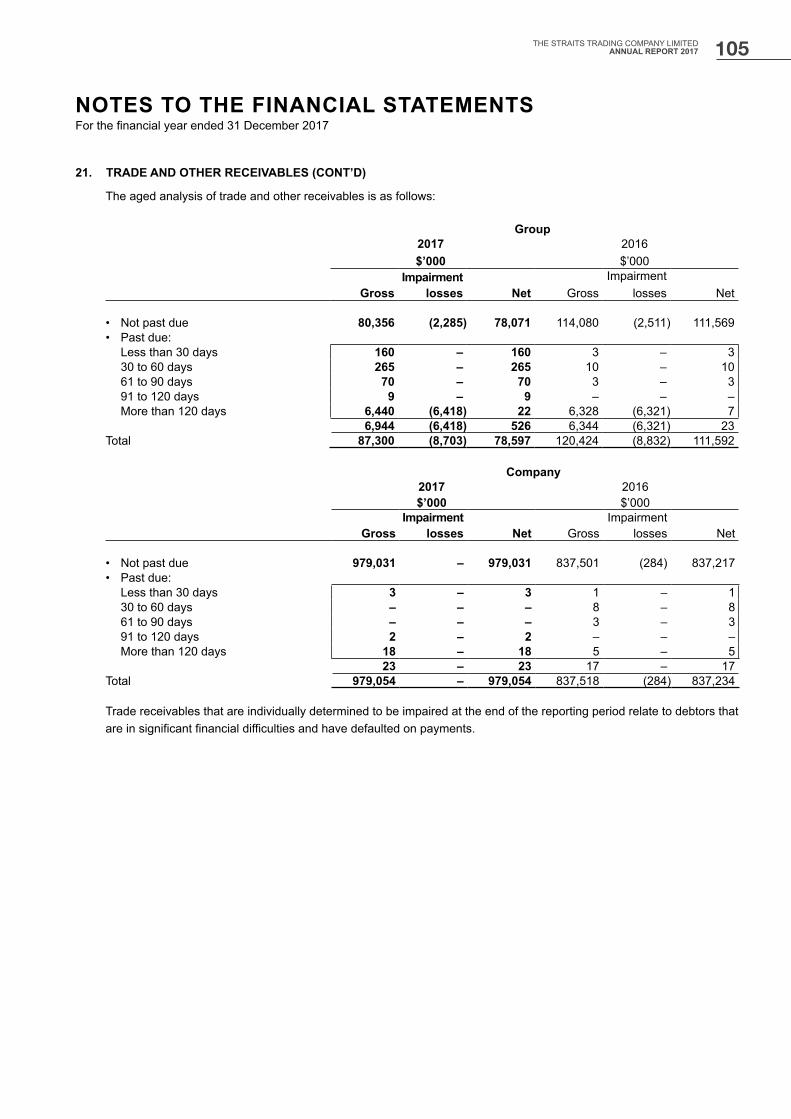
21. TRADE AND OTHER RECEIVABLES (CONT’D)
The aged analysis of trade and other receivables is as follows:
Group2017$’000
2016$’000
GrossImpairment
losses Net GrossImpairment
losses Net
• Not past due 80,356 (2,285) 78,071 114,080 (2,511) 111,569• Past due:
Less than 30 days 160 – 160 3 – 330 to 60 days 265 – 265 10 – 1061 to 90 days 70 – 70 3 – 391 to 120 days 9 – 9 – – –More than 120 days 6,440 (6,418) 22 6,328 (6,321) 7
6,944 (6,418) 526 6,344 (6,321) 23Total 87,300 (8,703) 78,597 120,424 (8,832) 111,592
Company2017$’000
2016$’000
GrossImpairment
losses Net GrossImpairment
losses Net
• Not past due 979,031 – 979,031 837,501 (284) 837,217• Past due:
Less than 30 days 3 – 3 1 – 130 to 60 days – – – 8 – 861 to 90 days – – – 3 – 391 to 120 days 2 – 2 – – –More than 120 days 18 – 18 5 – 5
23 – 23 17 – 17Total 979,054 – 979,054 837,518 (284) 837,234
Trade receivables that are individually determined to be impaired at the end of the reporting period relate to debtors that are in significant financial difficulties and have defaulted on payments.
NOTES TO THE FINANCIAL STATEMENTSFor the financial year ended 31 December 2017
105THE STRAITS TRADING COMPANY LIMITEDANNUAL REPORT 2017

21. TRADE AND OTHER RECEIVABLES (CONT’D)
Trade and other receivables that are impaired at the reporting date and the movement of allowance accounts used to record the impairment are as follows:
Group Company2017 2016 2017 2016
$’000 $’000 $’000 $’000
Trade and other receivables - nominal amounts 8,703 8,832 – 289Less: Allowance for impairment (8,703) (8,832) – (284)
– – – 5
Movement in the allowance accounts:
Group Company2017 2016 2017 2016
$’000 $’000 $’000 $’000
At 1 January (8,832) (1,597) (284) (284)Effect of adoption of FRS 109 – (3,741) – –Impairment for the year (note 11) – (3,176) – –Amounts written off 182 – – –Reversal of impairment – – 284 –Exchange adjustment (53) (318) – –At 31 December (8,703) (8,832) – (284)
22. INVESTMENT SECURITIES
(a) Investment securities (non-current)
Group2017 2016
$’000 $’000
At fair value through other comprehensive income– quoted, equity securities 264,395 175,555Total financial assets at fair value through other comprehensive income 264,395 175,555
At amortised cost– unquoted – 80,624
264,395 256,179
(b) Investment securities (current)
Group2017 2016
$’000 $’000
At fair value through profit or loss– quoted, at fair value 16,090 97,674
At amortised cost– quoted bonds 10,756 14,874– unquoted 50,033 –
76,879 112,548
NOTES TO THE FINANCIAL STATEMENTSFor the financial year ended 31 December 2017
106 OUR BUSINESS PLATFORMS OUR GROWTH DRIVERS

22. INVESTMENT SECURITIES (CONT’D)
Information on the Group’s investment securities by country can be found in note 38(e).
The Group holds shares quoted in Singapore, United States, Canada, Japan, Australia and United Kingdom. Please refer to note 38(e) for information on equity price risk.
The unquoted investment securities at amortised cost are:
(i) investment in a mezzanine financing amounting to A$5.2 million (2016: A$35.0 million) with a coupon rate of 17.5% (2016: 14.25%) per annum and matures within 1 year (2016: 2 years). One of the mezzanine financing was redeemed during the financial year.
(ii) secured debenture notes amounting to A$15.0 million (2016: A$15.0 million) with a coupon rate of 16.5% (2016: 16.5%) per annum and matures within 1 year (2016: 2 years).
(iii) credit linked notes amounting to $23.3 million (2016: $16.2 million) with a fixed interest rate of 0.34% to 3.98% (2016: 3.98%) per annum and matures within 1 year (2016: 2 years).
Certain investment securities are pledged to secure bank facilities (note 31).
23. DERIVATIVE FINANCIAL INSTRUMENTS
Derivative financial instruments included in the balance sheet as at 31 December are as follows:
GroupAssets Liabilities Assets Liabilities
2017 2017 2016 2016$’000 $’000 $’000 $’000
Forward currency contracts 255 810 568 1,201Contracts for differences – – 296 187Interest rate swap contracts – 899 – 100
255 1,709 864 1,488
Current 255 810 313 1,114
Non-current – 899 551 374
These represent the fair values of the following financial instruments:
(a) forward currency contracts are entered into for the purpose of managing foreign exchange risk. The fair value changes of these contracts are recognised in other comprehensive income and accumulated in equity under hedging reserve to the extent that the hedges are effective. These contracts mature between January 2018 to November 2018.
(b) the interest rate swap contracts are entered into for the purpose of managing interest rate risk. The fair value changes of these contracts are recognised in other comprehensive income and accumulated in equity under hedging reserve to the extent that the hedges are effective.
(c) contracts for differences (“CFDs”) represent agreements that obligate two parties to exchange cash flows at specified intervals based upon or calculated by reference to changes in specified prices or rates for a specified amount of an underlying asset or otherwise deemed notional amount. The payment flows are usually netted against each other, with the difference being paid by one party to the other. Therefore amounts required for the future satisfaction of the CFDs may be greater or less than the amount recorded. The ultimate gain or loss depends upon the prices at which the underlying financial instruments of the CFDs is valued at the CFDs’ settlement date and is recognised in profit or loss.
Further details of the derivative financial instruments in items (a) to (c) are disclosed in note 39 to the financial statements.
NOTES TO THE FINANCIAL STATEMENTSFor the financial year ended 31 December 2017
107THE STRAITS TRADING COMPANY LIMITEDANNUAL REPORT 2017
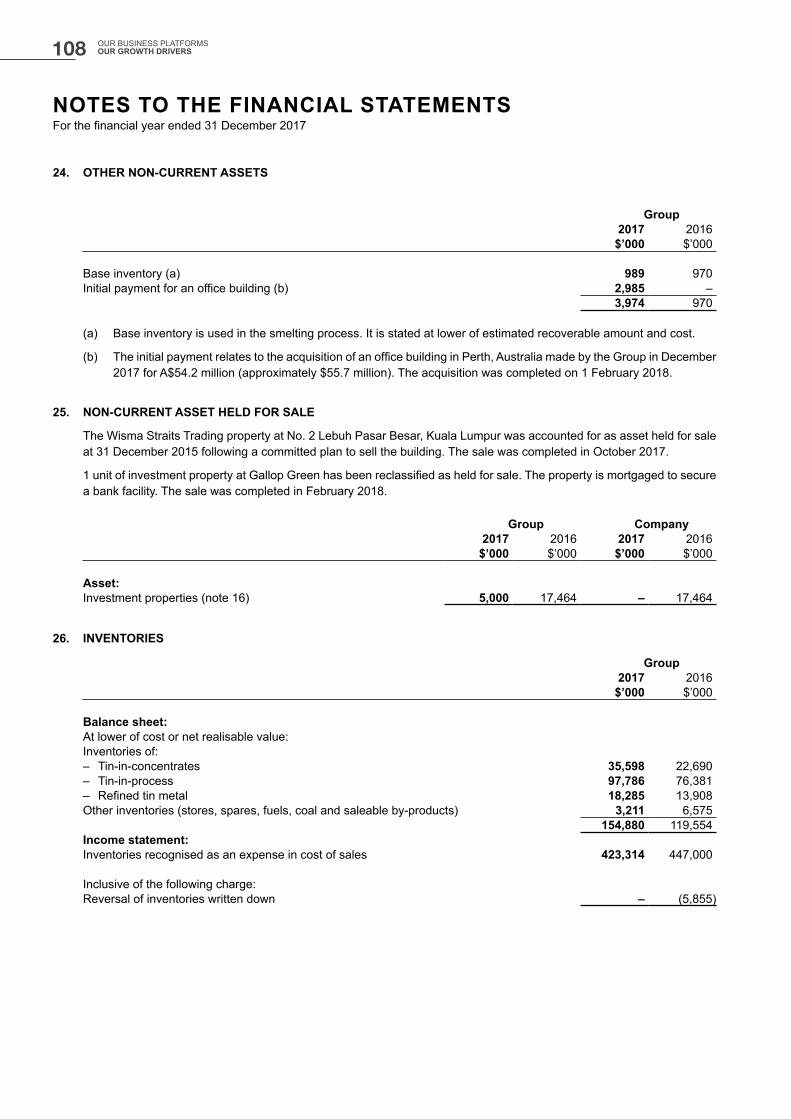
24. OTHER NON-CURRENT ASSETS
Group2017 2016
$’000 $’000
Base inventory (a) 989 970Initial payment for an office building (b) 2,985 –
3,974 970
(a) Base inventory is used in the smelting process. It is stated at lower of estimated recoverable amount and cost.
(b) The initial payment relates to the acquisition of an office building in Perth, Australia made by the Group in December 2017 for A$54.2 million (approximately $55.7 million). The acquisition was completed on 1 February 2018.
25. NON-CURRENT ASSET HELD FOR SALE
The Wisma Straits Trading property at No. 2 Lebuh Pasar Besar, Kuala Lumpur was accounted for as asset held for sale at 31 December 2015 following a committed plan to sell the building. The sale was completed in October 2017.
1 unit of investment property at Gallop Green has been reclassified as held for sale. The property is mortgaged to secure a bank facility. The sale was completed in February 2018.
Group Company2017 2016 2017 2016
$’000 $’000 $’000 $’000
Asset:Investment properties (note 16) 5,000 17,464 – 17,464
26. INVENTORIES
Group2017 2016
$’000 $’000
Balance sheet:At lower of cost or net realisable value:Inventories of:– Tin-in-concentrates 35,598 22,690– Tin-in-process 97,786 76,381– Refined tin metal 18,285 13,908Other inventories (stores, spares, fuels, coal and saleable by-products) 3,211 6,575
154,880 119,554Income statement: Inventories recognised as an expense in cost of sales 423,314 447,000
Inclusive of the following charge: Reversal of inventories written down – (5,855)
NOTES TO THE FINANCIAL STATEMENTSFor the financial year ended 31 December 2017
108 OUR BUSINESS PLATFORMS OUR GROWTH DRIVERS
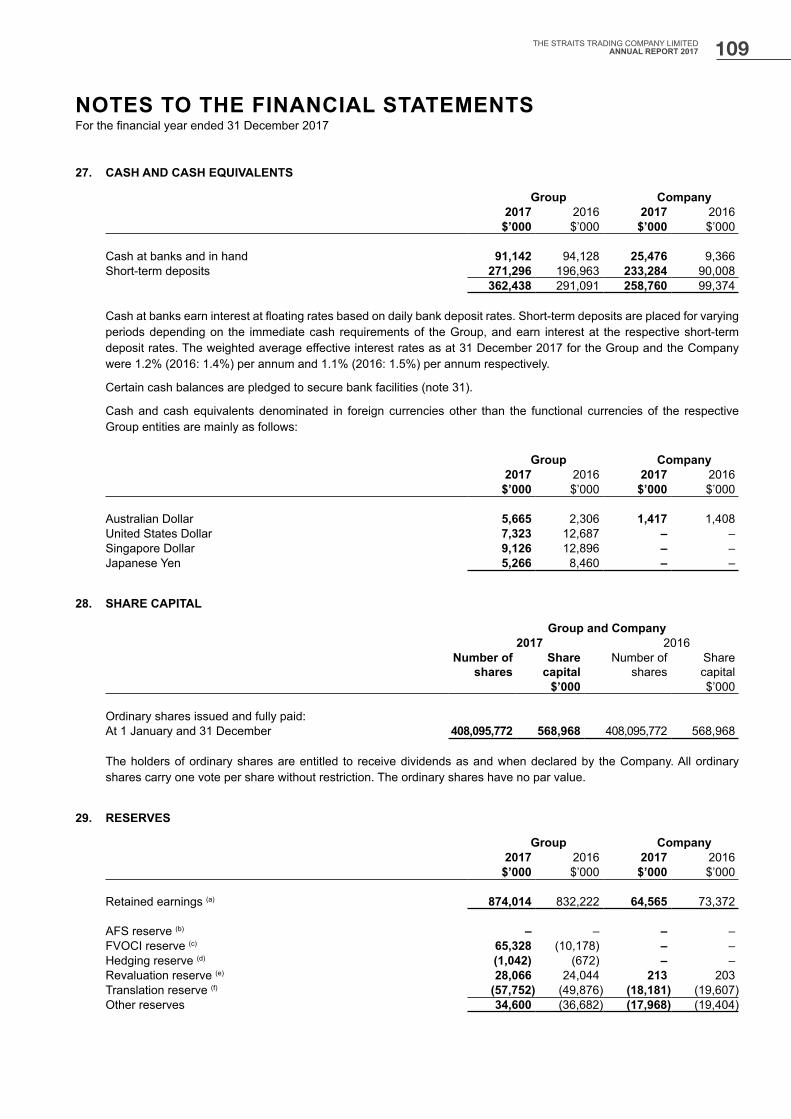
27. CASH AND CASH EQUIVALENTS
Group Company2017 2016 2017 2016
$’000 $’000 $’000 $’000
Cash at banks and in hand 91,142 94,128 25,476 9,366Short-term deposits 271,296 196,963 233,284 90,008
362,438 291,091 258,760 99,374
Cash at banks earn interest at floating rates based on daily bank deposit rates. Short-term deposits are placed for varying periods depending on the immediate cash requirements of the Group, and earn interest at the respective short-term deposit rates. The weighted average effective interest rates as at 31 December 2017 for the Group and the Company were 1.2% (2016: 1.4%) per annum and 1.1% (2016: 1.5%) per annum respectively.
Certain cash balances are pledged to secure bank facilities (note 31).
Cash and cash equivalents denominated in foreign currencies other than the functional currencies of the respective Group entities are mainly as follows:
Group Company2017 2016 2017 2016
$’000 $’000 $’000 $’000
Australian Dollar 5,665 2,306 1,417 1,408United States Dollar 7,323 12,687 – –Singapore Dollar 9,126 12,896 – –Japanese Yen 5,266 8,460 – –
28. SHARE CAPITAL
Group and Company2017 2016
Number ofshares
Share capital
Number ofshares
Share capital
$’000 $’000
Ordinary shares issued and fully paid:At 1 January and 31 December 408,095,772 568,968 408,095,772 568,968
The holders of ordinary shares are entitled to receive dividends as and when declared by the Company. All ordinary shares carry one vote per share without restriction. The ordinary shares have no par value.
29. RESERVES
Group Company2017 2016 2017 2016
$’000 $’000 $’000 $’000
Retained earnings (a) 874,014 832,222 64,565 73,372
AFS reserve (b) – – – –FVOCI reserve (c) 65,328 (10,178) – –Hedging reserve (d) (1,042) (672) – –Revaluation reserve (e) 28,066 24,044 213 203Translation reserve (f) (57,752) (49,876) (18,181) (19,607)Other reserves 34,600 (36,682) (17,968) (19,404)
NOTES TO THE FINANCIAL STATEMENTSFor the financial year ended 31 December 2017
109THE STRAITS TRADING COMPANY LIMITEDANNUAL REPORT 2017
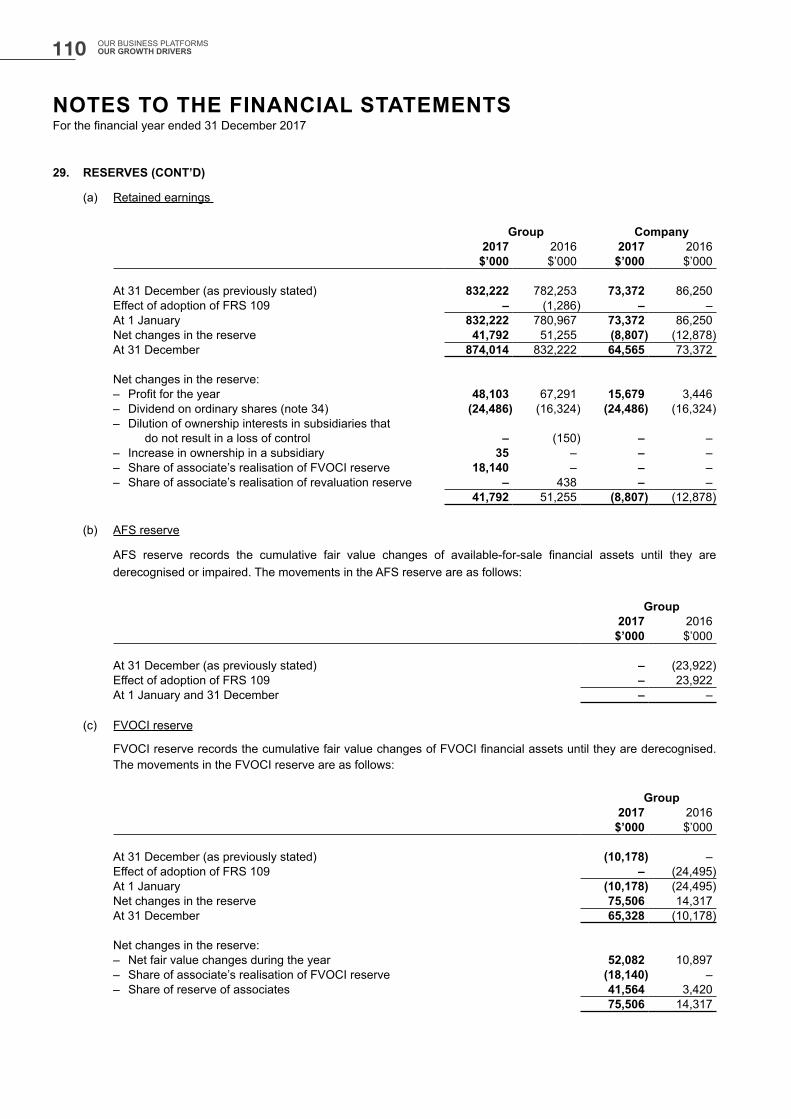
29. RESERVES (CONT’D)
(a) Retained earnings
Group Company2017 2016 2017 2016
$’000 $’000 $’000 $’000
At 31 December (as previously stated) 832,222 782,253 73,372 86,250Effect of adoption of FRS 109 – (1,286) – –At 1 January 832,222 780,967 73,372 86,250Net changes in the reserve 41,792 51,255 (8,807) (12,878)At 31 December 874,014 832,222 64,565 73,372
Net changes in the reserve:– Profit for the year 48,103 67,291 15,679 3,446– Dividend on ordinary shares (note 34) (24,486) (16,324) (24,486) (16,324)– Dilution of ownership interests in subsidiaries that
do not result in a loss of control – (150) – –– Increase in ownership in a subsidiary 35 – – –– Share of associate’s realisation of FVOCI reserve 18,140 – – –– Share of associate’s realisation of revaluation reserve – 438 – –
41,792 51,255 (8,807) (12,878)
(b) AFS reserve
AFS reserve records the cumulative fair value changes of available-for-sale financial assets until they are derecognised or impaired. The movements in the AFS reserve are as follows:
Group2017 2016
$’000 $’000
At 31 December (as previously stated) – (23,922)Effect of adoption of FRS 109 – 23,922At 1 January and 31 December – –
(c) FVOCI reserve
FVOCI reserve records the cumulative fair value changes of FVOCI financial assets until they are derecognised. The movements in the FVOCI reserve are as follows:
Group2017 2016
$’000 $’000
At 31 December (as previously stated) (10,178) –Effect of adoption of FRS 109 – (24,495)At 1 January (10,178) (24,495)Net changes in the reserve 75,506 14,317At 31 December 65,328 (10,178)
Net changes in the reserve:– Net fair value changes during the year 52,082 10,897– Share of associate’s realisation of FVOCI reserve (18,140) –– Share of reserve of associates 41,564 3,420
75,506 14,317
NOTES TO THE FINANCIAL STATEMENTSFor the financial year ended 31 December 2017
110 OUR BUSINESS PLATFORMS OUR GROWTH DRIVERS
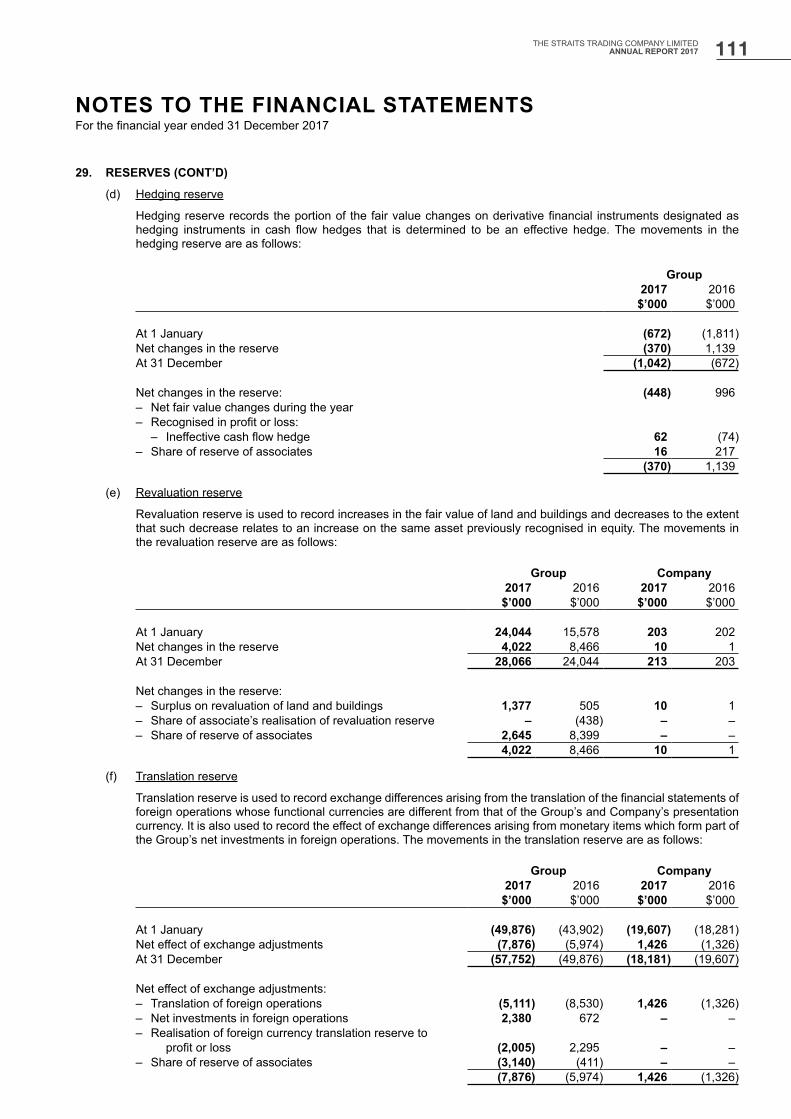
29. RESERVES (CONT’D)
(d) Hedging reserve
Hedging reserve records the portion of the fair value changes on derivative financial instruments designated as hedging instruments in cash flow hedges that is determined to be an effective hedge. The movements in the hedging reserve are as follows:
Group2017 2016
$’000 $’000
At 1 January (672) (1,811)Net changes in the reserve (370) 1,139At 31 December (1,042) (672)
Net changes in the reserve: (448) 996– Net fair value changes during the year– Recognised in profit or loss:
– Ineffective cash flow hedge 62 (74)– Share of reserve of associates 16 217
(370) 1,139
(e) Revaluation reserve
Revaluation reserve is used to record increases in the fair value of land and buildings and decreases to the extent that such decrease relates to an increase on the same asset previously recognised in equity. The movements in the revaluation reserve are as follows:
Group Company2017 2016 2017 2016
$’000 $’000 $’000 $’000
At 1 January 24,044 15,578 203 202Net changes in the reserve 4,022 8,466 10 1At 31 December 28,066 24,044 213 203
Net changes in the reserve:– Surplus on revaluation of land and buildings 1,377 505 10 1– Share of associate’s realisation of revaluation reserve – (438) – –– Share of reserve of associates 2,645 8,399 – –
4,022 8,466 10 1
(f) Translation reserve
Translation reserve is used to record exchange differences arising from the translation of the financial statements of foreign operations whose functional currencies are different from that of the Group’s and Company’s presentation currency. It is also used to record the effect of exchange differences arising from monetary items which form part of the Group’s net investments in foreign operations. The movements in the translation reserve are as follows:
Group Company2017 2016 2017 2016
$’000 $’000 $’000 $’000
At 1 January (49,876) (43,902) (19,607) (18,281)Net effect of exchange adjustments (7,876) (5,974) 1,426 (1,326)At 31 December (57,752) (49,876) (18,181) (19,607)
Net effect of exchange adjustments:– Translation of foreign operations (5,111) (8,530) 1,426 (1,326)– Net investments in foreign operations 2,380 672 – –– Realisation of foreign currency translation reserve to
profit or loss (2,005) 2,295 – –– Share of reserve of associates (3,140) (411) – –
(7,876) (5,974) 1,426 (1,326)
NOTES TO THE FINANCIAL STATEMENTSFor the financial year ended 31 December 2017
111THE STRAITS TRADING COMPANY LIMITEDANNUAL REPORT 2017
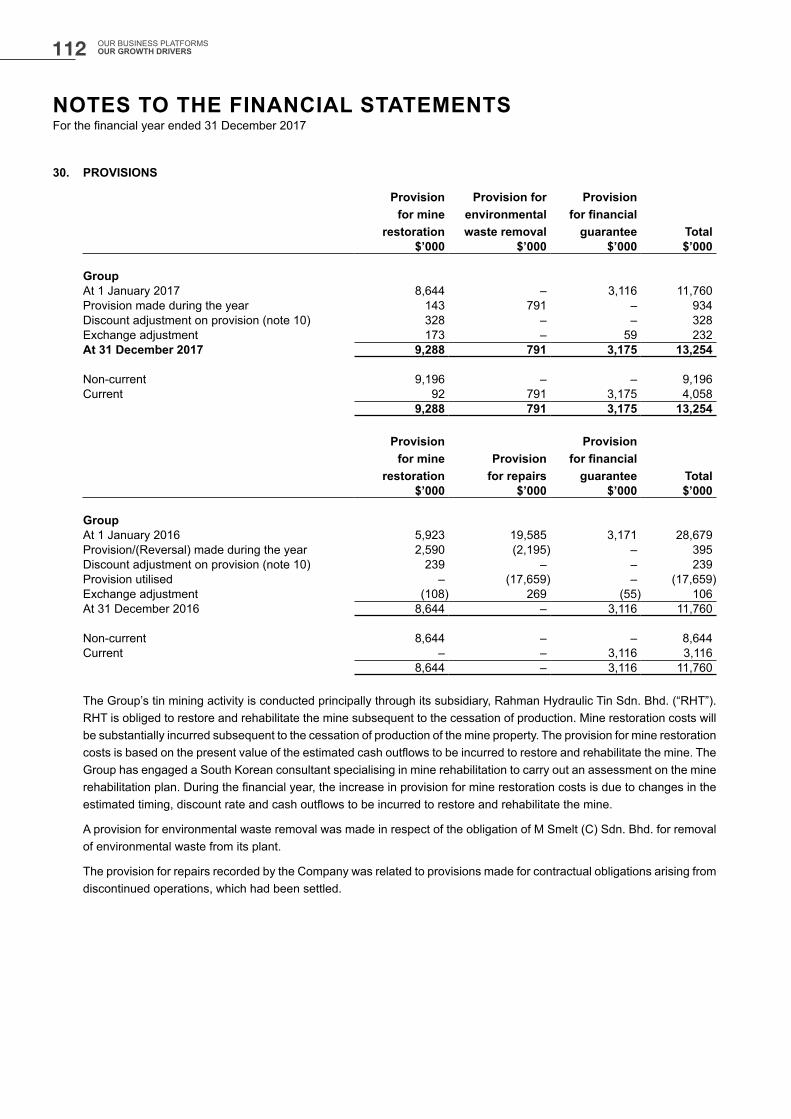
30. PROVISIONS
Provision for mine
restoration
Provision for environmental waste removal
Provision for financial
guarantee Total$’000 $’000 $’000 $’000
GroupAt 1 January 2017 8,644 – 3,116 11,760Provision made during the year 143 791 – 934Discount adjustment on provision (note 10) 328 – – 328Exchange adjustment 173 – 59 232At 31 December 2017 9,288 791 3,175 13,254
Non-current 9,196 – – 9,196Current 92 791 3,175 4,058
9,288 791 3,175 13,254
Provision for mine
restorationProvision
for repairs
Provision for financial
guarantee Total$’000 $’000 $’000 $’000
GroupAt 1 January 2016 5,923 19,585 3,171 28,679Provision/(Reversal) made during the year 2,590 (2,195) – 395Discount adjustment on provision (note 10) 239 – – 239Provision utilised – (17,659) – (17,659)Exchange adjustment (108) 269 (55) 106At 31 December 2016 8,644 – 3,116 11,760
Non-current 8,644 – – 8,644Current – – 3,116 3,116
8,644 – 3,116 11,760
The Group’s tin mining activity is conducted principally through its subsidiary, Rahman Hydraulic Tin Sdn. Bhd. (“RHT”). RHT is obliged to restore and rehabilitate the mine subsequent to the cessation of production. Mine restoration costs will be substantially incurred subsequent to the cessation of production of the mine property. The provision for mine restoration costs is based on the present value of the estimated cash outflows to be incurred to restore and rehabilitate the mine. The Group has engaged a South Korean consultant specialising in mine rehabilitation to carry out an assessment on the mine rehabilitation plan. During the financial year, the increase in provision for mine restoration costs is due to changes in the estimated timing, discount rate and cash outflows to be incurred to restore and rehabilitate the mine.
A provision for environmental waste removal was made in respect of the obligation of M Smelt (C) Sdn. Bhd. for removal of environmental waste from its plant.
The provision for repairs recorded by the Company was related to provisions made for contractual obligations arising from discontinued operations, which had been settled.
NOTES TO THE FINANCIAL STATEMENTSFor the financial year ended 31 December 2017
112 OUR BUSINESS PLATFORMS OUR GROWTH DRIVERS
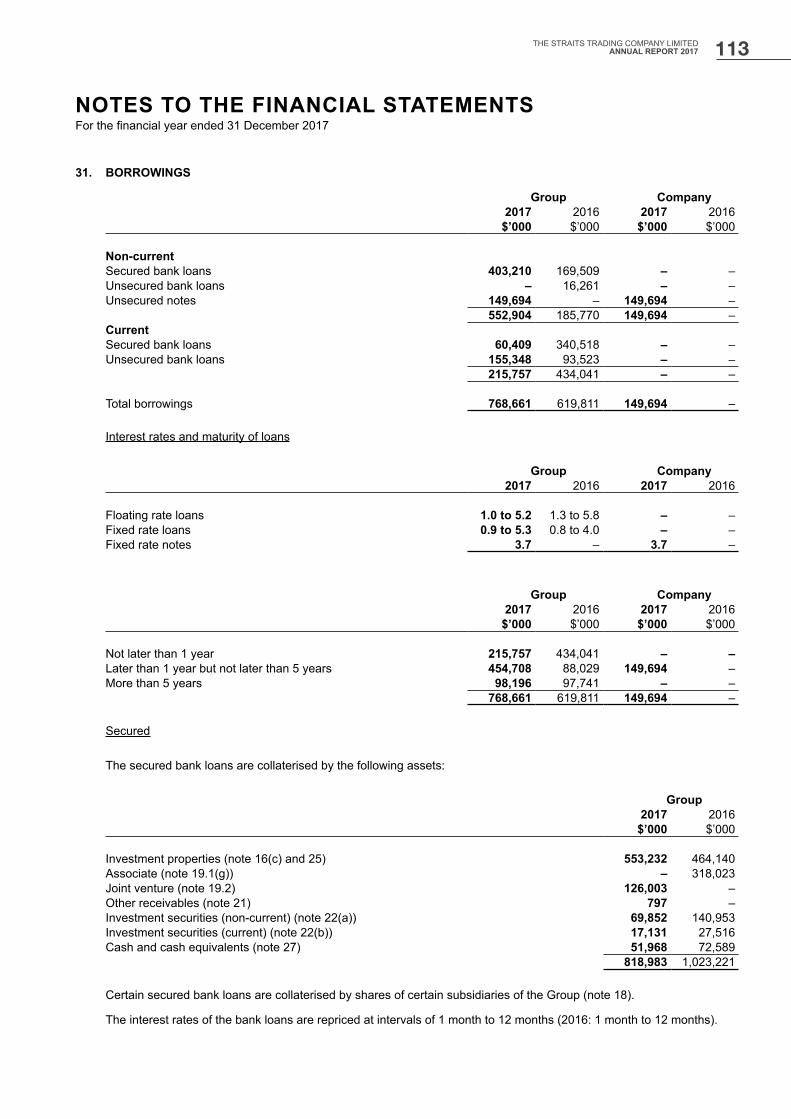
31. BORROWINGS
Group Company2017 2016 2017 2016
$’000 $’000 $’000 $’000
Non-current Secured bank loans 403,210 169,509 – –Unsecured bank loans – 16,261 – –Unsecured notes 149,694 – 149,694 –
552,904 185,770 149,694 –CurrentSecured bank loans 60,409 340,518 – –Unsecured bank loans 155,348 93,523 – –
215,757 434,041 – –
Total borrowings 768,661 619,811 149,694 – Interest rates and maturity of loans
Group Company2017 2016 2017 2016
Floating rate loans 1.0 to 5.2 1.3 to 5.8 – –Fixed rate loans 0.9 to 5.3 0.8 to 4.0 – –Fixed rate notes 3.7 – 3.7 –
Group Company2017 2016 2017 2016
$’000 $’000 $’000 $’000
Not later than 1 year 215,757 434,041 – –Later than 1 year but not later than 5 years 454,708 88,029 149,694 –More than 5 years 98,196 97,741 – –
768,661 619,811 149,694 –
Secured
The secured bank loans are collaterised by the following assets:
Group2017 2016
$’000 $’000
Investment properties (note 16(c) and 25) 553,232 464,140Associate (note 19.1(g)) – 318,023Joint venture (note 19.2) 126,003 –Other receivables (note 21) 797 –Investment securities (non-current) (note 22(a)) 69,852 140,953Investment securities (current) (note 22(b)) 17,131 27,516Cash and cash equivalents (note 27) 51,968 72,589
818,983 1,023,221
Certain secured bank loans are collaterised by shares of certain subsidiaries of the Group (note 18).
The interest rates of the bank loans are repriced at intervals of 1 month to 12 months (2016: 1 month to 12 months).
NOTES TO THE FINANCIAL STATEMENTSFor the financial year ended 31 December 2017
113THE STRAITS TRADING COMPANY LIMITEDANNUAL REPORT 2017
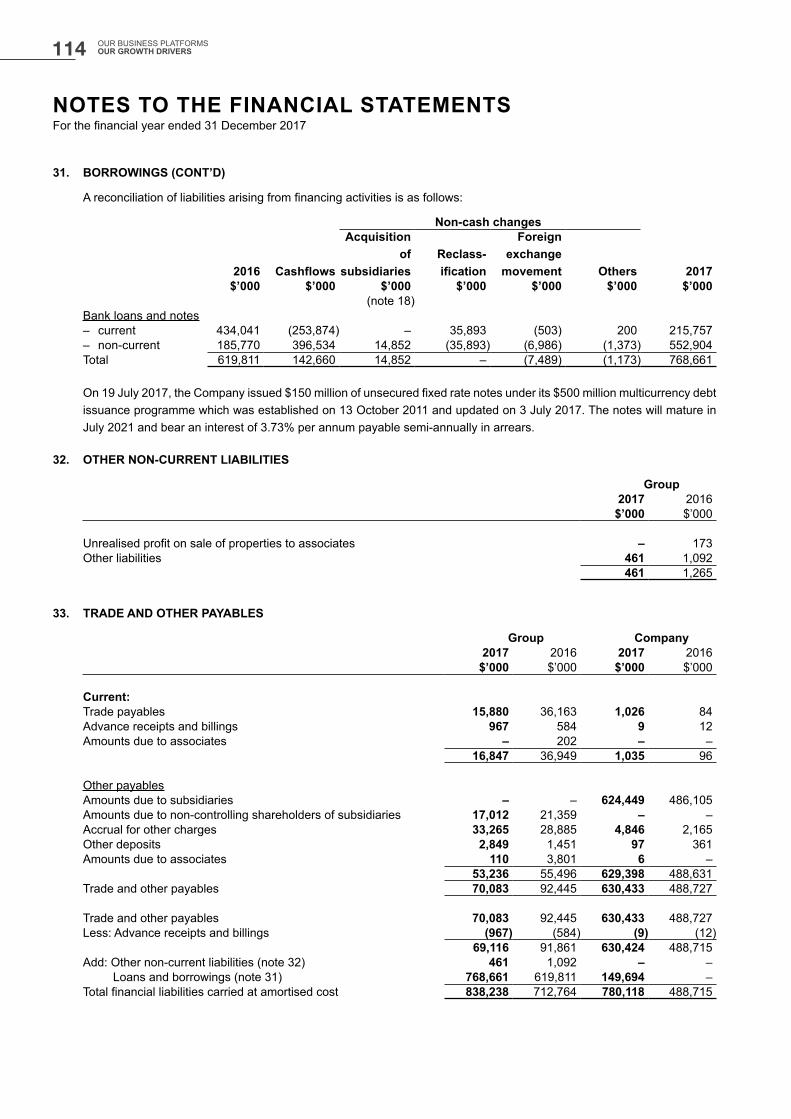
31. BORROWINGS (CONT’D)
A reconciliation of liabilities arising from financing activities is as follows:
Non-cash changes
2016 Cashflows
Acquisition of
subsidiariesReclass-ification
Foreign exchange
movement Others 2017$’000 $’000 $’000 $’000 $’000 $’000 $’000
(note 18)Bank loans and notes– current 434,041 (253,874) – 35,893 (503) 200 215,757– non-current 185,770 396,534 14,852 (35,893) (6,986) (1,373) 552,904Total 619,811 142,660 14,852 – (7,489) (1,173) 768,661
On 19 July 2017, the Company issued $150 million of unsecured fixed rate notes under its $500 million multicurrency debt issuance programme which was established on 13 October 2011 and updated on 3 July 2017. The notes will mature in July 2021 and bear an interest of 3.73% per annum payable semi-annually in arrears.
32. OTHER NON-CURRENT LIABILITIES
Group2017 2016
$’000 $’000
Unrealised profit on sale of properties to associates – 173Other liabilities 461 1,092
461 1,265
33. TRADE AND OTHER PAYABLES
Group Company2017 2016 2017 2016
$’000 $’000 $’000 $’000
Current:Trade payables 15,880 36,163 1,026 84Advance receipts and billings 967 584 9 12Amounts due to associates – 202 – –
16,847 36,949 1,035 96
Other payablesAmounts due to subsidiaries – – 624,449 486,105Amounts due to non-controlling shareholders of subsidiaries 17,012 21,359 – –Accrual for other charges 33,265 28,885 4,846 2,165Other deposits 2,849 1,451 97 361Amounts due to associates 110 3,801 6 –
53,236 55,496 629,398 488,631Trade and other payables 70,083 92,445 630,433 488,727
Trade and other payables 70,083 92,445 630,433 488,727Less: Advance receipts and billings (967) (584) (9) (12)
69,116 91,861 630,424 488,715Add: Other non-current liabilities (note 32) 461 1,092 – –
Loans and borrowings (note 31) 768,661 619,811 149,694 –Total financial liabilities carried at amortised cost 838,238 712,764 780,118 488,715
NOTES TO THE FINANCIAL STATEMENTSFor the financial year ended 31 December 2017
114 OUR BUSINESS PLATFORMS OUR GROWTH DRIVERS
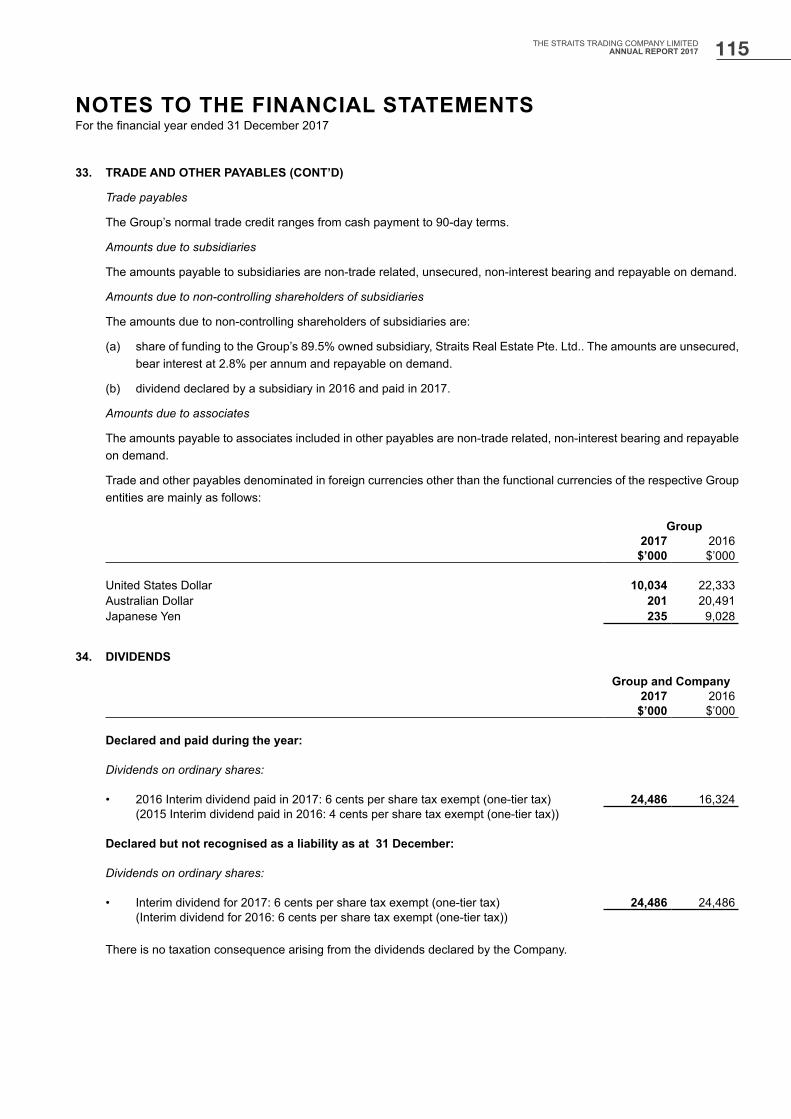
33. TRADE AND OTHER PAYABLES (CONT’D)
Trade payables
The Group’s normal trade credit ranges from cash payment to 90-day terms.
Amounts due to subsidiaries
The amounts payable to subsidiaries are non-trade related, unsecured, non-interest bearing and repayable on demand.
Amounts due to non-controlling shareholders of subsidiaries
The amounts due to non-controlling shareholders of subsidiaries are:
(a) share of funding to the Group’s 89.5% owned subsidiary, Straits Real Estate Pte. Ltd.. The amounts are unsecured, bear interest at 2.8% per annum and repayable on demand.
(b) dividend declared by a subsidiary in 2016 and paid in 2017.
Amounts due to associates
The amounts payable to associates included in other payables are non-trade related, non-interest bearing and repayable on demand.
Trade and other payables denominated in foreign currencies other than the functional currencies of the respective Group entities are mainly as follows:
Group2017 2016
$’000 $’000
United States Dollar 10,034 22,333Australian Dollar 201 20,491Japanese Yen 235 9,028
34. DIVIDENDS
Group and Company2017 2016
$’000 $’000
Declared and paid during the year:
Dividends on ordinary shares:
• 2016 Interim dividend paid in 2017: 6 cents per share tax exempt (one-tier tax) 24,486 16,324(2015 Interim dividend paid in 2016: 4 cents per share tax exempt (one-tier tax))
Declared but not recognised as a liability as at 31 December:
Dividends on ordinary shares:
• Interim dividend for 2017: 6 cents per share tax exempt (one-tier tax) 24,486 24,486(Interim dividend for 2016: 6 cents per share tax exempt (one-tier tax))
There is no taxation consequence arising from the dividends declared by the Company.
NOTES TO THE FINANCIAL STATEMENTSFor the financial year ended 31 December 2017
115THE STRAITS TRADING COMPANY LIMITEDANNUAL REPORT 2017
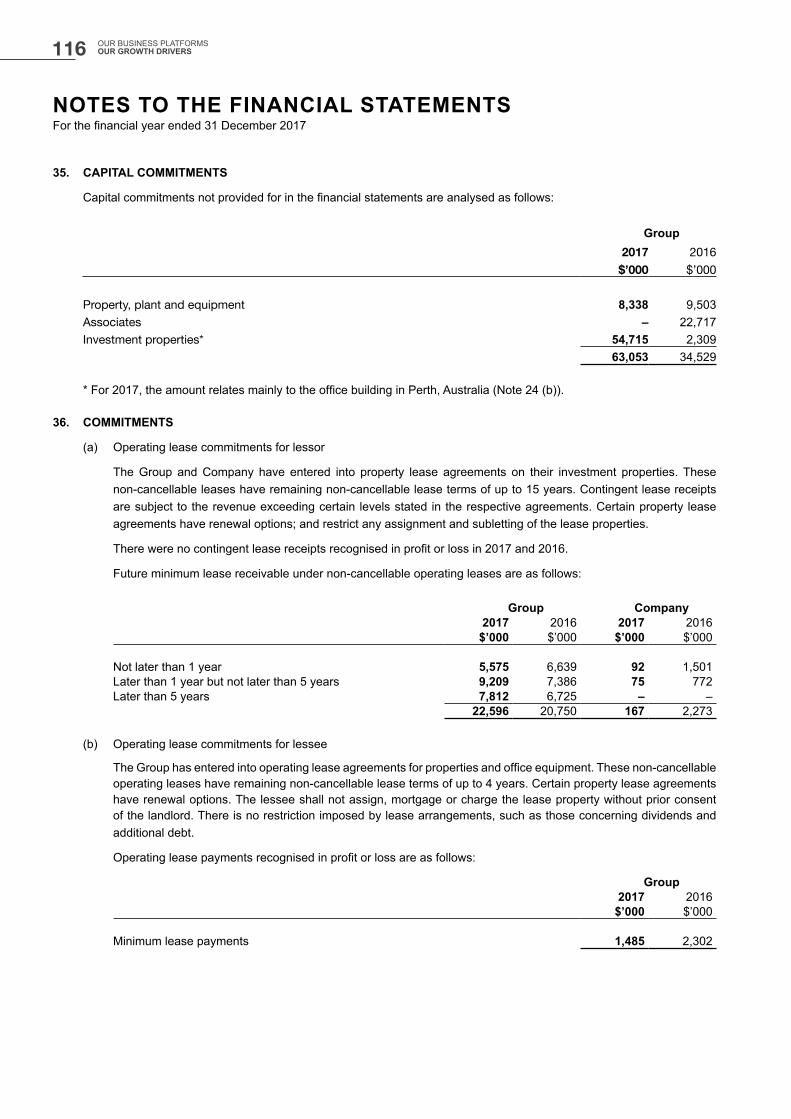
35. CAPITAL COMMITMENTS
Capital commitments not provided for in the financial statements are analysed as follows:
Group2017 2016$’000 $’000
Property, plant and equipment 8,338 9,503Associates – 22,717Investment properties* 54,715 2,309
63,053 34,529
* For 2017, the amount relates mainly to the office building in Perth, Australia (Note 24 (b)).
36. COMMITMENTS
(a) Operating lease commitments for lessor
The Group and Company have entered into property lease agreements on their investment properties. These non-cancellable leases have remaining non-cancellable lease terms of up to 15 years. Contingent lease receipts are subject to the revenue exceeding certain levels stated in the respective agreements. Certain property lease agreements have renewal options; and restrict any assignment and subletting of the lease properties.
There were no contingent lease receipts recognised in profit or loss in 2017 and 2016.
Future minimum lease receivable under non-cancellable operating leases are as follows:
Group Company2017 2016 2017 2016
$’000 $’000 $’000 $’000
Not later than 1 year 5,575 6,639 92 1,501Later than 1 year but not later than 5 years 9,209 7,386 75 772Later than 5 years 7,812 6,725 – –
22,596 20,750 167 2,273
(b) Operating lease commitments for lessee
The Group has entered into operating lease agreements for properties and office equipment. These non-cancellable operating leases have remaining non-cancellable lease terms of up to 4 years. Certain property lease agreements have renewal options. The lessee shall not assign, mortgage or charge the lease property without prior consent of the landlord. There is no restriction imposed by lease arrangements, such as those concerning dividends and additional debt.
Operating lease payments recognised in profit or loss are as follows:
Group2017 2016
$’000 $’000
Minimum lease payments 1,485 2,302
NOTES TO THE FINANCIAL STATEMENTSFor the financial year ended 31 December 2017
116 OUR BUSINESS PLATFORMS OUR GROWTH DRIVERS
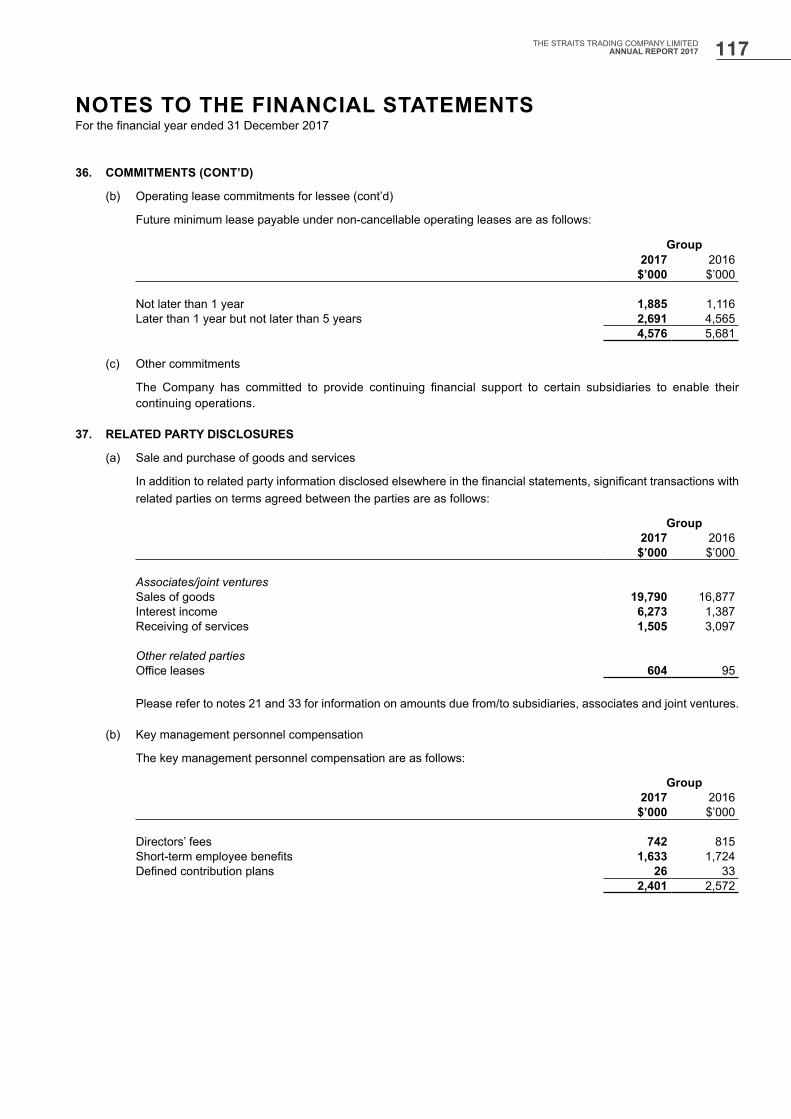
36. COMMITMENTS (CONT’D)
(b) Operating lease commitments for lessee (cont’d)
Future minimum lease payable under non-cancellable operating leases are as follows:
Group2017 2016
$’000 $’000
Not later than 1 year 1,885 1,116Later than 1 year but not later than 5 years 2,691 4,565
4,576 5,681
(c) Other commitments
The Company has committed to provide continuing financial support to certain subsidiaries to enable their continuing operations.
37. RELATED PARTY DISCLOSURES
(a) Sale and purchase of goods and services
In addition to related party information disclosed elsewhere in the financial statements, significant transactions with related parties on terms agreed between the parties are as follows:
Group2017 2016
$’000 $’000
Associates/joint ventures Sales of goods 19,790 16,877Interest income 6,273 1,387Receiving of services 1,505 3,097
Other related partiesOffice leases 604 95
Please refer to notes 21 and 33 for information on amounts due from/to subsidiaries, associates and joint ventures.
(b) Key management personnel compensation
The key management personnel compensation are as follows:
Group2017 2016
$’000 $’000
Directors’ fees 742 815Short-term employee benefits 1,633 1,724Defined contribution plans 26 33
2,401 2,572
NOTES TO THE FINANCIAL STATEMENTSFor the financial year ended 31 December 2017
117THE STRAITS TRADING COMPANY LIMITEDANNUAL REPORT 2017

38. FINANCIAL RISK MANAGEMENT
The Group’s activities expose it to a variety of financial risks. Apart from those risks generated from operations such as extending credits and cash flow management, other risks include the effects of changes in debt and equity market prices, foreign currency exchange rates, interest rates and commodity prices.
The Group’s management monitors its financial position closely with an objective to minimise potential adverse effects on the financial performance of the Group. The Group uses derivative financial instruments, where appropriate, for its risk management activities.
There has been no change to the Group’s exposure to these risks or the manner in which it manages the risks.
The policies for managing these risks are summarised below.
(a) Foreign exchange risk
The Group operates mainly in Asia Pacific and has exposure to foreign exchange risk as a result of sales or purchase transactions that are denominated in a currency other than the functional currencies of the respective Group entities. These foreign exchange risk exposures are mainly in United States Dollar, Australian Dollar, Singapore Dollar and Japanese Yen. The Group uses forward currency contracts to manage these exposures where appropriate. The Group also uses loans in foreign currency to hedge its exposure to foreign exchange risk on investments in foreign operations where appropriate.
Sensitivity analysis for foreign currency risk
The following table demonstrates the sensitivity of the Group’s profit after tax and equity to a reasonably possible change in the exchange rates of the United States Dollar, Australian Dollar, Singapore Dollar and Japanese Yen against the functional currencies of the respective Group entities, with all other variables held constant.
Group2017 2016
Profit after tax Equity
Profit after tax Equity
$’000 $’000 $’000 $’000
United States Dollarstrengthened 5% (2016: 5%) 99 – (2,402) (1,569)weakened 5% (2016: 5%) (99) – 2,132 2,411
Australian Dollar strengthened 5% (2016: 5%) 5,456 – 1,921 –weakened 5% (2016: 5%) (5,456) – (1,921) –
Singapore Dollar strengthened 5% (2016: 5%) (279) (837) 470 (837)weakened 5% (2016: 5%) 279 837 (470) 837
Japanese Yen strengthened 5% (2016: 5%) 217 (2,769) 195 (3,304)weakened 5% (2016: 5%) (217) 2,769 (195) 3,304
At the end of the reporting period, approximately:
(i) 4% (2016: 12%) of the Group’s trade and other receivables as well as 15% (2016: 56%) of the Group’s trade and other payables are denominated in foreign currencies other than the functional currencies of the respective Group entities, mainly in United States Dollar.
(ii) 8% (2016: 13%) of the Group’s cash and cash equivalents are denominated in foreign currencies other than the functional currencies of the respective Group entities, mainly in Singapore Dollar, United States Dollar, Japanese Yen and Australian Dollar.
(iii) 13% (2016: 17%) of the Group’s borrowings are denominated in foreign currencies other than the functional currencies of the respective Group entities, mainly in Singapore Dollar, Japanese Yen and Australian Dollar.
NOTES TO THE FINANCIAL STATEMENTSFor the financial year ended 31 December 2017
118 OUR BUSINESS PLATFORMS OUR GROWTH DRIVERS
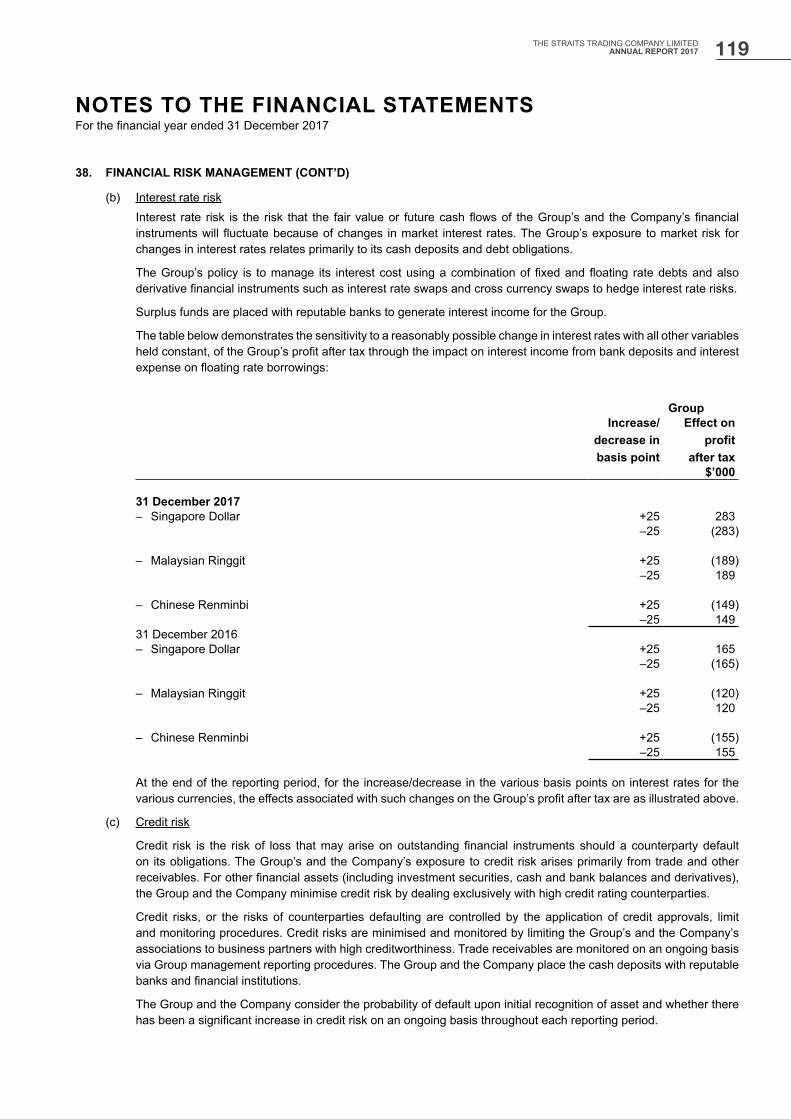
38. FINANCIAL RISK MANAGEMENT (CONT’D)
(b) Interest rate riskInterest rate risk is the risk that the fair value or future cash flows of the Group’s and the Company’s financial instruments will fluctuate because of changes in market interest rates. The Group’s exposure to market risk for changes in interest rates relates primarily to its cash deposits and debt obligations.
The Group’s policy is to manage its interest cost using a combination of fixed and floating rate debts and also derivative financial instruments such as interest rate swaps and cross currency swaps to hedge interest rate risks.
Surplus funds are placed with reputable banks to generate interest income for the Group.
The table below demonstrates the sensitivity to a reasonably possible change in interest rates with all other variables held constant, of the Group’s profit after tax through the impact on interest income from bank deposits and interest expense on floating rate borrowings:
GroupIncrease/
decrease in basis point
Effect on profit
after tax$’000
31 December 2017– Singapore Dollar +25 283
–25 (283)
– Malaysian Ringgit +25 (189)–25 189
– Chinese Renminbi +25 (149)–25 149
31 December 2016– Singapore Dollar +25 165
–25 (165)
– Malaysian Ringgit +25 (120)–25 120
– Chinese Renminbi +25 (155)–25 155
At the end of the reporting period, for the increase/decrease in the various basis points on interest rates for the various currencies, the effects associated with such changes on the Group’s profit after tax are as illustrated above.
(c) Credit risk
Credit risk is the risk of loss that may arise on outstanding financial instruments should a counterparty default on its obligations. The Group’s and the Company’s exposure to credit risk arises primarily from trade and other receivables. For other financial assets (including investment securities, cash and bank balances and derivatives), the Group and the Company minimise credit risk by dealing exclusively with high credit rating counterparties.
Credit risks, or the risks of counterparties defaulting are controlled by the application of credit approvals, limit and monitoring procedures. Credit risks are minimised and monitored by limiting the Group’s and the Company’s associations to business partners with high creditworthiness. Trade receivables are monitored on an ongoing basis via Group management reporting procedures. The Group and the Company place the cash deposits with reputable banks and financial institutions.
The Group and the Company consider the probability of default upon initial recognition of asset and whether there has been a significant increase in credit risk on an ongoing basis throughout each reporting period.
NOTES TO THE FINANCIAL STATEMENTSFor the financial year ended 31 December 2017
119THE STRAITS TRADING COMPANY LIMITEDANNUAL REPORT 2017
38. FINANCIAL RISK MANAGEMENT (CONT’D)
(c) Credit risk (cont’d)
The Group and the Company have determined the default event on a financial asset to be when the counterparty fails to make contractual payments, within 90 days when they fall due.
The Group’s debt securities at amortised cost have low risk of default. To assess whether there is a significant increase in credit risk, the Group and the Company compare the risk of a default occurring on the asset as at reporting date with the risk of default as at the date of initial recognition. The Group and the Company consider available reasonable and supportive forward-looking information which include the following indicators:
– Internal credit rating– External credit rating– Actual or expected significant adverse changes in business, financial or economic conditions that are expected
to cause a significant change to the debtor’s ability to meet its obligations– Actual or expected significant changes in the operating results of the debtor– Significant increases in credit risk on other financial instruments of the same debtor– Significant changes in the value of the collateral supporting the obligation or in the quality of third-party
guarantees or credit enhancements– Significant changes in the expected performance and behaviour of the debtor, including changes in the
payment status of debtors in the group and changes in the operating results of the debtor.
Regardless of the analysis above, a significant increase in credit risk is presumed if a debtor is more than 30 days due in making contractual payment.
The Group and the Company determined that its financial assets are credit-impaired when:
– There is significant financial difficulty of the debtor
– A breach of contract, such as a default or past due event
– It is becoming probable that the debtor will enter bankruptcy or other financial reorganisation
– There is disappearance of an active market for that financial asset because of financial difficulty.
Financial assets are written off when there is no reasonable expectation of recovery, such as a debtor failing to meet a repayment plan with the Group and the Company. Where loans and receivables have been written off, the Group and the Company continue to engage enforcement activity to attempt to recover the receivables due. Where recoveries are made, these are recognised in profit or loss.
The following are credit risk management practices and quantitative and qualitative information about amounts arising from expected credit losses for trade and other receivables:
– The Group and the Company provide for 12-month expected credit losses for all trade and other receivables (excluding deposits and GST recoverable). The 12-month expected credit losses have taken into consideration historical loss rate statistics for debts with similar credit profile and the country risk of the debtors.
– For receivables which are lower risk, the probability of default (“PD”) is minimal.
– For receivables which are higher risk, the PD rates ranging from 2.5% to 50% are applied if a receivable is more than 90 days to 360 days.
– The Group and the Company do not expect to receive future cash flows from and no recoveries from collection of cash flows previously written off.
The Group’s debt securities at amortised cost have low risk of default and a strong capacity to meet contractual cash flows. Hence the loss allowance is determined at an amount equal to 12-month ECL.
NOTES TO THE FINANCIAL STATEMENTSFor the financial year ended 31 December 2017
120 OUR BUSINESS PLATFORMS OUR GROWTH DRIVERS
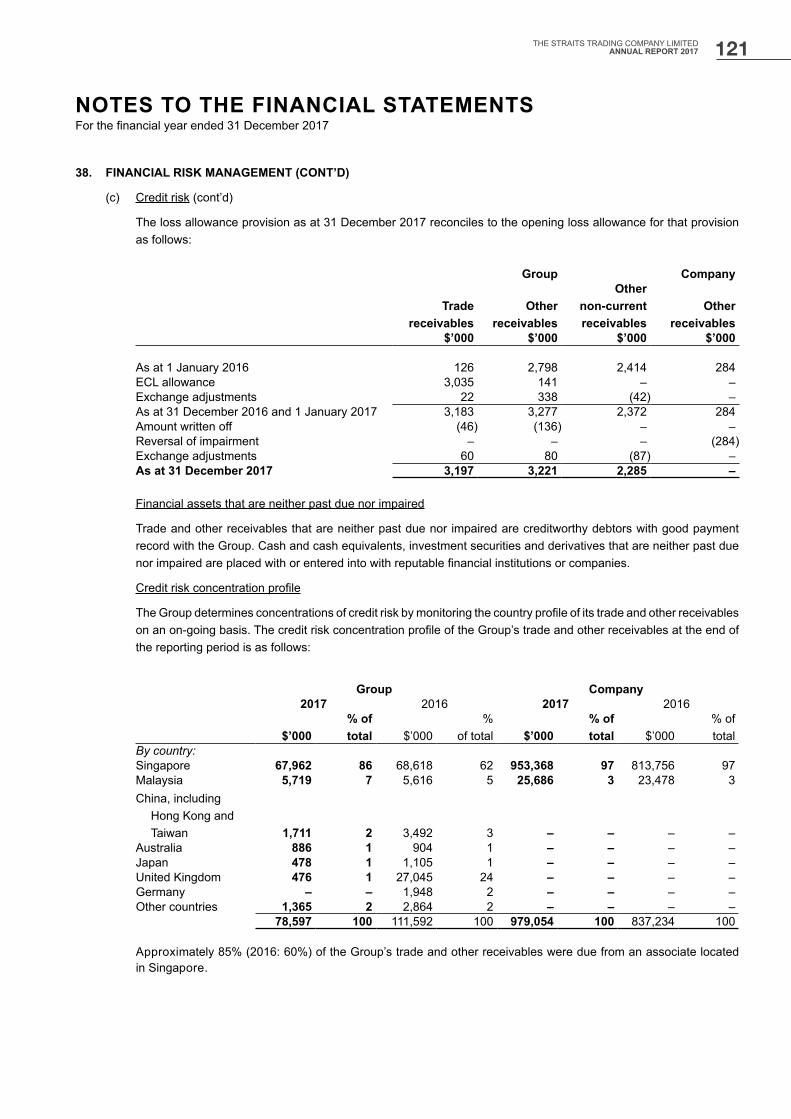
38. FINANCIAL RISK MANAGEMENT (CONT’D)
(c) Credit risk (cont’d)
The loss allowance provision as at 31 December 2017 reconciles to the opening loss allowance for that provision as follows:
Group Company
Trade receivables
Other receivables
Othernon-current receivables
Other receivables
$’000 $’000 $’000 $’000
As at 1 January 2016 126 2,798 2,414 284ECL allowance 3,035 141 – –Exchange adjustments 22 338 (42) –As at 31 December 2016 and 1 January 2017 3,183 3,277 2,372 284Amount written off (46) (136) – –Reversal of impairment – – – (284)Exchange adjustments 60 80 (87) –As at 31 December 2017 3,197 3,221 2,285 –
Financial assets that are neither past due nor impaired
Trade and other receivables that are neither past due nor impaired are creditworthy debtors with good payment record with the Group. Cash and cash equivalents, investment securities and derivatives that are neither past due nor impaired are placed with or entered into with reputable financial institutions or companies.
Credit risk concentration profile
The Group determines concentrations of credit risk by monitoring the country profile of its trade and other receivables on an on-going basis. The credit risk concentration profile of the Group’s trade and other receivables at the end of the reporting period is as follows:
Group Company2017 2016 2017 2016
$’000% of total $’000
%of total $’000
% of total $’000
% of total
By country:Singapore 67,962 86 68,618 62 953,368 97 813,756 97Malaysia 5,719 7 5,616 5 25,686 3 23,478 3China, including
Hong Kong and Taiwan 1,711 2 3,492 3 – – – –
Australia 886 1 904 1 – – – –Japan 478 1 1,105 1 – – – –United Kingdom 476 1 27,045 24 – – – –Germany – – 1,948 2 – – – –Other countries 1,365 2 2,864 2 – – – –
78,597 100 111,592 100 979,054 100 837,234 100
Approximately 85% (2016: 60%) of the Group’s trade and other receivables were due from an associate located in Singapore.
NOTES TO THE FINANCIAL STATEMENTSFor the financial year ended 31 December 2017
121THE STRAITS TRADING COMPANY LIMITEDANNUAL REPORT 2017
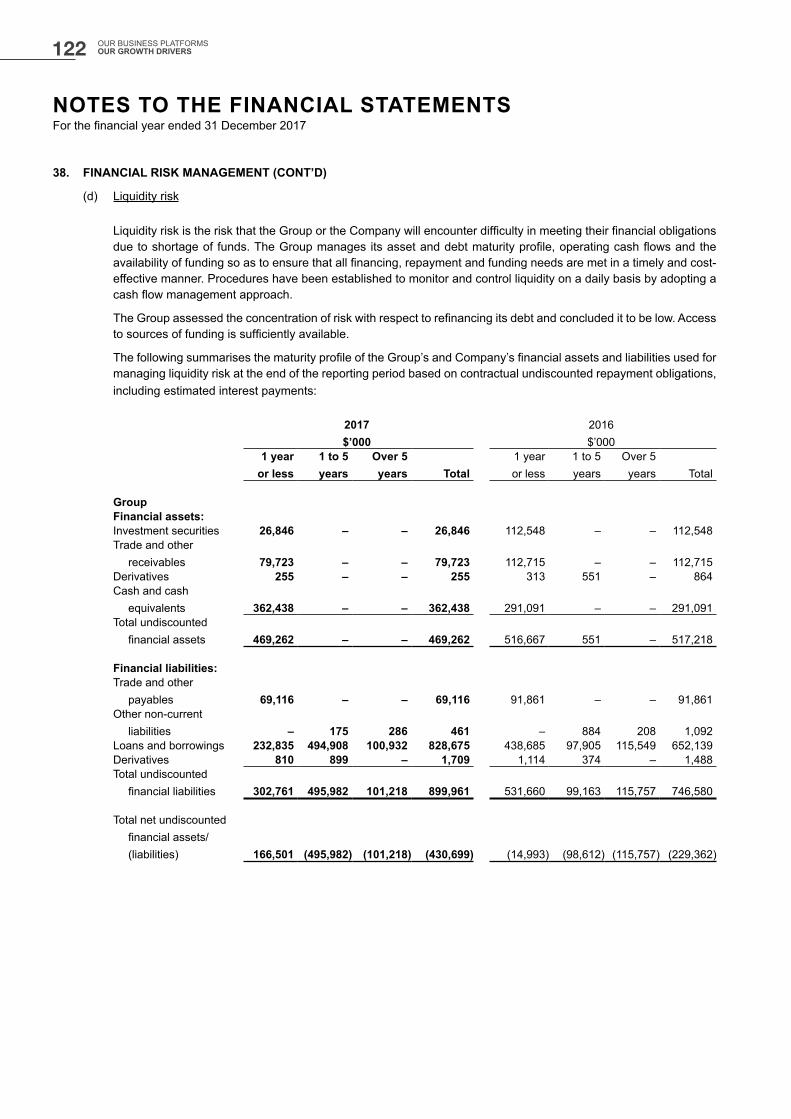
38. FINANCIAL RISK MANAGEMENT (CONT’D)
(d) Liquidity risk
Liquidity risk is the risk that the Group or the Company will encounter difficulty in meeting their financial obligations due to shortage of funds. The Group manages its asset and debt maturity profile, operating cash flows and the availability of funding so as to ensure that all financing, repayment and funding needs are met in a timely and cost-effective manner. Procedures have been established to monitor and control liquidity on a daily basis by adopting a cash flow management approach.
The Group assessed the concentration of risk with respect to refinancing its debt and concluded it to be low. Access to sources of funding is sufficiently available.
The following summarises the maturity profile of the Group’s and Company’s financial assets and liabilities used for managing liquidity risk at the end of the reporting period based on contractual undiscounted repayment obligations, including estimated interest payments:
2017$’000
2016$’000
1 yearor less
1 to 5 years
Over 5 years Total
1 yearor less
1 to 5 years
Over 5 years Total
GroupFinancial assets:Investment securities 26,846 – – 26,846 112,548 – – 112,548Trade and other
receivables 79,723 – – 79,723 112,715 – – 112,715Derivatives 255 – – 255 313 551 – 864Cash and cash
equivalents 362,438 – – 362,438 291,091 – – 291,091Total undiscounted
financial assets 469,262 – – 469,262 516,667 551 – 517,218
Financial liabilities:Trade and other
payables 69,116 – – 69,116 91,861 – – 91,861Other non-current
liabilities – 175 286 461 – 884 208 1,092Loans and borrowings 232,835 494,908 100,932 828,675 438,685 97,905 115,549 652,139Derivatives 810 899 – 1,709 1,114 374 – 1,488Total undiscounted
financial liabilities 302,761 495,982 101,218 899,961 531,660 99,163 115,757 746,580
Total net undiscounted financial assets/ (liabilities) 166,501 (495,982) (101,218) (430,699) (14,993) (98,612) (115,757) (229,362)
NOTES TO THE FINANCIAL STATEMENTSFor the financial year ended 31 December 2017
122 OUR BUSINESS PLATFORMS OUR GROWTH DRIVERS
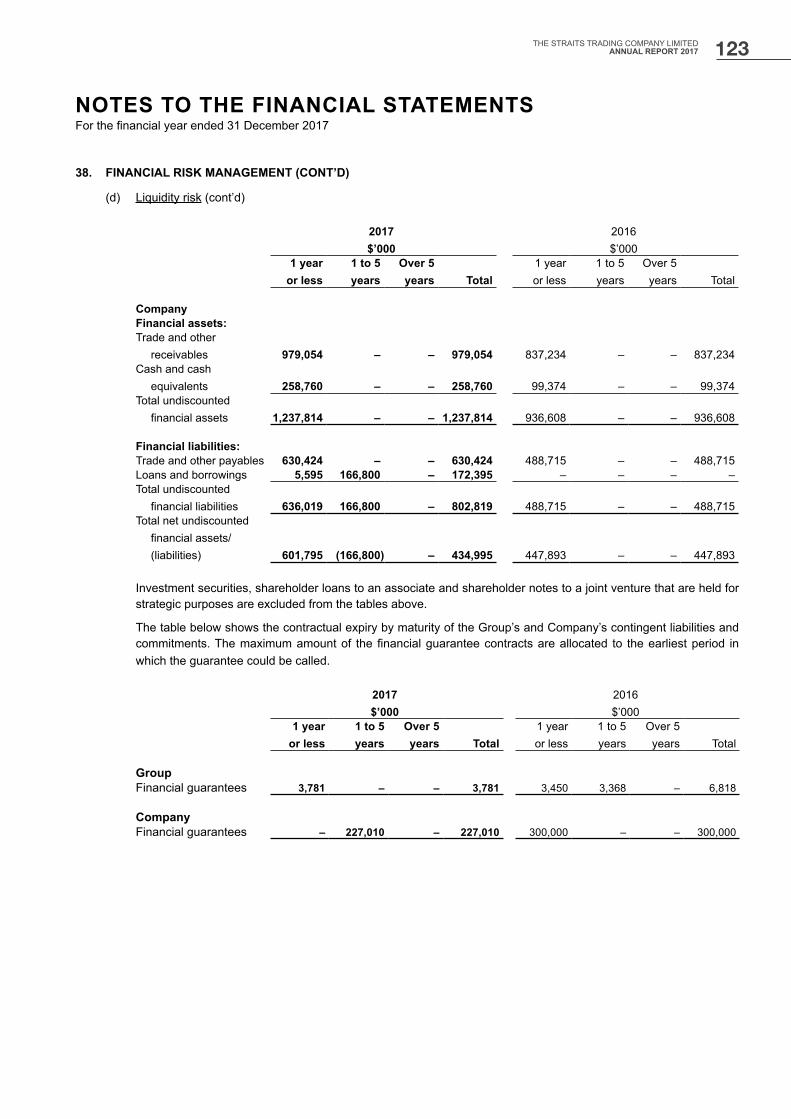
38. FINANCIAL RISK MANAGEMENT (CONT’D)
(d) Liquidity risk (cont’d)
2017$’000
2016$’000
1 yearor less
1 to 5 years
Over 5 years Total
1 yearor less
1 to 5 years
Over 5 years Total
CompanyFinancial assets:Trade and other
receivables 979,054 – – 979,054 837,234 – – 837,234Cash and cash
equivalents 258,760 – – 258,760 99,374 – – 99,374Total undiscounted
financial assets 1,237,814 – – 1,237,814 936,608 – – 936,608
Financial liabilities:Trade and other payables 630,424 – – 630,424 488,715 – – 488,715Loans and borrowings 5,595 166,800 – 172,395 – – – –Total undiscounted
financial liabilities 636,019 166,800 – 802,819 488,715 – – 488,715Total net undiscounted
financial assets/ (liabilities) 601,795 (166,800) – 434,995 447,893 – – 447,893
Investment securities, shareholder loans to an associate and shareholder notes to a joint venture that are held for strategic purposes are excluded from the tables above.
The table below shows the contractual expiry by maturity of the Group’s and Company’s contingent liabilities and commitments. The maximum amount of the financial guarantee contracts are allocated to the earliest period in which the guarantee could be called.
2017$’000
2016$’000
1 yearor less
1 to 5 years
Over 5 years Total
1 yearor less
1 to 5 years
Over 5 years Total
GroupFinancial guarantees 3,781 – – 3,781 3,450 3,368 – 6,818
CompanyFinancial guarantees – 227,010 – 227,010 300,000 – – 300,000
NOTES TO THE FINANCIAL STATEMENTSFor the financial year ended 31 December 2017
123THE STRAITS TRADING COMPANY LIMITEDANNUAL REPORT 2017
38. FINANCIAL RISK MANAGEMENT (CONT’D)
(e) Equity price risk
Changes in the market value of investment securities can affect the net income and financial position of the Group. The Group diversifies its investments by business sector and by country. It manages the risk of unfavourable changes by prudent review of the investments before investing and continuous monitoring of their performance and risk profiles.
The investment securities that are subject to equity price risk are classified as either FVTPL or FVOCI financial assets.
At the end of the reporting period, the Group’s equity portfolio classified as FVTPL consists of shares of companies in Singapore of 60% (2016: 54%), United States 14% (2016: nil%), Australia 12% (2016: 22%), Japan 12% (2016: 8%), nil from China, Hong Kong (2016: 10%) and 2% (2016: 6%) in other countries. If the equity prices had been 5% higher/lower with all other variables held constant, the Group’s profit after tax would have been $668,000 (2016: $4,707,000) higher/lower, arising as a result of higher/lower fair value changes.
At the end of the reporting period, 97% (2016: 96%) of the Group’s equity portfolio classified as FVOCI consists of shares of companies in Singapore and 3% (2016: 4%) in Canada. If the Singapore and Canada equity prices had been 5% higher/lower with all other variables held constant, the Group’s other comprehensive income or FVOCI reserve in equity would have been $11,932,000 (2016: $7,963,000) higher/lower, arising as a result of higher/lower fair value changes.
(f) Commodity price risk
Commodity price risk is the risk of financial loss resulting from movements in the price of the Group’s commodity inputs and outputs. The Group is exposed to commodity price risk on revenue for sales of tin as well as production cost for fuel consumed in the operations.
The commodity price risk on revenue for sales of tin is managed through contractual arrangements with customers and forward commodity contracts. At the reporting date, there was no such contract outstanding.
The commodity price risk on production cost for fuel is managed through forward commodity contracts. The terms of the forward commodity contracts have been negotiated to match the terms of the commitments. There were no highly probable transactions for which hedge accounting had previously been used, which are no longer expected to occur. At the reporting date, there was no such contract outstanding.
(g) Capital management
Capital includes debt and equity items as disclosed in the following table.
The Group’s objective is to provide a reasonable return to shareholders by investing into businesses that commensurate with the level of risks. This also takes into account synergies with other operations and activities, the availability of management and other resources, and the fit of the activities with the Group’s longer strategic objectives.
The Group’s policy is to maintain a strong capital base so as to maintain investors, creditors and market confidence and to sustain future development of the various core businesses. The Group allocates the amount of capital in proportion to risk, manages the capital structure and makes adjustments to it in light of changes in economic conditions and the risk characteristic of the underlying assets. In order to maintain or adjust the capital structure, the Group may adjust the amount of dividends paid to shareholders, return capital to shareholders, issue new shares, sell assets or increase borrowings. The Group monitors the return of capital, which is defined as total shareholders’ equity (excluding non-controlling interests), gearing ratio, which is defined as borrowings net of cash over total equity and the level of dividends to shareholders. No changes were made in the objectives, policies or processes during the financial years ended 31 December 2017 and 31 December 2016.
The Group seeks to maintain a balance between the higher returns that might be possible with higher level of borrowings and the advantages and security afforded by a sound capital position.
The Group’s subsidiaries in The People’s Republic of China (PRC) are subject to foreign exchange rules and regulations promulgated by the PRC government which may impact how the Group manages capital. These subsidiaries have complied with the applicable capital requirements throughout the year.
NOTES TO THE FINANCIAL STATEMENTSFor the financial year ended 31 December 2017
124 OUR BUSINESS PLATFORMS OUR GROWTH DRIVERS
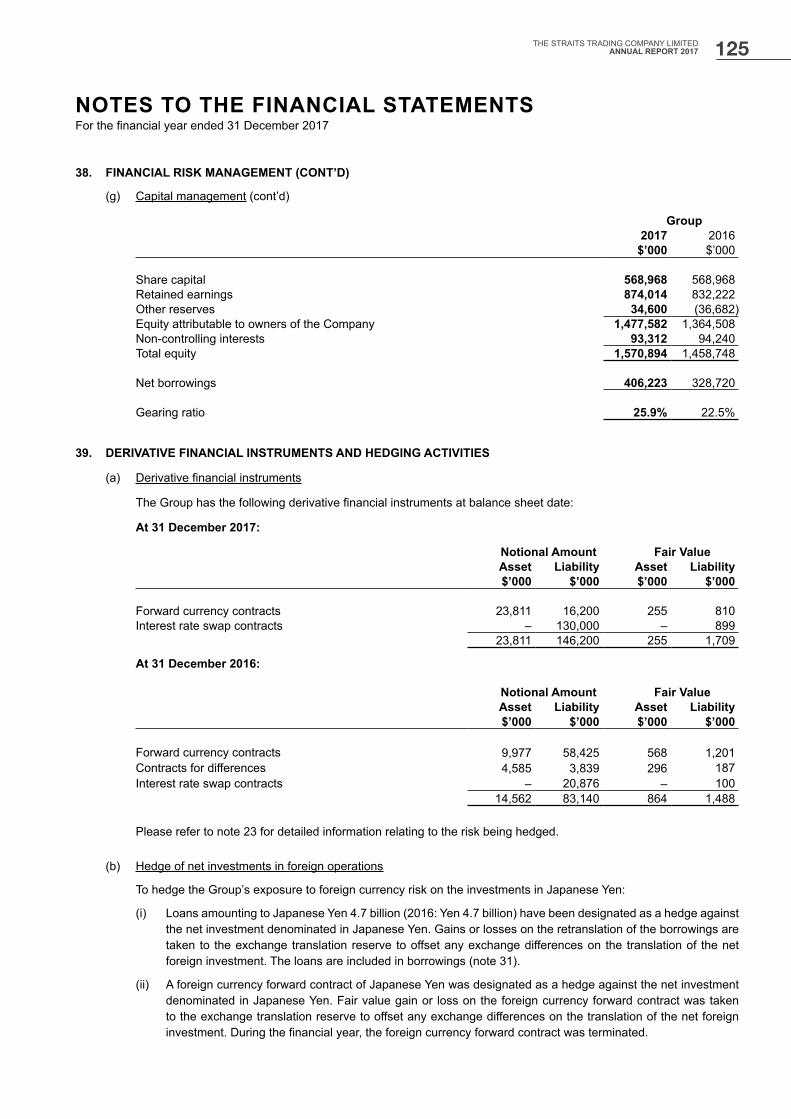
38. FINANCIAL RISK MANAGEMENT (CONT’D)
(g) Capital management (cont’d)
Group2017 2016
$’000 $’000
Share capital 568,968 568,968Retained earnings 874,014 832,222Other reserves 34,600 (36,682)Equity attributable to owners of the Company 1,477,582 1,364,508Non-controlling interests 93,312 94,240Total equity 1,570,894 1,458,748
Net borrowings 406,223 328,720
Gearing ratio 25.9% 22.5%
39. DERIVATIVE FINANCIAL INSTRUMENTS AND HEDGING ACTIVITIES
(a) Derivative financial instruments
The Group has the following derivative financial instruments at balance sheet date:
At 31 December 2017:
Notional Amount Fair ValueAsset Liability Asset Liability$’000 $’000 $’000 $’000
Forward currency contracts 23,811 16,200 255 810Interest rate swap contracts – 130,000 – 899
23,811 146,200 255 1,709
At 31 December 2016:
Notional Amount Fair ValueAsset Liability Asset Liability$’000 $’000 $’000 $’000
Forward currency contracts 9,977 58,425 568 1,201Contracts for differences 4,585 3,839 296 187Interest rate swap contracts – 20,876 – 100
14,562 83,140 864 1,488
Please refer to note 23 for detailed information relating to the risk being hedged.
(b) Hedge of net investments in foreign operations
To hedge the Group’s exposure to foreign currency risk on the investments in Japanese Yen:
(i) Loans amounting to Japanese Yen 4.7 billion (2016: Yen 4.7 billion) have been designated as a hedge against the net investment denominated in Japanese Yen. Gains or losses on the retranslation of the borrowings are taken to the exchange translation reserve to offset any exchange differences on the translation of the net foreign investment. The loans are included in borrowings (note 31).
(ii) A foreign currency forward contract of Japanese Yen was designated as a hedge against the net investment denominated in Japanese Yen. Fair value gain or loss on the foreign currency forward contract was taken to the exchange translation reserve to offset any exchange differences on the translation of the net foreign investment. During the financial year, the foreign currency forward contract was terminated.
NOTES TO THE FINANCIAL STATEMENTSFor the financial year ended 31 December 2017
125THE STRAITS TRADING COMPANY LIMITEDANNUAL REPORT 2017
40. SIGNIFICANT ACCOUNTING ESTIMATES AND JUDGEMENTS
(a) Estimation uncertainty
The key assumptions concerning the future and other key sources of estimation uncertainty at the end of the reporting period are discussed below. The Group based its assumptions and estimates on parameters available when the financial statements were prepared. Existing circumstances and assumptions about future developments, however, may change due to market changes or circumstances arising beyond the control of the Group. Such changes are reflected in the assumptions when they occur.
(i) Impairment of goodwill
The Group determines whether goodwill is impaired at least on an annual basis. The recoverable amount of the cash-generating unit is determined based on fair value less cost to sell which include a control premium adjustment. Management also reviews other economic factors and market conditions to assess whether the recoverable amount as determined using this method is sustainable. Changes in the market value of the cash-generating unit could affect the recoverable amount. The carrying amount of goodwill at 31 December 2017 was $17,629,000 (2016: $17,298,000).
(ii) Depreciation of property, plant and equipment
Property, plant and equipment are depreciated using the appropriate basis as outlined in note 2.10 over the estimated useful lives of these assets. The carrying amount of the Group’s property, plant and equipment at 31 December 2017 was $54,788,000 (2016: $52,737,000).
The cost of plant and machinery for tin smelting and refining is depreciated on a straight-line basis over the assets’ useful lives. Management estimates the useful lives of these plant and machinery to be within 8 to 40 years. These are common life expectancies applied in such industry. Changes in the expected level of usage and timing of relocation to Pulau Indah could impact the economic useful lives and the residual values of these assets, therefore future depreciation charge could be revised.
In the tin mining subsidiaries, plant and equipment used in mining are depreciated using the unit-of-production method based on economically recoverable ore reserves and resources over the estimated useful lives of the assets. Changes in estimated economically recoverable ore reserves and resources and useful lives of plant and equipment are accounted for on a prospective basis from the beginning of the year in which the changes arise. Changes in the estimated economically recoverable ore reserves and resources and the expected level of usage could impact the economic useful lives and the residual values of these assets, therefore future depreciation charge could be revised.
The carrying amount of property, plant and equipment related to the subsidiary in resources business amounts to $52,744,000 (2016: $50,252,000).
(iii) Revaluation of properties
The Group carries its properties at fair value. Changes in fair values of investment properties are recognised in profit or loss and changes in fair values of the other properties are recognised in other comprehensive income respectively.
The fair values of properties are determined by independent real estate valuation experts using recognised valuation techniques. These techniques comprise comparison method, investment method, residual method, direct capitalisation method, discounted cash flow method and depreciated replacement cost method.
NOTES TO THE FINANCIAL STATEMENTSFor the financial year ended 31 December 2017
126 OUR BUSINESS PLATFORMS OUR GROWTH DRIVERS
40. SIGNIFICANT ACCOUNTING ESTIMATES AND JUDGEMENTS (CONT’D)
(a) Estimation uncertainty (cont’d)
(iii) Revaluation of properties (cont’d)
The determination of the fair values of the properties requires the use of estimates such as:
– sales of similar properties that have been transacted in the open market with adjustment made for differences in factors that affect value;
– an estimate of the current market value of the land, plus the current gross replacement of improvements, less allowances for physical deterioration, obsolescence and optimisation;
– capitalisation of net rental income taking into consideration such as vacancy rates and rental growth rates; and
– estimation of net income stream over a period and discounting the net income stream; taking into consideration a range of assumptions such as terminal yield rate, discount rate, years purchase multipler, rental growth, and estimated development cost where applicable.
(iv) Inventories
Significant management judgement and estimation are required in applying: (i) valuation techniques to determine the valuation of tin-in-concentrates, tin-in-process and refined tin metal; and (ii) the timing of recognition of tin-in-concentrates based on the terms of the contracts.
Inventories are written down when events or changes in circumstances indicate that the carrying amounts may not be recoverable. Where actual amount differs from the original estimates, the differences will impact the carrying amount of inventories. The carrying amount of inventories at the reporting date is disclosed in note 26.
(v) Provision for mine restoration costs
Provision for mine restoration costs is provided based on the present value of the estimated future expenditure to be incurred subsequent to the cessation of production. Significant management judgement and estimation are required in determining the future expenditure, the cessation date of production and the discount rate. The subsidiary has engaged a South Korean consultant specialising in mine restoration to carry out assessment on the mine restoration plan. The mine restoration plan was resubmitted by the subsidiary to the relevant authorities during the year ended 31 December 2017. The carrying amount of provision for mine restoration costs is disclosed in note 30. As the mine restoration plan is still pending approval from the relevant authorities, the final amount cannot be determined at this juncture. Where expectations from the relevant authorities differ from the plan submitted or actual amount differs from the original estimates, the differences may significantly impact the carrying amount of provision for mine restoration costs.
NOTES TO THE FINANCIAL STATEMENTSFor the financial year ended 31 December 2017
127THE STRAITS TRADING COMPANY LIMITEDANNUAL REPORT 2017
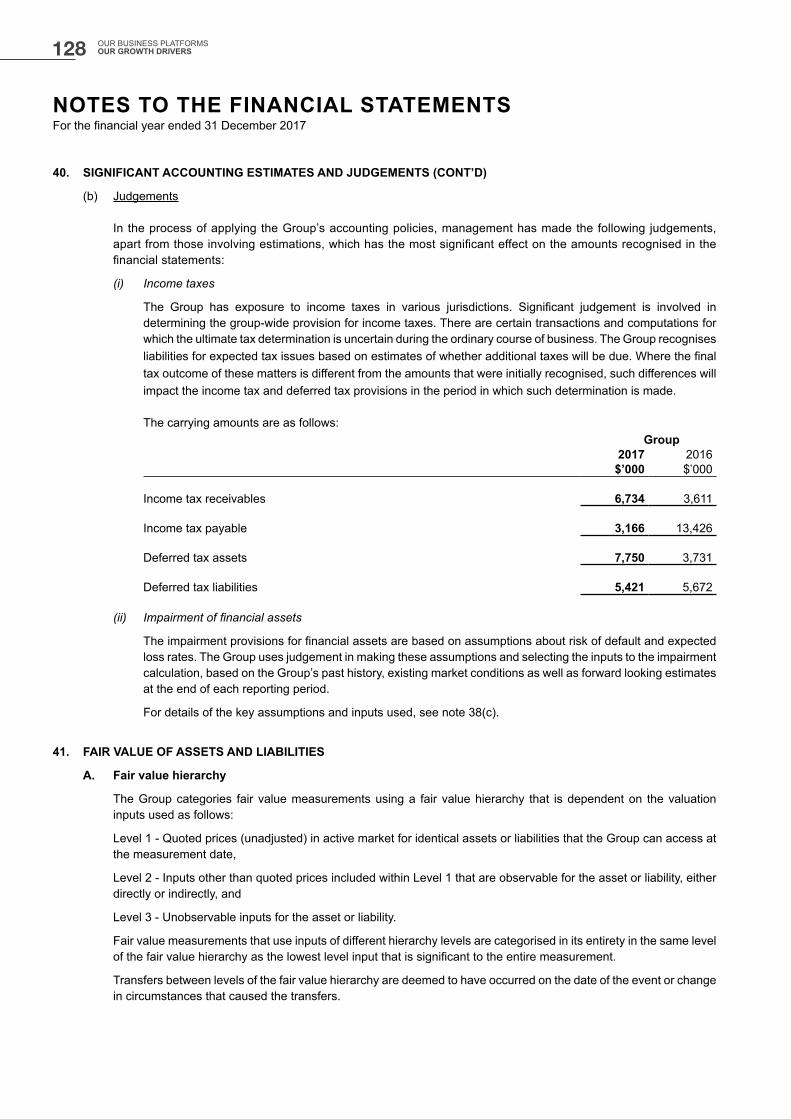
40. SIGNIFICANT ACCOUNTING ESTIMATES AND JUDGEMENTS (CONT’D)
(b) Judgements
In the process of applying the Group’s accounting policies, management has made the following judgements, apart from those involving estimations, which has the most significant effect on the amounts recognised in the financial statements:
(i) Income taxes
The Group has exposure to income taxes in various jurisdictions. Significant judgement is involved in determining the group-wide provision for income taxes. There are certain transactions and computations for which the ultimate tax determination is uncertain during the ordinary course of business. The Group recognises liabilities for expected tax issues based on estimates of whether additional taxes will be due. Where the final tax outcome of these matters is different from the amounts that were initially recognised, such differences will impact the income tax and deferred tax provisions in the period in which such determination is made.
The carrying amounts are as follows:Group
2017 2016$’000 $’000
Income tax receivables 6,734 3,611
Income tax payable 3,166 13,426
Deferred tax assets 7,750 3,731
Deferred tax liabilities 5,421 5,672
(ii) Impairment of financial assets
The impairment provisions for financial assets are based on assumptions about risk of default and expected loss rates. The Group uses judgement in making these assumptions and selecting the inputs to the impairment calculation, based on the Group’s past history, existing market conditions as well as forward looking estimates at the end of each reporting period.
For details of the key assumptions and inputs used, see note 38(c).
41. FAIR VALUE OF ASSETS AND LIABILITIES
A. Fair value hierarchy
The Group categories fair value measurements using a fair value hierarchy that is dependent on the valuation inputs used as follows:
Level 1 - Quoted prices (unadjusted) in active market for identical assets or liabilities that the Group can access at the measurement date,
Level 2 - Inputs other than quoted prices included within Level 1 that are observable for the asset or liability, either directly or indirectly, and
Level 3 - Unobservable inputs for the asset or liability.
Fair value measurements that use inputs of different hierarchy levels are categorised in its entirety in the same level of the fair value hierarchy as the lowest level input that is significant to the entire measurement.
Transfers between levels of the fair value hierarchy are deemed to have occurred on the date of the event or change in circumstances that caused the transfers.
NOTES TO THE FINANCIAL STATEMENTSFor the financial year ended 31 December 2017
128 OUR BUSINESS PLATFORMS OUR GROWTH DRIVERS
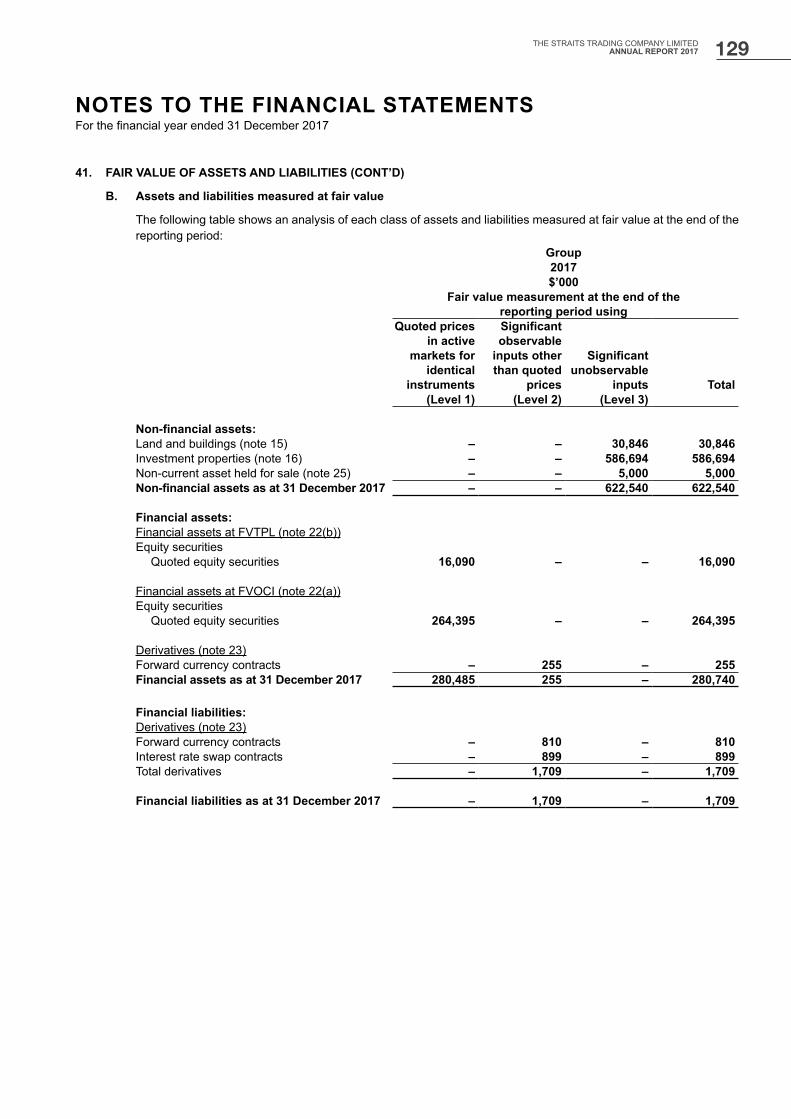
41. FAIR VALUE OF ASSETS AND LIABILITIES (CONT’D)
B. Assets and liabilities measured at fair value
The following table shows an analysis of each class of assets and liabilities measured at fair value at the end of the reporting period:
Group2017$’000
Fair value measurement at the end of the reporting period using
Quoted prices in active
markets for identical
instruments
Significant observable
inputs other than quoted
prices
Significant unobservable
inputs Total(Level 1) (Level 2) (Level 3)
Non-financial assets:Land and buildings (note 15) – – 30,846 30,846Investment properties (note 16) – – 586,694 586,694Non-current asset held for sale (note 25) – – 5,000 5,000Non-financial assets as at 31 December 2017 – – 622,540 622,540
Financial assets:Financial assets at FVTPL (note 22(b))Equity securities
Quoted equity securities 16,090 – – 16,090
Financial assets at FVOCI (note 22(a))Equity securities
Quoted equity securities 264,395 – – 264,395
Derivatives (note 23)Forward currency contracts – 255 – 255Financial assets as at 31 December 2017 280,485 255 – 280,740
Financial liabilities:Derivatives (note 23)Forward currency contracts – 810 – 810Interest rate swap contracts – 899 – 899Total derivatives – 1,709 – 1,709
Financial liabilities as at 31 December 2017 – 1,709 – 1,709
NOTES TO THE FINANCIAL STATEMENTSFor the financial year ended 31 December 2017
129THE STRAITS TRADING COMPANY LIMITEDANNUAL REPORT 2017
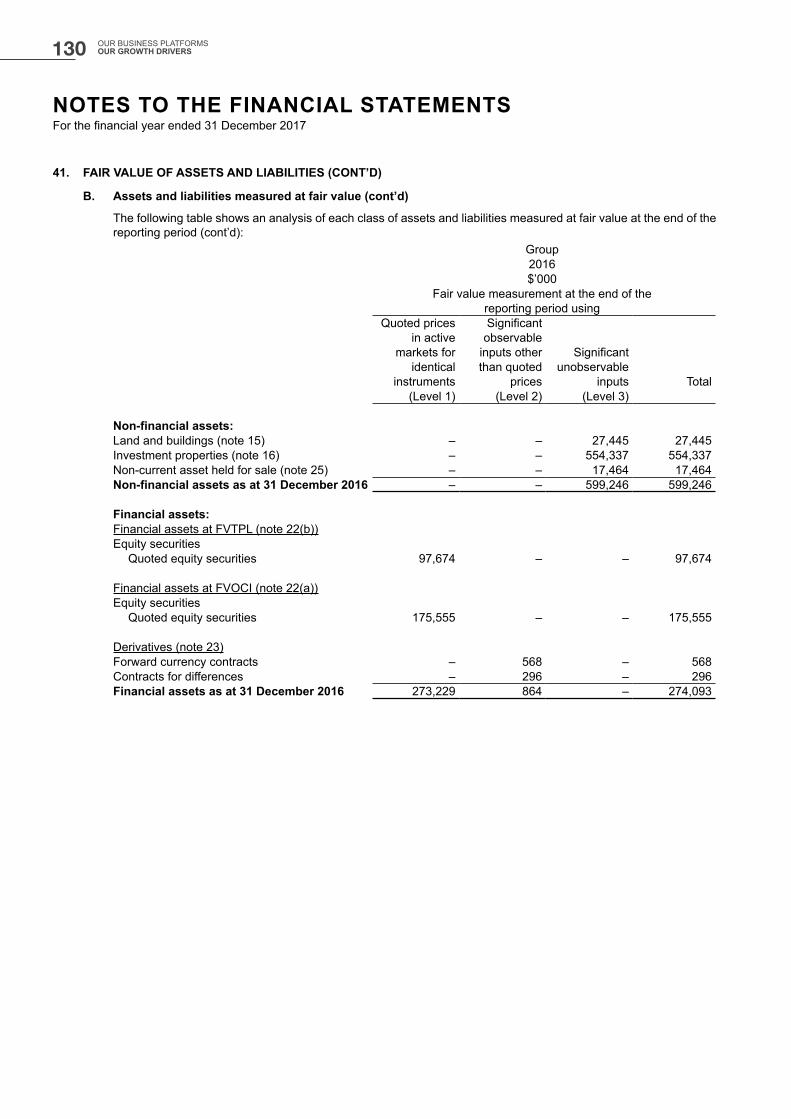
41. FAIR VALUE OF ASSETS AND LIABILITIES (CONT’D)
B. Assets and liabilities measured at fair value (cont’d)
The following table shows an analysis of each class of assets and liabilities measured at fair value at the end of the reporting period (cont’d):
Group2016$’000
Fair value measurement at the end of the reporting period using
Quoted prices in active
markets for identical
instruments
Significant observable
inputs other than quoted
prices
Significant unobservable
inputs Total(Level 1) (Level 2) (Level 3)
Non-financial assets:Land and buildings (note 15) – – 27,445 27,445Investment properties (note 16) – – 554,337 554,337Non-current asset held for sale (note 25) – – 17,464 17,464Non-financial assets as at 31 December 2016 – – 599,246 599,246
Financial assets:Financial assets at FVTPL (note 22(b))Equity securities
Quoted equity securities 97,674 – – 97,674
Financial assets at FVOCI (note 22(a))Equity securities
Quoted equity securities 175,555 – – 175,555
Derivatives (note 23)Forward currency contracts – 568 – 568Contracts for differences – 296 – 296Financial assets as at 31 December 2016 273,229 864 – 274,093
NOTES TO THE FINANCIAL STATEMENTSFor the financial year ended 31 December 2017
130 OUR BUSINESS PLATFORMS OUR GROWTH DRIVERS

41. FAIR VALUE OF ASSETS AND LIABILITIES (CONT’D)
B. Assets and liabilities measured at fair value (cont’d)
The following table shows an analysis of each class of assets and liabilities measured at fair value at the end of the reporting period (cont’d):
Group2016$’000
Fair value measurement at the end of the reporting period using
Quoted prices in active
markets for identical
instruments
Significant observable
inputs other than quoted
prices
Significant unobservable
inputs Total(Level 1) (Level 2) (Level 3)
Financial liabilities:Derivatives (note 23)Forward currency contracts – 1,201 – 1,201Contracts for differences – 187 – 187Interest rate swap contracts – 100 – 100Total derivatives – 1,488 – 1,488
Financial liabilities as at 31 December 2016 – 1,488 – 1,488
Company2017$’000
Fair value measurement at the end of thereporting period using
Quoted prices in active
markets for identical
instruments
Significant observable
inputs other than quoted
prices
Significant unobservable
inputs Total(Level 1) (Level 2) (Level 3)
Non-financial assets:Land and buildings (note 15) – – 110 110Investment properties (note 16) – – 33,110 33,110Non-financial assets as at 31 December 2017 – – 33,220 33,220
NOTES TO THE FINANCIAL STATEMENTSFor the financial year ended 31 December 2017
131THE STRAITS TRADING COMPANY LIMITEDANNUAL REPORT 2017
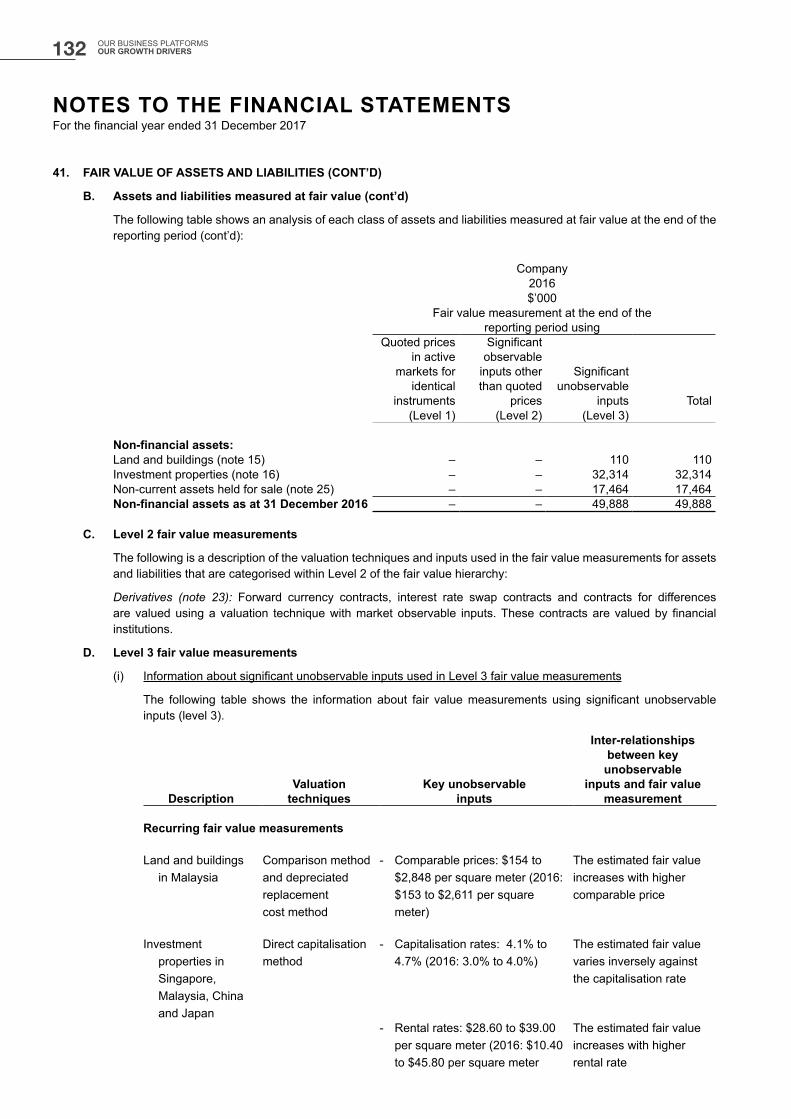
41. FAIR VALUE OF ASSETS AND LIABILITIES (CONT’D)
B. Assets and liabilities measured at fair value (cont’d)
The following table shows an analysis of each class of assets and liabilities measured at fair value at the end of the reporting period (cont’d):
Company2016$’000
Fair value measurement at the end of thereporting period using
Quoted prices in active
markets for identical
instruments
Significant observable
inputs other than quoted
prices
Significant unobservable
inputs Total(Level 1) (Level 2) (Level 3)
Non-financial assets:Land and buildings (note 15) – – 110 110Investment properties (note 16) – – 32,314 32,314Non-current assets held for sale (note 25) – – 17,464 17,464Non-financial assets as at 31 December 2016 – – 49,888 49,888
C. Level 2 fair value measurements
The following is a description of the valuation techniques and inputs used in the fair value measurements for assets and liabilities that are categorised within Level 2 of the fair value hierarchy:
Derivatives (note 23): Forward currency contracts, interest rate swap contracts and contracts for differences are valued using a valuation technique with market observable inputs. These contracts are valued by financial institutions.
D. Level 3 fair value measurements
(i) Information about significant unobservable inputs used in Level 3 fair value measurements
The following table shows the information about fair value measurements using significant unobservable inputs (level 3).
DescriptionValuation
techniquesKey unobservable
inputs
Inter-relationships between key unobservable
inputs and fair value measurement
Recurring fair value measurements
Land and buildings in Malaysia
Comparison method and depreciated replacement cost method
- Comparable prices: $154 to $2,848 per square meter (2016: $153 to $2,611 per square meter)
The estimated fair value increases with higher comparable price
Investment properties in Singapore, Malaysia, China and Japan
Direct capitalisation method
- Capitalisation rates: 4.1% to 4.7% (2016: 3.0% to 4.0%)
The estimated fair value varies inversely against the capitalisation rate
- Rental rates: $28.60 to $39.00 per square meter (2016: $10.40 to $45.80 per square meter
The estimated fair value increases with higher rental rate
NOTES TO THE FINANCIAL STATEMENTSFor the financial year ended 31 December 2017
132 OUR BUSINESS PLATFORMS OUR GROWTH DRIVERS
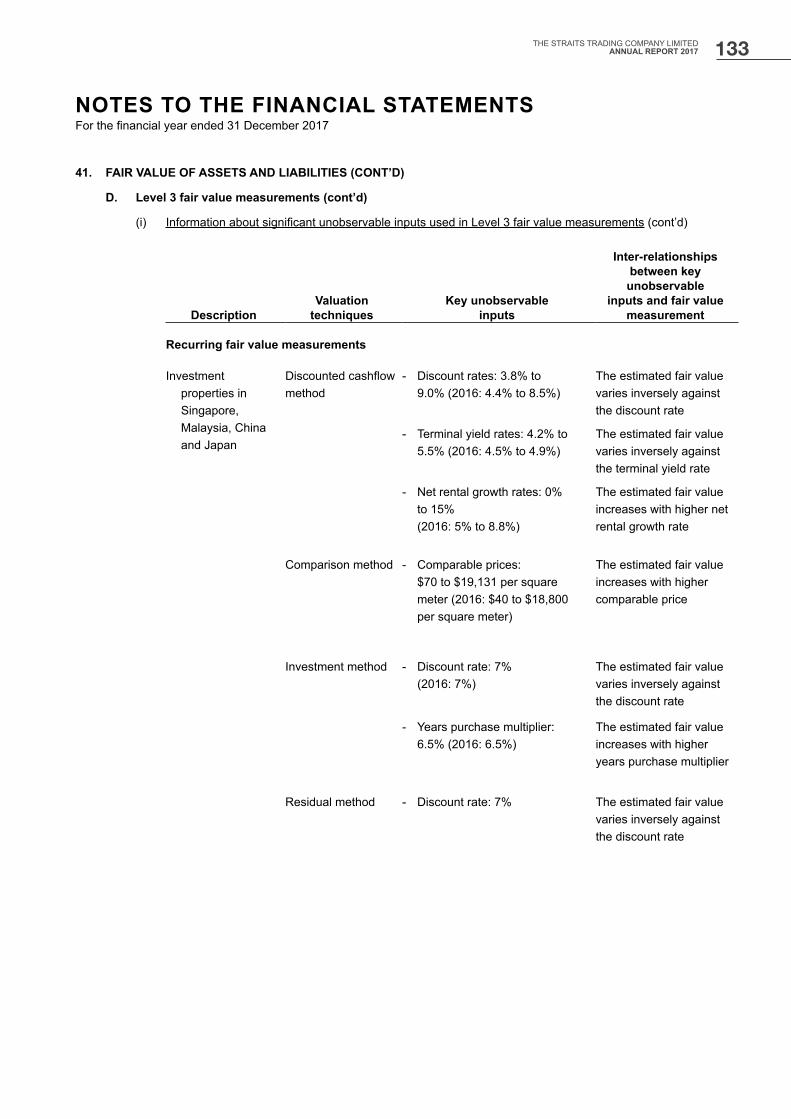
41. FAIR VALUE OF ASSETS AND LIABILITIES (CONT’D)
D. Level 3 fair value measurements (cont’d)
(i) Information about significant unobservable inputs used in Level 3 fair value measurements (cont’d)
DescriptionValuation
techniquesKey unobservable
inputs
Inter-relationships between key unobservable
inputs and fair value measurement
Recurring fair value measurements
Investment properties in Singapore, Malaysia, China and Japan
Discounted cashflow method
- Discount rates: 3.8% to 9.0% (2016: 4.4% to 8.5%)
The estimated fair value varies inversely against the discount rate
- Terminal yield rates: 4.2% to 5.5% (2016: 4.5% to 4.9%)
The estimated fair value varies inversely against the terminal yield rate
- Net rental growth rates: 0% to 15%
(2016: 5% to 8.8%)
The estimated fair value increases with higher net rental growth rate
Comparison method - Comparable prices: $70 to $19,131 per square
meter (2016: $40 to $18,800 per square meter)
The estimated fair value increases with higher comparable price
Investment method - Discount rate: 7% (2016: 7%)
The estimated fair value varies inversely against the discount rate
- Years purchase multiplier: 6.5% (2016: 6.5%)
The estimated fair value increases with higher years purchase multiplier
Residual method - Discount rate: 7% The estimated fair value varies inversely against the discount rate
NOTES TO THE FINANCIAL STATEMENTSFor the financial year ended 31 December 2017
133THE STRAITS TRADING COMPANY LIMITEDANNUAL REPORT 2017

41. FAIR VALUE OF ASSETS AND LIABILITIES (CONT’D)
D. Level 3 fair value measurements (cont’d)
(ii) Movements in Level 3 assets and liabilities measured at fair value
The following table presents the reconciliation for all assets and liabilities measured at fair value based on significant unobservable inputs (Level 3):
Group2017$’000
Fair value measurement using significant unobservable inputs (Level 3)
Land and buildings
Investment properties
Non-current assets held for
sale
At 1 January 27,445 554,337 17,464Total gains for the year 2,755 8,525 –Depreciation (699) – –Additions 817 20,810 –Disposals – (6,900) (17,364)Reclassification – (5,000) 5,000Acquisition of subsidiaries – 21,500 –Exchange adjustment 528 (6,578) (100)At 31 December 30,846 586,694 5,000
Total gains or losses for the year included in Other comprehensive income: – Net surplus on revaluation of land and
buildings 2,755 – –
Group2016$’000
Fair value measurement using significant unobservable inputs (Level 3)
Land and buildingsInvestment properties
Non-current assets held for
sale
At 1 January 16,504 606,010 17,771Total gains for the year 1,016 932 –Depreciation (316) – –Additions 10,510 106,020 –Disposals – (150,934) –Exchange adjustment (269) (7,691) (307)At 31 December 27,445 554,337 17,464
Total gains or losses for the year included in Other comprehensive income: – Net surplus on revaluation of land and
buildings 1,016 – –
NOTES TO THE FINANCIAL STATEMENTSFor the financial year ended 31 December 2017
134 OUR BUSINESS PLATFORMS OUR GROWTH DRIVERS

41. FAIR VALUE OF ASSETS AND LIABILITIES (CONT’D)
D. Level 3 fair value measurements (cont’d)
(iii) Valuation policies and procedures
It is the Group’s policy to engage external valuation experts to perform the valuation. The management is responsible for selecting and engaging valuation experts that possess the relevant credentials and knowledge on the subject of valuation, valuation methodologies, and FRS 113 Fair Value Measurement guidance.
The Group revalues its properties and the valuation techniques used are as follows:
(a) Comparison method that considers the sales of similar properties that have been transacted in the open market with adjustment made for differences in factors that affect value.
(b) Depreciated replacement cost method that is based on an estimate of the current market value of the land, plus the current gross replacement of improvements, less allowances for physical deterioration, obsolescence and optimisation.
(c) The direct capitalisation method that is based on the capitalisation of net rental income taking into consideration such as vacancy rates, rental growth rates to arrive at the capital value. The net rental income is derived after deducting expenses and property related taxes from the gross rent.
(d) The discounted cashflow method that involves the estimation of net income stream over a period and discounting the net income stream; taking into consideration a range of assumptions such as terminal yield rate, discount rate and rental growth.
(e) The investment method that is based on the determination of the net annual income by deducting the annual outgoings from the gross annual income and capitalising the net income by a suitable rate of return consistent with the type and quality of investment to arrive at the market value.
(f) The residual method that is based on gross development value of the project less estimated cost of development, deferred over the period of time required to complete the project to arrive at the market value.
NOTES TO THE FINANCIAL STATEMENTSFor the financial year ended 31 December 2017
135THE STRAITS TRADING COMPANY LIMITEDANNUAL REPORT 2017
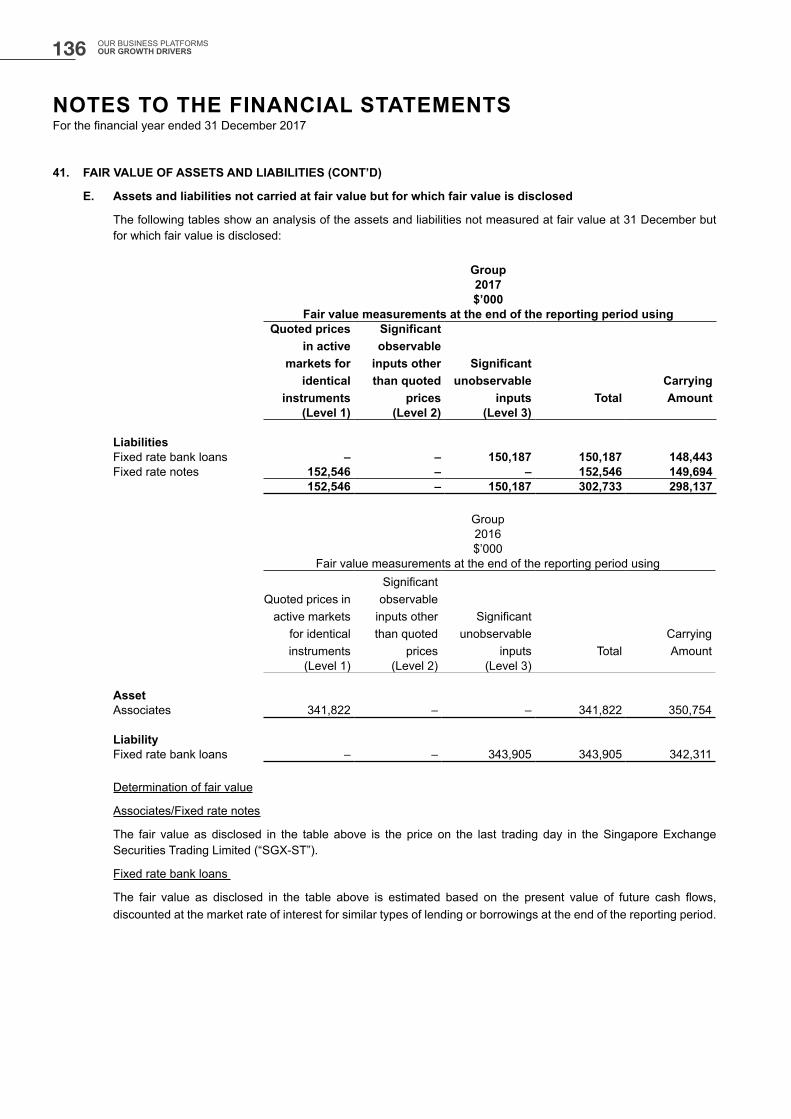
41. FAIR VALUE OF ASSETS AND LIABILITIES (CONT’D)
E. Assets and liabilities not carried at fair value but for which fair value is disclosed
The following tables show an analysis of the assets and liabilities not measured at fair value at 31 December but for which fair value is disclosed:
Group2017$’000
Fair value measurements at the end of the reporting period usingQuoted prices
in active markets for
identical instruments
Significant observable
inputs other than quoted
prices
Significant unobservable
inputs TotalCarryingAmount
(Level 1) (Level 2) (Level 3)
LiabilitiesFixed rate bank loans – – 150,187 150,187 148,443Fixed rate notes 152,546 – – 152,546 149,694
152,546 – 150,187 302,733 298,137
Group2016$’000
Fair value measurements at the end of the reporting period using
Quoted prices in active markets
for identical instruments
Significant observable
inputs other than quoted
prices
Significant unobservable
inputs TotalCarryingAmount
(Level 1) (Level 2) (Level 3)
AssetAssociates 341,822 – – 341,822 350,754
LiabilityFixed rate bank loans – – 343,905 343,905 342,311
Determination of fair value
Associates/Fixed rate notes
The fair value as disclosed in the table above is the price on the last trading day in the Singapore Exchange Securities Trading Limited (“SGX-ST”).
Fixed rate bank loans
The fair value as disclosed in the table above is estimated based on the present value of future cash flows, discounted at the market rate of interest for similar types of lending or borrowings at the end of the reporting period.
NOTES TO THE FINANCIAL STATEMENTSFor the financial year ended 31 December 2017
136 OUR BUSINESS PLATFORMS OUR GROWTH DRIVERS
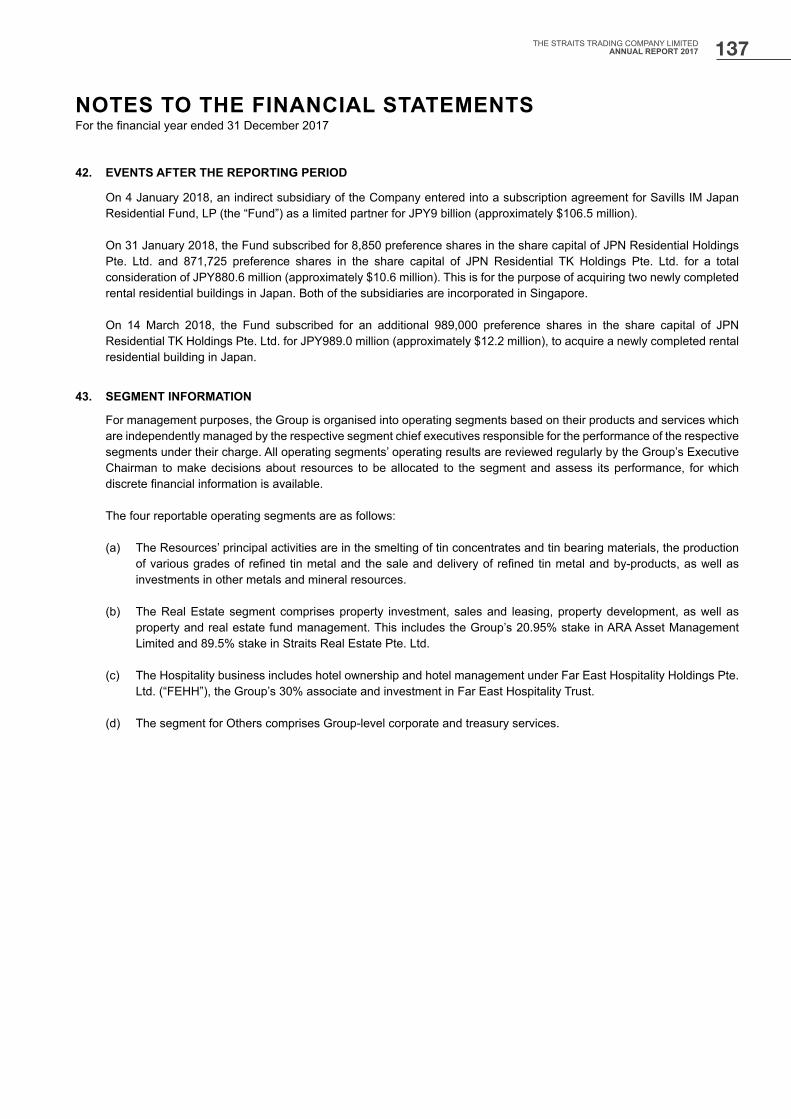
42. EVENTS AFTER THE REPORTING PERIOD
On 4 January 2018, an indirect subsidiary of the Company entered into a subscription agreement for Savills IM Japan Residential Fund, LP (the “Fund”) as a limited partner for JPY9 billion (approximately $106.5 million).
On 31 January 2018, the Fund subscribed for 8,850 preference shares in the share capital of JPN Residential Holdings Pte. Ltd. and 871,725 preference shares in the share capital of JPN Residential TK Holdings Pte. Ltd. for a total consideration of JPY880.6 million (approximately $10.6 million). This is for the purpose of acquiring two newly completed rental residential buildings in Japan. Both of the subsidiaries are incorporated in Singapore.
On 14 March 2018, the Fund subscribed for an additional 989,000 preference shares in the share capital of JPN Residential TK Holdings Pte. Ltd. for JPY989.0 million (approximately $12.2 million), to acquire a newly completed rental residential building in Japan.
43. SEGMENT INFORMATION
For management purposes, the Group is organised into operating segments based on their products and services which are independently managed by the respective segment chief executives responsible for the performance of the respective segments under their charge. All operating segments’ operating results are reviewed regularly by the Group’s Executive Chairman to make decisions about resources to be allocated to the segment and assess its performance, for which discrete financial information is available.
The four reportable operating segments are as follows:
(a) The Resources’ principal activities are in the smelting of tin concentrates and tin bearing materials, the production of various grades of refined tin metal and the sale and delivery of refined tin metal and by-products, as well as investments in other metals and mineral resources.
(b) The Real Estate segment comprises property investment, sales and leasing, property development, as well as property and real estate fund management. This includes the Group’s 20.95% stake in ARA Asset Management Limited and 89.5% stake in Straits Real Estate Pte. Ltd.
(c) The Hospitality business includes hotel ownership and hotel management under Far East Hospitality Holdings Pte. Ltd. (“FEHH”), the Group’s 30% associate and investment in Far East Hospitality Trust.
(d) The segment for Others comprises Group-level corporate and treasury services.
NOTES TO THE FINANCIAL STATEMENTSFor the financial year ended 31 December 2017
137THE STRAITS TRADING COMPANY LIMITEDANNUAL REPORT 2017
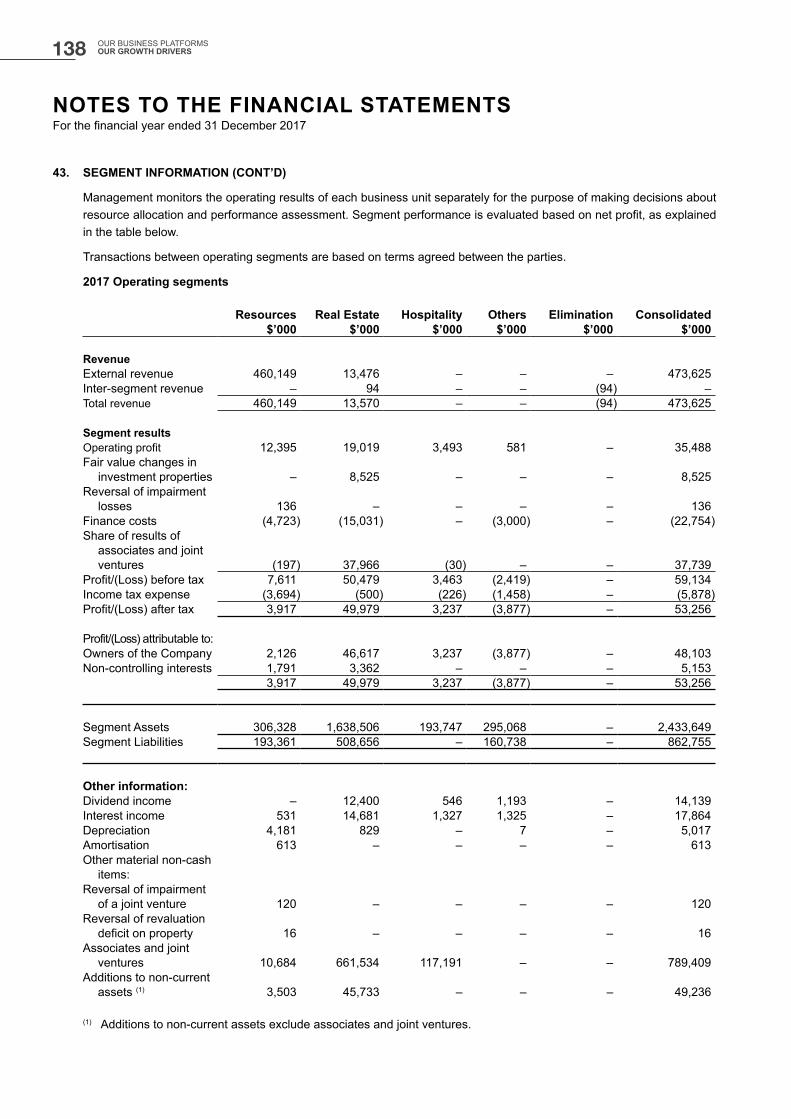
43. SEGMENT INFORMATION (CONT’D)
Management monitors the operating results of each business unit separately for the purpose of making decisions about resource allocation and performance assessment. Segment performance is evaluated based on net profit, as explained in the table below.
Transactions between operating segments are based on terms agreed between the parties.
2017 Operating segments
Resources Real Estate Hospitality Others Elimination Consolidated$’000 $’000 $’000 $’000 $’000 $’000
RevenueExternal revenue 460,149 13,476 – – – 473,625Inter-segment revenue – 94 – – (94) –Total revenue 460,149 13,570 – – (94) 473,625
Segment resultsOperating profit 12,395 19,019 3,493 581 – 35,488Fair value changes in
investment properties – 8,525 – – – 8,525Reversal of impairment
losses 136 – – – – 136Finance costs (4,723) (15,031) – (3,000) – (22,754)Share of results of
associates and joint ventures (197) 37,966 (30) – – 37,739
Profit/(Loss) before tax 7,611 50,479 3,463 (2,419) – 59,134Income tax expense (3,694) (500) (226) (1,458) – (5,878)Profit/(Loss) after tax 3,917 49,979 3,237 (3,877) – 53,256
Profit/(Loss) attributable to:Owners of the Company 2,126 46,617 3,237 (3,877) – 48,103Non-controlling interests 1,791 3,362 – – – 5,153
3,917 49,979 3,237 (3,877) – 53,256
Segment Assets 306,328 1,638,506 193,747 295,068 – 2,433,649Segment Liabilities 193,361 508,656 – 160,738 – 862,755
Other information:Dividend income – 12,400 546 1,193 – 14,139Interest income 531 14,681 1,327 1,325 – 17,864Depreciation 4,181 829 – 7 – 5,017Amortisation 613 – – – – 613Other material non-cash
items:Reversal of impairment
of a joint venture 120 – – – – 120Reversal of revaluation
deficit on property 16 – – – – 16Associates and joint
ventures 10,684 661,534 117,191 – – 789,409Additions to non-current
assets (1) 3,503 45,733 – – – 49,236
(1) Additions to non-current assets exclude associates and joint ventures.
NOTES TO THE FINANCIAL STATEMENTSFor the financial year ended 31 December 2017
138 OUR BUSINESS PLATFORMS OUR GROWTH DRIVERS
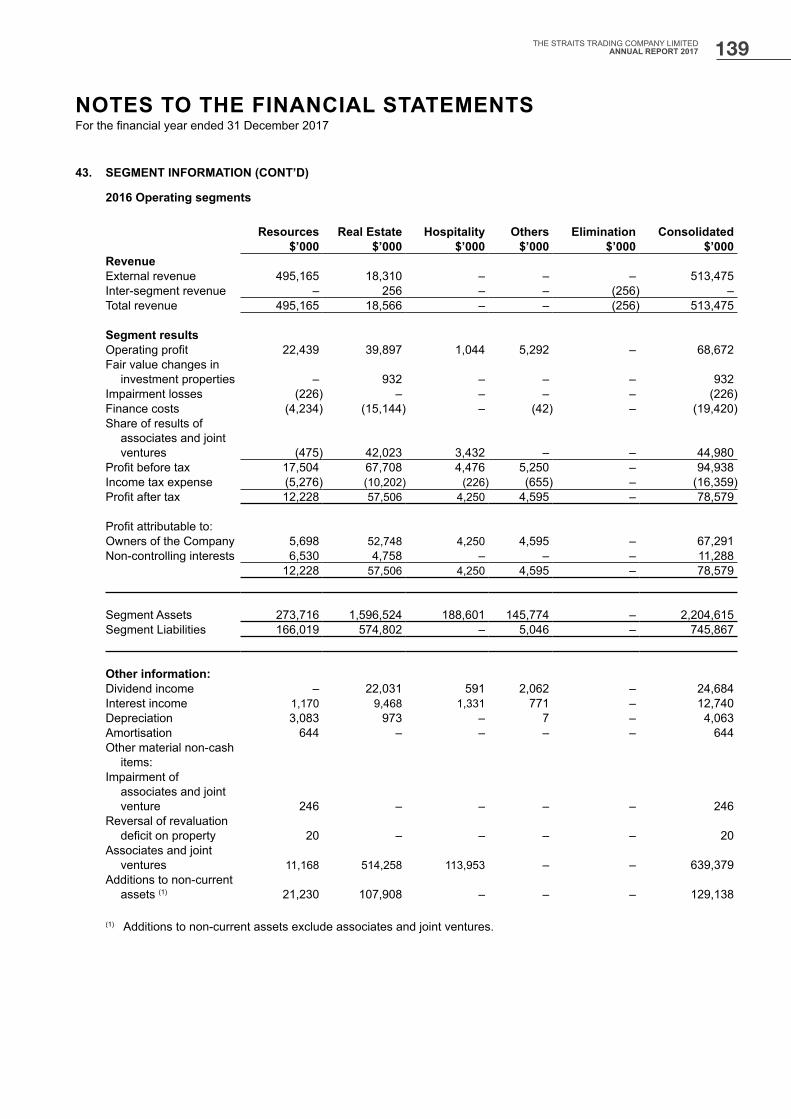
43. SEGMENT INFORMATION (CONT’D)
2016 Operating segments
Resources Real Estate Hospitality Others Elimination Consolidated$’000 $’000 $’000 $’000 $’000 $’000
RevenueExternal revenue 495,165 18,310 – – – 513,475Inter-segment revenue – 256 – – (256) –Total revenue 495,165 18,566 – – (256) 513,475
Segment resultsOperating profit 22,439 39,897 1,044 5,292 – 68,672Fair value changes in
investment properties – 932 – – – 932Impairment losses (226) – – – – (226)Finance costs (4,234) (15,144) – (42) – (19,420)Share of results of
associates and joint ventures (475) 42,023 3,432 – – 44,980
Profit before tax 17,504 67,708 4,476 5,250 – 94,938Income tax expense (5,276) (10,202) (226) (655) – (16,359)Profit after tax 12,228 57,506 4,250 4,595 – 78,579
Profit attributable to:Owners of the Company 5,698 52,748 4,250 4,595 – 67,291Non-controlling interests 6,530 4,758 – – – 11,288
12,228 57,506 4,250 4,595 – 78,579
Segment Assets 273,716 1,596,524 188,601 145,774 – 2,204,615Segment Liabilities 166,019 574,802 – 5,046 – 745,867
Other information:Dividend income – 22,031 591 2,062 – 24,684Interest income 1,170 9,468 1,331 771 – 12,740Depreciation 3,083 973 – 7 – 4,063Amortisation 644 – – – – 644Other material non-cash
items:Impairment of
associates and joint venture 246 – – – – 246
Reversal of revaluation deficit on property 20 – – – – 20
Associates and joint ventures 11,168 514,258 113,953 – – 639,379
Additions to non-current assets (1) 21,230 107,908 – – – 129,138
(1) Additions to non-current assets exclude associates and joint ventures.
NOTES TO THE FINANCIAL STATEMENTSFor the financial year ended 31 December 2017
139THE STRAITS TRADING COMPANY LIMITEDANNUAL REPORT 2017
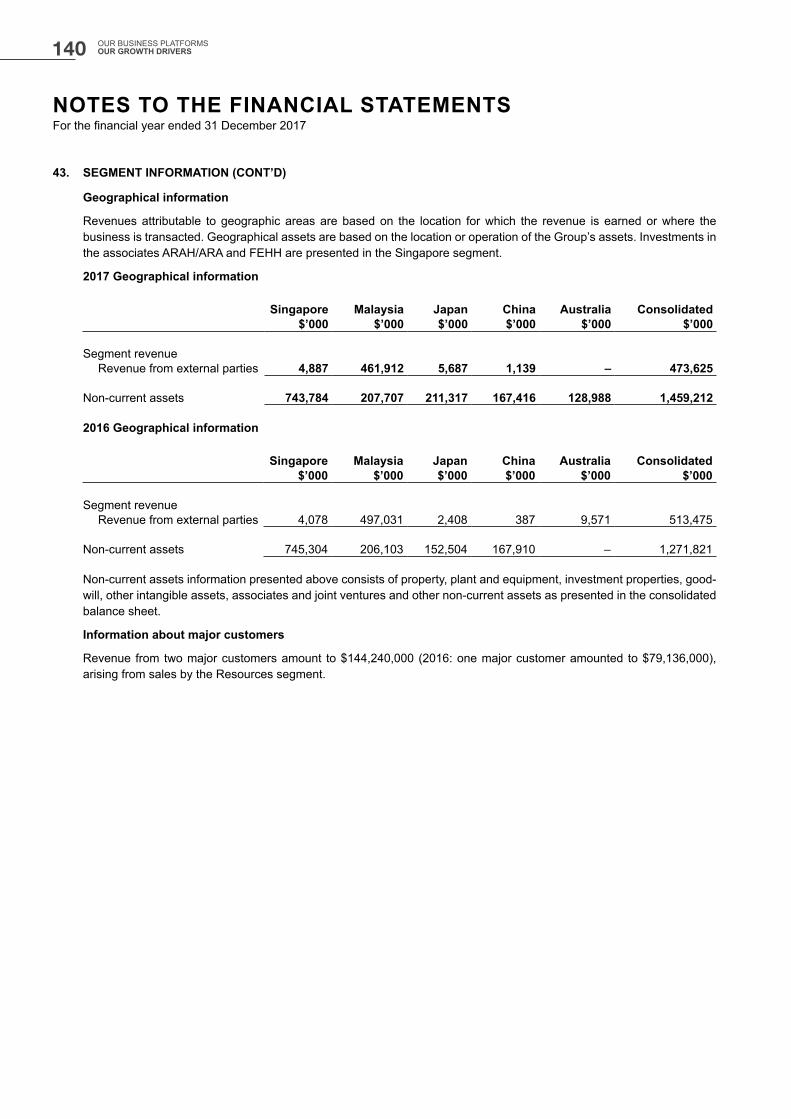
43. SEGMENT INFORMATION (CONT’D)
Geographical information
Revenues attributable to geographic areas are based on the location for which the revenue is earned or where the business is transacted. Geographical assets are based on the location or operation of the Group’s assets. Investments in the associates ARAH/ARA and FEHH are presented in the Singapore segment.
2017 Geographical information
Singapore Malaysia Japan China Australia Consolidated$’000 $’000 $’000 $’000 $’000 $’000
Segment revenueRevenue from external parties 4,887 461,912 5,687 1,139 – 473,625
Non-current assets 743,784 207,707 211,317 167,416 128,988 1,459,212
2016 Geographical information
Singapore Malaysia Japan China Australia Consolidated$’000 $’000 $’000 $’000 $’000 $’000
Segment revenueRevenue from external parties 4,078 497,031 2,408 387 9,571 513,475
Non-current assets 745,304 206,103 152,504 167,910 – 1,271,821
Non-current assets information presented above consists of property, plant and equipment, investment properties, good-will, other intangible assets, associates and joint ventures and other non-current assets as presented in the consolidated balance sheet.
Information about major customers
Revenue from two major customers amount to $144,240,000 (2016: one major customer amounted to $79,136,000), arising from sales by the Resources segment.
NOTES TO THE FINANCIAL STATEMENTSFor the financial year ended 31 December 2017
140 OUR BUSINESS PLATFORMS OUR GROWTH DRIVERS
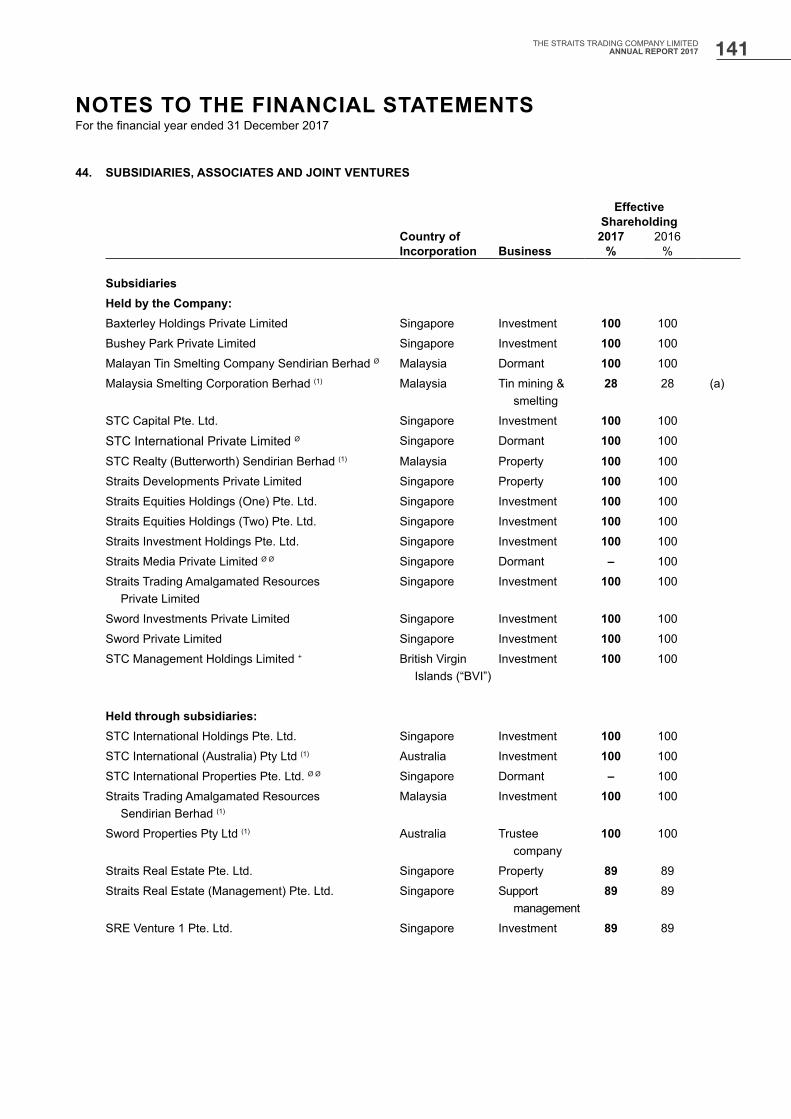
44. SUBSIDIARIES, ASSOCIATES AND JOINT VENTURES
EffectiveShareholding
Country of 2017 2016Incorporation Business % %
SubsidiariesHeld by the Company:Baxterley Holdings Private Limited Singapore Investment 100 100
Bushey Park Private Limited Singapore Investment 100 100
Malayan Tin Smelting Company Sendirian Berhad Ø Malaysia Dormant 100 100
Malaysia Smelting Corporation Berhad (1) Malaysia Tin mining & smelting
28 28 (a)
STC Capital Pte. Ltd. Singapore Investment 100 100
STC International Private Limited Ø Singapore Dormant 100 100
STC Realty (Butterworth) Sendirian Berhad (1) Malaysia Property 100 100
Straits Developments Private Limited Singapore Property 100 100
Straits Equities Holdings (One) Pte. Ltd. Singapore Investment 100 100
Straits Equities Holdings (Two) Pte. Ltd. Singapore Investment 100 100
Straits Investment Holdings Pte. Ltd. Singapore Investment 100 100
Straits Media Private Limited Ø Ø Singapore Dormant – 100
Straits Trading Amalgamated Resources Private Limited
Singapore Investment 100 100
Sword Investments Private Limited Singapore Investment 100 100
Sword Private Limited Singapore Investment 100 100
STC Management Holdings Limited + British Virgin Islands (“BVI”)
Investment 100 100
Held through subsidiaries:STC International Holdings Pte. Ltd. Singapore Investment 100 100
STC International (Australia) Pty Ltd (1) Australia Investment 100 100
STC International Properties Pte. Ltd. Ø Ø Singapore Dormant – 100
Straits Trading Amalgamated Resources Sendirian Berhad (1)
Malaysia Investment 100 100
Sword Properties Pty Ltd (1) Australia Trustee company
100 100
Straits Real Estate Pte. Ltd. Singapore Property 89 89
Straits Real Estate (Management) Pte. Ltd. Singapore Support management
89 89
SRE Venture 1 Pte. Ltd. Singapore Investment 89 89
NOTES TO THE FINANCIAL STATEMENTSFor the financial year ended 31 December 2017
141THE STRAITS TRADING COMPANY LIMITEDANNUAL REPORT 2017
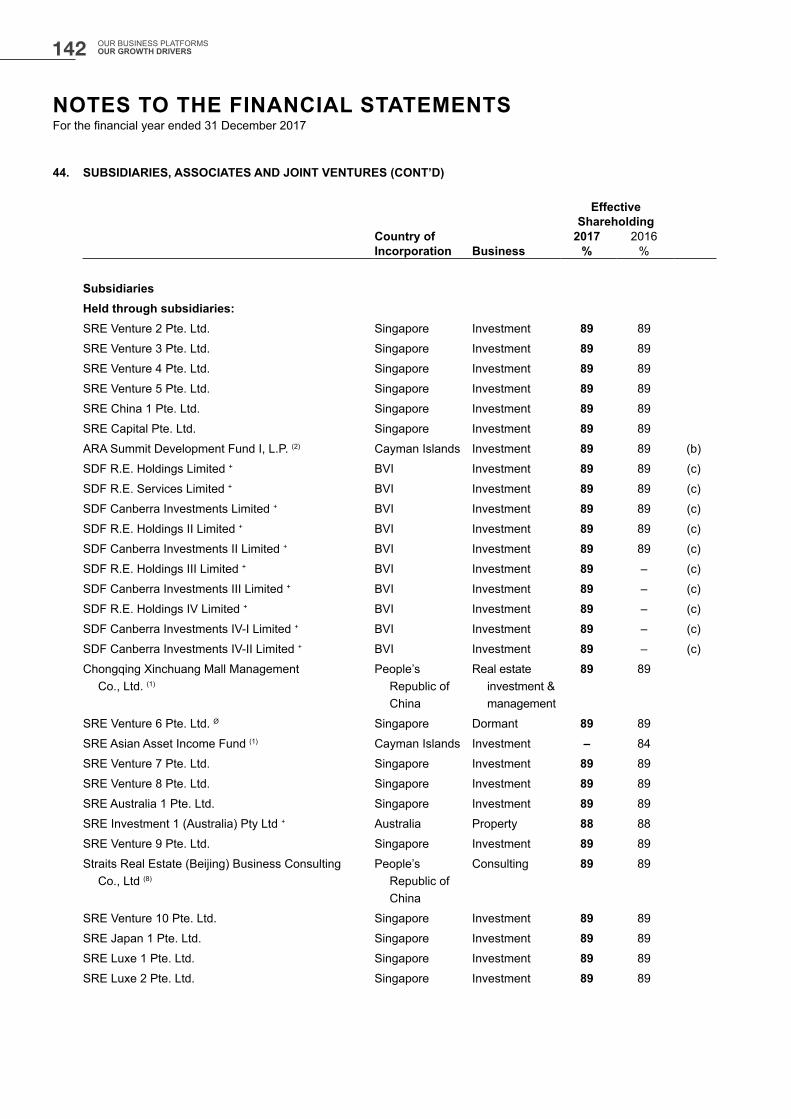
44. SUBSIDIARIES, ASSOCIATES AND JOINT VENTURES (CONT’D)
Effective Shareholding
Country of 2017 2016Incorporation Business % %
SubsidiariesHeld through subsidiaries:SRE Venture 2 Pte. Ltd. Singapore Investment 89 89
SRE Venture 3 Pte. Ltd. Singapore Investment 89 89
SRE Venture 4 Pte. Ltd. Singapore Investment 89 89
SRE Venture 5 Pte. Ltd. Singapore Investment 89 89
SRE China 1 Pte. Ltd. Singapore Investment 89 89
SRE Capital Pte. Ltd. Singapore Investment 89 89
ARA Summit Development Fund I, L.P. (2) Cayman Islands Investment 89 89 (b)
SDF R.E. Holdings Limited + BVI Investment 89 89 (c)
SDF R.E. Services Limited + BVI Investment 89 89 (c)
SDF Canberra Investments Limited + BVI Investment 89 89 (c)
SDF R.E. Holdings II Limited + BVI Investment 89 89 (c)
SDF Canberra Investments II Limited + BVI Investment 89 89 (c)
SDF R.E. Holdings III Limited + BVI Investment 89 – (c)
SDF Canberra Investments III Limited + BVI Investment 89 – (c)
SDF R.E. Holdings IV Limited + BVI Investment 89 – (c)
SDF Canberra Investments IV-I Limited + BVI Investment 89 – (c)
SDF Canberra Investments IV-II Limited + BVI Investment 89 – (c)
Chongqing Xinchuang Mall Management Co., Ltd. (1)
People’s Republic of China
Real estate investment & management
89 89
SRE Venture 6 Pte. Ltd. Ø Singapore Dormant 89 89
SRE Asian Asset Income Fund (1) Cayman Islands Investment – 84
SRE Venture 7 Pte. Ltd. Singapore Investment 89 89
SRE Venture 8 Pte. Ltd. Singapore Investment 89 89
SRE Australia 1 Pte. Ltd. Singapore Investment 89 89
SRE Investment 1 (Australia) Pty Ltd + Australia Property 88 88
SRE Venture 9 Pte. Ltd. Singapore Investment 89 89
Straits Real Estate (Beijing) Business Consulting Co., Ltd (8)
People’s Republic of China
Consulting 89 89
SRE Venture 10 Pte. Ltd. Singapore Investment 89 89
SRE Japan 1 Pte. Ltd. Singapore Investment 89 89
SRE Luxe 1 Pte. Ltd. Singapore Investment 89 89
SRE Luxe 2 Pte. Ltd. Singapore Investment 89 89
NOTES TO THE FINANCIAL STATEMENTSFor the financial year ended 31 December 2017
142 OUR BUSINESS PLATFORMS OUR GROWTH DRIVERS

44. SUBSIDIARIES, ASSOCIATES AND JOINT VENTURES (CONT’D)
Effective Shareholding
Country of 2017 2016Incorporation Business % %
SubsidiariesHeld through subsidiaries:SRE JHT TMK (1) Japan Property 89 89
SRE Japan 2 Pte. Ltd. Singapore Investment 89 89
SRE Luxe 3 Pte. Ltd. (formerly known as Nikko AM Japan Property I-I Pte. Ltd.)
Singapore Investment 89 –
SRE Luxe 4 Pte. Ltd. (formerly known as Nikko AM Japan Property I-II Pte. Ltd.)
Singapore Investment 89 –
Tokutei Mokuteki Kaisha JP 2 (formerly known as Tokutei Mokuteki Kaisha Nikko AM Japan Property 1-2) (1)
Japan Property 89 –
SRE Australia 2 Pte. Ltd. Singapore Investment 89 –
SRE Venture 11 Pte. Ltd. Singapore Investment 89 –
SRE Japan 11 Pte. Ltd. Singapore Investment 89 –
SIM Residence One GK (9) Japan Property 88 –
SRE Venture 12 Pte. Ltd. Singapore Investment 89 –
SRE Australia 3 Pte. Ltd. (formerly known as SRE Korea 1 Pte. Ltd.)
Singapore Investment 89 –
45SGT Unit Trust + Australia Property 85 –
Sword Unit Trust Ø Australia Dormant 100 100
STC International Investment Holdings Pte. Ltd. Ø Singapore Dormant 100 100
SL Tin Sdn. Bhd. (6) ß Malaysia Tin mining 44 44
Malaysia Smelting Corporation (Warehousing) Sdn. Bhd. (1) ß
Malaysia Tin warehousing 55 55
MSC Properties Sdn. Bhd. (1) ß Malaysia Property holding and rental
55 55
Rahman Hydraulic Tin Sdn. Bhd. (1) ß Malaysia Tin mining 55 55
Straits Resource Management Private Limited ß Singapore Investment holding
55 55
M Smelt (C) Sdn. Bhd. (1) ß Malaysia Smelting of non-ferrous metals
55 55 (d)
PT SRM Indonesia (7) ß Indonesia Dormant 54 54
Tertius Development Pte. Ltd. Singapore Property 100 100
STC Property Management Services Sdn. Bhd. (1) Malaysia Property 100 100
NOTES TO THE FINANCIAL STATEMENTSFor the financial year ended 31 December 2017
143THE STRAITS TRADING COMPANY LIMITEDANNUAL REPORT 2017

44. SUBSIDIARIES, ASSOCIATES AND JOINT VENTURES (CONT’D)
Effective Shareholding
Country of 2017 2016Incorporation Business % %
AssociatesHeld by the Company:Johan Kekal Sendirian Berhad Ø Ø
(Accounting year ended 31 December)Malaysia Dormant – 45
Taiko-Straits Developments Sdn. Bhd. (10)
(Accounting year ended 30 September)Malaysia Property
development30 30
AssociatesHeld through subsidiaries:Guilin Hinwei Tin Co Ltd. ß + (Accounting year ended 31 December)
People’s Republic of China
Dormant 19 19
Redring Solder (M) Sdn. Bhd. (1) ß
(Accounting year ended 31 December)Malaysia Manufacture
and sale of solder products
22 22
ARA Asset Management Holdings Pte. Ltd. (2)
(Accounting year ended 31 December)Singapore Investment 21 – (e)
ARA Asset Management Limited (2)
(Accounting year ended 31 December)Bermuda Asset/Fund
management– 20 (e)
Far East Hospitality Holdings Pte. Ltd. (4)
(Accounting year ended 31 December)Singapore Owner,
operator and manager of hospitality properties
30 30
ARA Harmony Fund III, L.P. (2)
(Accounting year ended 31 December) Cayman Islands Investment 36 36 (f)
Greater Tokyo Office Fund (Jersey) L.P. (3)
(Accounting year ended 31 December) Jersey Investment 34 40 (g)
Joint VenturesHeld through subsidiaries:KM Resources, Inc. (1) ß
(Accounting year ended 31 December)Labuan,
MalaysiaInvestment
holding16 16 (h)
Africa Smelting Corporation Sprl (5) ß
(Accounting year ended 31 December)Democratic
Republic of Congo
Tin smelting 22 22 (i)
320P Trust (5) Cayman Islands Property 23 – (j)
NOTES TO THE FINANCIAL STATEMENTSFor the financial year ended 31 December 2017
144 OUR BUSINESS PLATFORMS OUR GROWTH DRIVERS
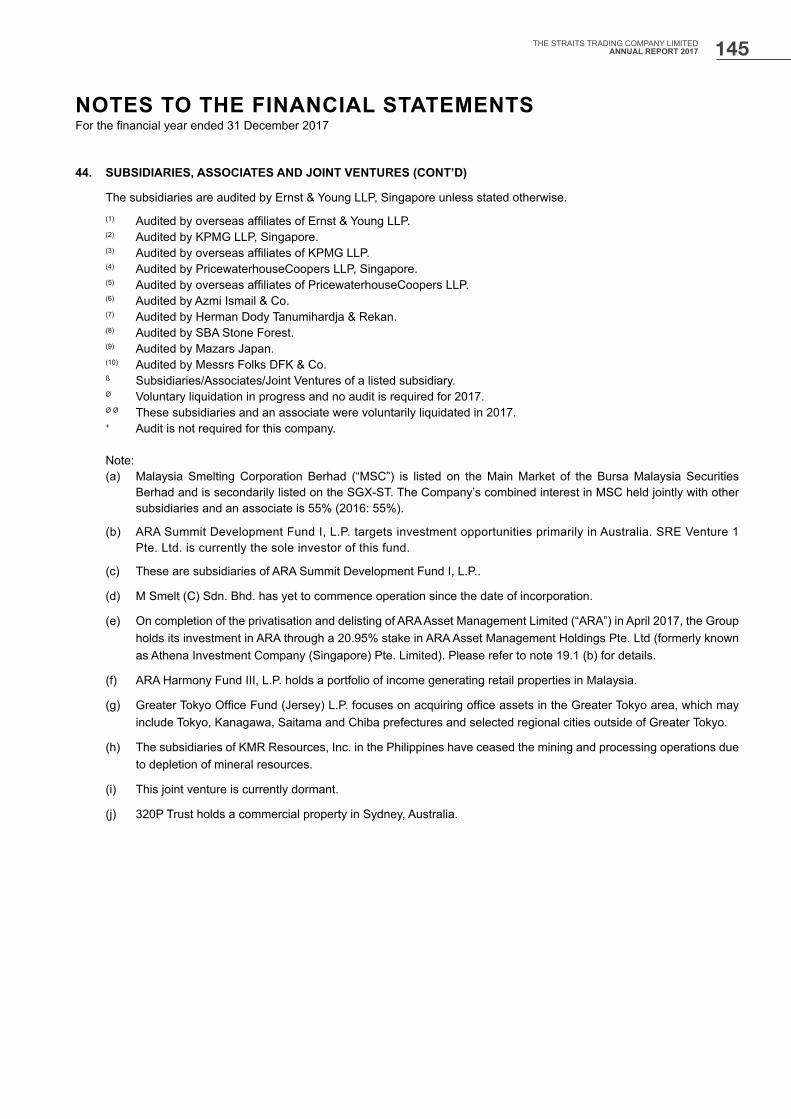
44. SUBSIDIARIES, ASSOCIATES AND JOINT VENTURES (CONT’D)
The subsidiaries are audited by Ernst & Young LLP, Singapore unless stated otherwise.(1) Audited by overseas affiliates of Ernst & Young LLP.(2) Audited by KPMG LLP, Singapore.(3) Audited by overseas affiliates of KPMG LLP.(4) Audited by PricewaterhouseCoopers LLP, Singapore.
(5) Audited by overseas affiliates of PricewaterhouseCoopers LLP. (6) Audited by Azmi Ismail & Co. (7) Audited by Herman Dody Tanumihardja & Rekan.(8) Audited by SBA Stone Forest.(9) Audited by Mazars Japan.(10) Audited by Messrs Folks DFK & Co.ß Subsidiaries/Associates/Joint Ventures of a listed subsidiary.Ø Voluntary liquidation in progress and no audit is required for 2017.Ø Ø These subsidiaries and an associate were voluntarily liquidated in 2017.+ Audit is not required for this company.
Note:(a) Malaysia Smelting Corporation Berhad (“MSC”) is listed on the Main Market of the Bursa Malaysia Securities
Berhad and is secondarily listed on the SGX-ST. The Company’s combined interest in MSC held jointly with other subsidiaries and an associate is 55% (2016: 55%).
(b) ARA Summit Development Fund I, L.P. targets investment opportunities primarily in Australia. SRE Venture 1 Pte. Ltd. is currently the sole investor of this fund.
(c) These are subsidiaries of ARA Summit Development Fund I, L.P..
(d) M Smelt (C) Sdn. Bhd. has yet to commence operation since the date of incorporation.
(e) On completion of the privatisation and delisting of ARA Asset Management Limited (“ARA”) in April 2017, the Group holds its investment in ARA through a 20.95% stake in ARA Asset Management Holdings Pte. Ltd (formerly known as Athena Investment Company (Singapore) Pte. Limited). Please refer to note 19.1 (b) for details.
(f) ARA Harmony Fund III, L.P. holds a portfolio of income generating retail properties in Malaysia.
(g) Greater Tokyo Office Fund (Jersey) L.P. focuses on acquiring office assets in the Greater Tokyo area, which may include Tokyo, Kanagawa, Saitama and Chiba prefectures and selected regional cities outside of Greater Tokyo.
(h) The subsidiaries of KMR Resources, Inc. in the Philippines have ceased the mining and processing operations due to depletion of mineral resources.
(i) This joint venture is currently dormant.
(j) 320P Trust holds a commercial property in Sydney, Australia.
NOTES TO THE FINANCIAL STATEMENTSFor the financial year ended 31 December 2017
145THE STRAITS TRADING COMPANY LIMITEDANNUAL REPORT 2017
ADDITIONAL INFORMATION REQUIRED UNDER THE MAINBOARD RULES OF THE SINGAPORE EXCHANGE SECURITIES TRADING LIMITED (“SGX-ST”)
INTERESTED PERSON TRANSACTIONS(Rules 907 and 1207(17))
There were no interested person transactions of S$100,000 and above between the Company or its subsidiaries and any of its interested persons during the financial year ended 31 December 2017.
The Company does not have a general mandate from shareholders in relation to interested person transactions pursuant to Rule 920 of SGX-ST’s Mainboard Rules.
MATERIAL CONTRACTS(Rule 1207(8))
No material contract involving the interests of any Director or controlling shareholder of the Company has been entered into by the Company or any of its subsidiaries since the end of the previous financial year and no such contract subsisted at the end of the financial year ended 31 December 2017.
146 OUR BUSINESS PLATFORMS OUR GROWTH DRIVERS

SHAREHOLDINGS INFORMATION(AS AT 15 MARCH 2018)
VOTING RIGHTS
Shareholders’ voting rights are set out in Article 72 of the Company’s Constitution:
On a show of hands, every member present in person or by proxy shall have one vote and upon a poll, every member present in person or by proxy shall have one vote for every share which he holds.
Issued Ordinary Shares (“Shares”) and Shareholders
Size of Shareholdings No. of Shareholders % No. of Shares %
1 − 99 233 4.94 8,585 0.00100 − 1,000 1,164 24.68 654,084 0.161,001 − 10,000 2,635 55.86 10,525,351 2.5810,001 − 1,000,000 677 14.35 29,559,921 7.241,000,001 and above 8 0.17 367,347,831 90.02Total 4,717 100.00 408,095,772 100.00
TWENTY LARGEST SHAREHOLDERS
Registered Shareholders No. of Shares %
1. THE CAIRNS PTE. LTD. 265,840,552 65.142. CITIBANK NOMINEES SINGAPORE PTE LTD 46,232,080 11.333. UNITED OVERSEAS BANK NOMINEES PTE LTD 18,879,796 4.634. BPSS NOMINEES SINGAPORE (PTE.) LTD. 17,838,535 4.375. DBS NOMINEES PTE LTD 12,496,974 3.066. DBSN SERVICES PTE LTD 2,702,008 0.667. UOB KAY HIAN PTE LTD 2,283,848 0.568. DBS VICKERS SECURITIES (SINGAPORE) PTE LTD 1,074,038 0.269. PHILLIP SECURITIES PTE LTD 901,072 0.2210. OCBC SECURITIES PRIVATE LTD 885,111 0.2211. LOKE WAN YAT REALTY SDN BHD 721,400 0.1812. RAFFLES NOMINEES (PTE) LTD 688,763 0.1713. UOB NOMINEES (2006) PTE LTD 591,608 0.1414. MAYBANK NOMINEES (SINGAPORE) PTE LTD 580,204 0.1415. HSBC (SINGAPORE) NOMINEES PTE LTD 516,324 0.1316. OCBC NOMINEES SINGAPORE PTE LTD 498,200 0.1217. LOKE YUEN KIN RUBY MRS TAN KIA MENG 448,601 0.1118. CHOO MEILEEN 414,432 0.1019. AU YONG AH NGOH 396,984 0.1020. KUEK SIAW KIA @ QUEK SHIEW POH 365,900 0.09 374,356,430 91.73
147THE STRAITS TRADING COMPANY LIMITEDANNUAL REPORT 2017
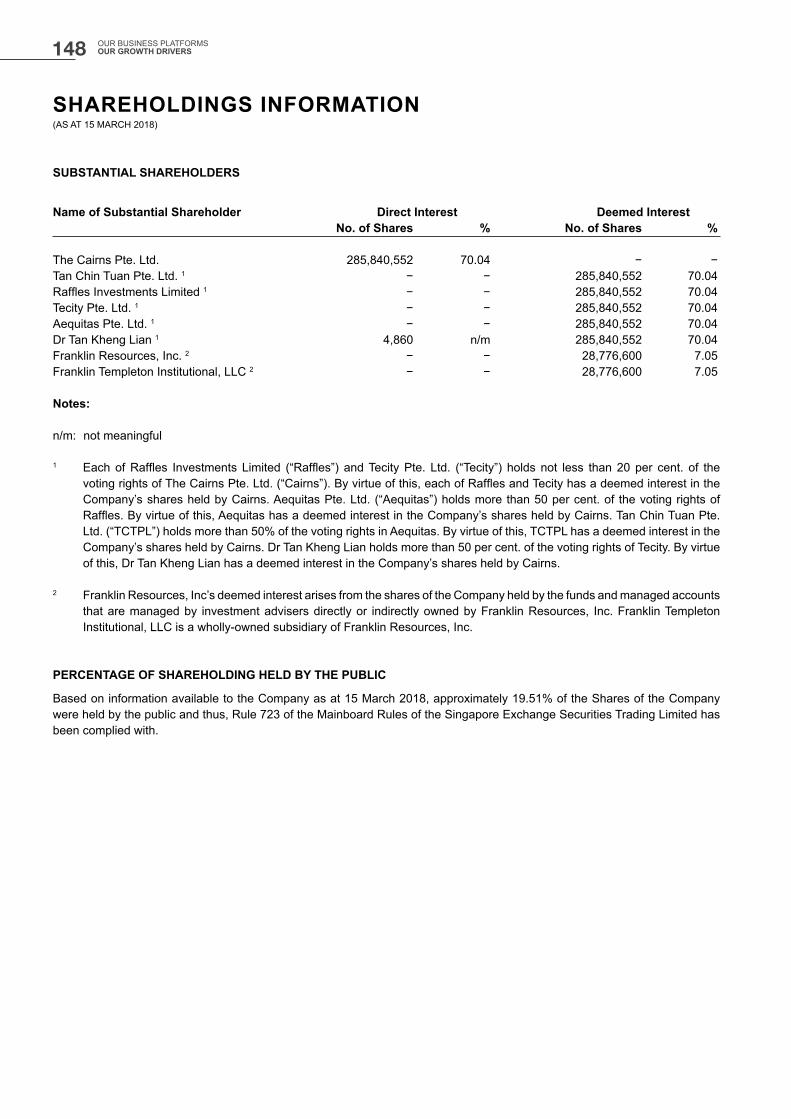
SHAREHOLDINGS INFORMATION(AS AT 15 MARCH 2018)
SUBSTANTIAL SHAREHOLDERS
Name of Substantial Shareholder Direct Interest Deemed Interest No. of Shares % No. of Shares %
The Cairns Pte. Ltd. 285,840,552 70.04 − −Tan Chin Tuan Pte. Ltd. 1 − − 285,840,552 70.04Raffles Investments Limited 1 − − 285,840,552 70.04Tecity Pte. Ltd. 1 − − 285,840,552 70.04Aequitas Pte. Ltd. 1 − − 285,840,552 70.04Dr Tan Kheng Lian 1 4,860 n/m 285,840,552 70.04Franklin Resources, Inc. 2 − − 28,776,600 7.05Franklin Templeton Institutional, LLC 2 − − 28,776,600 7.05
Notes:
n/m: not meaningful
1 Each of Raffles Investments Limited (“Raffles”) and Tecity Pte. Ltd. (“Tecity”) holds not less than 20 per cent. of the voting rights of The Cairns Pte. Ltd. (“Cairns”). By virtue of this, each of Raffles and Tecity has a deemed interest in the Company’s shares held by Cairns. Aequitas Pte. Ltd. (“Aequitas”) holds more than 50 per cent. of the voting rights of Raffles. By virtue of this, Aequitas has a deemed interest in the Company’s shares held by Cairns. Tan Chin Tuan Pte. Ltd. (“TCTPL”) holds more than 50% of the voting rights in Aequitas. By virtue of this, TCTPL has a deemed interest in the Company’s shares held by Cairns. Dr Tan Kheng Lian holds more than 50 per cent. of the voting rights of Tecity. By virtue of this, Dr Tan Kheng Lian has a deemed interest in the Company’s shares held by Cairns.
2 Franklin Resources, Inc’s deemed interest arises from the shares of the Company held by the funds and managed accounts that are managed by investment advisers directly or indirectly owned by Franklin Resources, Inc. Franklin Templeton Institutional, LLC is a wholly-owned subsidiary of Franklin Resources, Inc.
PERCENTAGE OF SHAREHOLDING HELD BY THE PUBLIC
Based on information available to the Company as at 15 March 2018, approximately 19.51% of the Shares of the Company were held by the public and thus, Rule 723 of the Mainboard Rules of the Singapore Exchange Securities Trading Limited has been complied with.
148 OUR BUSINESS PLATFORMS OUR GROWTH DRIVERS

NOTICE OF ANNUAL GENERAL MEETING
NOTICE IS HEREBY GIVEN that the Annual General Meeting (the “Meeting”) of members of The Straits Trading Company Limited (the “Company”) will be held at Symphony 2 and 3, Rendezvous Hotel Singapore, 9 Bras Basah Road, Singapore 189559 on Friday, 27 April 2018 at 11.00 a.m. for the following business:
1. To receive and adopt the Audited Financial Statements for the year ended 31 December 2017, the Directors’ Statement and the Independent Auditor’s Report thereon
2. To re-elect the following Directors who are retiring by rotation pursuant to Article 99 of the Company’s Constitution and who, being eligible, offer themselves for re-election:
(a) Ms Chew Gek Khim
(Note: Ms Chew Gek Khim, if re-elected, will remain as Chairman of the Board and a member of the Nominating Committee.)
(b) Mr Chia Chee Ming, Timothy
(Note: Mr Chia Chee Ming, Timothy, if re-elected, will remain as the chairman of the Nominating Committee and member of the Audit and Risk Committee. He is considered an independent Director and will continue to be the Lead Independent Director.)
Mr Tham Kui Seng is retiring pursuant to Article 99 of the Company’s Constitution and has notified the Company that he will not be seeking re-election as a Director at the Meeting.
3. To re-elect the following Directors who are retiring pursuant to Article 103 of the Company’s Constitution and who, being eligible, offer themselves for re-election:
(a) Mr Tan Chian Khong
(Note: Mr Tan Chian Khong, if re-elected, will remain as a member of the Audit and Risk Committee and is considered an independent Director.)
(b) Mr Chua Tian Chu
(Note: Mr Chua Tian Chu, if re-elected, will remain as a member of the Nominating Committee and is considered an independent Director.)
4. To approve the payment of Directors’ fees of S$742,000 for the year ended 31 December 2017 (2016: S$814,889)
5. To re-appoint Ernst & Young LLP as the Independent Auditor of the Company and to authorise the Board to fix their remuneration
6. As Special Business:
To consider and, if thought fit, to pass, with or without modifications, the following resolution as an Ordinary Resolution:
“That pursuant to section 161 of the Companies Act, Chapter 50 of Singapore (the “Act”) and the Listing Manual of the Singapore Exchange Securities Trading Limited (“SGX-ST”), authority be and is hereby given to the Directors of the Company to:
(a) (i) issue shares in the capital of the Company (“Shares”) whether by way of rights, bonus or otherwise; and/or
(ii) make or grant offers, agreements or options (collectively, “Instruments”) that might or would require Shares to be issued, including but not limited to the creation and issue of (as well as adjustments to) warrants, debentures or other instruments convertible into Shares,
149THE STRAITS TRADING COMPANY LIMITEDANNUAL REPORT 2017
NOTICE OF ANNUAL GENERAL MEETING
at any time and upon such terms and conditions and for such purposes and to such persons as the Directors may in their absolute discretion deem fit; and
(b) (notwithstanding the authority conferred by this Resolution may have ceased to be in force) issue Shares in pursuance of any Instrument made or granted by the Directors while this Resolution was in force,
provided that:
(1) the aggregate number of Shares to be issued pursuant to this Resolution (including Shares to be issued in pursuance of Instruments made or granted pursuant to this Resolution) does not exceed 50% of the total number of issued Shares (as calculated in accordance with sub-paragraph (2) below), of which the aggregate number of Shares to be issued other than on a pro-rata basis to shareholders of the Company (including Shares to be issued in pursuance of Instruments made or granted pursuant to this Resolution) shall not exceed 20% of the total number of issued Shares (as calculated in accordance with sub-paragraph (2) below);
(2) (subject to such manner of calculation as may be prescribed by SGX-ST) for the purpose of determining the aggregate number of Shares that may be issued under sub-paragraph (1) above, the percentage of issued Shares shall be based on the total number of issued Shares at the time this Resolution is passed, after adjusting for:
(i) new Shares arising from the conversion or exercise of any convertible securities or share options or vesting of share awards which are outstanding or subsisting at the time this Resolution is passed; and
(ii) any subsequent bonus issue, consolidation or subdivision of Shares;
(3) in exercising the authority conferred by this Resolution, the Company shall comply with the provisions of the Act and the Listing Manual of the SGX-ST for the time being in force (unless such compliance has been waived by the SGX-ST) and the Constitution for the time being of the Company; and
(4) (unless revoked or varied by the Company in general meeting) the authority conferred by this Resolution shall continue in force until the conclusion of the next Annual General Meeting of the Company or the date by which the next Annual General Meeting of the Company is required by law to be held, whichever is the earlier.”
7. To transact any other ordinary business of the Company
By Order of the Board
Aldric Tan Jee WeiCompany Secretary
Singapore10 April 2018
150 OUR BUSINESS PLATFORMS OUR GROWTH DRIVERS
NOTICE OF ANNUAL GENERAL MEETING
Notes:
A member of the Company is entitled to appoint a proxy to attend the Meeting and vote in his stead. A proxy need not be a member of the Company. Proxy forms must be deposited at the Company’s registered office not less than 48 hours before the time for holding the Meeting or any adjournment thereof.
ADDITIONAL INFORMATION RELATING TO NOTICE OF ANNUAL GENERAL MEETING:
The Ordinary Resolution in item 6 above, if passed, will renew the authority for the Directors, effective until the next Annual General Meeting, to issue Shares, make or grant instruments convertible into Shares and to issue Shares pursuant to such instruments, up to a limit of 50% of the total number of issued Shares in the capital of the Company, of which up to 20% for issues other than on a pro-rata basis, calculated as described in the Resolution.
PERSONAL DATA PRIVACY
By submitting an instrument appointing a proxy(ies) and/or representative(s) to attend, speak and vote at the Meeting and/or any adjournment thereof, a member of the Company (i) consents to the collection, use and disclosure of the member’s personal data by the Company (or its agents or service providers) for the purpose of the processing, administration and analysis by the Company (or its agents or service providers) of proxies and representatives appointed for the Meeting (including any adjournment thereof) and the preparation and compilation of the attendance lists, minutes and other documents relating to the Meeting (including any adjournment thereof), and in order for the Company (or its agents or service providers) to comply with any applicable laws, listing rules, regulations and/or guidelines (collectively, the “Purposes”), (ii) warrants that where the member discloses the personal data of the member’s proxy(ies) and/or representative(s) to the Company (or its agents or service providers), the member has obtained the prior consent of such proxy(ies) and/or representative(s) for the collection, use and disclosure by the Company (or its agents or service providers) of the personal data of such proxy(ies) and/or representative(s) for the Purposes, and (iii) agrees that the member will indemnify the Company in respect of any penalties, liabilities, claims, demands, losses and damages as a result of the member’s breach of warranty.
151THE STRAITS TRADING COMPANY LIMITEDANNUAL REPORT 2017

Page has been left intentionally blank

Page has been left intentionally blank

Page has been left intentionally blank
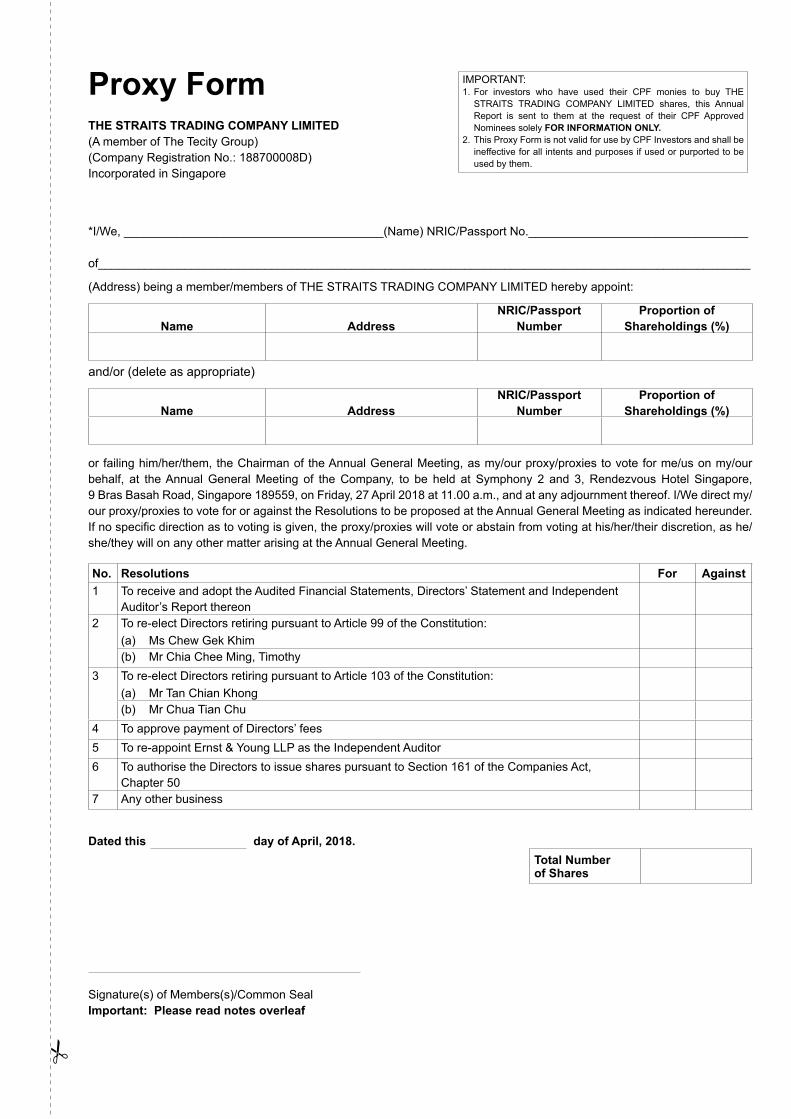
Proxy FormTHE STRAITS TRADING COMPANY LIMITED(A member of The Tecity Group)(Company Registration No.: 188700008D)Incorporated in Singapore
*I/We, _______________________________________(Name) NRIC/Passport No._________________________________
of__________________________________________________________________________________________________
(Address) being a member/members of THE STRAITS TRADING COMPANY LIMITED hereby appoint:
Name AddressNRIC/Passport
NumberProportion of
Shareholdings (%)
and/or (delete as appropriate)
Name AddressNRIC/Passport
NumberProportion of
Shareholdings (%)
or failing him/her/them, the Chairman of the Annual General Meeting, as my/our proxy/proxies to vote for me/us on my/our behalf, at the Annual General Meeting of the Company, to be held at Symphony 2 and 3, Rendezvous Hotel Singapore, 9 Bras Basah Road, Singapore 189559, on Friday, 27 April 2018 at 11.00 a.m., and at any adjournment thereof. I/We direct my/our proxy/proxies to vote for or against the Resolutions to be proposed at the Annual General Meeting as indicated hereunder. If no specific direction as to voting is given, the proxy/proxies will vote or abstain from voting at his/her/their discretion, as he/she/they will on any other matter arising at the Annual General Meeting.
No. Resolutions For Against1 To receive and adopt the Audited Financial Statements, Directors’ Statement and Independent
Auditor’s Report thereon2 To re-elect Directors retiring pursuant to Article 99 of the Constitution:
(a) Ms Chew Gek Khim(b) Mr Chia Chee Ming, Timothy
3 To re-elect Directors retiring pursuant to Article 103 of the Constitution:(a) Mr Tan Chian Khong(b) Mr Chua Tian Chu
4 To approve payment of Directors’ fees5 To re-appoint Ernst & Young LLP as the Independent Auditor6 To authorise the Directors to issue shares pursuant to Section 161 of the Companies Act,
Chapter 507 Any other business
Dated this day of April, 2018.
Signature(s) of Members(s)/Common SealImportant: Please read notes overleaf
IMPORTANT:1. For investors who have used their CPF monies to buy THE
STRAITS TRADING COMPANY LIMITED shares, this Annual Report is sent to them at the request of their CPF Approved Nominees solely FOR INFORMATION ONLY.
2. This Proxy Form is not valid for use by CPF Investors and shall be ineffective for all intents and purposes if used or purported to be used by them.
Total Number of Shares
Notes:
1. A member (other than a Relevant Intermediary) entitled to attend and vote at the Annual General Meeting is entitled to appoint not more than two proxies to attend and vote on his behalf. A proxy need not be a member of the Company. Where a member appoints more than one proxy, he shall specify the proportion of his shareholding to be represented by each proxy. If no such proportion or number is specified, the first named proxy may be treated as representing 100% of the shareholding and any second-named proxy as an alternate to the first named.
2. A member who is a Relevant Intermediary entitled to attend and vote at the Annual General Meeting is entitled to appoint one or more proxies to attend and vote in his stead but each proxy must be appointed to exercise the rights attached to a different share or shares held by such member. Where such member appoints more than two proxies, the number and class of shares to be represented by each proxy must be stated.
“Relevant Intermediary” means:
(a) a banking corporation licensed under the Banking Act, Chapter 19 of Singapore or a wholly-owned subsidiary of such a banking corporation, whose business includes the provision of nominee services and who holds shares in that capacity;
(b) a person holding a capital markets services licence to provide custodial services for securities under the Securities and Futures Act, Chapter 289 of Singapore and who holds shares in that capacity; or
(c) the Central Provident Fund Board (“CPF Board”) established by the Central Provident Fund Act, Chapter 36 of Singapore, in respect of shares purchased under the subsidiary legislation made under that Act providing for the making of investments from the contributions and interest standing to the credit of members of the Central Provident Fund, if the CPF Board holds those shares in the capacity of an intermediary pursuant to or in accordance with that subsidiary legislation.
3. The instrument appointing a proxy or proxies must be under the hand of the appointor or his attorney duly authorised in writing. Where the instrument appointing a proxy or proxies is executed by a corporation, it must be executed under its common seal or under the hand of its attorney or duly authorised officer.
4. A corporation which is a member of the Company may authorise by resolution of its directors or other governing body such person as it thinks fit to act as its representative at the Annual General Meeting in accordance with the Constitution of the Company and Section 179 of the Companies Act, Chapter 50 of Singapore.
5. The instrument appointing a proxy or proxies, together with the power of attorney or other authority (if any) under which it is signed, or a notarially certified copy thereof, must be deposited at the office of the Company at 1 Wallich Street #15-01, Guoco Tower, Singapore 078881 not less than 48 hours before the time appointed for the Annual General Meeting. The sending of this form of proxy by a member does not preclude him from attending and voting in person at the Annual General Meeting if he finds that he is able to do so. In such event, the relevant instrument of proxy will be deemed to be revoked and the Company reserves the right to refuse to admit any person or persons appointed under the instrument of proxy to the Annual General Meeting.
6. A member of the Company should insert the total number of shares held. If the member has shares entered against his name in the Depository Register (as defined in Section 81SF of the Securities and Futures Act, Chapter 289 of Singapore), he should insert that number of shares. If the member has shares registered in his name in the Register of Members of the Company, he should insert that number of shares. If the member has shares entered against his name in the Depository Register and shares registered in his name in the Register of Members of the Company, he should insert the aggregate number of shares. If no number is inserted, this form of proxy will be deemed to relate to all the shares held by the member of the Company.
7. The Company shall be entitled to reject the instrument appointing a proxy or proxies if it is incomplete, improperly completed or illegible or where the true intentions of the appointor are not ascertainable from the instructions of the appointor specified in the instrument appointing a proxy or proxies. In addition, in the case of members of the Company whose shares are entered against their names in the Depository Register, the Company may reject any instrument appointing a proxy or proxies lodged if such members are not shown to have shares entered against their names in the Depository Register 72 hours before the time appointed for the Annual General Meeting as certified by The Central Depository (Pte) Limited to the Company.
8. A Depositor shall not be regarded as a member of the Company entitled to attend the Annual General Meeting and to speak and vote thereat unless his name appears on the Depository Register 72 hours before the time appointed for the Annual General Meeting.
9. An investor who buys shares using CPF monies (‘‘CPF Investor”) and/or SRS monies (“SRS Investor”), as may be applicable, may attend and cast his vote(s) at the Annual General Meeting in person. CPF and SRS Investors who are unable to attend the Annual General Meeting but would like to vote, may inform their CPF and/or SRS Approved Nominees to appoint the Chairman of the Annual General Meeting to act as their proxy, in which case, the CPF and SRS Investors shall be precluded from attending the Annual General Meeting.
PERSONAL DATA PRIVACY
By submitting an instrument appointing a proxy(ies) and/or representative(s) to attend, speak and vote at the Annual General Meeting and/or any adjournment thereof, a member of the Company (i) consents to the collection, use and disclosure of the member’s personal data by the Company (or its agents or service providers) for the purpose of the processing, administration and analysis by the Company (or its agents or service providers) of proxies and representatives appointed for the Annual General Meeting (including any adjournment thereof) and the preparation and compilation of the attendance lists, minutes and other documents relating to the Annual General Meeting (including any adjournment thereof), and in order for the Company (or its agents or service providers) to comply with any applicable laws, listing rules, regulations and/or guidelines (collectively, the “Purposes”), (ii) warrants that where the member discloses the personal data of the member’s proxy(ies) and/or representative(s) to the Company (or its agents or service providers), the member has obtained the prior consent of such proxy(ies) and/or representative(s) for the collection, use and disclosure by the Company (or its agents or service providers) of the personal data of such proxy(ies) and/or representative(s) for the Purposes, and (iii) agrees that the member will indemnify the Company in respect of any penalties, liabilities, claims, demands, losses and damages as a result of the member’s breach of warranty.
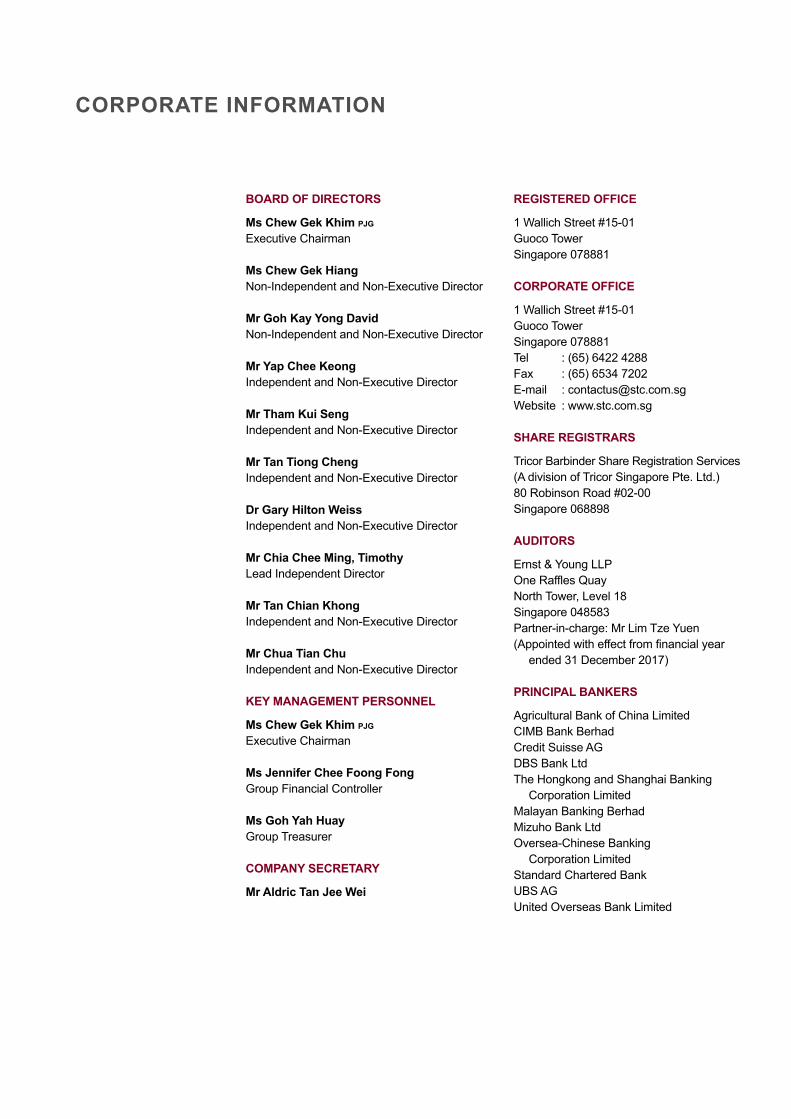
CORPORATE INFORMATION
BOARD OF DIRECTORS
Ms Chew Gek Khim PJG
Executive Chairman
Ms Chew Gek HiangNon-Independent and Non-Executive Director
Mr Goh Kay Yong DavidNon-Independent and Non-Executive Director
Mr Yap Chee KeongIndependent and Non-Executive Director
Mr Tham Kui SengIndependent and Non-Executive Director
Mr Tan Tiong ChengIndependent and Non-Executive Director
Dr Gary Hilton WeissIndependent and Non-Executive Director
Mr Chia Chee Ming, TimothyLead Independent Director
Mr Tan Chian KhongIndependent and Non-Executive Director
Mr Chua Tian ChuIndependent and Non-Executive Director
KEY MANAGEMENT PERSONNEL
Ms Chew Gek Khim PJG
Executive Chairman
Ms Jennifer Chee Foong FongGroup Financial Controller
Ms Goh Yah HuayGroup Treasurer
COMPANY SECRETARY
Mr Aldric Tan Jee Wei
REGISTERED OFFICE
1 Wallich Street #15-01Guoco TowerSingapore 078881
CORPORATE OFFICE
1 Wallich Street #15-01Guoco TowerSingapore 078881Tel : (65) 6422 4288Fax : (65) 6534 7202E-mail : [email protected] : www.stc.com.sg
SHARE REGISTRARS
Tricor Barbinder Share Registration Services(A division of Tricor Singapore Pte. Ltd.)80 Robinson Road #02-00Singapore 068898
AUDITORS
Ernst & Young LLPOne Raffles QuayNorth Tower, Level 18Singapore 048583Partner-in-charge: Mr Lim Tze Yuen(Appointed with effect from financial year
ended 31 December 2017)
PRINCIPAL BANKERS
Agricultural Bank of China LimitedCIMB Bank BerhadCredit Suisse AGDBS Bank LtdThe Hongkong and Shanghai Banking
Corporation LimitedMalayan Banking BerhadMizuho Bank LtdOversea-Chinese Banking Corporation LimitedStandard Chartered BankUBS AGUnited Overseas Bank Limited
THE STRAITS TRADING COMPANY LIMITED (Co. Reg. No.: 188700008D) 1 Wallich Street #15-01 Guoco TowerSingapore 078881 Tel: (65) 6422 4288Fax: (65) 6534 7202
www.stc.com.sg
TH
E S
TR
AIT
S T
RA
DIN
G C
OM
PAN
Y L
IMIT
ED
A
nnual Report 2017
A N N U A L R E P O R T 2 0 1 7
OUR BUSINESS PLATFORMSOUR GROWTH DRIVERS
This Annual Report is printed on papers from sustainable sources.


