61
Our Clodhopper Footprint: Some Hows and Whys ANTH 210 17 November, 2005
| Date post: | 22-Dec-2015 |
| Category: |
Documents |
| View: | 217 times |
| Download: | 0 times |

Our Clodhopper Footprint:Some Hows and Whys
ANTH 210
17 November, 2005
Topics to Cover
• Energy use– World patterns of energy use– National variation– Comparison of energy sources– Individual sources for renewable energy
• American culture and energy– Car culture and car advertising– Bigger and bigger houses– Industrial agriculture– Freedom and property rights

Contributions to our Footprint(average Canadian, from book)
Type of land Average hectares
Energy 2.34
Degraded 0.20
Garden 0.02
Crop 0.66
Pasture 0.46
Forest 0.59
Total 4.27
Livingstandard
s
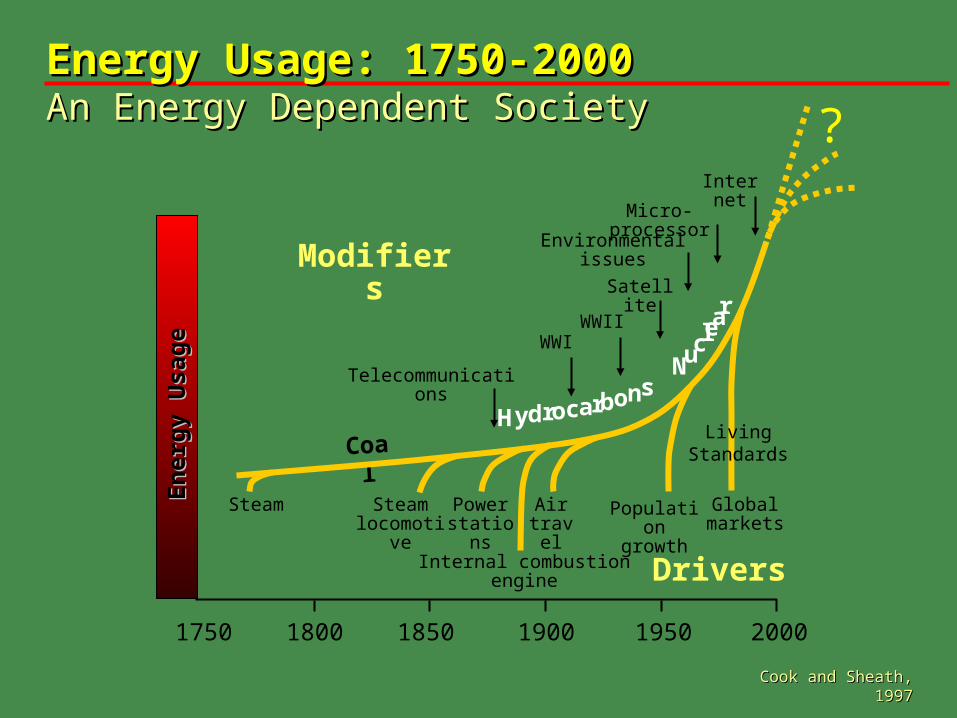
Energy Usage: 1750-2000Energy Usage: 1750-2000
Coal
An Energy Dependent SocietyAn Energy Dependent Society
Steam Steamlocomotive
Powerstations
Internal combustion engine
Airtravel
Populationgrowth
Globalmarkets
1750 1800 1850 1900 1950 2000
Telecommunications
WWIWWII
Satellite
Environmental issues
Micro-processor
InternetE
ner
gy
Usa
ge
En
erg
y U
sag
e
?
Modifiers
Drivers
Cook and Sheath, 1997Cook and Sheath, 1997
Hydrocarbons Nuc
lear
LivingStandards

GDP and energy consumption

024839-2
Projected World Supplies
19001900 19201920 19401940 19601960 19801980 20002000 20202020 20402040 20602060 20802080 2100
2020
4040
6060
8080
100100100 BILLION
BARRELS
Billion Barrels
of Oil Equivalent
per Year (GBOE)
Billion Barrels
of Oil Equivalent
per Year (GBOE) Natural
GasNatural
Gas
HydroelectricHydroelectric
Crude OilCrude Oil
Solar, W ind Geothermal
Nuclear Electric
1993
CoalCoal
24929
Decreasing
Decreasing
Fossil F
uelsF
ossil Fuels
Ne
w T
echno
logies
Ne
w T
echno
logies
World Energy DemandWorld Energy Demand
after Edwards,AAPG 8/97
Bioenergy


China, 1999
India, 1999
USA, 1999

Sectoral Comparisons

Transport Energy
Use, US, 2003

Feel good about taking
the bus?

Feel good about taking
the train?

Energy Intensity: Developed Economies

Energy Intensity: China

Lifecycle Greenhouse EmissionsLeague Table
* Lifecycle emissions are the sum of emissions from the point of extraction up to and including
emissions from end-use.
Energy Source Lifecycle Emissions(tonnes Co2e/MWhr)
Coal (Hunter Valley to Japan) 865Coal (IGCC, future technology) 766Oil (Middle east to Japan) 728LNG (NWS to Japan) 442Pipeline Natural Gas (NWS to Perth) 493Fuel cell using natural Gas ~380Nuclear (Japan) 40Wind 12.2Solar 13.7Biomass (IGCC) 36

Title :By :
Date :Location :Slide No: 23
Natural GasNatural Gas - A New Energy Paradigm for the Asia/Pacific RegionA New Energy Paradigm for the Asia/Pacific Region
Cost and Greenhouse Emission fromCost and Greenhouse Emission fromEnergy ProductionsEnergy Productions
0
0.2
0.4
0.6
0.8
1
1.2
Brown Coal PFAdv Black Coal(IGCC ect)
Gas, combined
cycle
Dist. Energy(FC, Turbines)Biomass
Combustion Wind Solar ThermalPhotovoltaics0
10
20
30
CO 2 emissions(Tonnes/MWh)
Generating Costs(AUSc/kWh)
Source: from Lockhart 2001 (Energy News Vol.20 No.2 June 2002)

Diminishing Oil Supply
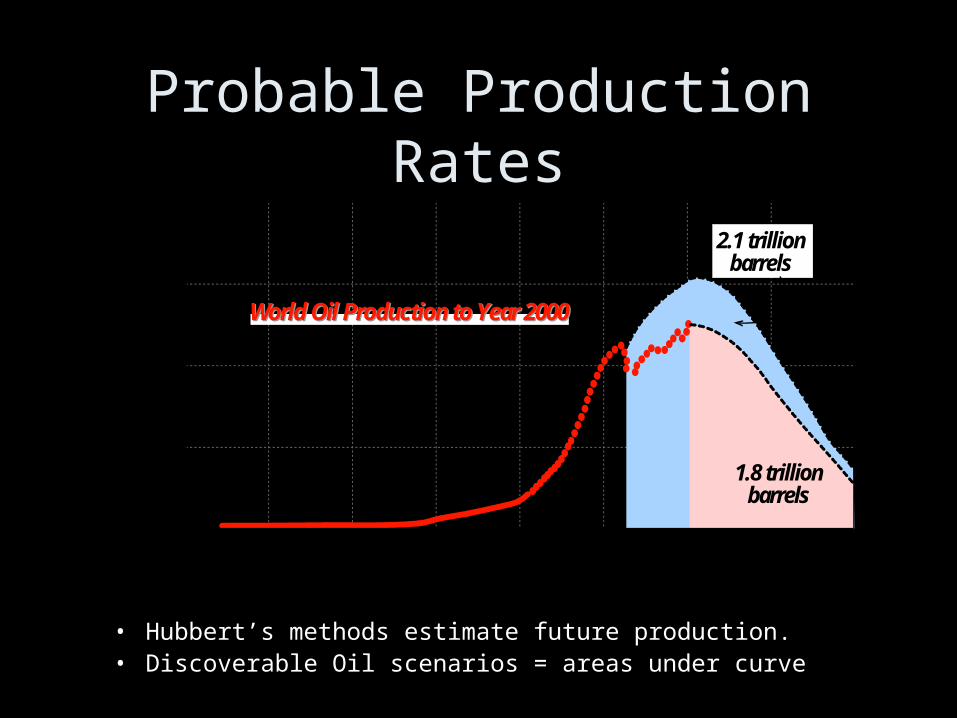
Probable Production Rates
• Hubbert’s methods estimate future production.• Discoverable Oil scenarios = areas under curve
World Oil Production to Year 2000
1850 1875 1900 1925 1950 1975 2000 2025 2050YEARS
40
30
20
10
0
World Oil Production to Year 2000
2.1 trillionbarrels
1.8 trillionbarrels

Crude Oil Prices 1860 - 1996Crude Oil Prices 1860 - 1996
0
5
10
15
20
25
30
35
40
2007
$90+

Coal: Cheap, Dirty, Dangerous

Coal: Cheap, Dirty, DangerousPeat: Like Coal, only more so

Coal: Cheap, Dirty, Dangerous
Strip mine

Coal in the U.S. and China

Why is Coal so Attractive?

Nuclear energy: Who needs it?

Nuclear energy:Will it last?
Known Recoverable Resources* of Uranium
tonnes U percentage of worldAustralia 989,000 28%Kazakhstan 622,000 18%Canada 439,000 12%South Africa 298,000 8%Namibia 213,000 6%Brazil 143,000 4%Russian Fed.158,000 4%USA 102,000 3%Uzbekistan 93,000 3%World total 3,537,000
Thus the world's present measured resources of uranium in the lower cost category (3.5 Mt) and used only in conventional reactors, are enough to last for some 50 years. This represents a higher level of assured resources than is normal for most minerals. Further exploration and higher prices will certainly, on the basis of present geological knowledge, yield further resources as present ones are used up. A doubling of price from present levels could be expected to create about a tenfold increase in measured resources, over time.
This is in fact suggested in the IAEA-NEA figures if those covering estimates of all conventional resources are considered - 14.4 million tonnes, which is over 200 years' supply at today's rate of consumption. This still ignores the technological factors mentioned below. It also omits unconventional resources such as phosphate deposits (22 Mt) and seawater (up to 4000 Mt), which would cost two to six times the present market price to extract.

What about Wind?
Pros:Seems to be approaching economic viabilityCleanLarge supply
Cons:Noisy?Birds?

What about biomass: due for another increase?
Share of Woodfuels in National Energy Consumption

Two Emerging Ideas
Biodiesel Alcohol from Wood

Biodiesel- food oil based fuel
• Can be used in all diesel engines
• Slightly lower BTU than conventional diesel
• Comes from short term C cycle so positive impact on carbon credits
• Significantly lower emissions than conventional diesel
Biodiesel materials courtesy Professor Sally Brown, CFR/Pavilion Pool

Environmental aspects
• Reduced net CO2 (not quite 100%)• Reduced of SO2 by 100%• Reduction of soot emissions by 40-
60%• Extremely non-volatile, easily
decomposable (spills!)• And it even lubes your engine better!
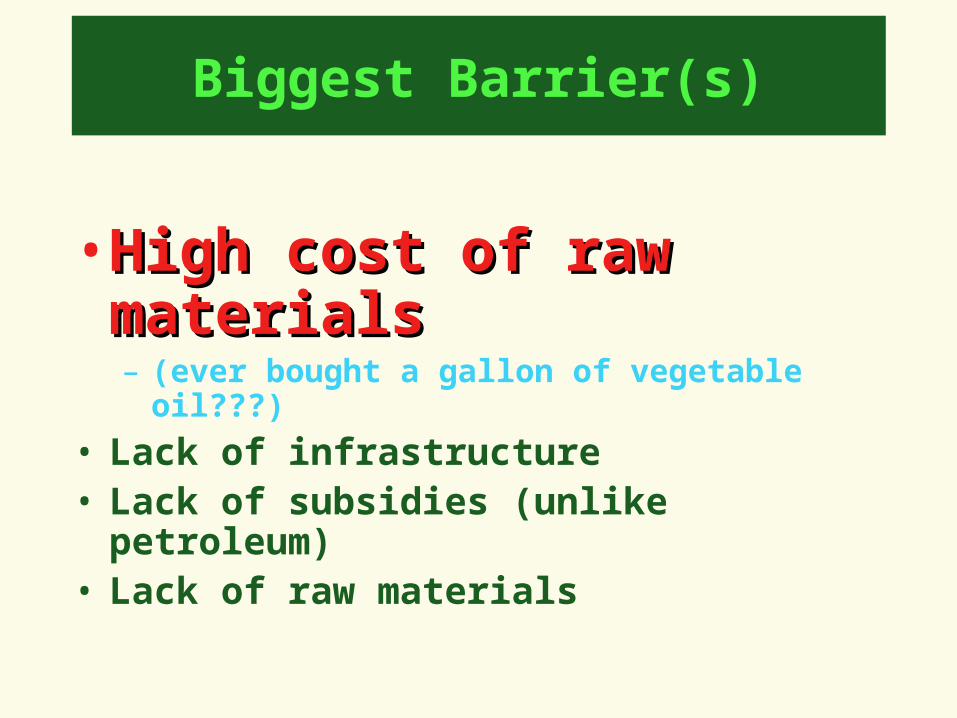
Biggest Barrier(s)
• High cost of raw materialsHigh cost of raw materials– (ever bought a gallon of vegetable oil???)
• Lack of infrastructure• Lack of subsidies (unlike petroleum)• Lack of raw materials
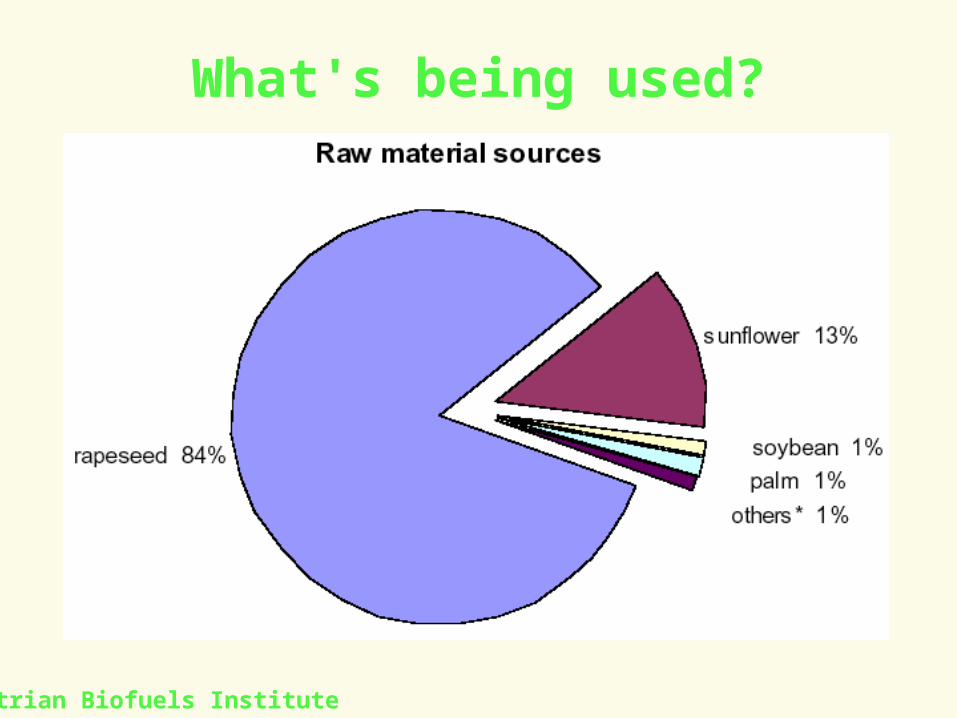
What's being used?
Austrian Biofuels Institute

World production (1000's tons)
Austrian Biofuels Institutue

Biosolids for Biodiesel
• By using biosolids as fertilizer growing costs can be reduced
• Provide a non food chain crop for biosolids
• Provide a means for cities to contract to grow their own fuel
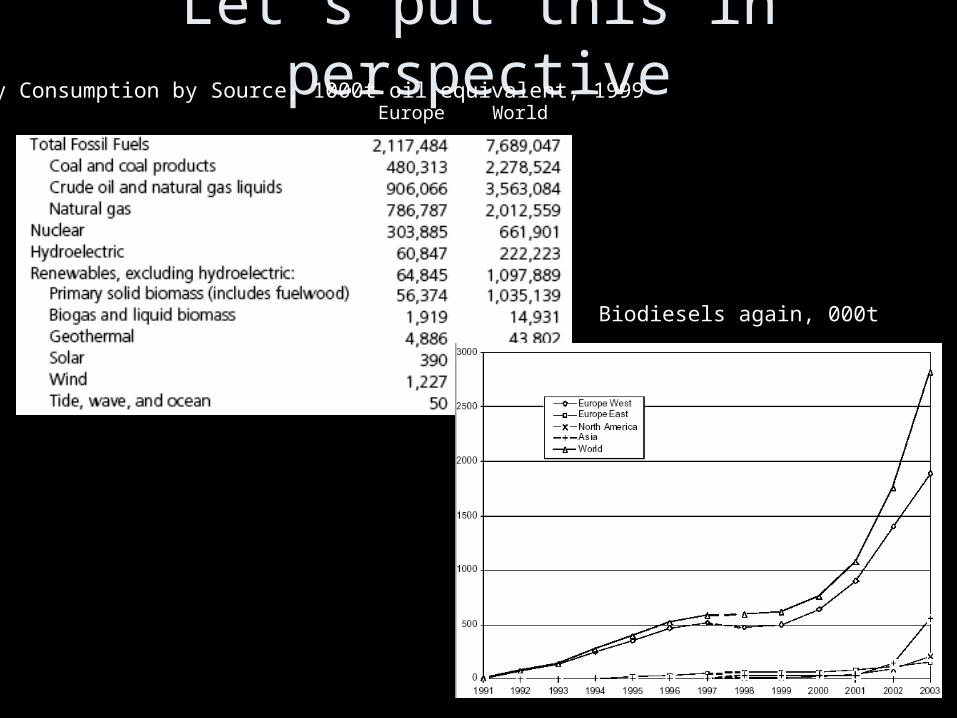
Let’s put this in perspectiveEnergy Consumption by Source, 1000t oil equivalent, 1999
Europe World
Biodiesels again, 000t
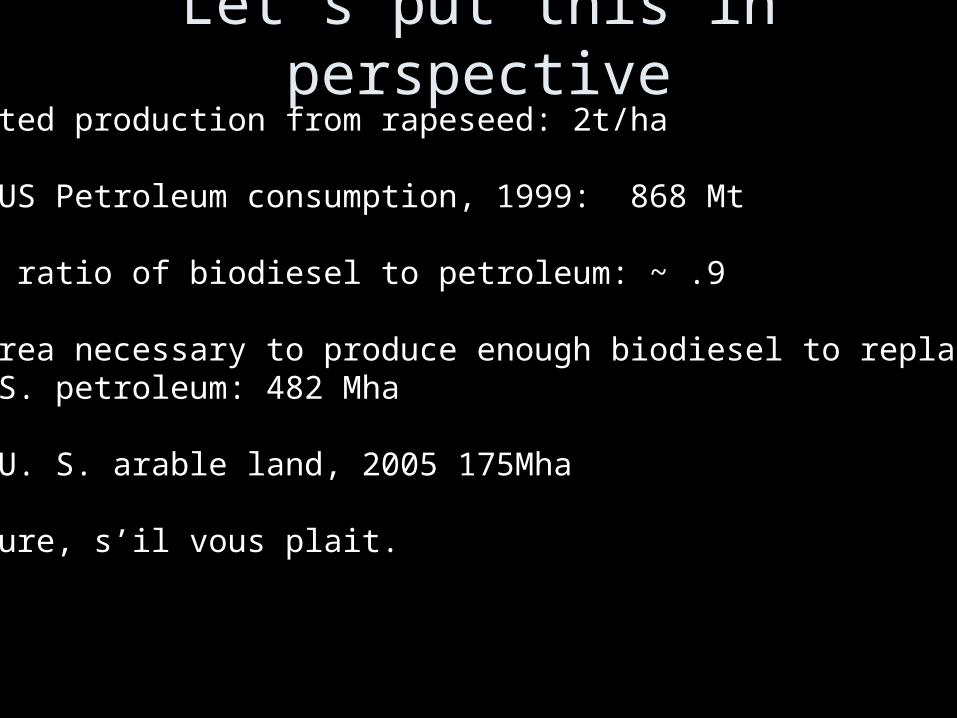
Let’s put this in perspectiveEstimated production from rapeseed: 2t/ha
Total US Petroleum consumption, 1999: 868 Mt
Energy ratio of biodiesel to petroleum: ~ .9
Land area necessary to produce enough biodiesel to replace all U.S. petroleum: 482 Mha
Total U. S. arable land, 2005 175Mha
Go figure, s’il vous plait.

Potential Bio-Energy Technology Solutions Based Potential Bio-Energy Technology Solutions Based on Biomass from Forest Thinningson Biomass from Forest Thinnings
Kevin T. Hodgson
Michael Andreu, Kristiina Vogt, Daniel Vogt, Robert EdmondsForest Systems and Bio-Energy Group
College of Forest Resources
University of Washington
Seattle, WA
http://www.cfr.washington.edu/research.Forest_Energy/

41.1 million acres of treatable timberland in WA & OR
20.7 million acres: considered to be overly dense (red, yellow)
~532.6 million bone dry tons of biomass can be removed in WA & OR.
~28% is in trees 2 – 8” DBH
Equivalent ~149 million tons USFS 2003 A strategic assessment of forest biomass and fuel
reduction treatments in western states
Total Cost of Fire Suppression, US
$0
$200,000,000
$400,000,000
$600,000,000
$800,000,000
$1,000,000,000
$1,200,000,000
$1,400,000,000
$1,600,000,000
$1,800,000,000
1995 1996 1997 1998 1999 2000 2001 2002 2003

2003, Biggest Insurance Losses ($ billions)
0 1 2 3 4
US, Winter Storm
S. Korea, Typhoon Moemi
US, Thunderstorms with hail
US, Thunderstorms, hail
US, "Old fire", wildfire
France, Floods, heavy rain
US, "Cedar Fire" wildfire
US, Thunderstorms, hail
US/Canada, Hurricane Isabel
US, Tornadoes, hail
The Economist, March 20, 2004
Wildfires

Options for bio-fuels from wood
1. Bio-oil Pyrolysis oil (fast pyrolysis process) Substitute for #6 residual fuel oil? High water content (20-30%)
2. Alcohols Ethanol: gasoline extender; transportation fuel; fuel
cell Methanol: transportation fuel; chemical feedstock;
IDEAL fuel for PEM fuel cell
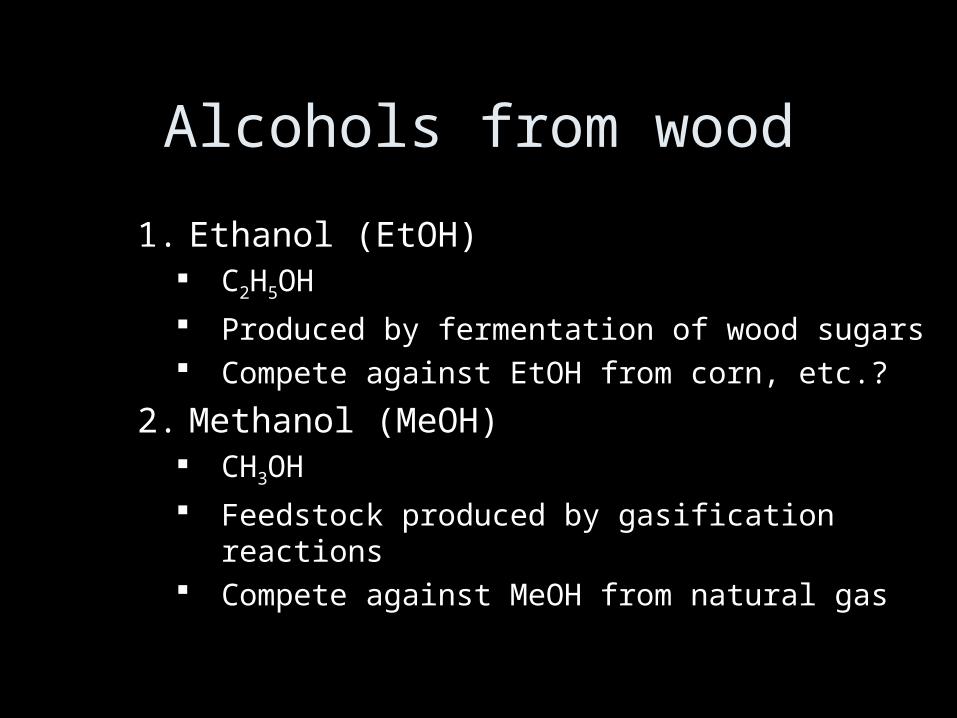
Alcohols from wood
1. Ethanol (EtOH) C2H5OH
Produced by fermentation of wood sugars Compete against EtOH from corn, etc.?
2. Methanol (MeOH) CH3OH
Feedstock produced by gasification reactions Compete against MeOH from natural gas

Methanol from wood
• Wood is a mixture of C, H, and O• Gasification (controlled oxidation) produces a
mixture of:– H2, CO, CO2, H2O, CH4, “tars”, char, ash
– “Synthesis gas”: CO + H2
– tars are light hydrocarbons (benzene, napthalene, etc.)
– Tars can be reformed into CO and H2
• Ni cell catalyst

Carbon Additions to Atmosphere1
Biomass to energy cycle Combustion of Fossil Fuels
1 Ohlström, et. al: “New Concepts for Biofuels in Transportation”, VTT Research Notes #2074 (2001)

Biomass to Liquid Fuel
Gasifier
Crude Syngas
Syngas = CO + H2
Clean Syngas
Gas Cleanin
g
Bio-Methanol
Methanol
Reactor
Wood Biomass
(Wood Alcohol)Ash

Current methanol market
• MeOH made from natural gas (CH4)• Very large facilities: > 800,000 mt/year• Cost comparison:
– ~ $6/GJ from natural gas– ~ $21/GJ from wood (Finnish case)
• Until CH4 price “skyrockets”, need some type of government intervention
– tax incentive– subsidy

So why are we such clodhoppers?
The open road…
Ford SUVS
Ferrari USAQuickTime™ and a
TIFF (Uncompressed) decompressorare needed to see this picture.
Cadillac

So why are we such clodhoppers?
Mileage of cool cars
QuickTime™ and aTIFF (Uncompressed) decompressor
are needed to see this picture.
Model City Mileage
Highway Mileage
Ford Expedition
14 18
Ferrari Maranallo
10 16
Cadillac CTS-V
15 23

So why are we such clodhoppers?
Recreational off-highway use…

So why are we such clodhoppers?Bigger and bigger houses

So why are we such clodhoppers?Bigger and bigger houses
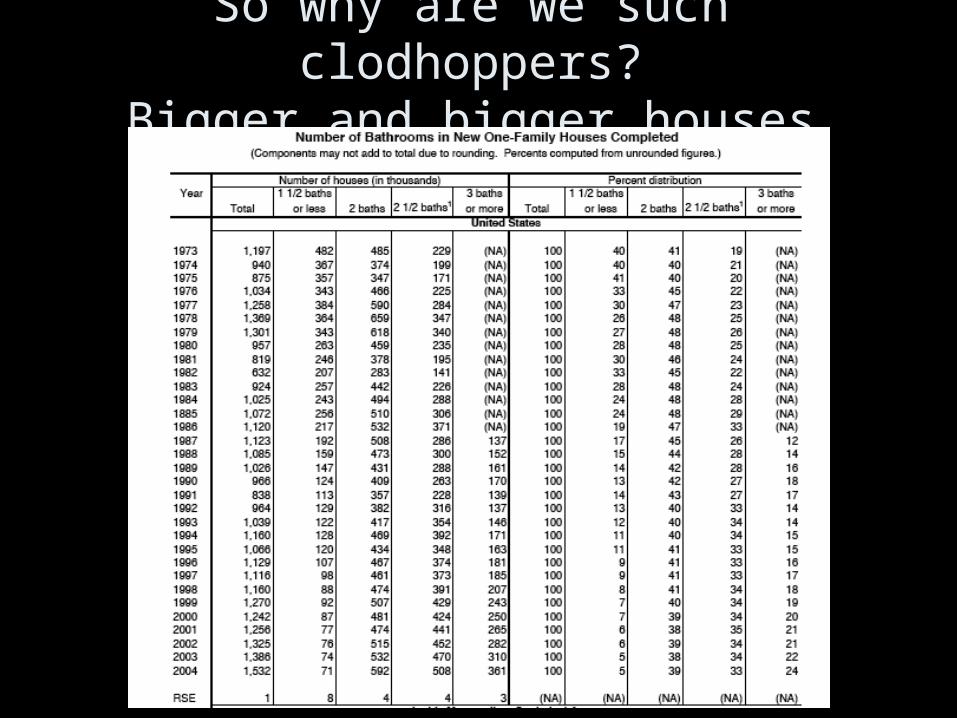
So why are we such clodhoppers?Bigger and bigger houses

So why are we such clodhoppers?Bigger and bigger houses

So why are we such clodhoppers?
Sun
energy: PlowingHarrowing, PlantingFencing, WeedingHarvesting, Pest Control, Storage, etc.
Industrial Monocrop Agricultural Ecosystem
FARMLAND
Air
Energy
Carbon,Oxygen
Humans
Singlecrops
NutrientsWater
Watersource
Irrigation
Fossil Fuel
Machinery
Fertilizer
Nutrients
$-cides
Exchange Value
Consumer goods


