Vision To be the leader in providing innovative and value-added technology, engineering and construction solutions to customers worldwide while creating superior shareholder value. Mission We will be the preferred worldwide supplier of selected process units, facilities and storage by: • Providing innovative and safe solutions through technology, engineering, procurement, fabrication and construction • Recognizing and delivering the facilities and solutions that our customers value • Delivering results that repeatedly bring customers back to CB&I • Creating an ethical, safe and enabling environment for our employees to prosper • Leveraging the reputation and equity of our brands for the purpose of achieving sustainable, profitable growth. Values Focus Innovation Accountability Safety Solutions Ethics Shareholders Leadership Excellence Customers Technology Profit Employees Goals Continue to improve our safe work practices with a goal of zero injuries to our employees and subcontractors. Be the preferred specialty EPC provider in our selected global markets. Achieve a global portfolio of projects where we can add value and maximize returns to our shareholders in both existing, sustainable markets and in emerging markets. Use our integrated project delivery model to provide solutions to our customers that give them a competitive advantage. Be the EPC employer of choice and a positive contributor to the communities in which we work. Enhance shareholder value through consistent performance, financial strength and profitable growth. Our Vision, Mission, Values and Goals CB&I 2003 Annual Report 25
Transcript
Vision
To be the leader in providing innovative and value-added technology, engineering and construction solutions to customers worldwide while creating superior shareholder value.
Mission
We will be the preferred worldwide supplier of selected process units, facilities and storage by:
• Providing innovative and safe solutions through technology, engineering, procurement,fabrication and construction
• Recognizing and delivering the facilities and solutions that our customers value• Delivering results that repeatedly bring customers back to CB&I• Creating an ethical, safe and enabling environment for our employees to prosper• Leveraging the reputation and equity of our brands
for the purpose of achieving sustainable, profitable growth.
Continue to improve our safe work practices with a goal of zero injuries to our employees and subcontractors.
Be the preferred specialty EPC provider in our selected global markets.
Achieve a global portfolio of projects where we can add value and maximize returns to our shareholders in both existing, sustainable markets and in emerging markets.
Use our integrated project delivery model to provide solutions to our customers that give them a competitive advantage.
Be the EPC employer of choice and a positive contributor to the communities in which we work.
Enhance shareholder value through consistent performance, financial strength and profitable growth.
Our Vision, Mission, Values and Goals
CB&I 2003 Annual Report 25
SELECTED CONSOLIDATED FINANCIAL AND OTHER DATA
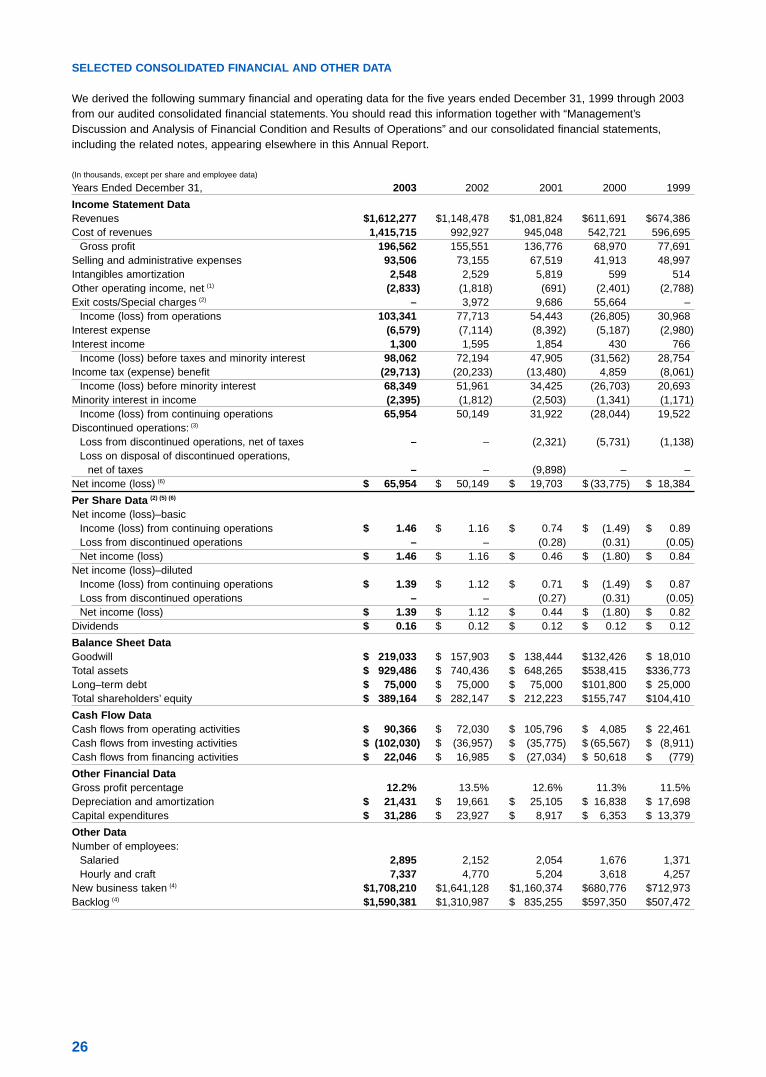
We derived the following summary financial and operating data for the five years ended December 31, 1999 through 2003from our audited consolidated financial statements. You should read this information together with “Management’sDiscussion and Analysis of Financial Condition and Results of Operations” and our consolidated financial statements,including the related notes, appearing elsewhere in this Annual Report.
(In thousands, except per share and employee data)
Years Ended December 31, 2003 2002 2001 2000 1999
Income Statement DataRevenues $1,612,277 $1,148,478 $1,081,824 $611,691 $674,386Cost of revenues 1,415,715 992,927 945,048 542,721 596,695
New business taken (4) $1,708,210 $1,641,128 $1,160,374 $680,776 $712,973Backlog (4) $1,590,381 $1,310,987 $ 835,255 $597,350 $507,472
26
Footnotes for Previous Table(1) Other operating income, net generally represents gains on the sale of property, plant and equipment.(2) In 2002, we recognized special charges of $4.0 million. Included in the 2002 special charges were $3.4 million for personnel costs including sever-
ance and personal moving expenses associated with the relocation of our administrative offices, $0.5 million for integration costs related to integra-tion initiatives associated with the Pitt-Des Moines, Inc. (“PDM”) Divisions acquisition and $0.4 million for facilities costs relating to the closure andrelocation of facilities. During 2002 we also recorded income of $0.4 million in relation to adjustments associated with the sale of our XL TechnologySystems, Inc. subsidiary. In 2001, we recognized special charges of $9.7 million. Included in the 2001 special charges were $5.7 million for person-nel costs including severance and personal moving expenses associated with the relocation, closure or downsizing of offices, and our voluntary resignation offer; $2.8 million for facilities and other charges related to the sale, closure, downsizing or relocation of operations; and $1.2 million forintegration costs primarily related to integration initiatives associated with the PDM Divisions acquisition. In 2000, we recognized special charges of$55.7 million. Included in the 2000 special charges were $22.2 million for payments associated with our voluntary resignation offer, severance andother benefits-related costs; $5.3 million in facilities-related expenses and a $28.2 million non-cash valuation allowance against a net long-termreceivable for the Indonesian Tuban (T.P.P.I.) Project. See Note 4 to our Consolidated Financial Statements for additional details on special charges.
(3) During the second quarter of 2001, we decided to discontinue our high purity piping business, UltraPure Systems, due primarily to continuing weakmarket conditions in the microelectronics industry. The loss on disposal of discontinued operations of $9.9 million after tax includes the write-downof equipment (net of proceeds), lease terminations, severance and other costs, and losses during the phase-out period. As a result of this operationbeing classified as discontinued, prior periods have been previously restated. Our actions necessary to discontinue UltraPure Systems were essen-tially complete at December 31, 2001.
(4) New business taken represents the value of new project commitments received by us during a given period. These commitments are included inbacklog until work is performed and revenue is recognized or until cancellation. Backlog may also fluctuate with currency movements.
(5) On January 22, 2003, we declared a two-for-one stock split effective in the form of a stock dividend paid February 10, 2003 to stockholders ofrecord at the close of business on February 3, 2003. All share numbers and amounts have been adjusted for the stock split for all periods presented.
(6) We changed our method of accounting for goodwill upon adoption of SFAS No. 142 on January 1, 2002. See Note 7 to our Consolidated Financial Statements.
CB&I 2003 Annual Report 27
MANAGEMENT’S DISCUSSION AND ANALYSIS OF FINANCIAL CONDITION AND RESULTS OF OPERATIONS
The following “Management’s Discussion and Analysis of Financial Condition and Results of Operations” is provided toassist readers in understanding our financial performance during the periods presented and significant trends which mayimpact our future performance. This discussion should be read in conjunction with our Consolidated Financial Statementsand the related notes thereto included elsewhere in this Annual Report.
We are a global specialty engineering, procurement and construction (“EPC”) company serving customers in several pri-mary end markets, including hydrocarbon refining, natural gas, water and the energy sector in general. We have been helpingour customers store and process the earth’s natural resources for more than 100 years by supplying a comprehensive rangeof engineered steel structures and systems. We offer a complete package of design, engineering, fabrication, procurement,construction and maintenance services. Our projects include hydrocarbon processing plants, liquefied natural gas (“LNG”) ter-minals and peak shaving plants, offshore structures, pipelines, bulk liquid terminals, water storage and treatment facilities, andother steel structures and their associated systems. We have been continuously engaged in the engineering and constructionindustry since our founding in 1889.
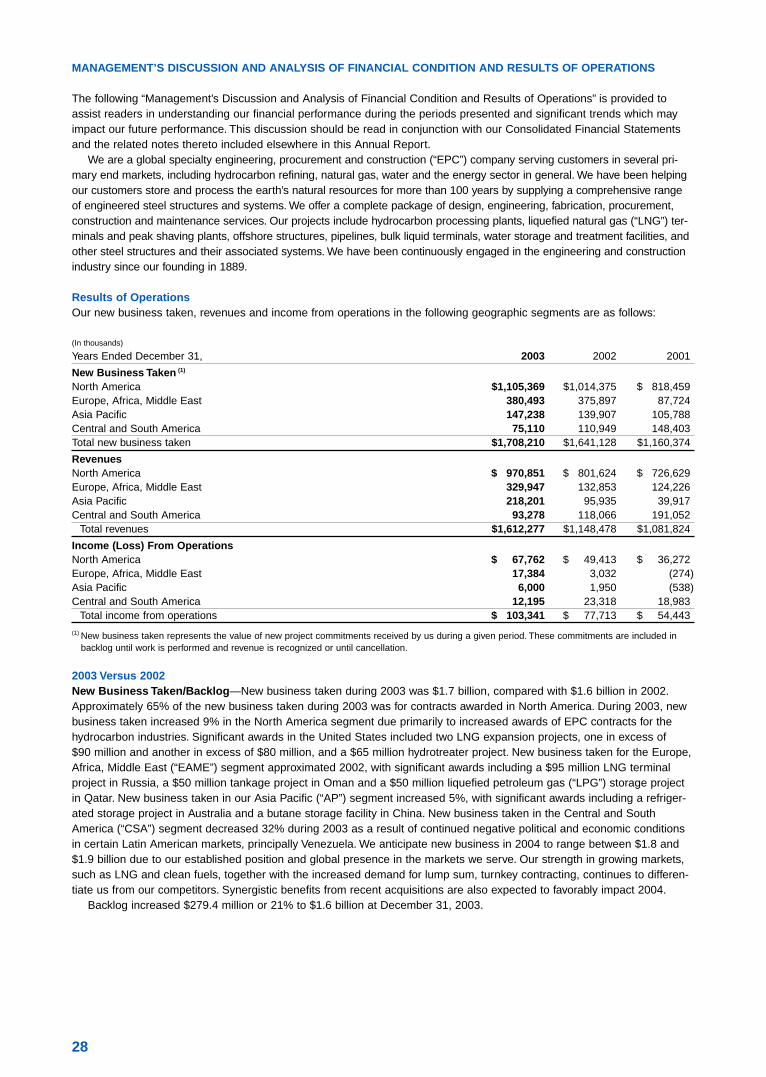
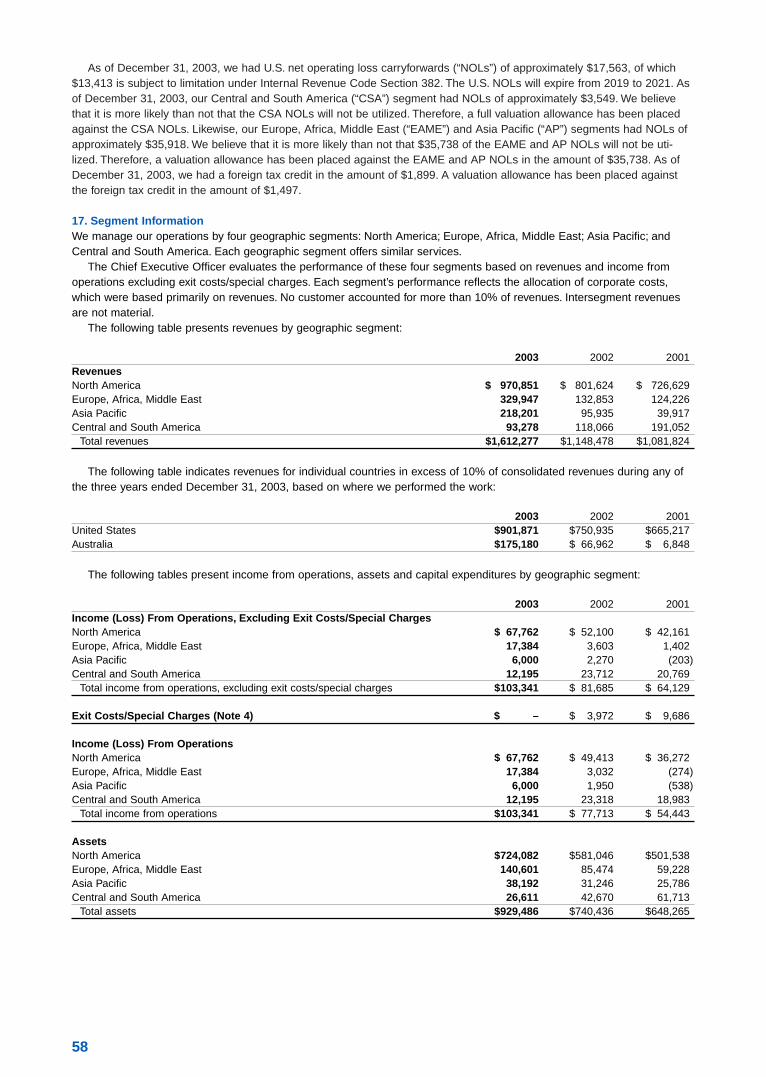
Results of OperationsOur new business taken, revenues and income from operations in the following geographic segments are as follows:
(In thousands)
Years Ended December 31, 2003 2002 2001
New Business Taken (1)
North America $1,105,369 $1,014,375 $ 818,459Europe, Africa, Middle East 380,493 375,897 87,724Asia Pacific 147,238 139,907 105,788Central and South America 75,110 110,949 148,403Total new business taken $1,708,210 $1,641,128 $1,160,374
RevenuesNorth America $ 970,851 $ 801,624 $ 726,629Europe, Africa, Middle East 329,947 132,853 124,226Asia Pacific 218,201 95,935 39,917Central and South America 93,278 118,066 191,052
Total revenues $1,612,277 $1,148,478 $1,081,824
Income (Loss) From OperationsNorth America $ 67,762 $ 49,413 $ 36,272Europe, Africa, Middle East 17,384 3,032 (274)Asia Pacific 6,000 1,950 (538)Central and South America 12,195 23,318 18,983
Total income from operations $ 103,341 $ 77,713 $ 54,443
(1) New business taken represents the value of new project commitments received by us during a given period. These commitments are included inbacklog until work is performed and revenue is recognized or until cancellation.
2003 Versus 2002New Business Taken/Backlog—New business taken during 2003 was $1.7 billion, compared with $1.6 billion in 2002.Approximately 65% of the new business taken during 2003 was for contracts awarded in North America. During 2003, newbusiness taken increased 9% in the North America segment due primarily to increased awards of EPC contracts for thehydrocarbon industries. Significant awards in the United States included two LNG expansion projects, one in excess of$90 million and another in excess of $80 million, and a $65 million hydrotreater project. New business taken for the Europe,Africa, Middle East (“EAME”) segment approximated 2002, with significant awards including a $95 million LNG terminalproject in Russia, a $50 million tankage project in Oman and a $50 million liquefied petroleum gas (“LPG”) storage projectin Qatar. New business taken in our Asia Pacific (“AP”) segment increased 5%, with significant awards including a refriger-ated storage project in Australia and a butane storage facility in China. New business taken in the Central and SouthAmerica (“CSA”) segment decreased 32% during 2003 as a result of continued negative political and economic conditionsin certain Latin American markets, principally Venezuela. We anticipate new business in 2004 to range between $1.8 and$1.9 billion due to our established position and global presence in the markets we serve. Our strength in growing markets,such as LNG and clean fuels, together with the increased demand for lump sum, turnkey contracting, continues to differen-tiate us from our competitors. Synergistic benefits from recent acquisitions are also expected to favorably impact 2004.
Backlog increased $279.4 million or 21% to $1.6 billion at December 31, 2003.
28
Revenues—Revenues in 2003 of $1.6 billion rose 40% compared with 2002. The growth over 2002 was primarily attributableto the strong backlog going into 2003, as projects moved into the field construction phase. Our revenues fluctuate based onthe changing project mix and are dependent on the amount and timing of new awards, and on other matters such as projectschedules. During 2003, revenues increased 21% in the North America segment, 148% in the EAME segment, 127% in theAP segment, but declined 21% in the CSA segment. The increase in the North America segment related primarily to highervolumes of process-related work as backlog carried over from 2002 was put in place and strong new business continued in2003. Revenue growth in the EAME segment resulted from large projects under way in Saudi Arabia and Nigeria and theinclusion of post-acquisition revenues from the John Brown Hydrocarbons Limited (“John Brown”) acquisition made on May 30, 2003. The increase in the AP segment related to large projects under way in China and Australia, while CSA’sdecrease was a result of lower new awards in certain Latin American markets. We anticipate that total revenues for 2004will be between $1.7 and $1.8 billion. Based upon the current backlog, we expect the majority of the 2004 revenue growthto come in the North America and EAME segments.
Gross Profit—Gross profit in 2003 was $196.6 million, or 12.2% of revenues, compared with $155.6 million or 13.5% of revenues, in 2002. Gross profit as a percentage of revenues fell as a result of timing and mix of projects being executed.Based on the current mix of projects in backlog, 2004 gross profit as a percentage of revenues is anticipated to be in linewith 2003 levels.
Selling and Administrative Expenses—Selling and administrative expenses were $93.5 million, or 5.8% of revenues, in2003, compared with $73.2 million, or 6.4% of revenues, in 2002. The absolute dollar increase compared with 2002 relatedprimarily to higher incentive compensation program costs, higher insurance costs and the impact of acquired operations.
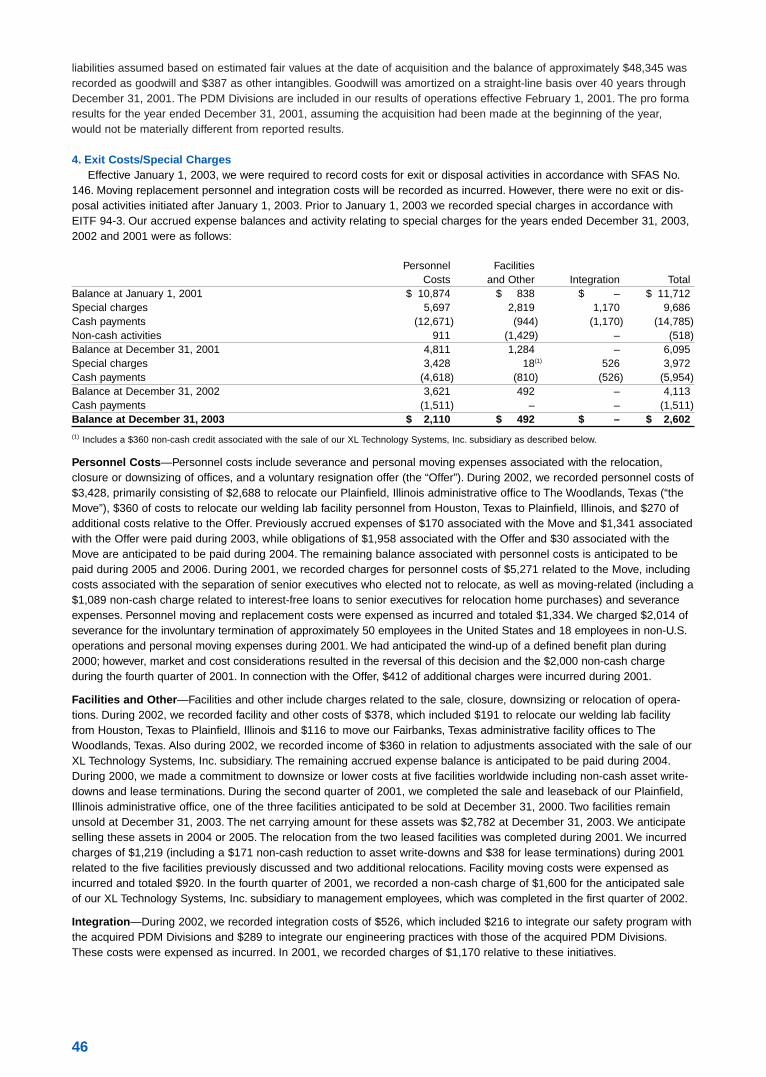
Exit Costs/Special Charges—There were no exit costs/special charges incurred during 2003 compared with $4.0 millionin 2002. During 2002 we recorded special charges of $3.4 million related to the relocation of our Plainfield, Illinois officepersonnel to The Woodlands, Texas. Additionally, we also recorded $0.4 million relating to the closure and relocation offacilities and $0.5 million for integration activities associated with the acquisition of the Engineered Construction and WaterDivisions (“PDM Divisions”) of Pitt-Des Moines, Inc. (“PDM”). During 2002 we also recorded income of $0.4 million in relationto adjustments associated with the sale of our XL Technology Systems, Inc. subsidiary. Moving, replacement personnel andintegration costs have been expensed as incurred. For a further discussion of the special charges, see Note 4 to ourConsolidated Financial Statements.
Income from Operations—Income from operations in 2003 was $103.3 million, representing a $25.6 million increase compared with 2002. The North America, EAME and AP segments benefited from higher revenues and continued cost control of overhead and administrative expenses. Operating income declined in the CSA segment due to lower revenuesand the recognition in 2002 of cost savings on several major contracts nearing completion.
Interest Expense and Interest Income—Interest expense decreased $0.5 million from the prior year to $6.6 million for2003, due to lower average debt levels in 2003. Interest income decreased $0.3 million from 2002 to $1.3 million in 2003.
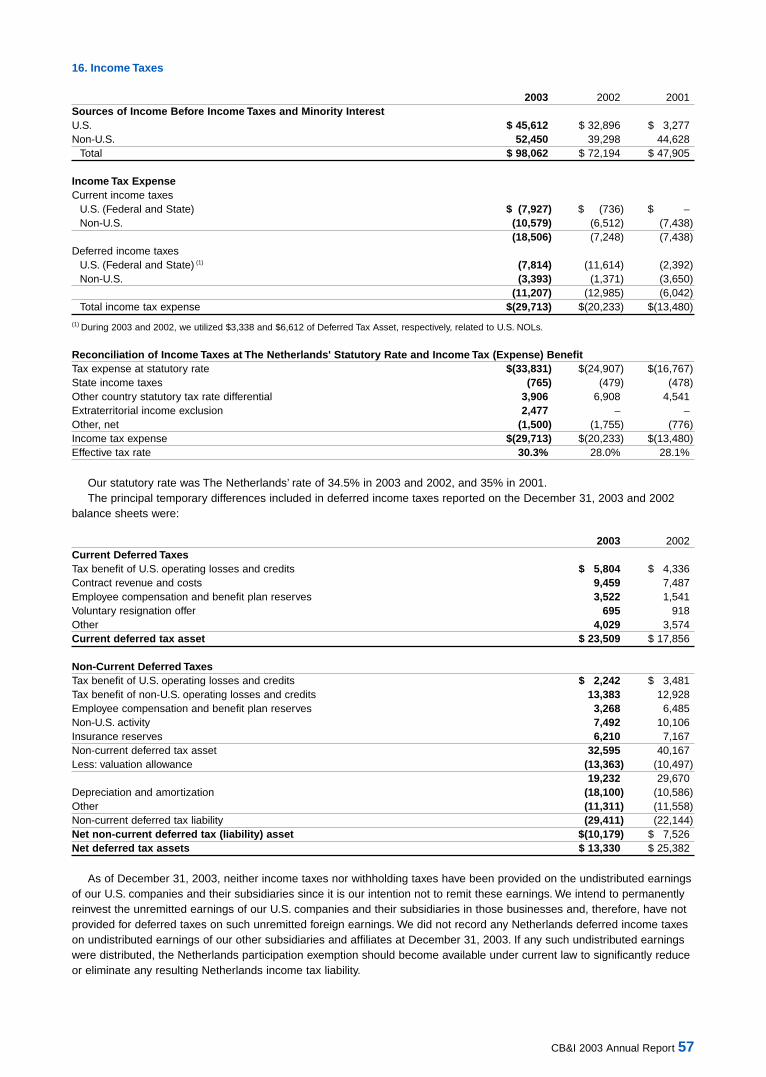
Income Tax Expense—Income tax expense was $29.7 million and $20.2 million in 2003 and 2002, respectively. The effective tax rates for 2003 and 2002 were 30.3% and 28.0%, respectively. The rate increased in 2003 as a larger portion of earnings were generated in North America. As of December 31, 2003, we had U.S. net operating loss carryforwards(“NOLs”) of approximately $17.6 million, of which $13.4 million is subject to limitation under Internal Revenue CodeSection 382. The U.S. NOLs will expire from 2019 to 2021.
2002 Versus 2001New Business Taken/Backlog—New business taken during 2002 was $1.6 billion compared with $1.2 billion in 2001.Over 60% of the new business taken during 2002 was for contracts awarded in North America. During 2002, new businesstaken increased 24% in the North America segment due primarily to increased awards of EPC contracts for the hydrocarbonprocessing industries. Significant awards included a $109 million contract to design and build a continuous catalytic regeneration PlatformerTM in New Jersey and two other projects in the United States, each in excess of $50 million, one for a hydrogen plant and gasoline desulfurization unit, and another for a hydrotreater. New business taken in our EAMEsegment increased 328% during 2002 and included significant awards of a $105 million gas/oil separation plant in SaudiArabia and an $89 million LNG expansion project in Nigeria. New business taken in our AP segment increased 32% compared with 2001 and included the award of a hydrotreater project in Australia and a refrigerated petrochemical storagefacility in China. New business taken in the CSA segment decreased 25% during 2002 as a result of negative political andeconomic conditions in certain Latin American markets, principally Venezuela. The majority of 2002 new awards were forprojects in the Caribbean region.
Backlog increased $475.7 million or 57%, to $1.3 billion at December 31, 2002.
Revenues—Revenues in 2002 of $1.1 billion rose 6% compared with 2001. During 2002, revenues increased 10% in theNorth America segment, 7% in the EAME segment, 140% in the AP segment, but declined 38% in the CSA segment. Theincrease in North America compared with 2001 was due primarily to higher levels of EPC projects for the hydrocarbon processing industries. These process-related revenues rose 52%, as backlog carried over from 2001 was put in place and strong new business continued in 2002. Revenue growth in the AP segment resulted from large projects beginning inAustralia, while CSA’s decrease resulted from several large projects in Venezuela and the Caribbean nearing completion.
CB&I 2003 Annual Report 29
Gross Profit—Gross profit in 2002 was $155.6 million, or 13.5% of revenues, compared with $136.8 million, or 12.6% ofrevenues, in 2001, reflecting continued strong project execution, the growing mix of higher margin process-related EPCwork and stringent cost control.
Selling and Administrative Expenses—Selling and administrative expenses were $73.2 million, or 6.4% of revenues, in2002 compared with $67.5 million, or 6.2% of revenues, in 2001. The increase compared with 2001 related primarily to theimpact of acquired operations and higher insurance costs.
Special Charges—Special charges for 2002 were $4.0 million as compared to $9.7 million in 2001. During 2001, werecorded special charges of $5.7 million for personnel costs related to the relocation of our administrative office includingcosts of senior executives who elected not to relocate, as well as moving-related (which were expensed as incurred) andseverance expenses, and our voluntary resignation offer; $2.8 million for facilities and other charges, including chargesrelated to the sale, closure, downsizing or relocation of operations; and $1.2 million for integration costs, primarily related to integration initiatives associated with the PDM Divisions acquisition.
Income from Operations—Income from operations in 2002 was $77.7 million, representing a $23.3 million increase compared with 2001. The North America segment benefited from a project mix that included increased levels of higher margin EPC work. Storage-related work declined in North America from 2001, but the shortfall was more than offset byimprovements in project execution and control of overhead and administrative expenses. Higher volumes in the EAME segment, combined with continued cost control and excellent execution, enabled the segment to post improved operatingincome. The AP segment improved compared with the prior year, due principally to significantly higher volumes in Australia.Despite lower new awards and revenues, the CSA segment reported higher operating income due to the existing backlog ofwork and favorable project execution, resulting in project cost savings. Our adoption of Statement of Financial AccountingStandards (“SFAS”) No. 142 “Goodwill and Other Intangible Assets” as of January 1, 2002, resulted in the elimination ofgoodwill and other indefinite-lived intangibles amortization, which, in comparison with 2001, benefited 2002 income fromoperations by $3.6 million.
Interest Expense and Interest Income—Interest expense decreased $1.3 million from the prior year to $7.1 million for2002, due to lower average debt levels in 2002. Interest income decreased $0.3 million from 2001 to $1.6 million in 2002,attributable to lower interest on our long-term receivable during 2002.
Income Tax Expense—Income tax expense was $20.2 million and $13.5 million in 2002 and 2001, respectively. The effective tax rates for 2002 and 2001 were 28.0% and 28.1%, respectively.
Liquidity and Capital ResourcesAt December 31, 2003, cash and cash equivalents totaled $112.9 million. During 2003, our operations generated $90.4 millionof cash flows, primarily attributable to strong profitability.
In 2003, we incurred $31.3 million for capital expenditures, which included $15.6 million for the construction costs of ournew administrative office in Texas. For 2004, capital expenditures are anticipated to be in the $20.0 to $25.0 million range.Additionally, we reported proceeds of $8.3 million related to the sale of assets held for sale and property and equipment.Our utilization of cash also included approximately $54.0 million to fund our acquisitions of Petrofac, Inc. (“Petrofac”) andJohn Brown and a $3.4 million payment for earnout obligations associated with a 2000 acquisition.
In connection with our acquisition of Howe-Baker International, L.L.C. (“Howe-Baker”) in 2000, we assumed Howe-Baker’sminority interest associated with a majority-owned subsidiary and two earnout arrangements which are contingent upon theperformance of the underlying acquired entities. One of the arrangements which has and will continue to require us to makecash payments to the previous owners expires in July 2004 while the other arrangement was scheduled to expire on orbefore December 31, 2008 (“2008 Earnout”), subject to certain of our call rights and the put rights of the previous owners.In 2003, we exercised our call option to purchase the remaining minority interest and also negotiated final settlement of the2008 Earnout. Total consideration for the purchase of the minority interest and the 2008 Earnout was $20.6 million cashand satisfaction of a $19.8 million receivable due from the minority holder.
We continue to evaluate and selectively pursue opportunities for expansion of our business through acquisition of complementary businesses. These acquisitions, if they arise, may involve the use of cash or, depending upon the size andterms of the acquisition, may require debt or equity financing.
Net cash flows provided by financing activities were $22.0 million including proceeds from a public offering of 9.9 millionshares of our common stock. The offering consisted of 8.9 million secondary shares, for which we received no proceeds,and 1.0 million primary shares. We utilized the proceeds from the primary shares of approximately $20.3 million for generalcorporate purposes, including settlement of the 2008 Earnout. Cash dividends of $7.3 million were paid during 2003.
Our primary internal source of liquidity is cash flow generated from operations. Capacity under revolving credit agreementsis also available, if necessary, to fund operating or investing activities. We have a three-year $233.3 million revolving credit facility and a five-year $116.7 million letter of credit facility, which terminate in August 2006 and August 2008, respectively.Both facilities are committed and unsecured. As of December 31, 2003, no direct borrowings existed under the revolving creditfacility, but we had issued $135.1 million of letters of credit under the three-year facility and $0.3 million under the five-yearfacility. As of December 31, 2003, we had $214.6 million of available capacity under these facilities. The facilities contain
30
certain restrictive covenants including minimum levels of net worth, fixed charge and leverage ratios, among other restric-tions. The facilities also place restrictions on us with regard to subsidiary indebtedness, sales of assets, liens, investments,type of business conducted, and mergers and acquisitions, among other restrictions. We were in compliance with allcovenants at December 31, 2003.
We also have various short-term, uncommitted revolving credit facilities across several geographic regions of approxi-mately $236.6 million. These facilities are generally used to provide letters of credit or bank guarantees to customers in the ordinary course of business to support advance payments, as performance guarantees or in lieu of retention on ourcontracts. At December 31, 2003, we had available capacity of $81.6 million under these uncommitted facilities. In additionto providing letters of credit or bank guarantees, we also issue surety bonds in the ordinary course of business to supportour contract performance. For a further discussion of letters of credit and surety bonds, see Note 13 to our ConsolidatedFinancial Statements.
Our $75.0 million of senior notes also contain a number of restrictive covenants, including a maximum leverage ratio andminimum levels of net worth and debt and fixed charge ratios, among other restrictions. The notes also place restrictions onus with regard to investments, other debt, subsidiary indebtedness, sales of assets, liens, nature of business conductedand mergers, among other restrictions. We were in compliance with all covenants at December 31, 2003.
As of December 31, 2003, the following commitments were in place to support our ordinary course obligations:
Amounts of Commitments by Expiration Period(In thousands) Total Less than 1 Year 1–3 Years 4–5 Years After 5 YearsLetters of Credit/Bank Guarantees $290,286 $119,631 $161,009 $9,646 $ –Surety Bonds 365,033 275,085 89,763 185 – Total Commitments $655,319 $394,716 $250,772 $9,831 $ –
Note: Includes $17,808 of letters of credit issued in support of our insurance program.
Contractual obligations at December 31, 2003, are summarized below:
Payments Due by Period(In thousands) Total Less than 1 Year 1-3 Years 4-5 Years After 5 YearsLong-Term Debt (1) $ 75,000 $ – $50,000 $25,000 $ – Operating Leases 52,719 15,765 12,551 5,979 18,424 Other Non-Current Liabilities (2) 16,222 3,332 6,445 6,445 – Purchase Obligations (3) – – – – – Total Contractual Obligations $143,941 $19,097 $68,996 $37,424 $18,424
(1) Excludes interest accruing at a rate of 7.34%.(2) Amounts represent other non-current liabilities reflected on our consolidated balance sheet where both the timing and amount of payment streams
are known. Included are certain retirement benefit obligations. Amounts do not include payments for defined benefit obligations, other postretirementbenefit obligations, self-insurance/retention reserves, and various other obligations, as amounts have not been determined beyond one year.
(3) In the ordinary course of business, we enter into purchase commitments to satisfy our requirements for materials and supplies for contracts thathave been awarded. These purchase commitments, that are to be recovered from our customers, are generally settled in less than one year. We donot enter into long-term purchase commitments on a speculative basis for fixed or minimum quantities.
We believe funds generated by operations, amounts available under existing credit facilities and external sources of liq-uidity, such as the issuance of debt and equity instruments, will be sufficient to finance capital expenditures, the settlementof earnout obligations, the settlement of commitments and contingencies (as fully described in Note 13 to our ConsolidatedFinancial Statements) and working capital needs for the foreseeable future. However, there can be no assurance that suchfunding will be available, as our ability to generate cash flows from operations and our ability to access funding under the revolving credit facilities may be impacted by a variety of business, economic, legislative, financial and other factorswhich may be outside of our control. Additionally, while we currently have a significant, uncommitted bonding facility, primarily to support various commercial provisions in our engineering and construction contracts, a termination or reductionof the bonding facility could result in the utilization of letters of credit in lieu of performance bonds, thereby reducing ouravailable capacity under the revolving credit facilities. Although we do not anticipate a reduction or termination of the bonding facility, there can be no assurance that such a facility will be available at reasonable terms to service our ordinarycourse obligations.
We are a defendant in a number of lawsuits arising in the normal course of business, including among others, lawsuitswherein plaintiffs allege exposure to asbestos due to work we may have performed at various locations. We have neverbeen a manufacturer, distributor or supplier of asbestos products, and we have in place appropriate insurance coverage for the type of work that we have performed. During 2003, we were named as a defendant in additional asbestos-relatedlawsuits. To date, we have been able to dismiss or settle all such claims without a material impact on our operating resultsor financial position and do not currently believe that the asserted claims will have a material adverse effect on our futureresults of operations or financial position. As a matter of standard policy, we continually review our litigation accrual and asfurther information is known on pending cases, increases or decreases, as appropriate, may be recorded in accordancewith SFAS No. 5, “Accounting for Contingencies.”
CB&I 2003 Annual Report 31
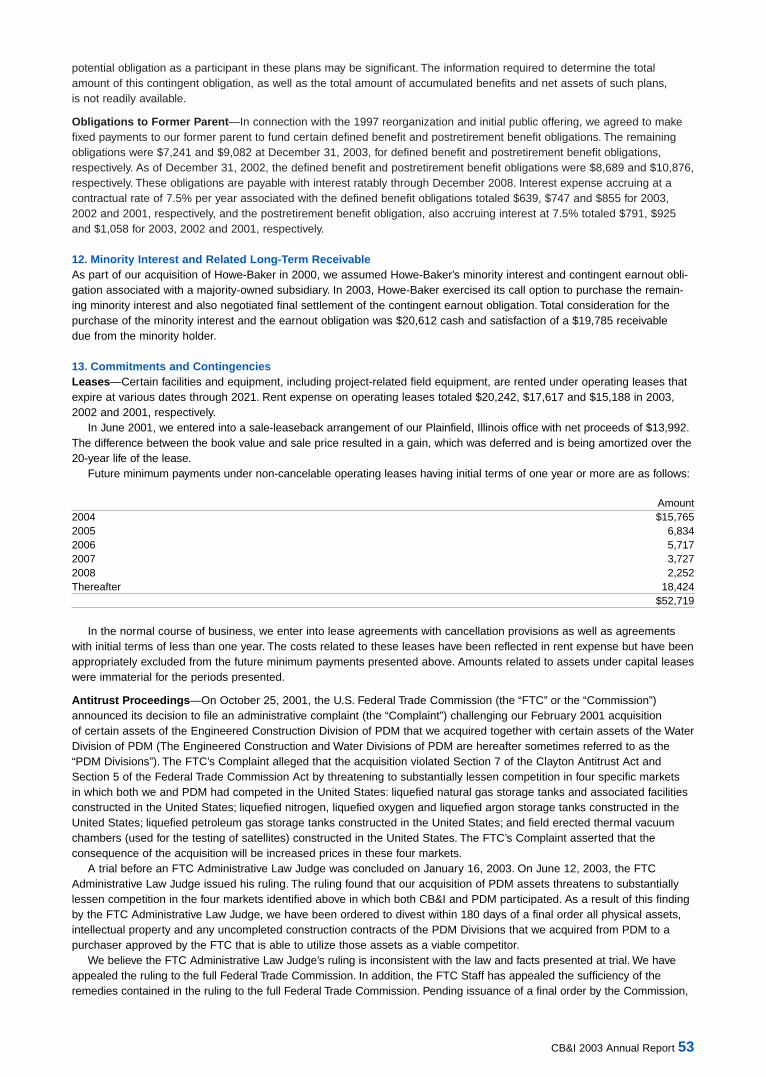
Off-Balance Sheet ArrangementsWe use operating leases for facilities and equipment when they make economic sense. In 2001, we entered into a sale (forapproximately $14.0 million) and leaseback transaction of our Plainfield, Illinois administrative office with a lease term of20 years. The leaseback structure is not subject to consolidation and the future payments are accounted for as an operatinglease. Rentals under this and all other lease commitments are reflected in rental expense and future rental commitments assummarized in Note 13 to our Consolidated Financial Statements.
We have no other off-balance sheet arrangements.
Quantitative and Qualitative Disclosure About Market RiskWe are exposed to market risk from changes in foreign currency exchange rates, which may adversely affect our results of operations and financial condition. One exposure to fluctuating exchange rates relates to the effects of translating thefinancial statements of our non-U.S. subsidiaries, which are denominated in currencies other than the U.S. dollar, into theU.S. dollar. The foreign currency translation adjustments are recognized in shareholders’ equity in accumulated other comprehensive income (loss) as cumulative translation adjustment, net of tax. We generally do not hedge our exposure topotential foreign currency translation adjustments.
Another form of foreign currency exposure relates to our non-U.S. subsidiaries’ normal contracting activities. We gener-ally try to limit our exposure to foreign currency fluctuations in most of our engineering and construction contracts through provisions that require client payments in U.S. dollars or other currencies corresponding to the currency in which costs areincurred. As a result, we generally do not need to hedge foreign currency cash flows for contract work performed. However,where construction contracts do not contain foreign currency provisions, we use forward exchange contracts to hedge foreign currency transaction exposure. The gains and losses on these contracts offset changes in the value of the relatedexposures. As of December 31, 2003, the notional amount of cash flow hedge contracts outstanding was $23.2 million, and the fair value of these contracts was approximately $2.0 million. The terms of these contracts generally do not exceedone year.
In circumstances where intercompany loans and or borrowings are in place with non-U.S. subsidiaries, we will also useforward contracts. If the timing or amount of foreign-denominated cash flows varies, we incur foreign exchange gains orlosses, which are included in the consolidated statements of income. We do not use financial instruments for trading orspeculative purposes.
We maintain operations and have construction projects in Venezuela, which continued to experience negative politicaland economic conditions during 2003. As a result, the Venezuelan Bolivar, which devalued more than 85% against the U.S.dollar in 2002, was subject to trading restrictions in 2003. As of December 31, 2003, we had $0.8 million of net assets inVenezuela that are subject to foreign currency translation adjustments. As noted above, the exposure on our constructionprojects is generally limited by contractual provisions. However, we will continue to face currency exposure on our net assets.
The carrying value of our cash and cash equivalents, accounts receivable, accounts payable, notes payable and forwardcontracts approximates their fair values because of the short-term nature of these instruments. At December 31, 2003 and2002, the fair value of our fixed rate long-term debt was $82.0 million and $80.7 million, respectively, based on the currentmarket rates for debt with similar credit risk and maturities. See Note 10 to our Consolidated Financial Statements for quantification of our financial instruments.
New Accounting StandardsIn August 2001, the Financial Accounting Standards Board (“FASB”) issued SFAS No. 143, “Accounting for AssetRetirement Obligations” which addresses the financial accounting and reporting for obligations associated with the retire-ment of tangible long-lived assets and the associated assets’ retirement costs. Our adoption of this statement effectiveJanuary 1, 2003, did not have a significant impact on our financial statements for the year ended December 31, 2003.
In July 2002, the FASB issued SFAS No. 146, “Accounting for Costs Associated with Exit or Disposal Activities.” Thisstandard requires companies to recognize costs associated with exit or disposal activities when they are incurred ratherthan at the date of a commitment to exit or disposal plan. Examples of costs covered by the standard include lease termina-tion costs and certain employee severance costs that are associated with a restructuring, discontinued operation, plantclosing, or other exit or disposal activity. Previous accounting guidance was provided by EITF Issue No. 94-3, “LiabilityRecognition for Certain Employee Termination Benefits and Other Costs to Exit an Activity (including Certain Costs Incurredin a Restructuring).” SFAS No. 146 replaces Issue 94-3. SFAS No. 146 was to be applied prospectively to exit or disposalactivities initiated after December 31, 2002. Our adoption of this statement effective January 1, 2003, did not have a significant impact on our financial statements for the year ended December 31, 2003.
In December 2002, the FASB issued SFAS No. 148, “Accounting for Stock-Based Compensation – Transition andDisclosure,” which amends SFAS No. 123, “Accounting for Stock-Based Compensation.” This standard permits two additionaltransition methods for entities that adopt the fair-value-based method of accounting for stock-based employee compensationand amends the disclosure requirements in both annual and interim financial statements. We will continue to applyAccounting Principles Board Opinion No. 25, “Accounting for Stock Issued to Employees,” and related interpretations inaccounting for stock options. The disclosure requirements of SFAS No. 148 are presented in our Stock Plans discussion inNote 2 to our Consolidated Financial Statements.
32
In January 2003, the FASB issued Interpretation No. 46, “Consolidation of Variable Interest Entities,” (“FIN 46”) which isan interpretation of Accounting Research Bulletin No. 51, “Consolidated Financial Statements.” The interpretation states thatcertain variable interest entities may be required to be consolidated into the results of operations and financial position ofthe entity that is the primary beneficiary. The change may be made prospectively with a cumulative-effect adjustment in theperiod first applied or by restating previously issued financial statements. Our adoption of this interpretation effective July 1,2003, did not have a significant impact on our financial statements for the year ended December 31, 2003.
In April 2003, the FASB issued SFAS No. 149, “Amendment of Statement 133 on Derivative Instruments and HedgingActivities,” which amends SFAS No. 133, “Accounting for Derivative Instruments and Hedging Activities.” SFAS No. 149 provides clarification on financial accounting and reporting of derivative instruments and hedging activities and requirescontracts with similar characteristics to be accounted for on a comparable basis. This statement is effective for contractsentered into or modified after June 30, 2003, and was applied prospectively. Our adoption of this statement effective July 1,2003, did not have a significant impact on our financial statements for the year ended December 31, 2003.
In December 2003, the FASB issued SFAS No. 132 (revised 2003), “Employers’ Disclosures about Pensions and OtherPostretirement Benefits.” The revised standard requires annual and interim disclosures in addition to those in the originalstandard concerning the assets, obligations, cash flows, and net periodic benefit cost of defined benefit pension plans andother defined benefit postretirement plans. This statement is effective for fiscal years ending after December 15, 2003.See Note 11 to our Consolidated Financial Statements for the revised disclosure requirements of SFAS No. 132.
In January 2004, the FASB issued FASB Staff Position No. FAS 106-1 (“FSP 106-1”), “Accounting and DisclosureRequirements Related to the Medicare Prescription Drug, Improvement and Modernization Act of 2003,” which providestemporary guidance concerning the recently enacted Medicare Prescription Drug, Improvement and Modernization Act of2003 (the “Act”). SFAS No. 106, “Employers’ Accounting for Postretirement Benefits Other Than Pensions,” requirespresently enacted changes in laws that will take effect in future periods to be taken into account in measuring currentperiod postretirement benefit cost and the accumulated projected benefit obligation (“APBO”). FSP 106-1 allows companiesthat sponsor affected postretirement benefit plans to elect to defer recognizing the effects of the Act on postretirement benefit expense and on the APBO pursuant to SFAS No. 106. We have elected to defer accounting for the effects of the Act until 2004.
Critical Accounting PoliciesThe discussion and analysis of financial condition and results of operations are based upon our consolidated financialstatements, which have been prepared in accordance with accounting principles generally accepted in the United States of America. The preparation of these financial statements requires us to make estimates and judgments that affect thereported amounts of assets, liabilities, revenues and expenses, and related disclosure of contingent assets and liabilities.We evaluate our estimates on an on-going basis, based on historical experience and on various other assumptions that are believed to be reasonable under the circumstances. Actual results may differ from these estimates under differentassumptions or conditions.
We believe that the following critical accounting policies affect our more significant judgments and estimates used in thepreparation of our consolidated financial statements:
Revenue Recognition—We recognize revenues using the percentage-of-completion method. Contract revenues areaccrued based generally on the percentage that costs-to-date bear to total estimated costs. We follow the guidance of theStatement of Position 81-1, “Accounting for Performance of Construction-Type and Certain Production-Type Contracts,” foraccounting policy relating to our use of the percentage-of-completion method, estimating costs, revenue recognition andclaim recognition. The use of estimated cost to complete each contract, while the most widely recognized method used forpercentage-of-completion accounting, is a significant variable in the process of determining income earned and is a signifi-cant factor in the accounting for contracts. The cumulative impact of revisions in total cost estimates during the progress ofwork is reflected in the period in which these changes become known. Contract revenue reflects the original contract priceadjusted for agreed-upon change orders and estimated minimum recoveries of claims. Although successful, this contractingmodel has inherent risks. Losses expected to be incurred on contracts in progress are charged to income as soon as suchlosses are known. A significant portion of our work is performed on a fixed price or lump sum basis. The balance of projectsis primarily performed on variations of cost reimbursable and target price approaches. Progress billings in accounts receiv-able are currently due and include retentions to be collected within one year. Contract retentions collectible beyond oneyear are included in other non-current assets. We have a history of proven success in estimating and bidding lump sum,fixed price contracts. However, due to the various estimates inherent in our contract accounting, actual results could differ from those estimates.
Credit Extension—We extend credit to customers and other parties in the normal course of business only after a review of the potential customer’s creditworthiness. Additionally, management reviews the commercial terms of all significant contracts before entering into a contractual arrangement. We regularly review outstanding receivables and provide for estimated losses through an allowance for doubtful accounts. In evaluating the level of established reserves, managementmakes judgments regarding the parties’ ability to make required payments, economic events and other factors. As the financial condition of these parties change, circumstances develop or additional information becomes available, adjustmentsto the allowance for doubtful accounts may be required.
CB&I 2003 Annual Report 33
Estimated Reserves for Insurance Matters—We maintain insurance coverage for various aspects of our business andoperations. However, we retain a portion of anticipated losses through the use of deductibles and self-insured retentions for our exposures related to third-party liability and workers’ compensation. Management regularly reviews estimates ofreported and unreported claims and provides for losses through insurance reserves. As claims develop and additional information becomes available, adjustments to loss reserves may be required.
Recoverability of Goodwill—Effective January 1, 2002, we adopted SFAS No. 142 “Goodwill and Other Intangible Assets,”which states that goodwill and indefinite-lived intangible assets are no longer to be amortized but are to be reviewed annu-ally for impairment. The goodwill impairment analysis required under SFAS No. 142 requires us to allocate goodwill to ourreporting units, compare the fair value of each reporting unit with our carrying amount, including goodwill, and then, if nec-essary, record a goodwill impairment charge in an amount equal to the excess, if any, of the carrying amount of a reportingunit’s goodwill over the implied fair value of that goodwill. The primary method that we employ to estimate these fair valuesis the discounted cash flow method. This methodology is based, to a large extent, on assumptions about future eventswhich may or may not occur as anticipated, and such deviations could have a significant impact on the estimated fair valuescalculated. These assumptions include, but are not limited to, estimates of future growth rates, discount rates and terminalvalues of reporting units. See further discussion in Note 7 to our Consolidated Financial Statements. Our goodwill balanceat December 31, 2003, was $219.0 million.
Our significant accounting policies are more fully discussed in Note 2 to our Consolidated Financial Statements.
Forward-Looking StatementsThis Annual Report contains forward-looking statements. You should read carefully any statements containing the words“expect,” “believe,” “anticipate,” “project,” “estimate,” “predict,” “intend,” “should,” “could,” “may,” “might,” or similar expressionsor the negative of any of these terms.
Forward-looking statements involve known and unknown risks and uncertainties. In addition to the material risks listedunder “Risk Factors,” as set forth in our Form 10-K, that may cause our actual results, performance or achievements to be materially different from those expressed or implied by any forward-looking statements, the following factors could alsocause our results to differ from such statements:
• our ability to realize cost savings from our expected execution performance of contracts;• the uncertain timing and the funding of new contract awards, and project cancellations and operations risks;• the expected growth in our primary end markets does not occur;• cost overruns on fixed price contracts, and risks associated with percentage of completion accounting;• changes in the costs of or delivery schedule for components and materials;• increased competition;• lack of necessary liquidity to finance expenditures prior to the receipt of payment for the performance of contracts and
to provide bid and performance bonds and letters of credit securing our obligations under our bids and contracts;• risks inherent in our acquisition strategy and our ability to obtain financing for proposed acquisitions;• adverse outcomes of pending claims or litigation or the possibility of new claims or litigation;• proposed revisions to U.S. tax laws that seek to increase income taxes payable by certain international companies;• a downturn in the economy in general; and• disruptions caused by war in the Middle East or terrorist attacks in the United States or other countries in which we
operate.Although we believe the expectations reflected in our forward-looking statements are reasonable, we cannot guarantee
future performance or results. We are not obligated to update or revise any forward-looking statements, whether as a resultof new information, future events or otherwise. You should consider these risks when reading any forward-looking statements.
34
INDEPENDENT AUDITORS’ REPORTTo the Shareholders and the Supervisory Board of Chicago Bridge & Iron Company N.V.:We have audited the accompanying consolidated balance sheets of Chicago Bridge & Iron Company N.V. (a Netherlandscorporation) and subsidiaries (the Company) as of December 31, 2003 and 2002, and the related consolidated statementsof income, shareholders’ equity, and cash flows for the years then ended. These consolidated financial statements are theresponsibility of the Company’s management. Our responsibility is to express an opinion on the 2003 and 2002 consolidatedfinancial statements based on our audits. The consolidated financial statements as of December 31, 2001 and for the yearthen ended, before the adjustments and reclassifications discussed in the Notes to the financial statements as indicatedbelow, were audited by other auditors who have ceased operations. Those auditors expressed an unqualified opinion on the2001 consolidated financial statements in their report dated February 11, 2002.
We conducted our audits in accordance with auditing standards generally accepted in the United States of America.Those standards require that we plan and perform the audit to obtain reasonable assurance about whether the financialstatements are free of material misstatement. An audit includes examining, on a test basis, evidence supporting theamounts and disclosures in the financial statements. An audit also includes assessing the accounting principles used andsignificant estimates made by management, as well as evaluating the overall financial statement presentation. We believethat our audits provide a reasonable basis for our opinion.
In our opinion, the 2003 and 2002 consolidated financial statements present fairly, in all material respects, the financialposition of Chicago Bridge & Iron Company N.V. and subsidiaries as of December 31, 2003 and 2002, and the results oftheir operations and their cash flows for the years then ended, in conformity with accounting principles generally acceptedin the United States of America.
As described in Note 7 to the consolidated financial statements, effective January 1, 2002, the Company changed itsmethod of accounting for goodwill and other intangible assets upon the adoption of Statement of Financial AccountingStandards (“SFAS”) No. 142, “Goodwill and Other Intangible Assets.”
As discussed above, the consolidated financial statements of Chicago Bridge & Iron Company N.V. and subsidiaries asof December 31, 2001, were audited by other auditors who have ceased operations. Those financial statements have beenrevised to give effect to the following adjustments and reclassifications:
February 10, 2003 stock split (see Note 14). We audited the adjustments described in Note 14 that were applied torevise the 2001 financial statements for such stock split. Our audit procedures included (1) comparing the amounts shownin the earnings per share disclosures for 2001 to the Company’s underlying accounting analysis obtained from manage-ment, (2) comparing the previously reported shares outstanding and income statement amounts per the Company’saccounting analysis to the previously issued financial statements, and (3) recalculating the additional shares to give effectto the stock split and testing the mathematical accuracy of the underlying analysis.
Transitional disclosures for adoption of SFAS No. 142 (see Note 7). We audited the adjustments described in Note 7 thatwere applied to revise the 2001 financial statements to include the transitional disclosures required by SFAS No. 142, whichwas adopted by the Company as of January 1, 2002. Our audit procedures with respect to the disclosures in Note 7 withrespect to 2001 included (1) comparing the previously reported net income to the previously issued financial statementsand the adjustments to reported net income representing amortization expense (including any related tax effects) recognizedin those periods related to goodwill and intangible assets that are no longer being amortized and changes in amortizationperiods for intangible assets that will continue to be amortized as a result of initially applying SFAS No. 142 (including anyrelated tax effects) to the Company’s underlying analysis obtained from management, (2) testing the mathematical accuracyof the reconciliation of adjusted net income to reported net income and the related earnings-per-share amounts and(3) comparing the separate amounts for goodwill and other intangible assets for 2001 to the Company’s underlying analysisobtained from management, and (4) testing the mathematical accuracy of the underlying analysis.
Summarized disclosure of defined benefit plans (see Note 11). We audited the adjustments that were applied to revisethe 2001 financial statements to include combined tabular disclosures of the Company’s defined benefit plans as permittedunder SFAS No. 132, “Employers’ Disclosures about Pensions and Other Postretirement Benefits,” as compared to previoustabular presentation of each defined benefit plan. Our audit procedures with respect to the 2001 disclosures in Note 11included (1) comparing the previously reported tabular presentation of each defined benefit plan to a combining scheduleprepared by the Company’s management, and (2) testing the mathematical accuracy of the underlying analysis.
In our opinion, the adjustments, transitional disclosures and reclassifications to the 2001 consolidated financial statementsand disclosures described above have been properly applied. However, we were not engaged to audit, review, or apply anyprocedures to the 2001 financial statements of the Company other than with respect to such adjustments, transitional disclosures and reclassifications, accordingly, we do not express an opinion or any other form of assurance on the 2001financial statements taken as a whole.
DELOITTE & TOUCHE LLP
Houston, TexasMarch 9, 2004
CB&I 2003 Annual Report 35
INFORMATION REGARDING PREDECESSOR INDEPENDENT PUBLIC ACCOUNTANT’S REPORTSThe following reports are copies of reports previously issued by Arthur Andersen, LLP ("Andersen"). The reports have not been reissued by Andersen. As discussed in Note 7 “Goodwill and Other Intangibles”, the Company has presented the transitional disclosures for 2001 required by SFAS No. 142, and as discussed in Note 14 “Shareholders’ Equity”, theCompany has adjusted prior periods for the stock split for all periods presented. Additionally, the Company revised the 2001financial statements to include combined tabular disclosures of the Company’s defined benefit plans as permitted underSFAS No. 132. The Andersen report does not extend to these changes to the 2001 consolidated financial statements.
To the Shareholders and the Supervisory Board of Chicago Bridge & Iron Company N.V.:We have audited the accompanying consolidated balance sheets of CHICAGO BRIDGE & IRON COMPANY N.V. (aNetherlands corporation) and SUBSIDIARIES as of December 31, 2001 and 2000, and the related consolidated statementsof income, changes in shareholders’ equity and cash flows for each of the three years ended December 31, 2001. Thesefinancial statements are the responsibility of the Company’s management. Our responsibility is to express an opinion onthese financial statements based on our audits.
We conducted our audits in accordance with generally accepted auditing standards in the United States of America andThe Netherlands. Those standards require that we plan and perform the audits to obtain reasonable assurance aboutwhether the financial statements are free of material misstatement. An audit includes examining, on a test basis, evidencesupporting the amounts and disclosures in the financial statements. An audit also includes assessing the accounting principles used and significant estimates made by management, as well as evaluating the overall financial statement presentation. We believe that our audits provide a reasonable basis for our opinion.
In our opinion, the financial statements referred to above present fairly, in all material respects, the financial position ofCHICAGO BRIDGE & IRON COMPANY N.V. and SUBSIDIARIES as of December 31, 2001 and 2000 and the results of itsoperations and cash flows for each of the three years ended December 31, 2001, in conformity with accounting principlesgenerally accepted in the United States of America.
ARTHUR ANDERSEN
Amsterdam, The NetherlandsFebruary 11, 2002
36
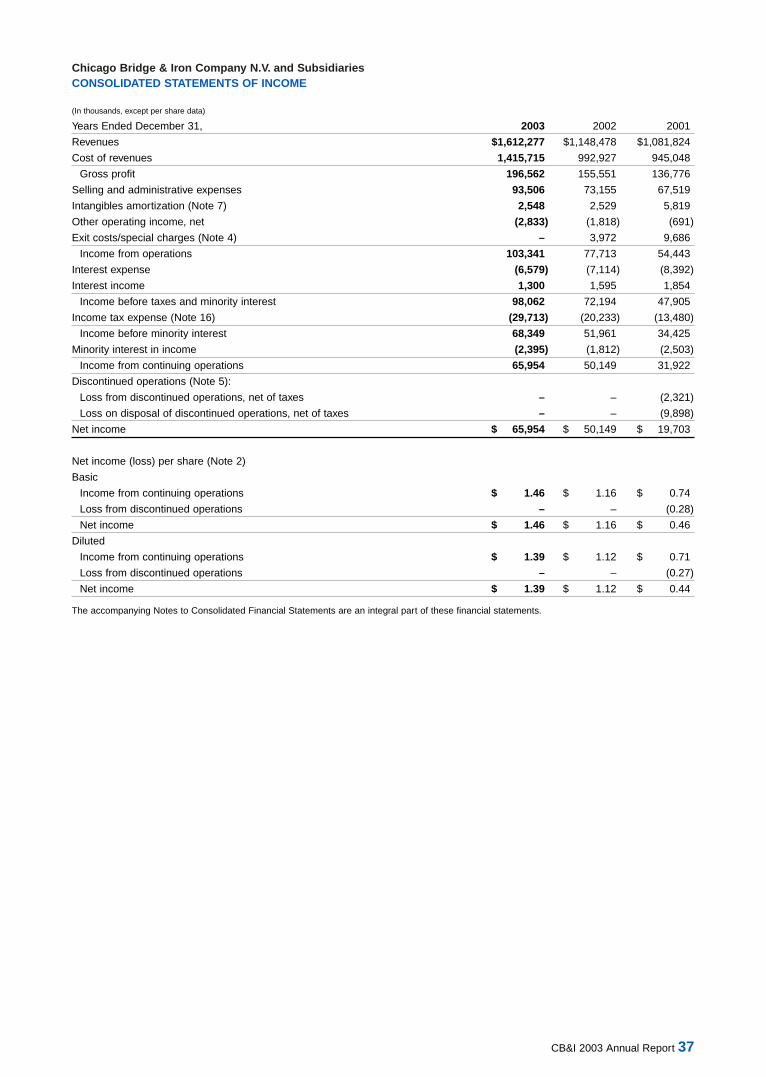
Chicago Bridge & Iron Company N.V. and SubsidiariesCONSOLIDATED STATEMENTS OF INCOME
(In thousands, except per share data)
Years Ended December 31, 2003 2002 2001
Revenues $1,612,277 $1,148,478 $1,081,824
Cost of revenues 1,415,715 992,927 945,048
Gross profit 196,562 155,551 136,776
Selling and administrative expenses 93,506 73,155 67,519
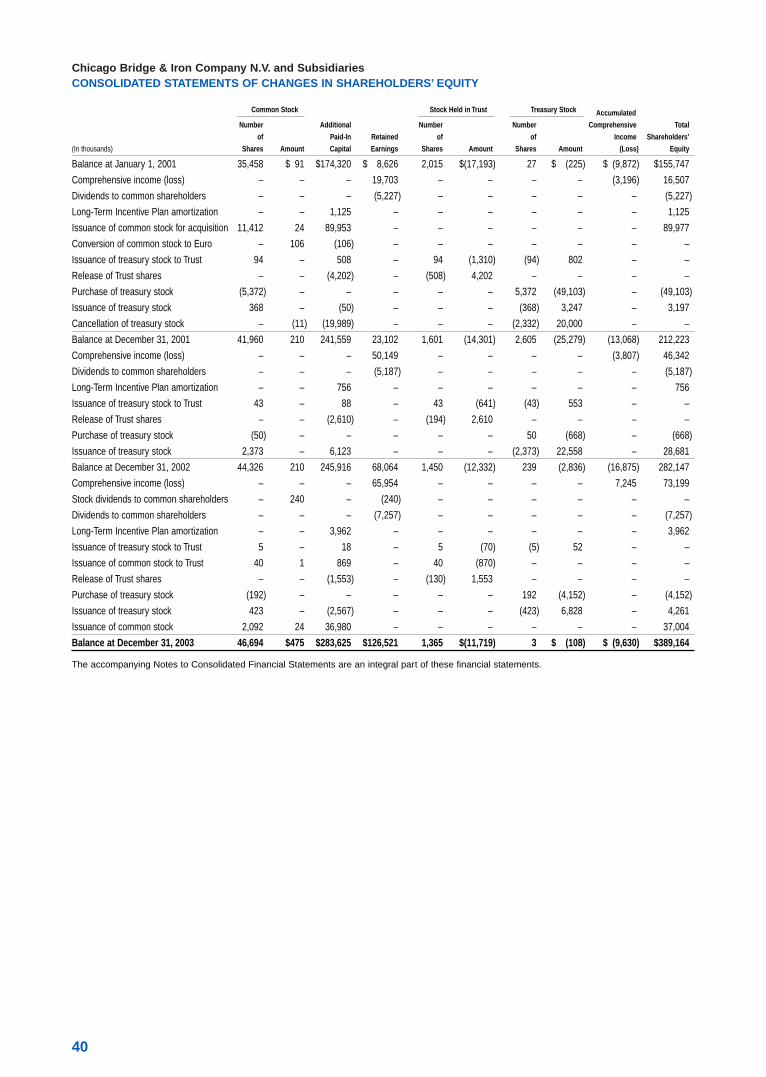
Issuance of common stock 2,092 24 36,980 – – – – – – 37,004
Balance at December 31, 2003 46,694 $475 $283,625 $126,521 1,365 $(11,719) 3 $ (108) $ (9,630) $389,164
The accompanying Notes to Consolidated Financial Statements are an integral part of these financial statements.
40
Chicago Bridge & Iron Company N.V. and SubsidiariesNOTES TO CONSOLIDATED FINANCIAL STATEMENTS
(In thousands, except share data)
1. Organization and Nature of OperationsOrganization—Chicago Bridge & Iron Company N.V. (a corporation organized under the laws of The Netherlands) andSubsidiaries, is a global technology and specialty engineering, procurement and construction (“EPC”) company servingcustomers in several primary end markets, including hydrocarbon refining, petrochemical, natural gas, water and the energysector in general. We have been helping customers store and process the earth’s natural resources for more than 100years by supplying a comprehensive range of engineered steel structures and systems. We offer a complete package ofdesign, engineering, fabrication, procurement, construction and maintenance services including hydrocarbon processingplants, liquefied natural gas (“LNG”) terminals and peak shaving plants, offshore structures, pipelines, bulk liquid terminals,water storage and treatment facilities, and other steel structures and their associated systems. We have been continuouslyengaged in the engineering and construction industry since our founding in 1889.
Nature of operations—Projects for the worldwide petroleum and petrochemical industry accounted for a majority of ourrevenues in 2003, 2002 and 2001. Numerous factors influence capital expenditure decisions in this industry, which arebeyond our control. Therefore, no assurance can be given that our business, financial condition and results of operationswill not be adversely affected because of reduced activity due to the price of oil or changing taxes, price controls and lawsand regulations related to the petroleum and petrochemical industry.
2. Significant Accounting PoliciesBasis of Accounting and Consolidation—These financial statements are prepared in accordance with accounting principles generally accepted in the United States of America. The consolidated financial statements include all majorityowned subsidiaries. Significant intercompany balances and transactions are eliminated in consolidation. Investments in non-majority owned affiliates are accounted for by the equity method. For the years ended 2003 and 2002 we did not haveany non-majority owned affiliates.
Use of Estimates—The preparation of financial statements in conformity with accounting principles generally accepted inthe United States of America requires us to make estimates and assumptions that affect the reported amounts of assetsand liabilities, the disclosed amounts of contingent assets and liabilities, and the reported amounts of revenues andexpenses. We believe the most significant estimates and assumptions are associated with revenue recognition on engineer-ing and construction contracts, recoverability tests that must be periodically performed with respect to goodwill and intangi-ble asset balances, valuation of accounts receivable, as well as the determination of liabilities related to self insuranceprograms. If the underlying estimates and assumptions, upon which the financial statements are based, change in thefuture, actual amounts may differ from those included in the accompanying consolidated financial statements.
Revenue Recognition—Revenues are recognized using the percentage-of-completion method. Contract revenues areaccrued based generally on the percentage that costs-to-date bear to total estimated costs. We follow the guidance of theStatement of Position 81-1, “Accounting for Performance of Construction-Type and Certain Production-Type Contracts,” foraccounting policy relating to our use of the percentage-of-completion method, estimating costs, revenue recognition andclaim recognition. The use of estimated cost to complete each contract, while the most widely recognized method used forpercentage-of-completion accounting, is a significant variable in the process of determining income earned and is a signifi-cant factor in the accounting for contracts. The cumulative impact of revisions in total cost estimates during the progress ofwork is reflected in the period in which these changes become known. Due to the various estimates inherent in our contractaccounting, actual results could differ from those estimates.
Contract revenue reflects the original contract price adjusted for agreed upon change orders and estimated minimumrecoveries of claims. At December 31, 2003 and 2002, we had net outstanding claims recognized of $6,970 and $5,946,respectively. Losses expected to be incurred on contracts in progress are charged to income as soon as such losses are known.
A significant portion of our work is performed on a fixed price or lump sum basis. The balance of projects is primarilyperformed on variations of cost reimbursable and target price approaches. Progress billings in accounts receivable atDecember 31, 2003 and 2002 were currently due and included retentions totaling $32,533 and $21,401, respectively to becollected within one year. Contract retentions collectible beyond one year at December 31, 2003 and 2002, totaled $11,254($7,938 anticipated to be collected in 2005 and $3,316 in 2006) and $6,387, respectively and were included in other non-current assets. Cost of revenues includes direct contract costs such as material and construction labor, and indirect costswhich are attributable to contract activity.
Cost and estimated earnings to date in excess of progress billings on contracts in process are classified as currentassets, and progress billings in excess of cost and estimated earnings to date are classified as current liabilities.
CB&I 2003 Annual Report 41
Precontract Costs—Precontract costs are generally charged to cost of revenues as incurred, but, in certain cases, may bedeferred to the balance sheet if specific probability criteria are met. There were no precontract costs deferred as ofDecember 31, 2003 or 2002.
Research and Development—Expenditures for research and development activities, which are charged to expense asincurred, amounted to $4,403 in 2003, $3,056 in 2002 and $1,650 in 2001.
Depreciation and Amortization—Property and equipment are recorded at cost and depreciated on a straight-line basisover their estimated useful lives: buildings and improvements, 10 to 40 years; plant and field equipment, 2 to 20 years.Renewals and betterments, which substantially extend the useful life of an asset, are capitalized and depreciated.Depreciation expense was $18,883 in 2003, $17,132 in 2002 and $19,286 in 2001.
Goodwill and indefinite-lived intangibles are no longer amortized in accordance with the Financial Accounting StandardsBoard (“FASB”) Statement of Financial Accounting Standards (“SFAS”) No. 142 (See Note 7). Finite-lived other intangiblesare amortized on a straight-line basis over 3 to 11 years, while other intangibles with indefinite useful lives are not amortized.
Impairment of Long-Lived Assets—Management reviews tangible assets and finite-lived intangibles for impairment whenever events or changes in circumstances indicate that the carrying amount may not be recoverable. If an evaluation is required, the estimated cash flows associated with the asset or asset group will be compared to the asset’s carryingamount to determine if impairment exists. See Note 7 for additional discussion relative to goodwill and indefinite-lived intangibles impairment testing.
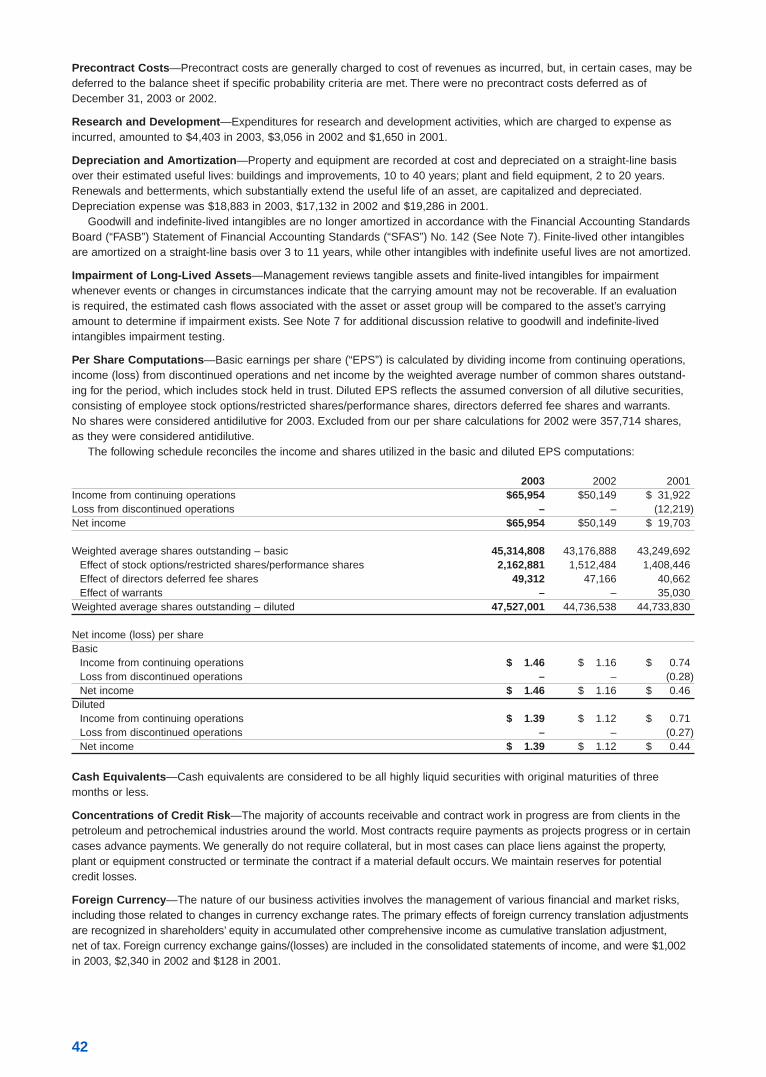
Per Share Computations—Basic earnings per share (“EPS”) is calculated by dividing income from continuing operations,income (loss) from discontinued operations and net income by the weighted average number of common shares outstand-ing for the period, which includes stock held in trust. Diluted EPS reflects the assumed conversion of all dilutive securities,consisting of employee stock options/restricted shares/performance shares, directors deferred fee shares and warrants.No shares were considered antidilutive for 2003. Excluded from our per share calculations for 2002 were 357,714 shares,as they were considered antidilutive.
The following schedule reconciles the income and shares utilized in the basic and diluted EPS computations:
2003 2002 2001Income from continuing operations $65,954 $50,149 $ 31,922 Loss from discontinued operations – – (12,219)Net income $65,954 $50,149 $ 19,703
Weighted average shares outstanding – basic 45,314,808 43,176,888 43,249,692 Effect of stock options/restricted shares/performance shares 2,162,881 1,512,484 1,408,446 Effect of directors deferred fee shares 49,312 47,166 40,662 Effect of warrants – – 35,030
Weighted average shares outstanding – diluted 47,527,001 44,736,538 44,733,830
Net income (loss) per shareBasic
Income from continuing operations $ 1.46 $ 1.16 $ 0.74 Loss from discontinued operations – – (0.28)Net income $ 1.46 $ 1.16 $ 0.46
DilutedIncome from continuing operations $ 1.39 $ 1.12 $ 0.71 Loss from discontinued operations – – (0.27)Net income $ 1.39 $ 1.12 $ 0.44
Cash Equivalents—Cash equivalents are considered to be all highly liquid securities with original maturities of threemonths or less.
Concentrations of Credit Risk—The majority of accounts receivable and contract work in progress are from clients in thepetroleum and petrochemical industries around the world. Most contracts require payments as projects progress or in certaincases advance payments. We generally do not require collateral, but in most cases can place liens against the property, plant or equipment constructed or terminate the contract if a material default occurs. We maintain reserves for potential credit losses.
Foreign Currency—The nature of our business activities involves the management of various financial and market risks,including those related to changes in currency exchange rates. The primary effects of foreign currency translation adjustmentsare recognized in shareholders’ equity in accumulated other comprehensive income as cumulative translation adjustment, net of tax. Foreign currency exchange gains/(losses) are included in the consolidated statements of income, and were $1,002in 2003, $2,340 in 2002 and $128 in 2001.
42
Financial Instruments—Although we do not engage in currency speculation, we periodically use forward contracts to miti-gate certain operating exposures, as well as hedge intercompany loans utilized to finance non-U.S. subsidiaries. Forwardcontracts utilized to mitigate operating exposures are generally designated as “cash flow hedges” under SFAS No. 133,“Accounting for Derivative Instruments and Hedging Activities.” Therefore, gains and losses associated with marking theseinstruments to market are included in accumulated other comprehensive income (loss) on our consolidated balance sheet.Gains or losses on forward contracts to hedge intercompany loans are included in the consolidated statements of income.Our other financial instruments are not significant.
Stock Plans—We account for stock-based compensation using the intrinsic value method prescribed by Accounting PrinciplesBoard (“APB”) Opinion No. 25, “Accounting for Stock Issued to Employees,” and related Interpretations. Accordingly, compen-sation cost for stock options is measured as the excess, if any, of the quoted market price of our stock at the date of thegrant over the amount an employee must pay to acquire the stock, subject to any vesting provisions. Reported net incomedoes not include any compensation expense associated with stock options, but does include compensation expense associ-ated with restricted stock and performance share awards. See Note 15 for additional discussion relative to our stock plans.
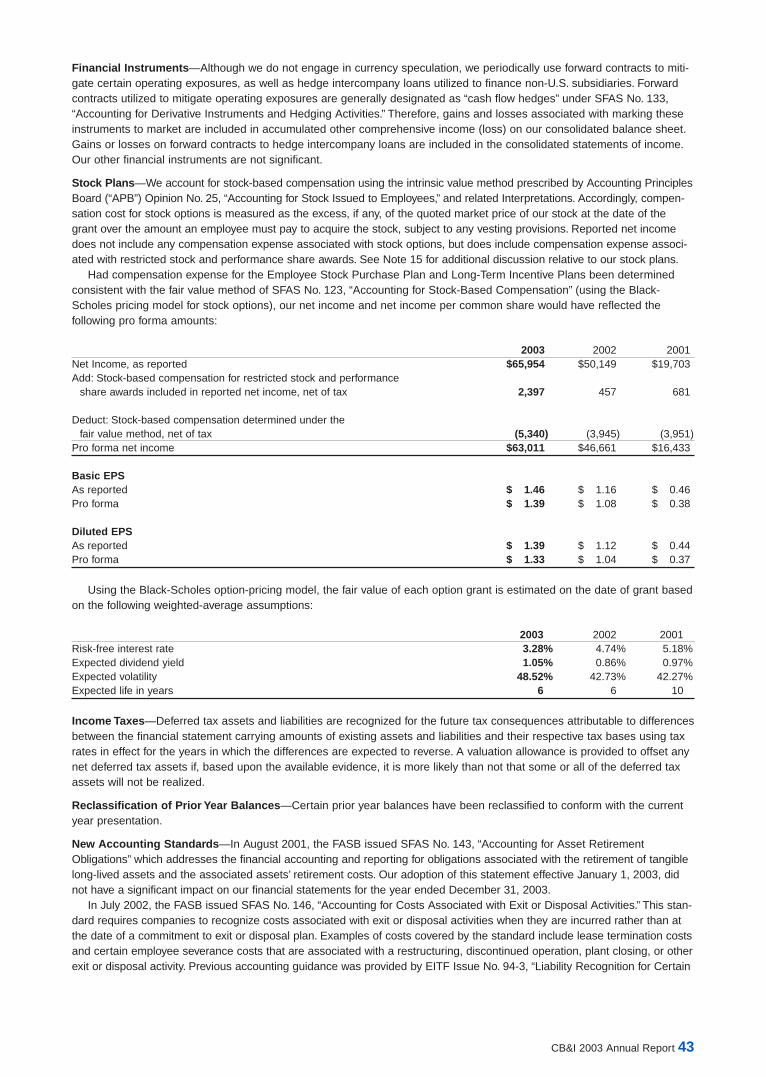
Had compensation expense for the Employee Stock Purchase Plan and Long-Term Incentive Plans been determinedconsistent with the fair value method of SFAS No. 123, “Accounting for Stock-Based Compensation” (using the Black-Scholes pricing model for stock options), our net income and net income per common share would have reflected the following pro forma amounts:
2003 2002 2001Net Income, as reported $65,954 $50,149 $19,703 Add: Stock-based compensation for restricted stock and performance
share awards included in reported net income, net of tax 2,397 457 681
Deduct: Stock-based compensation determined under the fair value method, net of tax (5,340) (3,945) (3,951)
Pro forma net income $63,011 $46,661 $16,433
Basic EPSAs reported $ 1.46 $ 1.16 $ 0.46 Pro forma $ 1.39 $ 1.08 $ 0.38
Diluted EPSAs reported $ 1.39 $ 1.12 $ 0.44 Pro forma $ 1.33 $ 1.04 $ 0.37
Using the Black-Scholes option-pricing model, the fair value of each option grant is estimated on the date of grant basedon the following weighted-average assumptions:
2003 2002 2001Risk-free interest rate 3.28% 4.74% 5.18%Expected dividend yield 1.05% 0.86% 0.97%Expected volatility 48.52% 42.73% 42.27%Expected life in years 6 6 10
Income Taxes—Deferred tax assets and liabilities are recognized for the future tax consequences attributable to differencesbetween the financial statement carrying amounts of existing assets and liabilities and their respective tax bases using taxrates in effect for the years in which the differences are expected to reverse. A valuation allowance is provided to offset anynet deferred tax assets if, based upon the available evidence, it is more likely than not that some or all of the deferred taxassets will not be realized.
Reclassification of Prior Year Balances—Certain prior year balances have been reclassified to conform with the currentyear presentation.
New Accounting Standards—In August 2001, the FASB issued SFAS No. 143, “Accounting for Asset RetirementObligations” which addresses the financial accounting and reporting for obligations associated with the retirement of tangiblelong-lived assets and the associated assets’ retirement costs. Our adoption of this statement effective January 1, 2003, didnot have a significant impact on our financial statements for the year ended December 31, 2003.
In July 2002, the FASB issued SFAS No. 146, “Accounting for Costs Associated with Exit or Disposal Activities.” This stan-dard requires companies to recognize costs associated with exit or disposal activities when they are incurred rather than atthe date of a commitment to exit or disposal plan. Examples of costs covered by the standard include lease termination costsand certain employee severance costs that are associated with a restructuring, discontinued operation, plant closing, or otherexit or disposal activity. Previous accounting guidance was provided by EITF Issue No. 94-3, “Liability Recognition for Certain
CB&I 2003 Annual Report 43
Employee Termination Benefits and Other Costs to Exit an Activity (including Certain Costs Incurred in a Restructuring).”SFAS No. 146 replaces Issue 94-3. SFAS No. 146 was to be applied prospectively to exit or disposal activities initiated after December 31, 2002. Our adoption of this statement effective January 1, 2003, did not have a significant impact on ourfinancial statements for the year ended December 31, 2003.
In December 2002, the FASB issued SFAS No. 148, “Accounting for Stock-Based Compensation – Transition andDisclosure,” which amends SFAS No. 123, “Accounting for Stock-Based Compensation.” This standard permits two additionaltransition methods for entities that adopt the fair-value-based method of accounting for stock-based employee compensationand amends the disclosure requirements in both annual and interim financial statements. We will continue to apply APBOpinion No. 25, “Accounting for Stock Issued to Employees,” and related interpretations in accounting for stock options. Thedisclosure requirements of SFAS No. 148 are presented above in our Stock Plans discussion.
In January 2003, the FASB issued Interpretation No. 46, “Consolidation of Variable Interest Entities,” (“FIN 46”) which isan interpretation of Accounting Research Bulletin No. 51, “Consolidated Financial Statements.” The interpretation states thatcertain variable interest entities may be required to be consolidated into the results of operations and financial position ofthe entity that is the primary beneficiary. The change may be made prospectively with a cumulative-effect adjustment in theperiod first applied or by restating previously issued financial statements. Our adoption of this interpretation effective July 1,2003, did not have a significant impact on our financial statements for the year ended December 31, 2003.
In April 2003, the FASB issued SFAS No. 149, “Amendment of Statement 133 on Derivative Instruments and HedgingActivities,” which amends SFAS No. 133, “Accounting for Derivative Instruments and Hedging Activities.” SFAS No. 149 provides clarification on financial accounting and reporting of derivative instruments and hedging activities and requirescontracts with similar characteristics to be accounted for on a comparable basis. This statement is effective for contractsentered into or modified after June 30, 2003 and was applied prospectively. Our adoption of this statement effective July 1,2003, did not have a significant impact on our financial statements for the year ended December 31, 2003.
In December 2003, the FASB issued SFAS No. 132 (revised 2003), “Employers’ Disclosures about Pensions and OtherPostretirement Benefits.” The revised standard requires annual and interim disclosures in addition to those in the originalstandard concerning the assets, obligations, cash flows, and net periodic benefit cost of defined benefit pension plans andother defined benefit postretirement plans. This statement is effective for fiscal years ending after December 15, 2003.See Note 11 for the revised disclosure requirements of SFAS No. 132.
In January 2004, the FASB issued FASB Staff Position No. FAS 106-1 (“FSP 106-1”), “Accounting and DisclosureRequirements Related to the Medicare Prescription Drug, Improvement and Modernization Act of 2003,” which provides temporary guidance concerning the recently enacted Medicare Prescription Drug, Improvement and Modernization Act of2003 (the “Act”). SFAS No. 106, “Employers’ Accounting for Postretirement Benefits Other Than Pensions,” requires presentlyenacted changes in laws that will take effect in future periods to be taken into account in measuring current period postretire-ment benefit cost and the accumulated projected benefit obligation (“APBO”). FSP 106-1 allows companies that sponsoraffected postretirement benefit plans to elect to defer recognizing the effects of the Act on postretirement benefit expenseand on the APBO pursuant to SFAS No. 106. We have elected to defer accounting for the effects of the Act until 2004.
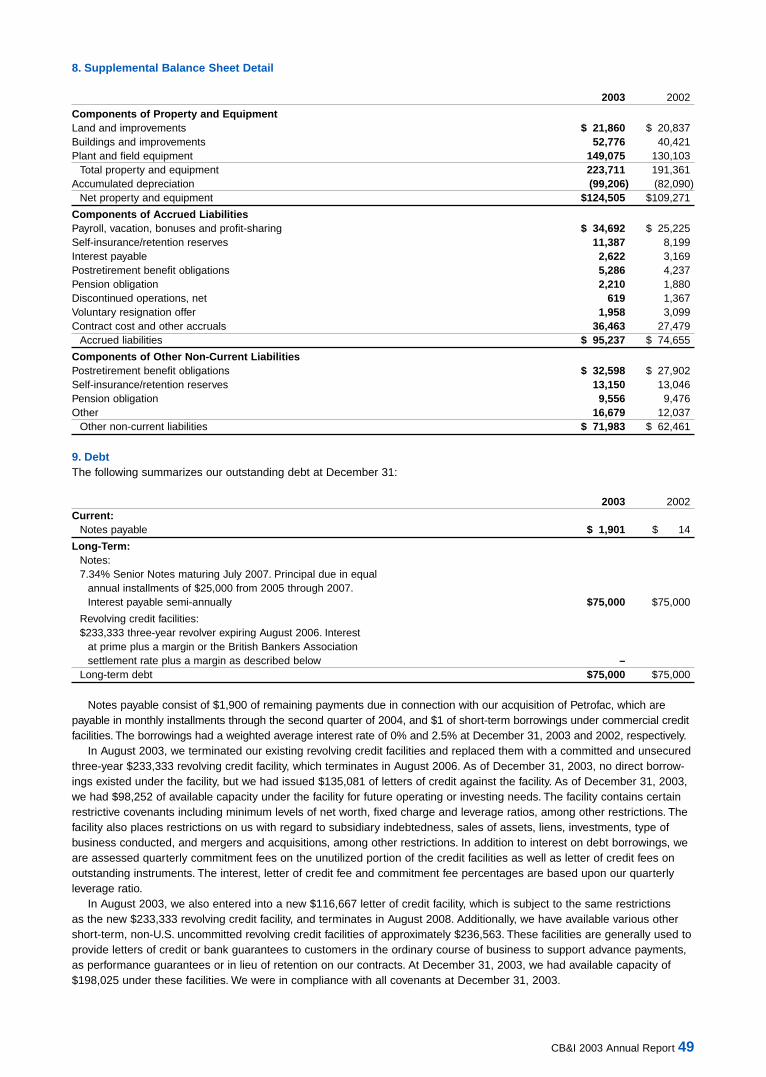
3. Acquisitions2003On April 29, 2003, we acquired certain assets and assumed certain liabilities of Petrofac Inc. (“Petrofac”), an EPC companyserving the hydrocarbon processing industry for consideration of $26,255, including transaction costs, of which $24,355 was paid during 2003. The remaining $1,900, which is reflected as notes payable on the December 31, 2003 ConsolidatedBalance Sheet, is payable in monthly installments through the second quarter of 2004. The acquired operations located inTyler, Texas, have been fully integrated within our North America segment’s CB&I Howe-Baker unit and expand our capacityto engineer, fabricate and install EPC projects for the oil refining, oil production, gas treating and petrochemical industries.
On May 30, 2003, we acquired certain assets and assumed certain liabilities of John Brown Hydrocarbons Limited(“John Brown”), for consideration of $29,984, including transaction costs, net of cash acquired. John Brown provides com-prehensive engineering, program and construction management services for the offshore, onshore and pipeline sectors ofthe hydrocarbon industry, as well as for LNG terminals and flue gas desulfurization plants. The acquired operations, locatedin London, Moscow, the Caspian Region and Canada, have been integrated into our Europe, Africa, Middle East (“EAME”)segment. This addition strengthens our international engineering and execution platform and expands our capabilities intothe upstream oil and gas sector.
The purchase prices, including transaction costs, for the above acquisitions were allocated to the net assets acquiredbased upon their estimated fair market values on the date of acquisition and the balance of approximately $45,000 wasrecorded as goodwill. The net assets and operating results have been included in our financial statements from the respec-tive dates of the acquisitions. Pro-forma financial information has not been disclosed separately as the amounts were notmaterial to our overall financial condition or results of operations.
44
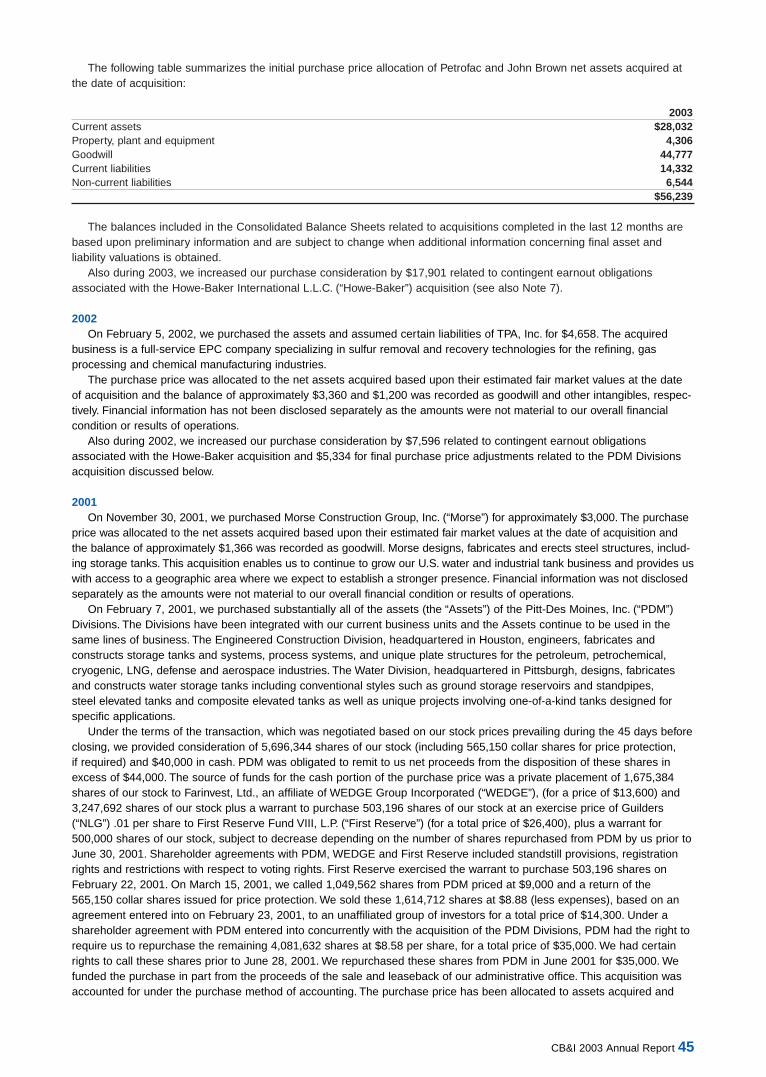
The following table summarizes the initial purchase price allocation of Petrofac and John Brown net assets acquired atthe date of acquisition:
The balances included in the Consolidated Balance Sheets related to acquisitions completed in the last 12 months arebased upon preliminary information and are subject to change when additional information concerning final asset and liability valuations is obtained.
Also during 2003, we increased our purchase consideration by $17,901 related to contingent earnout obligations associated with the Howe-Baker International L.L.C. (“Howe-Baker”) acquisition (see also Note 7).
2002On February 5, 2002, we purchased the assets and assumed certain liabilities of TPA, Inc. for $4,658. The acquired
business is a full-service EPC company specializing in sulfur removal and recovery technologies for the refining, gas processing and chemical manufacturing industries.
The purchase price was allocated to the net assets acquired based upon their estimated fair market values at the dateof acquisition and the balance of approximately $3,360 and $1,200 was recorded as goodwill and other intangibles, respec-tively. Financial information has not been disclosed separately as the amounts were not material to our overall financial condition or results of operations.
Also during 2002, we increased our purchase consideration by $7,596 related to contingent earnout obligations associated with the Howe-Baker acquisition and $5,334 for final purchase price adjustments related to the PDM Divisionsacquisition discussed below.
2001 On November 30, 2001, we purchased Morse Construction Group, Inc. (“Morse”) for approximately $3,000. The purchase
price was allocated to the net assets acquired based upon their estimated fair market values at the date of acquisition andthe balance of approximately $1,366 was recorded as goodwill. Morse designs, fabricates and erects steel structures, includ-ing storage tanks. This acquisition enables us to continue to grow our U.S. water and industrial tank business and provides uswith access to a geographic area where we expect to establish a stronger presence. Financial information was not disclosedseparately as the amounts were not material to our overall financial condition or results of operations.
On February 7, 2001, we purchased substantially all of the assets (the “Assets”) of the Pitt-Des Moines, Inc. (“PDM”)Divisions. The Divisions have been integrated with our current business units and the Assets continue to be used in thesame lines of business. The Engineered Construction Division, headquartered in Houston, engineers, fabricates and constructs storage tanks and systems, process systems, and unique plate structures for the petroleum, petrochemical,cryogenic, LNG, defense and aerospace industries. The Water Division, headquartered in Pittsburgh, designs, fabricatesand constructs water storage tanks including conventional styles such as ground storage reservoirs and standpipes, steel elevated tanks and composite elevated tanks as well as unique projects involving one-of-a-kind tanks designed forspecific applications.
Under the terms of the transaction, which was negotiated based on our stock prices prevailing during the 45 days beforeclosing, we provided consideration of 5,696,344 shares of our stock (including 565,150 collar shares for price protection, if required) and $40,000 in cash. PDM was obligated to remit to us net proceeds from the disposition of these shares inexcess of $44,000. The source of funds for the cash portion of the purchase price was a private placement of 1,675,384shares of our stock to Farinvest, Ltd., an affiliate of WEDGE Group Incorporated (“WEDGE”), (for a price of $13,600) and3,247,692 shares of our stock plus a warrant to purchase 503,196 shares of our stock at an exercise price of Guilders(“NLG”) .01 per share to First Reserve Fund VIII, L.P. (“First Reserve”) (for a total price of $26,400), plus a warrant for500,000 shares of our stock, subject to decrease depending on the number of shares repurchased from PDM by us prior toJune 30, 2001. Shareholder agreements with PDM, WEDGE and First Reserve included standstill provisions, registrationrights and restrictions with respect to voting rights. First Reserve exercised the warrant to purchase 503,196 shares onFebruary 22, 2001. On March 15, 2001, we called 1,049,562 shares from PDM priced at $9,000 and a return of the565,150 collar shares issued for price protection. We sold these 1,614,712 shares at $8.88 (less expenses), based on anagreement entered into on February 23, 2001, to an unaffiliated group of investors for a total price of $14,300. Under ashareholder agreement with PDM entered into concurrently with the acquisition of the PDM Divisions, PDM had the right torequire us to repurchase the remaining 4,081,632 shares at $8.58 per share, for a total price of $35,000. We had certainrights to call these shares prior to June 28, 2001. We repurchased these shares from PDM in June 2001 for $35,000. Wefunded the purchase in part from the proceeds of the sale and leaseback of our administrative office. This acquisition wasaccounted for under the purchase method of accounting. The purchase price has been allocated to assets acquired and
CB&I 2003 Annual Report 45
liabilities assumed based on estimated fair values at the date of acquisition and the balance of approximately $48,345 wasrecorded as goodwill and $387 as other intangibles. Goodwill was amortized on a straight-line basis over 40 years throughDecember 31, 2001. The PDM Divisions are included in our results of operations effective February 1, 2001. The pro formaresults for the year ended December 31, 2001, assuming the acquisition had been made at the beginning of the year,would not be materially different from reported results.
4. Exit Costs/Special ChargesEffective January 1, 2003, we were required to record costs for exit or disposal activities in accordance with SFAS No.
146. Moving replacement personnel and integration costs will be recorded as incurred. However, there were no exit or dis-posal activities initiated after January 1, 2003. Prior to January 1, 2003 we recorded special charges in accordance withEITF 94-3. Our accrued expense balances and activity relating to special charges for the years ended December 31, 2003,2002 and 2001 were as follows:
Personnel FacilitiesCosts and Other Integration Total
Balance at January 1, 2001 $ 10,874 $ 838 $ – $ 11,712 Special charges 5,697 2,819 1,170 9,686 Cash payments (12,671) (944) (1,170) (14,785)Non-cash activities 911 (1,429) – (518)Balance at December 31, 2001 4,811 1,284 – 6,095 Special charges 3,428 18(1) 526 3,972 Cash payments (4,618) (810) (526) (5,954)Balance at December 31, 2002 3,621 492 – 4,113 Cash payments (1,511) – – (1,511)Balance at December 31, 2003 $ 2,110 $ 492 $ – $ 2,602
(1) Includes a $360 non-cash credit associated with the sale of our XL Technology Systems, Inc. subsidiary as described below.
Personnel Costs—Personnel costs include severance and personal moving expenses associated with the relocation, closure or downsizing of offices, and a voluntary resignation offer (the “Offer”). During 2002, we recorded personnel costs of$3,428, primarily consisting of $2,688 to relocate our Plainfield, Illinois administrative office to The Woodlands, Texas (“theMove”), $360 of costs to relocate our welding lab facility personnel from Houston, Texas to Plainfield, Illinois, and $270 ofadditional costs relative to the Offer. Previously accrued expenses of $170 associated with the Move and $1,341 associatedwith the Offer were paid during 2003, while obligations of $1,958 associated with the Offer and $30 associated with theMove are anticipated to be paid during 2004. The remaining balance associated with personnel costs is anticipated to bepaid during 2005 and 2006. During 2001, we recorded charges for personnel costs of $5,271 related to the Move, includingcosts associated with the separation of senior executives who elected not to relocate, as well as moving-related (including a$1,089 non-cash charge related to interest-free loans to senior executives for relocation home purchases) and severanceexpenses. Personnel moving and replacement costs were expensed as incurred and totaled $1,334. We charged $2,014 ofseverance for the involuntary termination of approximately 50 employees in the United States and 18 employees in non-U.S.operations and personal moving expenses during 2001. We had anticipated the wind-up of a defined benefit plan during2000; however, market and cost considerations resulted in the reversal of this decision and the $2,000 non-cash charge during the fourth quarter of 2001. In connection with the Offer, $412 of additional charges were incurred during 2001.
Facilities and Other—Facilities and other include charges related to the sale, closure, downsizing or relocation of opera-tions. During 2002, we recorded facility and other costs of $378, which included $191 to relocate our welding lab facilityfrom Houston, Texas to Plainfield, Illinois and $116 to move our Fairbanks, Texas administrative facility offices to TheWoodlands, Texas. Also during 2002, we recorded income of $360 in relation to adjustments associated with the sale of ourXL Technology Systems, Inc. subsidiary. The remaining accrued expense balance is anticipated to be paid during 2004.During 2000, we made a commitment to downsize or lower costs at five facilities worldwide including non-cash asset write-downs and lease terminations. During the second quarter of 2001, we completed the sale and leaseback of our Plainfield,Illinois administrative office, one of the three facilities anticipated to be sold at December 31, 2000. Two facilities remainunsold at December 31, 2003. The net carrying amount for these assets was $2,782 at December 31, 2003. We anticipateselling these assets in 2004 or 2005. The relocation from the two leased facilities was completed during 2001. We incurredcharges of $1,219 (including a $171 non-cash reduction to asset write-downs and $38 for lease terminations) during 2001related to the five facilities previously discussed and two additional relocations. Facility moving costs were expensed asincurred and totaled $920. In the fourth quarter of 2001, we recorded a non-cash charge of $1,600 for the anticipated saleof our XL Technology Systems, Inc. subsidiary to management employees, which was completed in the first quarter of 2002.
Integration—During 2002, we recorded integration costs of $526, which included $216 to integrate our safety program withthe acquired PDM Divisions and $289 to integrate our engineering practices with those of the acquired PDM Divisions.These costs were expensed as incurred. In 2001, we recorded charges of $1,170 relative to these initiatives.
46
5. Discontinued OperationsDuring the second quarter of 2001, we decided to discontinue our high purity piping business, UltraPure Systems (“UPS”),due primarily to continuing weak market conditions in the microelectronics industry. The loss from discontinued operationsfor the year ended December 31, 2001 was $2,321 (net of tax benefit of $355). The loss on disposal of discontinued opera-tions of $9,898 (net of tax benefit of $2,338) includes the write-down of equipment (net of proceeds), lease terminations,severance and other costs, and losses during the phase-out period. Revenues for these operations were $15,913 for theyear ended December 31, 2001. As a result of these operations being classified as discontinued, prior periods have beenpreviously restated.
We sold our UPS Puerto Rican subsidiary to former management in July 2001 and sold the business assets and operations of UPS’s North Carolina operations in August 2001. Our actions necessary to discontinue UPS were essentiallycomplete at December 31, 2001.
6. Contracts in ProgressContract terms generally provide for progress billings based on completion of certain phases of the work. The excess of
costs and estimated earnings for construction contracts over progress billings on contracts in progress is reported as a current asset and the excess of progress billings over costs and estimated earnings on contracts in progress is reported asa current liability as follows:
2003 2002Contracts in ProgressRevenues recognized on contracts in progress $ 3,097,942 $ 2,019,931 Billings on contracts in progress (3,086,204) (2,093,865)
$ 11,738 $ (73,934)
Shown on balance sheet as:Contracts in progress with costs and estimated earnings exceeding related progress billings $ 142,235 $ 48,423 Contracts in progress with progress billings exceeding related costs and estimated earnings (130,497) (122,357)
$ 11,738 $ (73,934)
7. Goodwill and Other IntangiblesGoodwillGeneral—At December 31, 2003 and 2002, our goodwill balance was $219,033 and $157,903, respectively, attributable tothe excess of the purchase price over the fair value of assets acquired relative to acquisitions within our North America andEAME segments.
Aggregate goodwill acquired during 2003 of $61,130 primarily relates to the acquisitions of Petrofac and John Brown,contingent earnout obligations associated with the Howe-Baker acquisition, the impact of foreign currency translation, and areduction in accordance with SFAS No. 109, “Accounting for Income Taxes,” where tax goodwill exceeded book goodwill. AtDecember 31, 2003, goodwill expected to be deductible for tax purposes relative to these acquisitions was $42,019.
The change in goodwill by segment for 2002 and 2003 is as follows:
North America EAME TotalBalance at December 31, 2001 $138,444 $ – $138,444 Acquisitions and contingent earnout obligations 19,459 – 19,459 Balance at December 31, 2002 157,903 – 157,903 Acquisitions and contingent earnout obligations 41,307 19,823 61,130 Balance at December 31, 2003 $199,210 $19,823 $219,033
Impairment Testing—SFAS No. 142 “Goodwill and Other Intangible Assets” states goodwill and indefinite-lived intangibleassets are no longer amortized to earnings, but instead are reviewed for impairment at least annually. The amortization ofexisting goodwill and indefinite-lived intangible assets at June 30, 2001 ceased at January 1, 2002. Goodwill on acquisitionscompleted subsequent to June 30, 2001, is not amortized. Our adoption of SFAS No. 142 resulted in no goodwill and indefinite-lived intangibles amortization in 2002 compared with $4,196 in 2001. SFAS No. 142 prescribes a two-phaseprocess for testing of goodwill, which is performed annually, absent any indicators of impairment. The first phase screensfor impairment, while the second phase (if necessary) measures impairment. We have elected to perform our annual analysis during the fourth quarter of each year based upon goodwill balances as of the end of the third calendar quarter.Upon completion of our 2003 impairment test, no impairment charge was necessary. Impairment testing was accomplishedby comparing an estimate of discounted future cash flows to the net book value of each reporting unit. Multiples of eachreporting unit’s earnings before interest, taxes, depreciation and amortization were also utilized in our analysis as a com-parative measure. There can be no assurance that future goodwill impairment tests will not result in a charge to earnings.
CB&I 2003 Annual Report 47
Pro Forma Information—The following table provides comparative results for the years ended December 31, 2003, 2002,and 2001 for the effects resulting from our adoption of SFAS No. 142:
2003 2002 2001Net income $65,954 $50,149 $19,703 Add back: Goodwill and other indefinite-lived intangibles amortization
(Net of taxes of $1,469) – – 2,727 Pro forma net income $65,954 $50,149 $22,430
Net income per shareBasic:Net income $ 1.46 $ 1.16 $ 0.46 Goodwill and other indefinite-lived intangibles amortization, net of taxes – – 0.06 Pro forma net income $ 1.46 $ 1.16 $ 0.52
Diluted:Net income $ 1.39 $ 1.12 $ 0.44 Goodwill and other indefinite-lived intangibles amortization, net of taxes – – 0.06 Pro forma net income $ 1.39 $ 1.12 $ 0.50
Other Intangible AssetsIn accordance with SFAS No. 142, the following table provides information concerning our other intangible assets for theyears ended December 31, 2003 and 2002:
The change in other intangibles compared with 2002 primarily relates to amortization. Intangible amortization for theyears ended 2003, 2002 and 2001 was $2,548, $2,529 and $1,623, respectively. For the years ended 2004, 2005, 2006,2007 and 2008, amortization of existing intangibles is anticipated to be $1,823, $1,561, $694, $694 and $694, respectively.
48
8. Supplemental Balance Sheet Detail
2003 2002
Components of Property and EquipmentLand and improvements $ 21,860 $ 20,837 Buildings and improvements 52,776 40,421 Plant and field equipment 149,075 130,103
Total property and equipment 223,711 191,361 Accumulated depreciation (99,206) (82,090)
Net property and equipment $124,505 $109,271
Components of Accrued LiabilitiesPayroll, vacation, bonuses and profit-sharing $ 34,692 $ 25,225 Self-insurance/retention reserves 11,387 8,199 Interest payable 2,622 3,169 Postretirement benefit obligations 5,286 4,237 Pension obligation 2,210 1,880 Discontinued operations, net 619 1,367 Voluntary resignation offer 1,958 3,099 Contract cost and other accruals 36,463 27,479
Accrued liabilities $ 95,237 $ 74,655
Components of Other Non-Current LiabilitiesPostretirement benefit obligations $ 32,598 $ 27,902 Self-insurance/retention reserves 13,150 13,046 Pension obligation 9,556 9,476 Other 16,679 12,037
Other non-current liabilities $ 71,983 $ 62,461
9. DebtThe following summarizes our outstanding debt at December 31:
2003 2002Current:
Notes payable $ 1,901 $ 14
Long-Term:Notes:7.34% Senior Notes maturing July 2007. Principal due in equal
annual installments of $25,000 from 2005 through 2007.Interest payable semi-annually $75,000 $75,000
Revolving credit facilities:$233,333 three-year revolver expiring August 2006. Interest
at prime plus a margin or the British Bankers Associationsettlement rate plus a margin as described below –
Long-term debt $75,000 $75,000
Notes payable consist of $1,900 of remaining payments due in connection with our acquisition of Petrofac, which arepayable in monthly installments through the second quarter of 2004, and $1 of short-term borrowings under commercial creditfacilities. The borrowings had a weighted average interest rate of 0% and 2.5% at December 31, 2003 and 2002, respectively.
In August 2003, we terminated our existing revolving credit facilities and replaced them with a committed and unsecuredthree-year $233,333 revolving credit facility, which terminates in August 2006. As of December 31, 2003, no direct borrow-ings existed under the facility, but we had issued $135,081 of letters of credit against the facility. As of December 31, 2003,we had $98,252 of available capacity under the facility for future operating or investing needs. The facility contains certainrestrictive covenants including minimum levels of net worth, fixed charge and leverage ratios, among other restrictions. Thefacility also places restrictions on us with regard to subsidiary indebtedness, sales of assets, liens, investments, type ofbusiness conducted, and mergers and acquisitions, among other restrictions. In addition to interest on debt borrowings, weare assessed quarterly commitment fees on the unutilized portion of the credit facilities as well as letter of credit fees onoutstanding instruments. The interest, letter of credit fee and commitment fee percentages are based upon our quarterlyleverage ratio.
In August 2003, we also entered into a new $116,667 letter of credit facility, which is subject to the same restrictions as the new $233,333 revolving credit facility, and terminates in August 2008. Additionally, we have available various othershort-term, non-U.S. uncommitted revolving credit facilities of approximately $236,563. These facilities are generally used toprovide letters of credit or bank guarantees to customers in the ordinary course of business to support advance payments,as performance guarantees or in lieu of retention on our contracts. At December 31, 2003, we had available capacity of$198,025 under these facilities. We were in compliance with all covenants at December 31, 2003.
CB&I 2003 Annual Report 49
Our $75,000 of senior notes also contain a number of restrictive covenants, including minimum levels of net worth anddebt and fixed charge ratios, among other restrictions. The notes also place restrictions on us with regard to investments,other debt, subsidiary indebtedness, sales of assets, liens, nature of business conducted and mergers, among other restrictions. We were in compliance with all covenants at December 31, 2003.
Capitalized interest was insignificant in 2003, 2002 and 2001.
10. Financial InstrumentsForward Contracts—At December 31, 2003 our forward contracts to hedge intercompany loans, which matured withinseven days following the year end, are summarized as follows:
Weighted AverageCurrency Sold Currency Purchased Contract Amount Contract RateEuros U.S. Dollars $ 5,792 0.83 U.S. Dollars British Pounds $ 7,437 0.58 U.S. Dollars Canadian Dollars $ 5,395 1.30 U.S. Dollars Australian Dollars $ 20,051 1.35 U.S. Dollars South African Rand $ 1,071 6.22
At December 31, 2003 our forward contracts to hedge certain operating exposures included $23,197 to buy Euros at a weighted average contract rate of 0.86. These contracts were designated as “cash flow hedges” under SFAS No. 133,“Accounting for Derivative Instruments and Hedging Activities.” At December 31, 2003, the fair value of these contacts was $2,026. Any hedge ineffectiveness was not significant.
Fair Value—The carrying value of our cash and cash equivalents, accounts receivable, accounts payable, notes payable and forward contracts approximates their fair values because of the short term nature of these instruments. AtDecember 31, 2003 and 2002, the fair value of our long-term debt was $82,041 and $80,748, respectively, based on current market rates for debt with similar credit risk and maturities.
11. Retirement BenefitsDefined Contribution Plans—We sponsor two contributory defined contribution plans for eligible employees which consistof a voluntary pre-tax salary deferral feature, a matching contribution, and a profit-sharing contribution in the form of cash or our common stock to be determined annually. For the years ended December 31, 2003, 2002 and 2001, we expensed$11,340, $10,989 and $9,464, respectively, for these plans.
In addition, we sponsor several other defined contribution plans that cover salaried and hourly employees for which wedo not provide matching contributions. The cost of these plans to us was not significant in 2003, 2002 and 2001.
Defined Benefit and Other Postretirement Plans—We currently sponsor various defined benefit pension plans coveringcertain employees of our North America and EAME segments. In connection with the John Brown acquisition, we assumedcertain pension obligations related to its employees.
We also provide certain health care and life insurance benefits for our retired employees through three health care andlife insurance benefit programs. In connection with the John Brown and Petrofac acquisitions in 2003 and TPA acquisition in2002, we assumed certain postretirement benefit obligations related to their employees. Retiree health care benefits areprovided under an established formula, which limits costs based on prior years of service of retired employees. These plansmay be changed or terminated by us at any time.
We use a December 31 measurement date for the majority of our plans. During 2004, we expect to contribute $4,929and $3,006 to our defined benefit and other postretirement plans, respectively.
50
The following tables provide combined information for our defined benefit and other postretirement plans:
Components of Net Periodic Benefit Cost Defined Benefit Plans Other Postretirement Plans2003 2002 2001 2003 2002 2001
Service cost $ 2,898 $ 180 $ 163 $ 1,679 $ 999 $ 778 Interest cost 1,150 973 968 1,871 1,453 1,234 Expected return on plan assets (1,429) (1,354) (1,449) – – – Amortization of prior service costs 9 8 – (101) (101) (101)Recognized net actuarial loss (gain) 411 102 207 94 1 (14)Net periodic benefit expense (income) $ 3,039 $ (91) $ (111) $ 3,543 $ 2,352 $1,897
Change in Benefit Obligation2003 2002 2003 2002
Benefit obligation at beginning of year $15,579 $14,547 $ 23,607 $ 18,659 Acquisition 3,857 – 7,009 897 Service cost 2,898 180 1,679 999 Interest cost 1,150 973 1,871 1,453 Actuarial loss 607 1,110 1,897 3,020 Effect of plan change – – (2,014) – Plan participants' contributions 412 – 893 686 Benefits paid (1,404) (1,318) (3,507) (2,107)Currency translation 2,201 87 266 – Benefit obligation at end of year $25,300 $15,579 $ 31,701 $ 23,607
Change in Plan Assets2003 2002 2003 2002
Fair value at beginning of year $15,221 $17,429 $ – $ –Acquisition 3,555 – – –Actual return (loss) on plan assets 3,064 (1,089) – –Benefits paid (1,404) (1,318) (3,507) (2,107)Employer contribution 2,153 43 2,614 1,421 Plan participants' contributions 412 – 893 686 Currency translation 2,951 156 – –Fair value at end of year $25,952 $15,221 $ – $ –
Funded status $ 652 $ (356) $(31,701) $(23,607)Unrecognized net prior service costs 106 94 (2,689) (776)Unrecognized net actuarial loss 4,045 4,870 5,588 2,962 Net amount recognized $ 4,803 $ 4,608 $(28,802) $(21,421)
Amounts recognized in the balance sheet consist of:Prepaid benefit cost $ 8,151 $ 7,274 $ – $ – Accrued benefit cost (4,525) (4,242) (28,802) (21,421)Accumulated other comprehensive loss, before taxes 1,177 1,576 – – Net amount recognized $ 4,803 $ 4,608 $(28,802) $(21,421)
The accumulated benefit obligation for all defined benefit plans was $23,821 and $15,486 at December 31, 2003 and2002, respectively.
The following table reflects information for defined benefit plans with an accumulated benefit obligation in excess of plan assets:
December 31, 2003 2002Projected benefit obligation $8,902 $8,571 Accumulated benefit obligation $8,851 $8,478 Fair value of plan assets $5,440 $4,747
CB&I 2003 Annual Report 51
Additional Information Defined Benefit Plans Other Postretirement Plans2003 2002 2003 2002
(Decrease) Increase in minimum liability included in other comprehensive income $(399) $1,391 n/a n/a
Weighted-average assumptions used to determine benefitobligations at December 31,Discount rate 5.80% 6.30% 6.16% 7.25%Rate of compensation increase(1) 4.45% n/a n/a n/a
Weighted-average assumptions used to determine netperiodic benefit cost for the years ended December 31,Discount rate 5.69% 6.18% 6.21% 7.25%Expected long-term return on plan assets(2) 7.26% 7.48% n/a n/aRate of compensation increase(1) 4.45% n/a n/a n/a
(1) The rate of compensation increase in the table relates solely to one defined benefit plan. The rate of compensation increase for our other plans isnot applicable as benefits under certain plans are based upon years of service, while the remaining plans primarily cover retirees, whereby futurecompensation is not a factor.
(2) The expected long-term rate of return on the defined benefit plan assets was derived using historical returns by asset category and expectations forfuture capital market performance.
Defined Benefit Plans—The defined benefit plans’ assets consist primarily of short-term fixed income funds and long-terminvestments, including equity and fixed-income securities. The following table provides weighted-average asset allocationsat December 31, 2003 and 2002, by asset category:
Target Plan AssetsAsset Category at December 31, Allocations 2003 2002Equity securities 60-80% 73% 61%Debt securities 20-40% 23% 34%Real estate 0-5% 2% 3%Other 0-15% 2% 2%Total 100% 100% 100%
Our investment strategy for benefit plan assets is to maintain a diverse portfolio to maximize a return over the long-term,subject to an appropriate level of risk. Our defined benefit plans’ assets are managed by external investment managers withoversight by our internal investment committee.
Other Postretirement Plans—The Medicare Prescription Drug, Improvement and Modernization Act of 2003 (the “Act”) wassigned into law on December 8, 2003. As permitted under FSP 106-1, we elected to defer accounting for certain of theeffects of the Act pending issuance of final guidance and transition rules in 2004. We are currently reviewing the Act andthe potential impact on our U.S. postretirement medical plans. Accordingly, the accumulated postretirement benefit obliga-tion and net periodic benefit costs related to this plan do not reflect the effects of the Act. Once final guidance is issued,previously reported information is subject to change.
The medical plan for retirees, other than those covered by the Howe-Baker and John Brown programs, offers a defineddollar benefit; therefore, a one percentage point increase or decrease in the assumed rate of medical inflation would notaffect the accumulated postretirement benefit obligation, service cost and interest cost. Under the Howe-Baker programs,health care cost trend rates are projected at annual rates ranging from 8.9% in 2004 down to 5.0% in 2011. Under the John Brown program, the assumed rate of health care cost inflation is a level 8.5% per annum. Increasing/(decreasing) the assumed health care cost trends by one percentage point for the Howe-Baker and John Brown programs is estimatedto increase/(decrease) the accumulated postretirement benefit obligation at December 31, 2003 and the total of the serviceand interest cost components of net postretirement health care cost for the year then ended as follows:
1-Percentage- 1-Percentage-Point Increase Point Decrease
Effect on total of service and interest cost $487 $(400)Effect on postretirement benefit obligation $656 $(573)
Multi-employer Pension Plans—We made contributions to certain union sponsored multi-employer pension plans of$6,417, $4,689 and $5,097 in 2003, 2002 and 2001, respectively. Benefits under these defined benefit plans are generallybased on years of service and compensation levels. Under U.S. legislation regarding such pension plans, a company isrequired to continue funding its proportionate share of a plan’s unfunded vested benefits in the event of withdrawal (asdefined by the legislation) from a plan or plan termination. We participate in a number of these pension plans, and the
52
potential obligation as a participant in these plans may be significant. The information required to determine the totalamount of this contingent obligation, as well as the total amount of accumulated benefits and net assets of such plans, is not readily available.
Obligations to Former Parent—In connection with the 1997 reorganization and initial public offering, we agreed to makefixed payments to our former parent to fund certain defined benefit and postretirement benefit obligations. The remainingobligations were $7,241 and $9,082 at December 31, 2003, for defined benefit and postretirement benefit obligations,respectively. As of December 31, 2002, the defined benefit and postretirement benefit obligations were $8,689 and $10,876,respectively. These obligations are payable with interest ratably through December 2008. Interest expense accruing at acontractual rate of 7.5% per year associated with the defined benefit obligations totaled $639, $747 and $855 for 2003,2002 and 2001, respectively, and the postretirement benefit obligation, also accruing interest at 7.5% totaled $791, $925and $1,058 for 2003, 2002 and 2001, respectively.
12. Minority Interest and Related Long-Term ReceivableAs part of our acquisition of Howe-Baker in 2000, we assumed Howe-Baker’s minority interest and contingent earnout obli-gation associated with a majority-owned subsidiary. In 2003, Howe-Baker exercised its call option to purchase the remain-ing minority interest and also negotiated final settlement of the contingent earnout obligation. Total consideration for the purchase of the minority interest and the earnout obligation was $20,612 cash and satisfaction of a $19,785 receivable due from the minority holder.
13. Commitments and ContingenciesLeases—Certain facilities and equipment, including project-related field equipment, are rented under operating leases thatexpire at various dates through 2021. Rent expense on operating leases totaled $20,242, $17,617 and $15,188 in 2003,2002 and 2001, respectively.
In June 2001, we entered into a sale-leaseback arrangement of our Plainfield, Illinois office with net proceeds of $13,992.The difference between the book value and sale price resulted in a gain, which was deferred and is being amortized over the20-year life of the lease.
Future minimum payments under non-cancelable operating leases having initial terms of one year or more are as follows:
In the normal course of business, we enter into lease agreements with cancellation provisions as well as agreementswith initial terms of less than one year. The costs related to these leases have been reflected in rent expense but have beenappropriately excluded from the future minimum payments presented above. Amounts related to assets under capital leaseswere immaterial for the periods presented.
Antitrust Proceedings—On October 25, 2001, the U.S. Federal Trade Commission (the “FTC” or the “Commission”)announced its decision to file an administrative complaint (the “Complaint”) challenging our February 2001 acquisition of certain assets of the Engineered Construction Division of PDM that we acquired together with certain assets of the WaterDivision of PDM (The Engineered Construction and Water Divisions of PDM are hereafter sometimes referred to as the“PDM Divisions”). The FTC’s Complaint alleged that the acquisition violated Section 7 of the Clayton Antitrust Act andSection 5 of the Federal Trade Commission Act by threatening to substantially lessen competition in four specific markets in which both we and PDM had competed in the United States: liquefied natural gas storage tanks and associated facilitiesconstructed in the United States; liquefied nitrogen, liquefied oxygen and liquefied argon storage tanks constructed in theUnited States; liquefied petroleum gas storage tanks constructed in the United States; and field erected thermal vacuumchambers (used for the testing of satellites) constructed in the United States. The FTC’s Complaint asserted that the consequence of the acquisition will be increased prices in these four markets.
A trial before an FTC Administrative Law Judge was concluded on January 16, 2003. On June 12, 2003, the FTCAdministrative Law Judge issued his ruling. The ruling found that our acquisition of PDM assets threatens to substantiallylessen competition in the four markets identified above in which both CB&I and PDM participated. As a result of this findingby the FTC Administrative Law Judge, we have been ordered to divest within 180 days of a final order all physical assets,intellectual property and any uncompleted construction contracts of the PDM Divisions that we acquired from PDM to a purchaser approved by the FTC that is able to utilize those assets as a viable competitor.
We believe the FTC Administrative Law Judge’s ruling is inconsistent with the law and facts presented at trial. We haveappealed the ruling to the full Federal Trade Commission. In addition, the FTC Staff has appealed the sufficiency of the remedies contained in the ruling to the full Federal Trade Commission. Pending issuance of a final order by the Commission,
CB&I 2003 Annual Report 53
we are subject to an interim order designed to preserve the status quo of the PDM assets, including a requirement that wenotify the FTC 60 days before taking any action to dispose of any PDM assets at our Provo, Utah fabrication facility. OnNovember 12, 2003, oral arguments were held before the Commission, which will issue its decision in due course. Until the FTC order becomes final, we expect the impact on our earnings will be minimal. However, the remedies contained in the order, if implemented, could have an adverse effect on us, including an expense relating to a potential write-down of the net book value of the divested assets. If additional remedies sought by the FTC staff are also implemented by the Full Commission, there may be additional adverse financial effects on us.
In addition, we were served with a subpoena for documents on July 23, 2003, by the Philadelphia office of the U.S.Department of Justice, Antitrust Division. The subpoena seeks documents that are in part related to matters that were the subject of testimony in the FTC administrative law trial, as well as documents relating to our Water Division. We arecooperating fully with the investigation. We cannot assure you that proceedings will not result from this investigation.
Environmental Matters—Our operations are subject to extensive and changing U.S. federal, state and local laws and regulations and laws outside the U.S. establishing health and environmental quality standards, including those governingdischarges and pollutants into the air and water and the management and disposal of hazardous substances and wastes.This exposes us to potential liability for personal injury or property damage caused by any release, spill, exposure or otheraccident involving such substances or wastes.
In connection with the historical operation of our facilities, substances which currently are or might be considered haz-ardous were used or disposed of at some sites that will or may require us to make expenditures for remediation. In addition,we have agreed to indemnify parties to whom we have sold facilities for certain environmental liabilities arising from actsoccurring before the dates those facilities were transferred. We are not aware of any manifestation by a potential claimant ofits awareness of a possible claim or assessment with respect to any such facility.
We believe that we are currently in compliance, in all material respects, with all environmental laws and regulations. Wedo not anticipate that we will incur material capital expenditures for environmental controls or for investigation or remediationof environmental conditions during 2004 or 2005.
Contingent Earnout Obligations—In connection with our acquisition of Howe-Baker in 2000, we assumed two earnoutarrangements which are contingent upon the performance of the underlying acquired entities. One of the arrangementswhich has and will continue to require us to make cash payments to the previous owners expires in July 2004 (of which$3,522 is included in accrued liabilities at December 31, 2003), while the other arrangement was scheduled to expire on orbefore December 31, 2008 (“2008 Earnout”), subject to certain of our call rights and the put rights of the previous owners.On April 30, 2003, we settled the obligations of the 2008 Earnout as described in Note 12.
Other—We are a defendant in a number of lawsuits arising in the normal course of business, including among others, lawsuits wherein plaintiffs allege exposure to asbestos due to work we may have performed at various locations. We havenever been a manufacturer, distributor or supplier of asbestos products, and we have in place appropriate insurance cover-age for the type of work that we have performed. During 2003, we were named as a defendant in additional asbestos-related lawsuits. To date, we have been able to dismiss or settle all such claims without a material impact on our operatingresults or financial position and do not currently believe that the asserted claims will have a material adverse effect on ourfuture results of operations or financial position. As a matter of standard policy, we continually review our litigation accrualand as further information is known on pending cases, increases or decreases, as appropriate, may be recorded in accordance with SFAS No. 5, “Accounting for Contingencies.”
Letters of Credit/Bank Guarantees/Surety BondsOrdinary Course Commitments—In the ordinary course of business, we may obtain surety bonds and letters of credit,which we provide to our customers to secure advance payment, our performance under the contracts or in lieu of retentionbeing withheld on our contracts. In the event of our non-performance under a contract and an advance being made by abank pursuant to a draw on a letter of credit, the advance would become a borrowing under a credit facility and thus ourdirect obligation. Where a surety incurs such a loss, an indemnity agreement between the parties and us may require pay-ment from our excess cash or a borrowing under our revolving credit facilities. When a contract is completed, the contingentobligation terminates and the bonds or letters of credit are returned. At December 31, 2003, we had provided $637,511 of surety bonds and letters of credit to support our contracting activities in the ordinary course of business. This amountfluctuates based on the mix and level of contracting activity.
Insurance—We have elected to retain portions of losses, if any, through the use of deductibles and self-insured retentionsfor our exposures related to third-party liability and workers’ compensation. Liabilities in excess of these amounts are theresponsibilities of an insurance carrier. To the extent we are self-insured for these exposures, reserves (Note 8) have beenprovided based on management’s best estimates with input from our legal and insurance advisors. Changes in assump-tions, as well as changes in actual experience, could cause these estimates to change in the near term. Our managementbelieves that the reasonably possible losses, if any, for these matters, to the extent not otherwise disclosed and net ofrecorded reserves, will not be material to our financial position or results of operations. At December 31, 2003, we had outstanding surety bonds and letters of credit of $17,808 relating to our insurance program.
54
14. Shareholders’ EquityStock Split—On January 22, 2003, we declared a two-for-one stock split effective in the form of a stock dividend paidFebruary 10, 2003 to stockholders of record at the close of business on February 3, 2003. All share numbers and amountshave been adjusted for the stock split for all periods presented.
Stock Held in Trust—During 1999, we established a Trust to hold 1,411,120 unvested restricted stock units (valued at$9.00 per share) for two executive officers. The restricted stock units, which vested in March 2000, entitle the participants toreceive one common share for each stock unit on the earlier of (i) the first business day after termination of employment, or(ii) a change of control. These shares are considered outstanding for basic and diluted EPS computations. The total value ofthe shares initially placed in the Trust was $12,735.
From time to time, we grant restricted shares to key employees under our Long-Term Incentive Plans. The restrictedshares are transferred to the trust and held until the vesting restrictions lapse, at which time the shares are released fromthe Trust and distributed to the employees. During 2001, 272,314 restricted stock units were distributed from the Trust inconnection with the departure of a former executive.
Treasury Stock—Under Dutch law and our Articles of Association, we may hold no more than 10% of our issued sharecapital at any time. In order to allow implementation of proposed repurchases of our share capital authorized by the share-holders which might be in excess of 10% (and up to 30%), we must dispose of or cancel shares which have been repur-chased. From time to time, we request authority from our shareholders at the Annual General Meeting of Shareholders tocancel up to 20% of the current issued share capital in multiple tranches, with no tranche to exceed 10%. We cancelledshares in 2001.
Accumulated Other Comprehensive Income (Loss)—The components of accumulated other comprehensive income(loss) are as follows:
Currency Unrealized Minimum Unrealized Fair Accumulated OtherTranslation Loss on Debt Pension Liability Value of Cash ComprehensiveAdjustment Securities (1) Adjustment Flow Hedges (2) Income (Loss)
Balance at January 1, 2001 $ (9,872) $ – $ – $ – $ (9,872)Change in 2001 [net of tax of
$1,402, $254, $65, and $0] (2,603) (473) (120) – (3,196)Balance at December 31, 2001 (12,475) (473) (120) – (13,068)Change in 2002 [net of tax of
$1,620, ($56), $487 and $0] (3,008) 105 (904) – (3,807)Balance at December 31, 2002 (15,483) (368) (1,024) – (16,875)Change in 2003 [net of tax of
($2,996), ($56), ($140) and ($709)] 5,564 105 259 1,317 7,245 Balance at December 31, 2003 $ (9,919) $(263) $ (765) $1,317 $ (9,630)
(1) The unrealized loss on debt securities resulted from a mark-to-market loss on a cash flow hedge for our $75,000 private placement debt issuance in 2001.
(2) The unrealized fair value of cash flow hedges will be reclassified into earnings upon settlement of the underlying purchase obligations, which areanticipated to be settled within the next 12 months. See Note 10 for additional discussion relative to our financial instruments.
15. Stock PlansEmployee Stock Purchase Plan—During 2001, the shareholders adopted an employee stock purchase plan under whichsale of 1,000,000 shares of our common stock has been authorized. Employees may purchase shares at a discount on aquarterly basis through regular payroll deductions of up to 8% of their compensation. The shares are purchased at 85% ofthe closing price per share on the first trading day following the end of the calendar quarter. As of December 31, 2003,662,661 shares remain available for purchase.
Long-Term Incentive Plans—Under our 1997 and 1999 Long-Term Incentive Plans, as amended (the “Incentive Plans”),we can issue shares in the form of stock options, performance shares or restricted shares. Total compensation expense of$3,962, $756 and $1,125 was recognized for the Incentive Plans in 2003, 2002 and 2001, respectively. Of the 8,363,510shares authorized for grant under the Incentive Plans, 1,699,231 shares remain available for grant at December 31, 2003.
CB&I 2003 Annual Report 55
Stock Options—Stock options are generally granted at the fair market value on the date of grant and expire after 10 years.Options granted to executive officers and other key employees typically vest over a three- to four-year period, while optionsgranted to Supervisory Directors vest over a one-year period. The following table summarizes the changes in stock optionsfor the years ended December 31, 2003, 2002 and 2001:
Weighted AverageStock Options Exercise Price Per Share Exercise Price Per Share
The weighted average fair value of options granted during 2003, 2002 and 2001 was $6.99, $6.20 and $6.58, respec-tively. The number of outstanding fixed stock options exercisable at December 31, 2002 and 2001 was 2,247,546 and939,820, respectively. These options had a weighted average exercise price of $8.23 and $7.84 at December 31, 2002 and2001, respectively.
The following summarizes information about stock options outstanding at December 31, 2003:
Weighted AverageRange of Number Remaining Weighted Average Number Weighted AverageExercise Prices Outstanding Contractual Life Exercise Price Exercisable Exercise Price$ 5.50 – $ 8.34 1,714,950 6.6 $ 8.11 1,639,302 $ 8.12 $ 9.00 – $14.85 1,627,647 7.3 $12.77 618,889 $11.07 $15.00 – $23.13 238,972 8.5 $16.91 67,989 $16.06
3,581,569 7.1 $10.82 2,326,180 $ 9.14
Restricted Shares—Restricted shares generally vest over four years. The following table shows the changes in restrictedshares:
2003 2002 2001Shares subject to restriction at beginning of year 326,018 476,814 600,336 Restricted share grants 44,499 43,840 110,366 Restricted share distributions (129,775) (193,796) (232,128)Restricted share forfeitures – (840) (1,760)Shares subject to restriction at end of year 240,742 326,018 476,814
Performance Shares—Performance shares generally vest over three years, subject to achievement of specific Companyperformance goals. During 2003, 193,513 performance shares were granted with a weighted-average grant-date fair valueof $14.80. No performance shares were granted during 2002 or 2001.
56
16. Income Taxes
2003 2002 2001Sources of Income Before Income Taxes and Minority InterestU.S. $ 45,612 $ 32,896 $ 3,277 Non-U.S. 52,450 39,298 44,628
Total $ 98,062 $ 72,194 $ 47,905
Income Tax ExpenseCurrent income taxes
U.S. (Federal and State) $ (7,927) $ (736) $ – Non-U.S. (10,579) (6,512) (7,438)
(18,506) (7,248) (7,438)Deferred income taxes
U.S. (Federal and State) (1) (7,814) (11,614) (2,392)Non-U.S. (3,393) (1,371) (3,650)
(11,207) (12,985) (6,042)Total income tax expense $(29,713) $(20,233) $(13,480)
(1) During 2003 and 2002, we utilized $3,338 and $6,612 of Deferred Tax Asset, respectively, related to U.S. NOLs.
Reconciliation of Income Taxes at The Netherlands' Statutory Rate and Income Tax (Expense) BenefitTax expense at statutory rate $(33,831) $(24,907) $(16,767)State income taxes (765) (479) (478)Other country statutory tax rate differential 3,906 6,908 4,541 Extraterritorial income exclusion 2,477 – – Other, net (1,500) (1,755) (776)Income tax expense $(29,713) $(20,233) $(13,480)Effective tax rate 30.3% 28.0% 28.1%
Our statutory rate was The Netherlands’ rate of 34.5% in 2003 and 2002, and 35% in 2001.The principal temporary differences included in deferred income taxes reported on the December 31, 2003 and 2002
balance sheets were:
2003 2002Current Deferred TaxesTax benefit of U.S. operating losses and credits $ 5,804 $ 4,336 Contract revenue and costs 9,459 7,487 Employee compensation and benefit plan reserves 3,522 1,541 Voluntary resignation offer 695 918 Other 4,029 3,574 Current deferred tax asset $ 23,509 $ 17,856
Non-Current Deferred TaxesTax benefit of U.S. operating losses and credits $ 2,242 $ 3,481 Tax benefit of non-U.S. operating losses and credits 13,383 12,928 Employee compensation and benefit plan reserves 3,268 6,485 Non-U.S. activity 7,492 10,106 Insurance reserves 6,210 7,167 Non-current deferred tax asset 32,595 40,167 Less: valuation allowance (13,363) (10,497)
As of December 31, 2003, neither income taxes nor withholding taxes have been provided on the undistributed earningsof our U.S. companies and their subsidiaries since it is our intention not to remit these earnings. We intend to permanentlyreinvest the unremitted earnings of our U.S. companies and their subsidiaries in those businesses and, therefore, have notprovided for deferred taxes on such unremitted foreign earnings. We did not record any Netherlands deferred income taxeson undistributed earnings of our other subsidiaries and affiliates at December 31, 2003. If any such undistributed earningswere distributed, the Netherlands participation exemption should become available under current law to significantly reduceor eliminate any resulting Netherlands income tax liability.
CB&I 2003 Annual Report 57
As of December 31, 2003, we had U.S. net operating loss carryforwards (“NOLs”) of approximately $17,563, of which$13,413 is subject to limitation under Internal Revenue Code Section 382. The U.S. NOLs will expire from 2019 to 2021. Asof December 31, 2003, our Central and South America (“CSA”) segment had NOLs of approximately $3,549. We believethat it is more likely than not that the CSA NOLs will not be utilized. Therefore, a full valuation allowance has been placedagainst the CSA NOLs. Likewise, our Europe, Africa, Middle East (“EAME”) and Asia Pacific (“AP”) segments had NOLs ofapproximately $35,918. We believe that it is more likely than not that $35,738 of the EAME and AP NOLs will not be uti-lized. Therefore, a valuation allowance has been placed against the EAME and AP NOLs in the amount of $35,738. As ofDecember 31, 2003, we had a foreign tax credit in the amount of $1,899. A valuation allowance has been placed againstthe foreign tax credit in the amount of $1,497.
17. Segment InformationWe manage our operations by four geographic segments: North America; Europe, Africa, Middle East; Asia Pacific; andCentral and South America. Each geographic segment offers similar services.
The Chief Executive Officer evaluates the performance of these four segments based on revenues and income fromoperations excluding exit costs/special charges. Each segment’s performance reflects the allocation of corporate costs,which were based primarily on revenues. No customer accounted for more than 10% of revenues. Intersegment revenuesare not material.
The following table presents revenues by geographic segment:
2003 2002 2001RevenuesNorth America $ 970,851 $ 801,624 $ 726,629 Europe, Africa, Middle East 329,947 132,853 124,226 Asia Pacific 218,201 95,935 39,917 Central and South America 93,278 118,066 191,052
Total revenues $1,612,277 $1,148,478 $1,081,824
The following table indicates revenues for individual countries in excess of 10% of consolidated revenues during any ofthe three years ended December 31, 2003, based on where we performed the work:
2003 2002 2001United States $901,871 $750,935 $665,217 Australia $175,180 $ 66,962 $ 6,848
The following tables present income from operations, assets and capital expenditures by geographic segment:
2003 2002 2001Income (Loss) From Operations, Excluding Exit Costs/Special ChargesNorth America $ 67,762 $ 52,100 $ 42,161 Europe, Africa, Middle East 17,384 3,603 1,402 Asia Pacific 6,000 2,270 (203)Central and South America 12,195 23,712 20,769
Total income from operations, excluding exit costs/special charges $103,341 $ 81,685 $ 64,129
Income (Loss) From OperationsNorth America $ 67,762 $ 49,413 $ 36,272 Europe, Africa, Middle East 17,384 3,032 (274)Asia Pacific 6,000 1,950 (538)Central and South America 12,195 23,318 18,983
Total income from operations $103,341 $ 77,713 $ 54,443
AssetsNorth America $724,082 $581,046 $501,538 Europe, Africa, Middle East 140,601 85,474 59,228 Asia Pacific 38,192 31,246 25,786 Central and South America 26,611 42,670 61,713
Total assets $929,486 $740,436 $648,265
58
Our revenues earned and assets attributable to operations in The Netherlands were not significant in any of the threeyears ended December 31, 2003. Our long-lived assets are considered to be net property and equipment. Approximately84% of these assets were located in the United States for the year ended December 31, 2003, while the other 16% werestrategically located throughout the world.
2003 2002 2001Capital ExpendituresNorth America $23,991 $20,123 $7,448 Europe, Africa, Middle East 6,926 2,718 779 Asia Pacific 212 1,037 56 Central and South America 157 49 634
Total capital expenditures $31,286 $23,927 $8,917
Although we manage our operations by the four geographic segments, revenues by project type are shown below:
2003 2002 2001RevenuesProcess and Technology $ 582,712 $ 331,200 $ 209,434 Standard Tanks 368,946 430,954 459,022 Low Temperature/Cryogenic Tanks and Systems 285,334 109,312 135,392 Repairs and Turnarounds 167,994 113,633 154,584 Specialty and Other Structures 116,059 101,603 71,995 Pressure Vessels 91,232 61,776 51,397
Total revenues $1,612,277 $1,148,478 $1,081,824
18. Quarterly Operating Results and Common Stock Dividends (Unaudited)Quarterly Operating Results—The following table sets forth our selected unaudited consolidated income statement infor-mation on a quarterly basis for the two years ended December 31, 2003:
Quarter Ended 2003 March 31 June 30 Sept. 30 Dec. 31Revenues $322,309 $389,309 $429,123 $471,536 Gross profit $ 39,661 $ 49,355 $ 51,513 $ 56,033 Net income $ 12,764 $ 16,464 $ 18,028 $ 18,698 Net income per share – basic $ 0.29 $ 0.37 $ 0.39 $ 0.40 Net income per share – diluted $ 0.28 $ 0.35 $ 0.37 $ 0.39 Common dividends per share $ 0.04 $ 0.04 $ 0.04 $ 0.04
Quarter Ended 2002 March 31 June 30 Sept. 30 Dec. 31Revenues $259,272 $284,686 $275,831 $328,689 Gross profit $ 35,090 $ 38,138 $ 38,267 $ 44,056 Net income $ 10,258 $ 12,394 $ 13,174 $ 14,323 Net income per share – basic $ 0.24 $ 0.29 $ 0.30 $ 0.32 Net income per share – diluted $ 0.24 $ 0.28 $ 0.29 $ 0.31 Common dividends per share $ 0.03 $ 0.03 $ 0.03 $ 0.03
Shareholder Information—Our Common Stock is traded on the New York Stock Exchange. As of February 26, 2004, wehad approximately 9,970 shareholders. The following table presents the range of Common Stock prices on the New YorkStock Exchange for the years ended December 31, 2003 and 2002:
Range of Common Stock Prices
Quarter Ended 2003 March 31 June 30 Sept. 30 Dec. 31High $17.65 $25.00 $28.50 $30.00 Low $14.25 $16.16 $22.09 $24.00 Close $16.24 $22.68 $27.16 $28.90
Quarter Ended 2002 March 31 June 30 Sept. 30 Dec. 31High $14.92 $16.50 $15.00 $15.12 Low $12.20 $12.93 $11.57 $11.58 Close $14.86 $14.10 $12.00 $15.10