OUTLINE OF PRESENTATION
• Introduction of NDA
• The Dairy Road Map (2010-2016)
• The Local Milk Market
• 2012 Performance
• Created thru RA 7884 or the National Dairy Development Act
• MANDATE: The Authority shall be the central policy determining & directing body tasked to ensure the accelerated development of the Philippine dairy industry through policy direction & program coordination & implementation.
• VISION: A vibrant local dairy industry providing wholesome, affordable milk to delighted consumers, building a nation of healthier children and wealthier farmers.
MISSION:MISSION:MISSION:MISSION:
• Accelerate dairy herd build-up and milk production;
• Provide excellent technical delivery service packages that enhance dairy business at the farm and enterprise levels;
• Promote consumption of local milk through increased coverage of milk feeding programs that help in reducing malnutrition;
• Mobilize broad support for local milk
In accelerating a sustainable development of the local dairy industry and attain higher level of milk self-sufficiency…
This would require producing a sizeable dairy animal base herd thru Public-Private Partnerships (PPPs) for the infusion of dairy breeds and upgrading and propagation of local dairy animals;
COWS
CARABAOS
GOATS
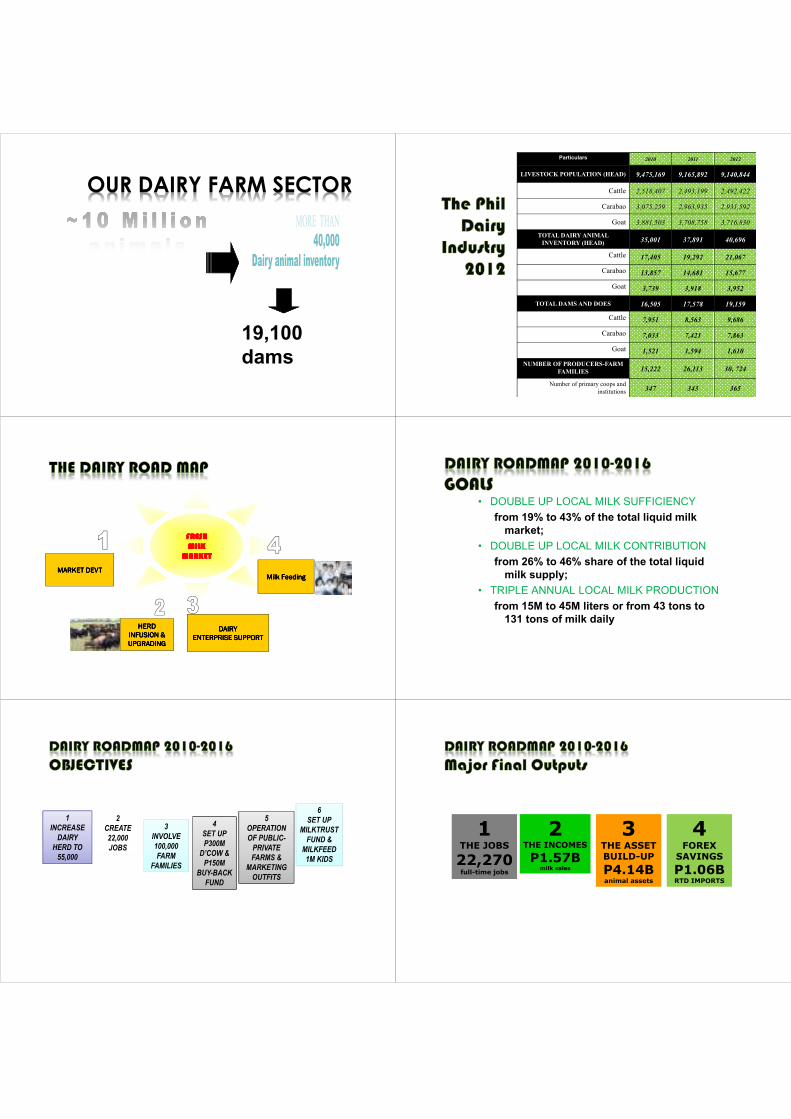
OUR DAIRY FARM SECTOR
19,100 dams
Particulars 2010 2011 2012
LIVESTOCK POPULATION (HEAD) 9,475,169 9,165,892 9,140,844
Cattle 2,518,407 2,493,199 2,492,422
Carabao 3,075,259 2,963,935 2,931,592
Goat 3,881,503 3,708,758 3,716,830
TOTAL DAIRY ANIMAL
INVENTORY (HEAD) 35,001 37,891 40,696
Cattle 17,405 19,292 21,067
Carabao 13,857 14,681 15,677
Goat 3,739 3,918 3,952
TOTAL DAMS AND DOES 16,505 17,578 19,159
Cattle 7,951 8,563 9,686
Carabao 7,033 7,421 7,863
Goat 1,521 1,594 1,610
NUMBER OF PRODUCERS-FARM
FAMILIES 15,222 26,113 30, 724
Number of primary coops and
institutions 347 343 365
FRESHFRESHFRESHFRESH
MILKMILKMILKMILK
MARKETMARKETMARKETMARKET
HERD HERD HERD HERD
INFUSION & INFUSION & INFUSION & INFUSION &
UPGRADINGUPGRADINGUPGRADINGUPGRADING
MARKET DEVTMARKET DEVTMARKET DEVTMARKET DEVT Milk FeedingMilk FeedingMilk FeedingMilk Feeding
DAIRYDAIRYDAIRYDAIRY
ENTERPRISE SUPPORTENTERPRISE SUPPORTENTERPRISE SUPPORTENTERPRISE SUPPORT
• DOUBLE UP LOCAL MILK SUFFICIENCY
from 19% to 43% of the total liquid milk market;
• DOUBLE UP LOCAL MILK CONTRIBUTION
from 26% to 46% share of the total liquid milk supply;
• TRIPLE ANNUAL LOCAL MILK PRODUCTION
from 15M to 45M liters or from 43 tons to 131 tons of milk daily
2
CREATE
22,000
JOBS
1
INCREASE
DAIRY
HERD TO
55,000
3
INVOLVE
100,000
FARM
FAMILIES
4
SET UP
P300M
D’COW &
P150M
BUY-BACK
FUND
5
OPERATION
OF PUBLIC-
PRIVATE
FARMS &
MARKETING
OUTFITS
6
SET UP
MILKTRUST
FUND &
MILKFEED
1M KIDS
1 THE JOBS
22,270
full-time jobs
2 THE INCOMES
P1.57B milk sales
3 THE ASSET BUILD-UP
P4.14B
animal assets
4 FOREX
SAVINGS
P1.06B
RTD IMPORTS
Brgy 2
Brgy 1
Brgy 4
Brgy 3
South LuzonSouth LuzonSouth LuzonSouth Luzon CaviteCaviteCaviteCavite
LagunaLagunaLagunaLaguna
BatangasBatangasBatangasBatangas
QuezonQuezonQuezonQuezon
PalawanPalawanPalawanPalawan
AlbayAlbayAlbayAlbay
SorsogonSorsogonSorsogonSorsogon
Camarines NorteCamarines NorteCamarines NorteCamarines Norte
Camarines SurCamarines SurCamarines SurCamarines Sur
MasbateMasbateMasbateMasbate
Oriental MindoroOriental MindoroOriental MindoroOriental Mindoro
RizalRizalRizalRizal
MindanaoMindanaoMindanaoMindanao Misamis OrientalMisamis OrientalMisamis OrientalMisamis Oriental
Misamis OccidentalMisamis OccidentalMisamis OccidentalMisamis Occidental
BukidnonBukidnonBukidnonBukidnon
Davao del NorteDavao del NorteDavao del NorteDavao del Norte
Davao del SurDavao del SurDavao del SurDavao del Sur
Lanao del NorteLanao del NorteLanao del NorteLanao del Norte
North CotabatoNorth CotabatoNorth CotabatoNorth Cotabato
SaranganiSaranganiSaranganiSarangani
Zamboanga del NorteZamboanga del NorteZamboanga del NorteZamboanga del Norte
Zamboanga del SurZamboanga del SurZamboanga del SurZamboanga del Sur
North LuzonNorth LuzonNorth LuzonNorth Luzon BulacanBulacanBulacanBulacan
PangasinanPangasinanPangasinanPangasinan
Nueva EcijaNueva EcijaNueva EcijaNueva Ecija
ZambalesZambalesZambalesZambales
IsabelaIsabelaIsabelaIsabela
BenguetBenguetBenguetBenguet
CagayanCagayanCagayanCagayan
BataanBataanBataanBataan
AuroraAuroraAuroraAurora
TarlacTarlacTarlacTarlac
Visayas Visayas Visayas Visayas CebuCebuCebuCebu
BoholBoholBoholBohol
SiquijorSiquijorSiquijorSiquijor
Negros OrientalNegros OrientalNegros OrientalNegros Oriental
CapizCapizCapizCapiz
AntiqueAntiqueAntiqueAntique
IloiloIloiloIloiloIloilo
Negros OccidentalNegros OccidentalNegros OccidentalNegros Occidental
LeyteLeyteLeyteLeyte
Southern Leyte Southern Leyte Southern Leyte Southern Leyte
BiliranBiliranBiliranBiliran
AklanAklanAklanAklan
There are now
43 dairy multiplier farms operating nationwide with more
than 3,900 dairy
animals on the ground, which are
expected to produce at
least a
boatload next year.
DISTRIBUTION MAP
NDA DAIRY MULTIPLIER FARMS
DISTRIBUTION MAP
ANIMAL DISTRIBUTION PER DAIRY
MULTIPLIER FARM
NORTH LUZON 1,934 Farmers
17 Coops
EASTERN VISAYAS
366 Farmers 6 Coops
SOUTHERN SOUTHERN MINDANAO 429 Farmers
19 Coops
10,143 Farmers 146 Coops
THE LOCAL DAIRY FARMERS SMALLHOLDERS DAIRY OPERATIONS
SOUTH LUZON 563 Farmers
15 Coops
BICOL 948 Farmers
11 Coops
WESTERN VISAYAS
3,458 Farmers 29 Coops
CENTRAL VISAYAS
2,020 Farmers 33 Coops
NORTHERN MINDANAO 425 Farmers
16 Coops
DAIRY ANIMAL DISTRIBUTION SMALLHOLDERS DAIRY PROJECTS
Philippine Dairy Operation
Northern Luzon
Dairy Area
7,956 heads
5,932 heads
9,520 heads
28,014 heads
28,014 heads
4,606 heads
Visayas
Dairy Area
Mindanao
Dairy Area
Southern Tagalog
Dairy Area
131 Importers
Traders Processors
0
500
1000
1500
2000
2500
MIL
LIO
N U
S$
Wheat and Meslin 424.44 724.37 816.45 547.18 955.28 730.68
Milk and Cream Products 588.72 618.43 385.68 592.27 688.64 501.90
Soya bean oil cake/meal 392.02 506.58 422.16 402.35 543.76 459.10
Rice 657.14 1956.78 1,039.64 1652.52 383.20 363.05
Fertilizer, manufactured 289.63 402.00 168.88 270.46 320.24 287.02
2007 2008 2009 2010 20112012-as of
Sept
Skimmilk
Powder
42%
Whey Powder
16%
Wholemilk
Powder
14%
Buttermilk/Butter
milkpowder
9%
Butter/Butterfat/
Dairy Spreads
8%
Cheese
4%
Liquid (RTD)
Milk
2% Condensed Mik
1% Cream
1%
MILK IMPORTS (in LME - '000 MT)
Average (2008-2012)
Skimmilk Powder 782.27
Whey Powder 301.55
Wholemilk Powder 269.68
Buttermilk/Buttermilk powder 164.04
Butter/Butterfat/DairySpreads 144.06
Cheese 65.62
Others 62.48
Liquid (RTD) Milk 39.77
Curd 13.72
Condensed milk 12.93
Cream 10.46
MILK IMPORTS 1,806.66
13.81 14.41 15.86 16.45 18.45
0
10
20
30
40
50
60
70
Mil
lio
n L
ite
rs
TOTAL 50.44 53.41 64.34 62.25 47.41
LOCAL 13.81 14.41 15.86 16.45 18.45
RTD IMPORTS 36.63 39.00 48.48 45.80 28.96
2008 2009 2010 2011 2012
Our milk production is
now at 18.45 million
liters, higher by 33% of our milk output 5 years ago.
- 5,000 10,000 15,000 20,000 25,000
NCR
CAR
I
II
III
IV
V
VI
VII
VIII
IX
X
XI
XII
XIII
ARMM
Million Pesos
RP DAIRY EXPENDITURES 2009
0 1/2 1 1 1/2 2 2 1/2 3
NCR
CAR
I
II
III
IV
V
VI
VII
VIII
IX
X
XI
XII
XIII
ARMM
Filipinos can now afford to drink ¾ glass of milk
per day, triple than the milk intake 8 years ago.
RP AVERAGE MILK INTAKE 2009
9.0
15.8
20.9
31.2
39.4
47.3
54.6
70.9
R² = 0.9934
0
10
20
30
40
50
60
70
80
90
1988 1991 1994 1997 2000 2003 2006 2009
BIL
LIO
NS
* - based on latest survey released 2/11
IMPORTS
LOCAL
IMPORTS
LOCAL
• Based on the year-end report of the Bureau of
Agricultural Statistics (BAS), among the livestock
sector, dairy posted a double digit increase
of 12.16% in production and 12.23% in
value.
Livestock
Sector
Volume- ‘000 MT Value – million Pesos
2011 2012 % Change 2011 2012 % Change
Carabao 147.52 142.73 -3.25% 10,080.40 10,013.94 -0.66%
Cattle 256.26 253.98 -0.89% 21,461.78 21,547.66 0.40%
Hog 1,940.35 1,973.62 1.71% 172,574.73 174,507.48 1.12%
Goat 78.20 75.66 -3.25% 7,710.52 7,689.33 -0.27%
Dairy 16.45 18.45 12.16% 498.93 559.96 12.23%
Performance of Philippine Agriculture 2012
Source: Bureau of Agricultural Statistics (BAS) as gathered and processed by NDA-PMSD 1/21/13
• Dairy production of 18.45MLiters (or 51 tons/day) in 2012 was the highest level attained
in the last five years.
Production 2008 2009 2010 2011 2012
Annual (MLiters) 13.81 14.41 15.86 16.45 18.45
Daily (Tons) 37.84 39.48 43.45 45.07 50.55
% Change 3% 4% 10% 4% 12%
FARMGATE PRICE (Peso/Liter)
13.55 13.85 14.00 14.80 15.15
16.00 17.00
18.60 19.00
22.00 22.48 22.60 23.04
0.00
5.00
10.00
15.00
20.00
25.00
2000 2001 2002 2003 2004 2005 2006 2007 2008 2009 2010 2011 2012
5,868
7,818
9,863
11,58012,874
16,77117,933
20,438
23,610 24,211
26,014
28,014
0
5,000
10,000
15,000
20,000
25,000
30,000
2001 2002 2003 2004 2005 2006 2007 2008 2009 2010 2011 2012
NDA SCORECARD 2012
Indicators 2012 2011 % Change
Milk production (Million liters) 13.50* 11.56 17%
Milk production/day (Tons) 36.89* 31.67 17%
Total Number of dairy animals 28,014 26,014 7%
Number of milking animals 6,862 5,861 16%
*This constitutes more than 70% of the national production.
AREA #DMFs Current Dairy
Animals
Animals for
Harvest
NORTH LUZON 6 527 166
SOUTH LUZON 6 642 254
VISAYAS 11 1,793 426
MINDANAO 20 1,005 234
TOTAL 43 3,967 1,080