30
Outlook for China’s Agriculture & Implications for Australia ABARES Outlook 2015 Dr. Geoff Raby

Outlook for China’s Agriculture & Implications for Australia ABARES Outlook 2015
Dr. Geoff Raby

CHINA’S ECONOMIC GROWTH
Tremendous growth since the “Opening-Up” policy in 1978 GDP grew $150 bn in 1978 to $10,355 bn in 2014 Over 300 million people lifted out of poverty SO
UR
CE: W
OR
LD B
AN
K/H
BR
CHINA GDP GROWTH

ECONOMY RUNNING OUT OF PUFF
China’s growth rate has slowed in recent years In 2014, China had the weakest economic expansion in 24 years The shift from rapid export and manufacturing-led growth, to slower
consumption-based growth is dubbed “The New Normal”
SOU
RC
E: CN
BS/trad
ingeco
no
mics
GDP ANNUAL GROWTH RATE

FUTURE GROWTH
Economic growth expected around 6.3-7.5% in the coming decade By 2025, GDP is expected to have doubled to around $25,500 bn Before 2030, China is expected to have become the world’s largest economy by
almost any measure
SOU
RC
E: The e
con
om
ist
GDP, $trn

FACTORS DRIVING FOOD DEMAND Rising incomes - growing middle class Rapid urbanization Changing lifestyles and preferences
o Younger generation receiving new cultural influences o More fast food o More eating out Better organization of food productions & improved markets
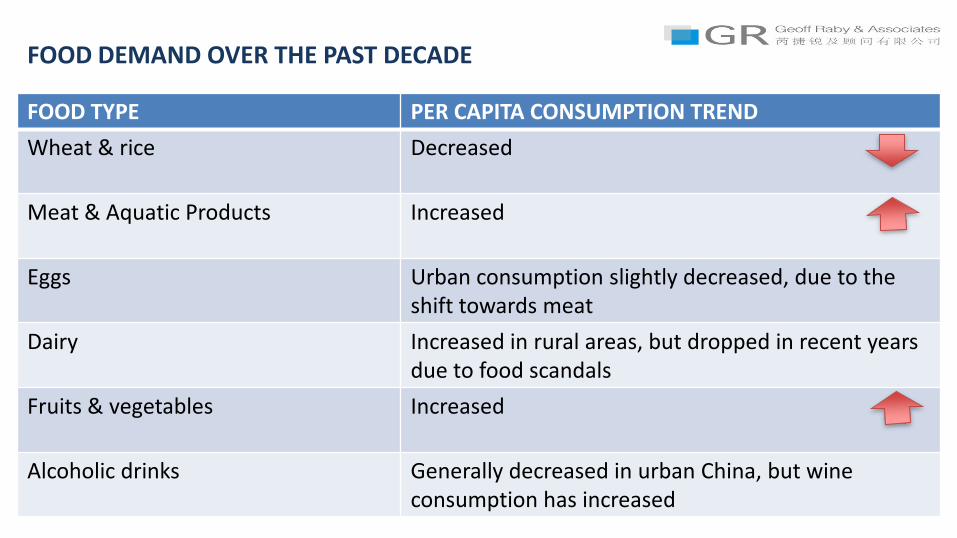
FOOD DEMAND OVER THE PAST DECADE
FOOD TYPE PER CAPITA CONSUMPTION TREND
Wheat & rice Decreased
Meat & Aquatic Products Increased
Eggs Urban consumption slightly decreased, due to the shift towards meat
Dairy Increased in rural areas, but dropped in recent years due to food scandals
Fruits & vegetables Increased
Alcoholic drinks Generally decreased in urban China, but wine consumption has increased

PRODUCTION & DEMAND OF GRAINS
Consumption of wheat and rice grew rapidly with rising incomes after 1978, then began to level off as demand shifted to higher value-added foods. WHEAT • Production reached a peak in 1997 at 123.3 mt, dropped to 86.5 mt in 2003,
then increased from 2004 to 115.2 mt in 2010. • Demand started to decline in 1993 and stabilized around 2005 RICE • Production of rice increased from 96 mt in 1978 to the peak of 141 mt in 1997.
Since 2004, it has increased steadily to 137 mt in 2010. • Since 2004, per capita rice consumption has stabilized around 90-92 kg

PRODUCTION & DEMAND OF MILK & MEAT
MILK • In the 1970s, per capita consumption of milk was extremely low (about 3.5 kg per
person annually). By 2007, consumption had almost increased ten-fold (to around 30 kg)
• Milk production has grown in parallel over the past decade (9.19 mt in 2000 to 37.82 mt in 2008)
MEAT • Production of beef, poultry and pork is expected to increase by 30% over the next
decade • Yet, production is unlikely to keep pace with DEMAND, even after consolidation of
small farms into large-scale production • Risk of swineflu epidemics and avian flu are constant threats

MEAT DEMAND
Until the late 20th century, the Chinese
population obtained over 90% of its calories from carbohydrates.
In 2012, China’s meat consumption
reached 71 million tonnes - more than double that of the US.
By 2014, China accounted for over half
the world’s production and consumption of pork.
Until 2024, pork consumption is expected to rise 1.5% annually, and
poultry 2.4% annually.
MEAT CONSUMPTION CHINA & US (million tons)
SOU
RC
E: USD
A/Eartp
olicy

Demand of protein is highly income elastic, especially when starting from a low base level. China’s consumption of pork, poultry and beef is expected to
continue climbing in the coming decade
SOU
RC
E: USD
A
CHINA MEAT CONSUMPTION (kg/person)

FOOD SUPPLY CONSTRAINTS
Urbanization •Over 50% of China’s population now lives in cities •The process of urbanization reduces arable land, although it may also increase productivity Water scarcity •In 2009, China had 2,079 m3 water per person, while global average was 6,225 m3 per person •Scarcity is caused by agriculture, urbanization, industry, mining •Drought affects around 15.3 million hectares of farmland every year, 13% of the total agricultural area. Likely to increase further with pollution and climate change Transportation bottlenecks

LAND SCARCITY
• Limited and degrading agricultural land: In between 1996 and 2006, China lost 9 million hectares of land, or 6% of its farm land
• In between 2003 and 2050, remaining farmland is expected to decline from 135
million hectares to 129 million hectares
• In 2010, out of total area sown to crops (161 m ha.), 96% per cent was used for food production. Room to reduce land used for non-food crop production to produce more food is thus minimal
• About a third of grain produced is used to feed livestock. Land used for livestock
contributes to deforestation, pollution, high water consumption and high carbon emissions

GOVERNMENT FOOD POLICY
Policy Aim: Maintain a high level of food self-sufficiency 2014: China's State Council Annual policy report (“Document No. 1.”) calls for 100% self-sufficiency in edible grain 12th FYP: Supports high-yield farming techniques, food processing industries and investments into agricultural sciences and planning Third Plenum Policies: Land consolidation, reforms of land-use rights and registrations Policy Incentives •Abolition of tax on peasants in 2006 •In 2013, grain and seed subsidies to farmers were increased •In 2013, minimum support prices for wheat and rice were raised

China is becoming a relative high-cost agricultural producer with rising subsidies •Costs of production are driven up by scarcity of farmland and water, rising incomes and energy prices. Yields can not easily be increased, as productivity is already high •International price levels of food increasingly affect China’s food prices (e.g. livestock feed) •Producer prices are increasing faster than subsidies
CHINA GRAIN PRODUCTION COSTS SOU
RC
E: USD
A
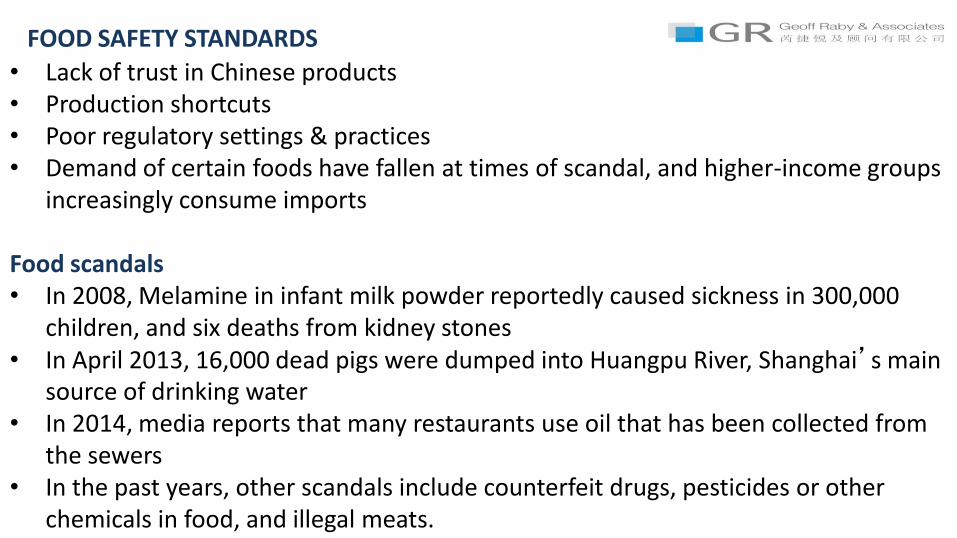
• Lack of trust in Chinese products • Production shortcuts • Poor regulatory settings & practices • Demand of certain foods have fallen at times of scandal, and higher-income groups
increasingly consume imports Food scandals • In 2008, Melamine in infant milk powder reportedly caused sickness in 300,000
children, and six deaths from kidney stones • In April 2013, 16,000 dead pigs were dumped into Huangpu River, Shanghai’s main
source of drinking water • In 2014, media reports that many restaurants use oil that has been collected from
the sewers • In the past years, other scandals include counterfeit drugs, pesticides or other
chemicals in food, and illegal meats.
FOOD SAFETY STANDARDS

CHINA FOOD IMPORT OVERVIEW
• China has been a net agricultural importer since 2003
• China was a net exporter of grain until 2007. In 2014, China became the world’s second largest wheat importer.
• In 2013, China overtook Nigeria as the world’s number one rice importer, buying 3.4 million tons of rice from abroad.
• Imports of soybeans grew from a value of $75 million in 1995 to $38 billion in 2013.
• China is expected to make up 40% of increase in global corn trade until 2024.

Imports of all forms of grain have increased over the past decade:
CHINA NET GRAIN IMPORTS
SOU
RC
E: U
SDA

SOYBEANS
Consumption increased by around 400% over the past 3 decades, and production has not kept pace with demand.
China’s soybean imports are predicted to make up over 70% of global soybean imports by 2024.
SOU
RC
E: USD
A
CHINA SOYBEAN IMPORTS

FUTURE IMPORTS OF GRAINS
WHEAT • Greater yields based on larger space sown and higher productivity
(much above world average). • Demand is expected to remain constant, so China is likely to achieve
self-sufficiency by 2020.
RICE • Based on current consumption and production levels, China will
have sufficient rice from domestic sources, possibly with a small margin for export, by 2020.

FUTURE IMPORTS SUGAR
• Imports are increasing rapidly. • From 2005 to 2010, average annual imports grew from 1.25 mt to 1.78
mt. • By 2020, sugar imports are likely to reach around 3 mt

Imports of meat are predicted to grow rapidly in the coming decade. Pork imports are to increase from an annual 750,000 mmt in 2014 to an annual 1.2
million mmt in 2024, and beef to an annual 750,000 mmt by 2024.
CHINA AGRICULTURAL IMPORT FORECAST
SOU
RC
E: A
BA
RES 2
01
4

In spite of increased meat imports, they are only estimated to make up 3% of China’s total consumption by 2024
SOU
RC
E: USD
A
CHINA MEAT IMPORTS

CHINA AGRICULTURAL SECTOR
• China is opening up its agricultural market to trade & investment. • Many agricultural tariffs were reduced or eliminated when China joined the WTO in
2001. • NDRC’s newly updated investment guide approves of investments into agricultural
machinery and related services. • However, preferential treatment and state funding for SOEs remain, if considered
“strategic” or “pillar” sector.
Major SOEs: COFCO, Bright Food, Tsingtao Brewery, Mengniu Dairy, Yili Group
COFCO was formed from previous state food companies in 1952, and is China’s biggest food company with around 60,000 employees. COFCO controls around 90% of China’s
wheat imports. With controlling stakes of Nidera Holdings BV and Noble Group Ltd, it has grain production in Latin America, South Africa and Europe.

LARGE PRIVATE FIRMS
New Hope Group One of the largest suppliers of meat eggs and dairy in China, with over 400 subsidiaries and 80,000 employees. Has set up an investment fund of $500 million to be placed in agriculture and food processing in Australia. Shuanghui International Meat processing company and China’s largest pork producer. It employs over 60,000 people and Smithfields Food in 2012. Hangzhou Wahaha Group A private group of companies, the largest beverage producer in China with 150 subsidiaries and 60 manufacturing bases.

IMPLICATIONS FOR AUS AGRICULTURE
• In 2009, China surpassed Japan and became Australia’s largest export market. • Between 2001-2010, Australia’s agricultural exports to China increased by over
60% to $4.6 billion. • Trade and investment benefits from geographic proximity, market
complementarities, and the recently signed FTA. Big opportunities for suppliers: • Meat and dairy • Wheat and flour • Sugar mills • Fruit and vegetables • Wine • Counter-seasonal horticulturalists • Organic food

• Chinese firms spent 12.3 billion on international takeovers and investments into food, drink and agriculture in 2013
• Chinese companies invested over USD $50 billion into Australia in between 2006-2013
• China imported dairy products worth $594 million from Australia in between 2013-2014
CHINESE INVESTMENTS INTO AUSTRALIAN AGRICULTURE
SOU
RC
E: Ch
ine
se A
gricultu
ral Exp
ortin
g Market G
uid
e,
AB
AR
ES 20
12
AUS AGRICULTURAL TRADE WITH CHINA

However, • In 2013, agriculture accounted for only 3% of Chinese investments into
Australia
• Since 2006, only ten significant investments into Australian agribusiness have been registered by Chinese investors, worth around AUS $1 billion.
• Chinese companies are mostly interested in large scale investments, and most large companies in Australia are either already foreign owned or not easily acquired.

CHINESE INVESTMENTS INTO AUSTRALIAN AGRICULTURE
• The largest Chinese investments into Australia remain in the mining/energy sector
• The largest Chinese investments into agriculture have been directed towards New South Wales and Queensland
CHINA ODI BY STATE
CHINA ODI BY INDUSTRY
SOU
RC
E: KP
MG
/Un
iversity of
Sydn
ey
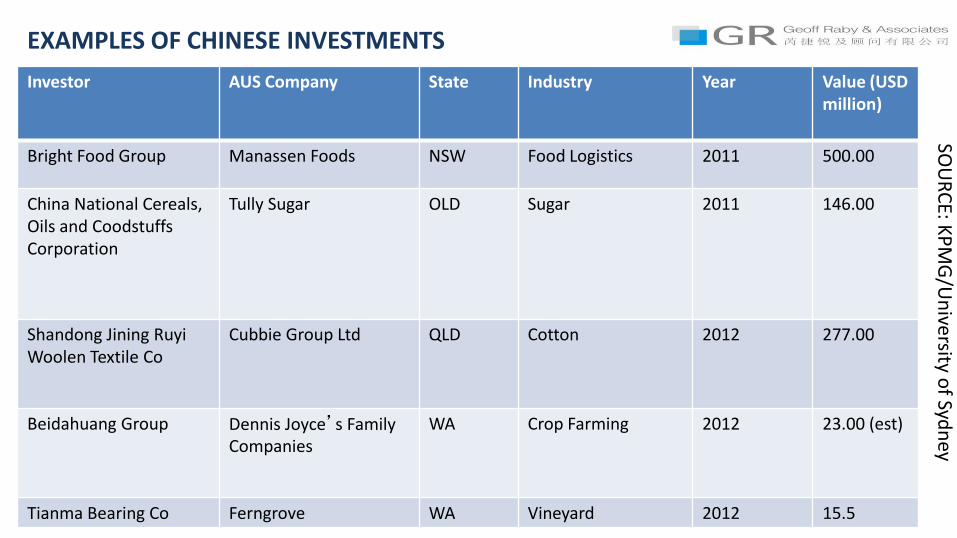
EXAMPLES OF CHINESE INVESTMENTS SO
UR
CE: K
PM
G/U
niversity o
f Sydn
ey
Investor AUS Company State Industry Year Value (USD million)
Bright Food Group Manassen Foods NSW Food Logistics 2011 500.00
China National Cereals, Oils and Coodstuffs Corporation
Tully Sugar OLD Sugar 2011 146.00
Shandong Jining Ruyi Woolen Textile Co
Cubbie Group Ltd QLD Cotton 2012 277.00
Beidahuang Group Dennis Joyce’s Family Companies
WA Crop Farming 2012 23.00 (est)
Tianma Bearing Co Ferngrove WA Vineyard 2012 15.5

THANK YOU


