23
News Release Outlook for FY16–17 corporate earnings Quarterly Update 2 June 2016 Equity Research Dept Nomura Securities Co Ltd, Tokyo

News Release
Outlook for FY16–17 corporate earnings
Quarterly Update
2 June 2016
Equity Research Dept
Nomura Securities Co Ltd, Tokyo
Nomura | JPN Outlook for FY16–17 corporate earnings June 2, 2016
2
Contents
Summary and major assumptions ........................................................ 3
Contributions to recurring profit growth by sector ................................. 5
Revisions to recurring profit estimates (versus old estimates) ............. 7
Breakdown of factors affecting ROE .................................................... 9
Revision index for the Russell/Nomura Large Cap Index ................... 10
Reference
Russell/Nomura Large Cap Index: earnings indicators ...................... 11
Recurring profits by sector ................................................................. 15
Percentage change in quarterly sales and profits .............................. 16
Valuation indicators ........................................................................... 17
What are the Russell/Nomura Japan Equity Indexes? ....................... 18
Nomura | JPN Outlook for FY16–17 corporate earnings June 2, 2016
3
Summary and major assumptions
Overview of FY15 corporate earnings
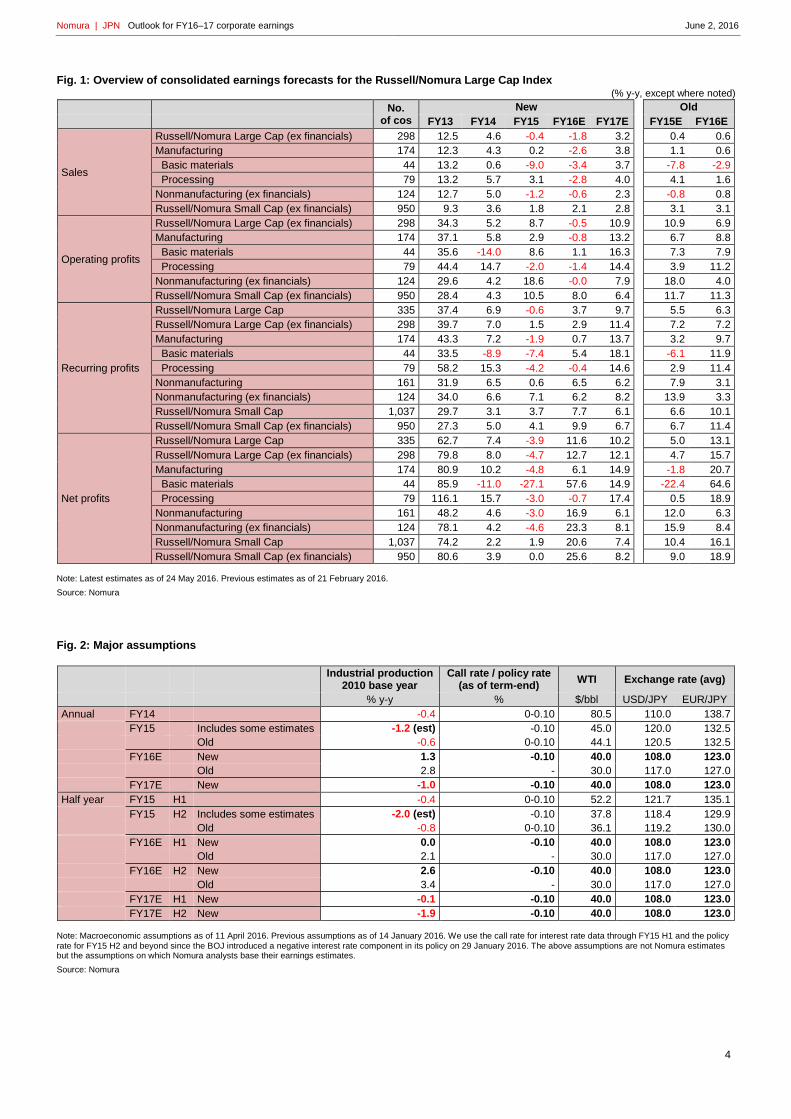
In this report, we collate and analyze earnings forecast data issued by our analysts. In FY15, sales at companies in the
Russell/Nomura Large Cap Index (ex financials) fell 0.4% y-y, while recurring profits rose 1.5%. Compared with our previous
estimates issued in March 2016 (based on data collated on 21 February 2016), these growth rates are 0.8ppt lower for sales
and 5.7ppt lower for recurring profits. The absolute value of FY15 recurring profits undershot our previous estimate by ¥1.9trn, a
large undershoot but roughly the same as the downward revision made at the time of our previous estimate. Over full FY15,
USD/JPY was 120.0 and EUR/JPY was 132.5, versus our previous assumptions of 120.5 and 132.5 respectively, and the WTI
price was $45.0/bbl, versus our previous assumption of $44.1/bbl.
In FY15 Q4, sales at companies in the Russell/Nomura Large Cap Index (ex financials) fell 5.2% y-y as recurring profits
decreased 26.5%. In FY15 Q1, the most recent peak, recurring profits rose 28.2%. Since then, within the space of only three
quarters, y-y growth in recurring profits has dropped sharply, by as much as 54.7ppt. FY14 Q4 earnings were weak, partly
reflecting settlement-related payouts at some pharmaceutical companies and resource-related losses, but earnings were much
weaker in FY15 Q4. After-tax profits fell 50.5% in Q4 and accounted for a mere 8.7% of full-year after-tax profits.
The rate of decline in sales also accelerated further in FY15 Q4. The impact of declines in corporate goods prices, which partly
reflected the fall in crude oil prices, eased slightly, but the yen switched from a weakening trend to a strengthening trend versus
the US dollar. Nevertheless, the substantial decline in profits was to a large extent due to impairment losses at trading
companies and if we exclude financials and trading companies the y-y decline in recurring profits in FY15 Q4 was only 11.1%.
The revision index for FY15 forecasts is -10.1%. FY15 earnings came in lower than our forecasts for more than half of all
companies, but not for an overwhelming majority. We think this indicates that a relatively small number of companies dragged
down the overall figures in FY15 Q4.
Overview of the FY16 corporate earnings outlook
For FY16, our analysts are expecting sales to fall 1.8% y-y but recurring profits to rise 2.9% at Russell/Nomura Large Cap Index
(ex financials) companies. These latest forecasts represent downward revisions of 2.4ppt for sales growth and 4.3ppt for
recurring profit growth versus our previous forecasts. For the absolute value of recurring profits, the downward revision is
¥2.3trn, or 6.4%. Our forex assumptions for FY16 are USD/JPY of 108.0 (previously 117.0) and EUR/JPY of 123.0 (previously
127.0). Our WTI assumption is $40.0/bbl ($30.0/bbl). Assuming that the yen will be ¥12 stronger versus the US dollar in FY16
than in FY15, we expect sales to fall for the second consecutive fiscal year. Nevertheless, we still expect recurring profits to rise
y-y in FY16 because we think the increase in profits at domestic demand-related companies and the rebound in profits at
companies that saw their earnings fall sharply in FY15 will exceed the fall in profits at external demand-related companies.
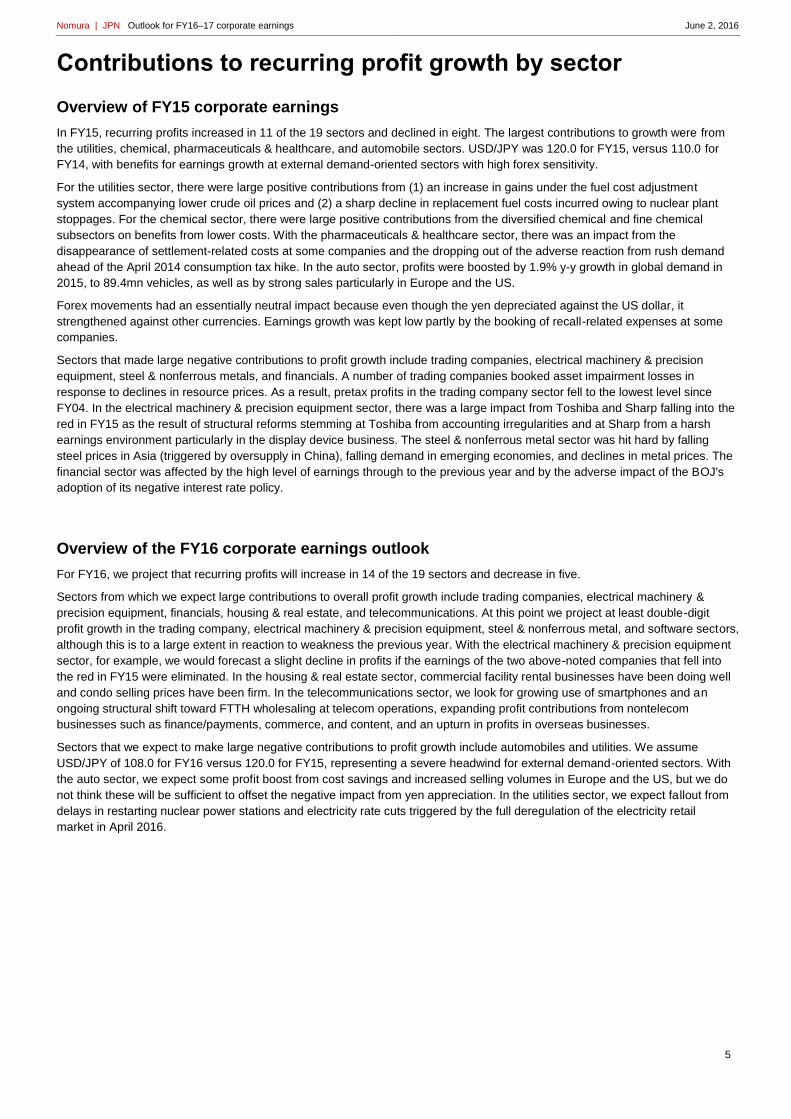
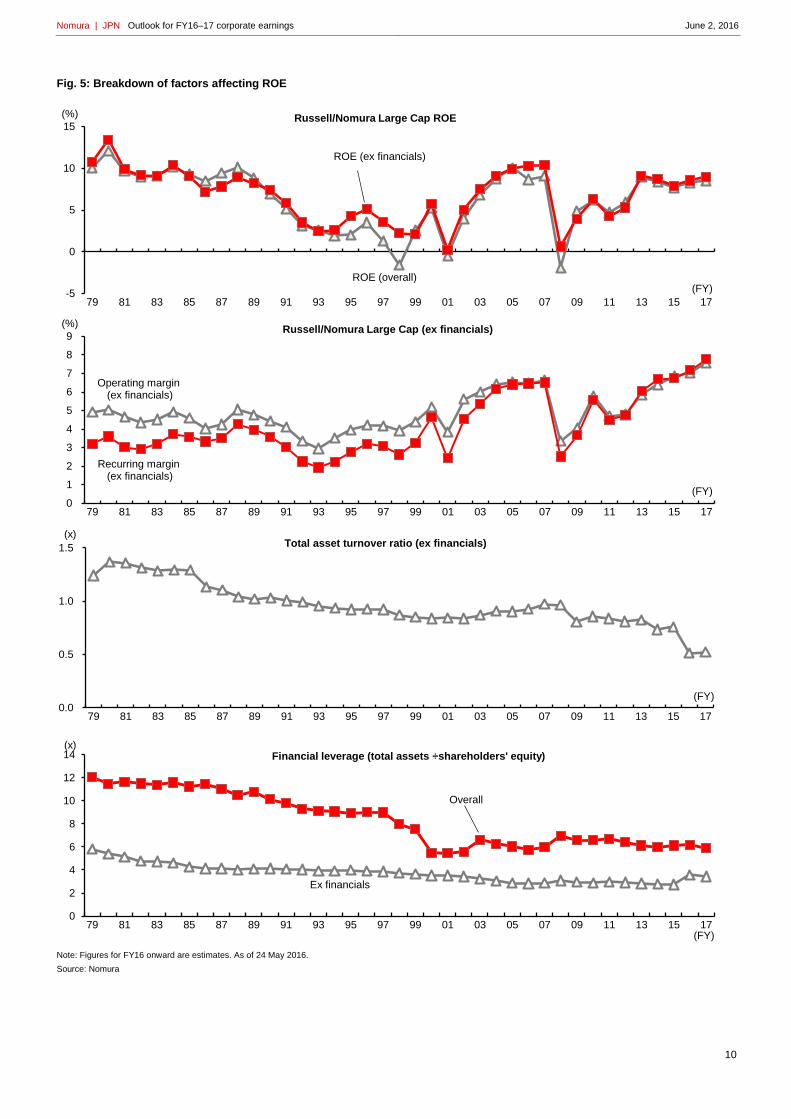
The average ROE for Russell/Nomura Large Cap Index stocks was 8.4% in FY14 and fell to 7.7% in FY15 (versus our previous
forecast of 8.2%) and we now forecast 8.3% in FY16 (previous estimate: 8.9%). FY15 after-tax profits fell 3.9% y-y, but
shareholders' equity fell 2.1%, thus limiting the deterioration in ROE, but even so ROE at Japanese companies as a whole came
in below the 8% level regarded as the "bare minimum." This is bound to be seen as a negative, but ROE of 7.7% is still high
compared with the historical average level of around 5%. In the current phase of falling earnings, we expect attention to focus
on whether ROE can recover to at least the "bare minimum" of 8%. If we break ROE down into profit margins, asset turnover,
and financial leverage, our current forecasts indicate a relatively large increase in financial leverage in FY16, but this is due to
"extraordinary factors."
Nomura | JPN Outlook for FY16–17 corporate earnings June 2, 2016
4
Fig. 1: Overview of consolidated earnings forecasts for the Russell/Nomura Large Cap Index
(% y-y, except where noted)
No. of cos
New
Old
FY13 FY14 FY15 FY16E FY17E
FY15E FY16E
Sales
Russell/Nomura Large Cap (ex financials) 298 12.5 4.6 -0.4 -1.8 3.2 0.4 0.6
Manufacturing 174 12.3 4.3 0.2 -2.6 3.8 1.1 0.6
Basic materials 44 13.2 0.6 -9.0 -3.4 3.7 -7.8 -2.9
Processing 79 13.2 5.7 3.1 -2.8 4.0 4.1 1.6
Nonmanufacturing (ex financials) 124 12.7 5.0 -1.2 -0.6 2.3 -0.8 0.8
Russell/Nomura Small Cap (ex financials) 950 9.3 3.6 1.8 2.1 2.8 3.1 3.1
Operating profits
Russell/Nomura Large Cap (ex financials) 298 34.3 5.2 8.7 -0.5 10.9 10.9 6.9
Manufacturing 174 37.1 5.8 2.9 -0.8 13.2 6.7 8.8
Basic materials 44 35.6 -14.0 8.6 1.1 16.3 7.3 7.9
Processing 79 44.4 14.7 -2.0 -1.4 14.4 3.9 11.2
Nonmanufacturing (ex financials) 124 29.6 4.2 18.6 -0.0 7.9 18.0 4.0
Russell/Nomura Small Cap (ex financials) 950 28.4 4.3 10.5 8.0 6.4 11.7 11.3
Recurring profits
Russell/Nomura Large Cap 335 37.4 6.9 -0.6 3.7 9.7 5.5 6.3
Russell/Nomura Large Cap (ex financials) 298 39.7 7.0 1.5 2.9 11.4 7.2 7.2
Manufacturing 174 43.3 7.2 -1.9 0.7 13.7 3.2 9.7
Basic materials 44 33.5 -8.9 -7.4 5.4 18.1 -6.1 11.9
Processing 79 58.2 15.3 -4.2 -0.4 14.6 2.9 11.4
Nonmanufacturing 161 31.9 6.5 0.6 6.5 6.2 7.9 3.1
Nonmanufacturing (ex financials) 124 34.0 6.6 7.1 6.2 8.2 13.9 3.3
Russell/Nomura Small Cap 1,037 29.7 3.1 3.7 7.7 6.1 6.6 10.1
Russell/Nomura Small Cap (ex financials) 950 27.3 5.0 4.1 9.9 6.7 6.7 11.4
Net profits
Russell/Nomura Large Cap 335 62.7 7.4 -3.9 11.6 10.2 5.0 13.1
Russell/Nomura Large Cap (ex financials) 298 79.8 8.0 -4.7 12.7 12.1 4.7 15.7
Manufacturing 174 80.9 10.2 -4.8 6.1 14.9 -1.8 20.7
Basic materials 44 85.9 -11.0 -27.1 57.6 14.9 -22.4 64.6
Processing 79 116.1 15.7 -3.0 -0.7 17.4 0.5 18.9
Nonmanufacturing 161 48.2 4.6 -3.0 16.9 6.1 12.0 6.3
Nonmanufacturing (ex financials) 124 78.1 4.2 -4.6 23.3 8.1 15.9 8.4
Russell/Nomura Small Cap 1,037 74.2 2.2 1.9 20.6 7.4 10.4 16.1
Russell/Nomura Small Cap (ex financials) 950 80.6 3.9 0.0 25.6 8.2 9.0 18.9
Note: Latest estimates as of 24 May 2016. Previous estimates as of 21 February 2016.
Source: Nomura
Fig. 2: Major assumptions
Industrial production
2010 base year Call rate / policy rate
(as of term-end) WTI Exchange rate (avg)
% y-y % $/bbl USD/JPY EUR/JPY
Annual FY14 -0.4 0-0.10 80.5 110.0 138.7
FY15 Includes some estimates -1.2 (est) -0.10 45.0 120.0 132.5
Old -0.6 0-0.10 44.1 120.5 132.5
FY16E New 1.3 -0.10 40.0 108.0 123.0
Old 2.8 - 30.0 117.0 127.0
FY17E New -1.0 -0.10 40.0 108.0 123.0
Half year FY15 H1 -0.4 0-0.10 52.2 121.7 135.1
FY15 H2 Includes some estimates -2.0 (est) -0.10 37.8 118.4 129.9
Old -0.8 0-0.10 36.1 119.2 130.0
FY16E H1 New 0.0 -0.10 40.0 108.0 123.0
Old 2.1 - 30.0 117.0 127.0
FY16E H2 New 2.6 -0.10 40.0 108.0 123.0
Old 3.4 - 30.0 117.0 127.0
FY17E H1 New -0.1 -0.10 40.0 108.0 123.0
FY17E H2 New -1.9 -0.10 40.0 108.0 123.0
Note: Macroeconomic assumptions as of 11 April 2016. Previous assumptions as of 14 January 2016. We use the call rate for interest rate data through FY15 H1 and the policy rate for FY15 H2 and beyond since the BOJ introduced a negative interest rate component in its policy on 29 January 2016. The above assumptions are not Nomura estimates but the assumptions on which Nomura analysts base their earnings estimates.
Source: Nomura
Nomura | JPN Outlook for FY16–17 corporate earnings June 2, 2016
5
Contributions to recurring profit growth by sector
Overview of FY15 corporate earnings
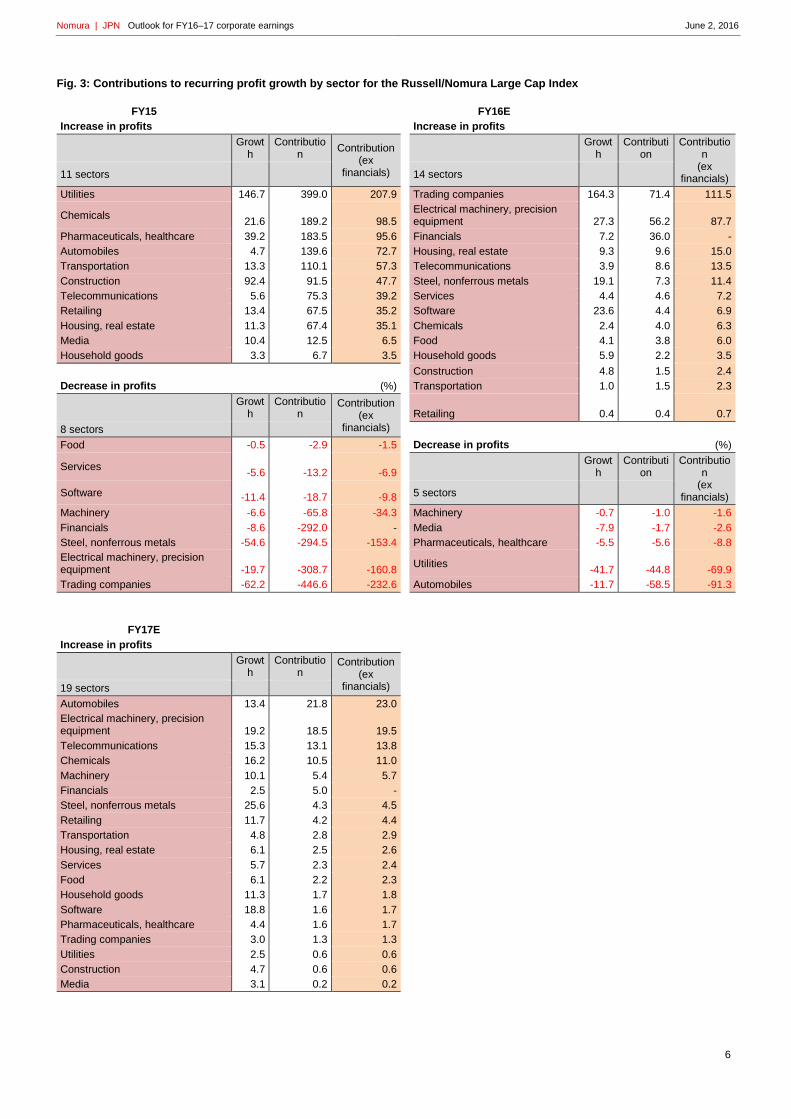
In FY15, recurring profits increased in 11 of the 19 sectors and declined in eight. The largest contributions to growth were from
the utilities, chemical, pharmaceuticals & healthcare, and automobile sectors. USD/JPY was 120.0 for FY15, versus 110.0 for
FY14, with benefits for earnings growth at external demand-oriented sectors with high forex sensitivity.
For the utilities sector, there were large positive contributions from (1) an increase in gains under the fuel cost adjustment
system accompanying lower crude oil prices and (2) a sharp decline in replacement fuel costs incurred owing to nuclear plant
stoppages. For the chemical sector, there were large positive contributions from the diversified chemical and fine chemical
subsectors on benefits from lower costs. With the pharmaceuticals & healthcare sector, there was an impact from the
disappearance of settlement-related costs at some companies and the dropping out of the adverse reaction from rush demand
ahead of the April 2014 consumption tax hike. In the auto sector, profits were boosted by 1.9% y-y growth in global demand in
2015, to 89.4mn vehicles, as well as by strong sales particularly in Europe and the US.
Forex movements had an essentially neutral impact because even though the yen depreciated against the US dollar, it
strengthened against other currencies. Earnings growth was kept low partly by the booking of recall-related expenses at some
companies.
Sectors that made large negative contributions to profit growth include trading companies, electrical machinery & precision
equipment, steel & nonferrous metals, and financials. A number of trading companies booked asset impairment losses in
response to declines in resource prices. As a result, pretax profits in the trading company sector fell to the lowest level since
FY04. In the electrical machinery & precision equipment sector, there was a large impact from Toshiba and Sharp falling into the
red in FY15 as the result of structural reforms stemming at Toshiba from accounting irregularities and at Sharp from a harsh
earnings environment particularly in the display device business. The steel & nonferrous metal sector was hit hard by falling
steel prices in Asia (triggered by oversupply in China), falling demand in emerging economies, and declines in metal prices. The
financial sector was affected by the high level of earnings through to the previous year and by the adverse impact of the BOJ's
adoption of its negative interest rate policy.
Overview of the FY16 corporate earnings outlook
For FY16, we project that recurring profits will increase in 14 of the 19 sectors and decrease in five.
Sectors from which we expect large contributions to overall profit growth include trading companies, electrical machinery &
precision equipment, financials, housing & real estate, and telecommunications. At this point we project at least double-digit
profit growth in the trading company, electrical machinery & precision equipment, steel & nonferrous metal, and software sectors,
although this is to a large extent in reaction to weakness the previous year. With the electrical machinery & precision equipment
sector, for example, we would forecast a slight decline in profits if the earnings of the two above-noted companies that fell into
the red in FY15 were eliminated. In the housing & real estate sector, commercial facility rental businesses have been doing well
and condo selling prices have been firm. In the telecommunications sector, we look for growing use of smartphones and an
ongoing structural shift toward FTTH wholesaling at telecom operations, expanding profit contributions from nontelecom
businesses such as finance/payments, commerce, and content, and an upturn in profits in overseas businesses.
Sectors that we expect to make large negative contributions to profit growth include automobiles and utilities. We assume
USD/JPY of 108.0 for FY16 versus 120.0 for FY15, representing a severe headwind for external demand-oriented sectors. With
the auto sector, we expect some profit boost from cost savings and increased selling volumes in Europe and the US, but we do
not think these will be sufficient to offset the negative impact from yen appreciation. In the utilities sector, we expect fallout from
delays in restarting nuclear power stations and electricity rate cuts triggered by the full deregulation of the electricity retail
market in April 2016.
Nomura | JPN Outlook for FY16–17 corporate earnings June 2, 2016
6
Fig. 3: Contributions to recurring profit growth by sector for the Russell/Nomura Large Cap Index
FY15
FY16E
Increase in profits
Increase in profits
Growt
h Contributio
n Contribution
(ex financials)
Growth
Contribution
Contribution
(ex financials) 11 sectors
14 sectors
Utilities 146.7 399.0 207.9
Trading companies 164.3 71.4 111.5
Chemicals 21.6 189.2 98.5
Electrical machinery, precision equipment 27.3 56.2 87.7
Pharmaceuticals, healthcare 39.2 183.5 95.6
Financials 7.2 36.0 -
Automobiles 4.7 139.6 72.7
Housing, real estate 9.3 9.6 15.0
Transportation 13.3 110.1 57.3
Telecommunications 3.9 8.6 13.5
Construction 92.4 91.5 47.7
Steel, nonferrous metals 19.1 7.3 11.4
Telecommunications 5.6 75.3 39.2
Services 4.4 4.6 7.2
Retailing 13.4 67.5 35.2
Software 23.6 4.4 6.9
Housing, real estate 11.3 67.4 35.1
Chemicals 2.4 4.0 6.3
Media 10.4 12.5 6.5
Food 4.1 3.8 6.0
Household goods 3.3 6.7 3.5
Household goods 5.9 2.2 3.5
Construction 4.8 1.5 2.4
Decrease in profits (%)
Transportation 1.0 1.5 2.3
Growt
h Contributio
n Contribution
(ex financials)
Retailing 0.4 0.4 0.7
8 sectors
Food -0.5 -2.9 -1.5
Decrease in profits
(%)
Services -5.6 -13.2 -6.9
Growth
Contribution
Contribution
(ex financials) Software -11.4 -18.7 -9.8
5 sectors
Machinery -6.6 -65.8 -34.3
Machinery -0.7 -1.0 -1.6
Financials -8.6 -292.0 -
Media -7.9 -1.7 -2.6
Steel, nonferrous metals -54.6 -294.5 -153.4
Pharmaceuticals, healthcare -5.5 -5.6 -8.8
Electrical machinery, precision equipment -19.7 -308.7 -160.8
Utilities -41.7 -44.8 -69.9
Trading companies -62.2 -446.6 -232.6
Automobiles -11.7 -58.5 -91.3
FY17E
Increase in profits
Growt
h Contributio
n Contribution
(ex financials)
19 sectors
Automobiles 13.4 21.8 23.0
Electrical machinery, precision equipment 19.2 18.5 19.5
Telecommunications 15.3 13.1 13.8
Chemicals 16.2 10.5 11.0
Machinery 10.1 5.4 5.7
Financials 2.5 5.0 -
Steel, nonferrous metals 25.6 4.3 4.5
Retailing 11.7 4.2 4.4
Transportation 4.8 2.8 2.9
Housing, real estate 6.1 2.5 2.6
Services 5.7 2.3 2.4
Food 6.1 2.2 2.3
Household goods 11.3 1.7 1.8
Software 18.8 1.6 1.7
Pharmaceuticals, healthcare 4.4 1.6 1.7
Trading companies 3.0 1.3 1.3
Utilities 2.5 0.6 0.6
Construction 4.7 0.6 0.6
Media 3.1 0.2 0.2

Nomura | JPN Outlook for FY16–17 corporate earnings June 2, 2016
7
Source: Nomura
Nomura | JPN Outlook for FY16–17 corporate earnings June 2, 2016
8
Revisions to recurring profit estimates (versus old estimates)
Overview of FY15 corporate earnings
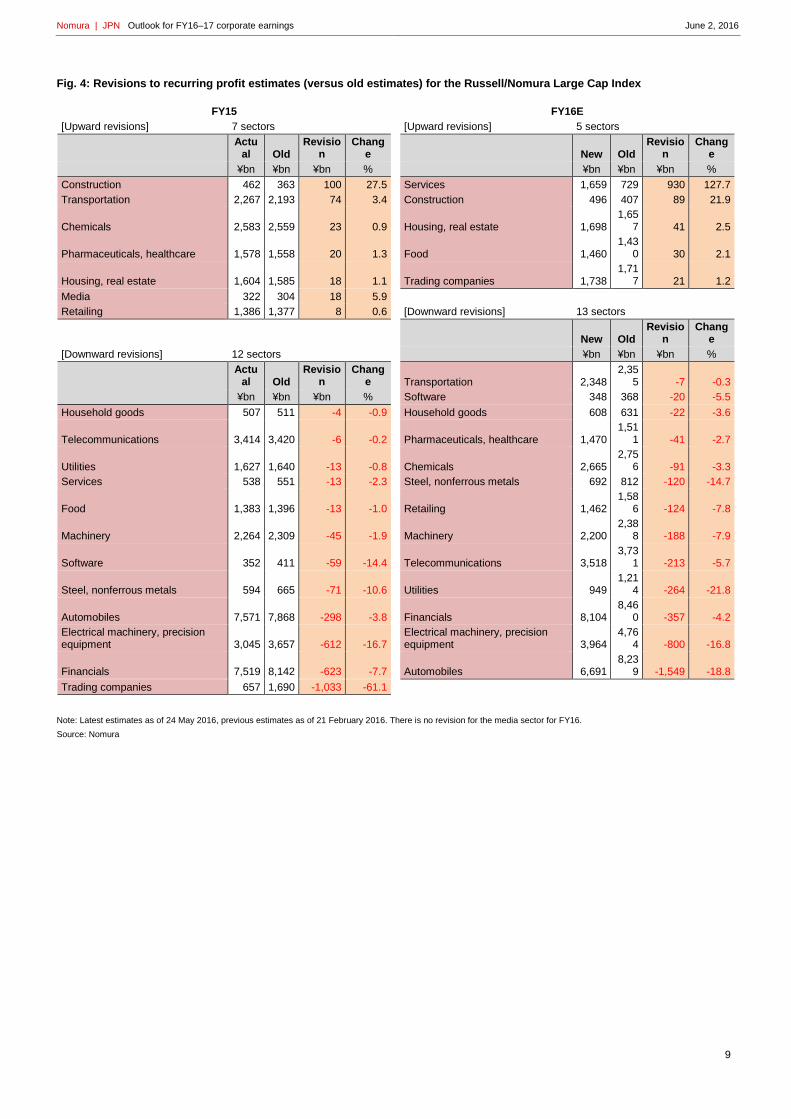
Recurring profits in FY15 came in ahead of our estimates at seven of 19 sectors and below them at 12.
Results exceeded our forecasts the most for construction and transportation. In the construction sector, results came in ahead
of expectations at a wide range of companies. Gross margins on building construction held at high levels and there was no
major change in a generally favorable business environment. In the transportation sector, there was large upside for earnings at
railway companies, which benefited greatly from the boost to sales from the Hokuriku Shinkansen and inbound demand as well
as from power cost savings and moves to rein in maintenance expenses.
Sectors for which earnings came in well below our forecasts include trading companies, financials, electrical machinery &
precision equipment, and automobiles. Trading companies had to book large impairment losses on past resource investment
projects owing to deterioration in the business environment amid declines in resource prices and waning demand in emerging
economies. In the financial sector, net fees and commissions were buoyant despite market deterioration, but net interest income
was weak owing to narrowing loan-deposit spreads in Japan resulting from the BOJ’s adoption of negative interest rates. The
downside for electrical machinery & precision equipment reflected largely the impact of some companies being forced to
implement structural reforms. Although there were one-time forex translation losses and increased pension funding shortfalls,
these were no major surprise. Our impression is that an increasing number of companies have recently stepped up strategic
moves in response to major changes in the business environment brought about by economic slowing. In the automobile sector,
an accident at a supplier's plant caused the temporary suspension of some production in Japan and product quality-related
costs also rose.
Overview of the FY16 corporate earnings outlook
We have raised our FY16 recurring profit forecasts for five of the 19 sectors and lowered them for 13. The major revisions to our
forex assumptions this time toward a stronger yen imply tougher conditions for external demand-oriented sectors.
The largest upward revisions have been for the services, construction, and housing & real estate sectors. With the construction
sector, we expect sustained growth in sales supported by orders for major projects and we also expect gross margins on
building construction to hold at high levels. In the housing & real estate sector, rental housing, commercial facilities, logistics
facilities, and hotel businesses have been doing well. We also expect earnings contributions from property sales to REITs.
Sectors for which we have made large downward revisions include automobiles, electrical machinery & precision equipment,
financials, and utilities. The automobile and electrical machinery & precision equipment sectors are being affected by the
strengthening of the yen as well as by the temporary halt of some production in Japan stemming from the Kumamoto
earthquakes. The electrical machinery & precision equipment sector is also being affected by the deconsolidation of subsidiaries
and higher business development expenses at some companies as the result of the above-mentioned strategic moves. In the
financial sector, earnings have deteriorated sharply recently against a backdrop of yen appreciation and steep declines in
Japanese share prices since the start of the year. Fallout has surfaced from risk-averse moves in such areas as lower equity
market turnover and weak investment trust sales. The utilities sector has been affected by lower gains under the fuel cost
adjustment system stemming from a higher assumption for the crude oil price, heavier alternative energy costs, and increased
amortization of pension fund actuarial differences. Companies also face higher subcontracting costs for compliance with the
electric power system reforms.
Nomura | JPN Outlook for FY16–17 corporate earnings June 2, 2016
9
Fig. 4: Revisions to recurring profit estimates (versus old estimates) for the Russell/Nomura Large Cap Index
FY15
FY16E
[Upward revisions] 7 sectors
[Upward revisions] 5 sectors
Actual Old
Revision
Change New Old
Revision
Change
¥bn ¥bn ¥bn %
¥bn ¥bn ¥bn %
Construction 462 363 100 27.5
Services 1,659 729 930 127.7
Transportation 2,267 2,193 74 3.4
Construction 496 407 89 21.9
Chemicals 2,583 2,559 23 0.9
Housing, real estate 1,698 1,65
7 41 2.5
Pharmaceuticals, healthcare 1,578 1,558 20 1.3
Food 1,460 1,43
0 30 2.1
Housing, real estate 1,604 1,585 18 1.1
Trading companies 1,738 1,71
7 21 1.2
Media 322 304 18 5.9
Retailing 1,386 1,377 8 0.6
[Downward revisions] 13 sectors
New Old Revisio
n Chang
e
[Downward revisions] 12 sectors
¥bn ¥bn ¥bn %
Actual Old
Revision
Change
Transportation 2,348 2,35
5 -7 -0.3
¥bn ¥bn ¥bn %
Software 348 368 -20 -5.5
Household goods 507 511 -4 -0.9
Household goods 608 631 -22 -3.6
Telecommunications 3,414 3,420 -6 -0.2
Pharmaceuticals, healthcare 1,470 1,51
1 -41 -2.7
Utilities 1,627 1,640 -13 -0.8
Chemicals 2,665 2,75
6 -91 -3.3
Services 538 551 -13 -2.3
Steel, nonferrous metals 692 812 -120 -14.7
Food 1,383 1,396 -13 -1.0
Retailing 1,462 1,58
6 -124 -7.8
Machinery 2,264 2,309 -45 -1.9
Machinery 2,200 2,38
8 -188 -7.9
Software 352 411 -59 -14.4
Telecommunications 3,518 3,73
1 -213 -5.7
Steel, nonferrous metals 594 665 -71 -10.6
Utilities 949 1,21
4 -264 -21.8
Automobiles 7,571 7,868 -298 -3.8
Financials 8,104 8,46
0 -357 -4.2
Electrical machinery, precision equipment 3,045 3,657 -612 -16.7
Electrical machinery, precision equipment 3,964
4,764 -800 -16.8
Financials 7,519 8,142 -623 -7.7
Automobiles 6,691 8,23
9 -1,549 -18.8
Trading companies 657 1,690 -1,033 -61.1
Note: Latest estimates as of 24 May 2016, previous estimates as of 21 February 2016. There is no revision for the media sector for FY16.
Source: Nomura
Nomura | JPN Outlook for FY16–17 corporate earnings June 2, 2016
10
Fig. 5: Breakdown of factors affecting ROE
Note: Figures for FY16 onward are estimates. As of 24 May 2016.
Source: Nomura
0
1
2
3
4
5
6
7
8
9
79 81 83 85 87 89 91 93 95 97 99 01 03 05 07 09 11 13 15 17
(%)
(FY)
Russell/Nomura Large Cap (ex financials)
Operating margin (ex financials)
Recurring margin (ex financials)
-5
0
5
10
15
79 81 83 85 87 89 91 93 95 97 99 01 03 05 07 09 11 13 15 17
(%)
(FY)
Russell/Nomura Large Cap ROE
ROE (ex financials)
ROE (overall)
0.0
0.5
1.0
1.5
79 81 83 85 87 89 91 93 95 97 99 01 03 05 07 09 11 13 15 17
Total asset turnover ratio (ex financials)(x)
(FY)
0
2
4
6
8
10
12
14
79 81 83 85 87 89 91 93 95 97 99 01 03 05 07 09 11 13 15 17
Financial leverage (total assets ÷shareholders' equity)
Overall
Ex financials
(x)
(FY)
Nomura | JPN Outlook for FY16–17 corporate earnings June 2, 2016
11
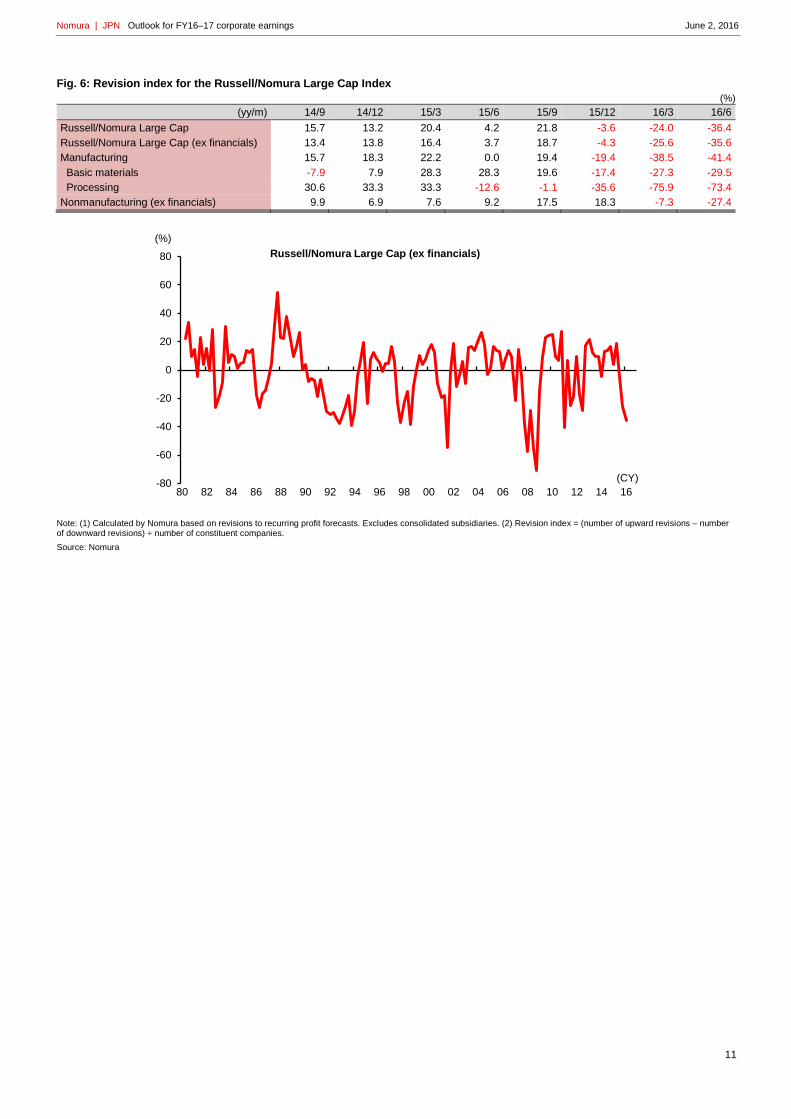
Fig. 6: Revision index for the Russell/Nomura Large Cap Index
(%)
(yy/m) 14/9 14/12 15/3 15/6 15/9 15/12 16/3 16/6
Russell/Nomura Large Cap 15.7 13.2 20.4 4.2 21.8 -3.6 -24.0 -36.4
Russell/Nomura Large Cap (ex financials) 13.4 13.8 16.4 3.7 18.7 -4.3 -25.6 -35.6
Manufacturing 15.7 18.3 22.2 0.0 19.4 -19.4 -38.5 -41.4
Basic materials -7.9 7.9 28.3 28.3 19.6 -17.4 -27.3 -29.5
Processing 30.6 33.3 33.3 -12.6 -1.1 -35.6 -75.9 -73.4
Nonmanufacturing (ex financials) 9.9 6.9 7.6 9.2 17.5 18.3 -7.3 -27.4
Note: (1) Calculated by Nomura based on revisions to recurring profit forecasts. Excludes consolidated subsidiaries. (2) Revision index = (number of upward revisions – number of downward revisions) ÷ number of constituent companies.
Source: Nomura
-80
-60
-40
-20
0
20
40
60
80
80 82 84 86 88 90 92 94 96 98 00 02 04 06 08 10 12 14 16
(%)
(CY)
Russell/Nomura Large Cap (ex financials)
Nomura | JPN Outlook for FY16–17 corporate earnings June 2, 2016
12
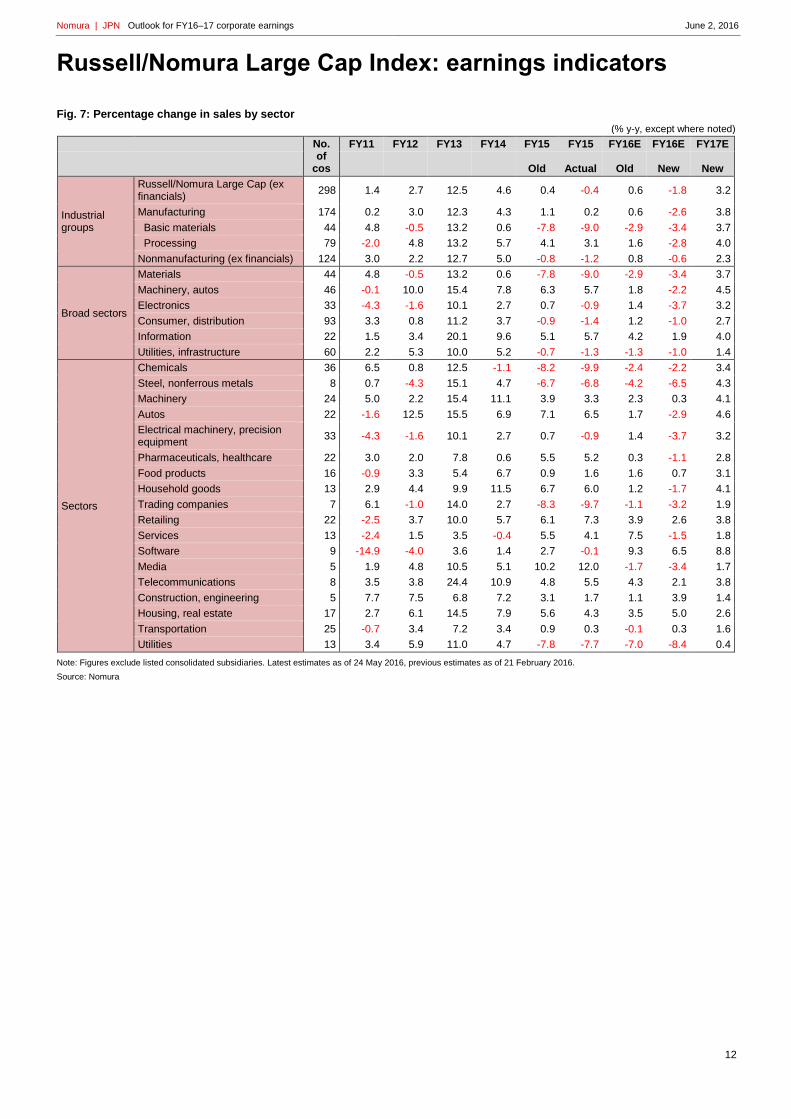
Russell/Nomura Large Cap Index: earnings indicators
Fig. 7: Percentage change in sales by sector
(% y-y, except where noted)
No. of
cos
FY11 FY12 FY13 FY14 FY15 FY15 FY16E FY16E FY17E
Old Actual Old New New
Industrial groups
Russell/Nomura Large Cap (ex financials)
298 1.4 2.7 12.5 4.6 0.4 -0.4 0.6 -1.8 3.2
Manufacturing 174 0.2 3.0 12.3 4.3 1.1 0.2 0.6 -2.6 3.8
Basic materials 44 4.8 -0.5 13.2 0.6 -7.8 -9.0 -2.9 -3.4 3.7
Processing 79 -2.0 4.8 13.2 5.7 4.1 3.1 1.6 -2.8 4.0
Nonmanufacturing (ex financials) 124 3.0 2.2 12.7 5.0 -0.8 -1.2 0.8 -0.6 2.3
Broad sectors
Materials 44 4.8 -0.5 13.2 0.6 -7.8 -9.0 -2.9 -3.4 3.7
Machinery, autos 46 -0.1 10.0 15.4 7.8 6.3 5.7 1.8 -2.2 4.5
Electronics 33 -4.3 -1.6 10.1 2.7 0.7 -0.9 1.4 -3.7 3.2
Consumer, distribution 93 3.3 0.8 11.2 3.7 -0.9 -1.4 1.2 -1.0 2.7
Information 22 1.5 3.4 20.1 9.6 5.1 5.7 4.2 1.9 4.0
Utilities, infrastructure 60 2.2 5.3 10.0 5.2 -0.7 -1.3 -1.3 -1.0 1.4
Sectors
Chemicals 36 6.5 0.8 12.5 -1.1 -8.2 -9.9 -2.4 -2.2 3.4
Steel, nonferrous metals 8 0.7 -4.3 15.1 4.7 -6.7 -6.8 -4.2 -6.5 4.3
Machinery 24 5.0 2.2 15.4 11.1 3.9 3.3 2.3 0.3 4.1
Autos 22 -1.6 12.5 15.5 6.9 7.1 6.5 1.7 -2.9 4.6
Electrical machinery, precision equipment
33 -4.3 -1.6 10.1 2.7 0.7 -0.9 1.4 -3.7 3.2
Pharmaceuticals, healthcare 22 3.0 2.0 7.8 0.6 5.5 5.2 0.3 -1.1 2.8
Food products 16 -0.9 3.3 5.4 6.7 0.9 1.6 1.6 0.7 3.1
Household goods 13 2.9 4.4 9.9 11.5 6.7 6.0 1.2 -1.7 4.1
Trading companies 7 6.1 -1.0 14.0 2.7 -8.3 -9.7 -1.1 -3.2 1.9
Retailing 22 -2.5 3.7 10.0 5.7 6.1 7.3 3.9 2.6 3.8
Services 13 -2.4 1.5 3.5 -0.4 5.5 4.1 7.5 -1.5 1.8
Software 9 -14.9 -4.0 3.6 1.4 2.7 -0.1 9.3 6.5 8.8
Media 5 1.9 4.8 10.5 5.1 10.2 12.0 -1.7 -3.4 1.7
Telecommunications 8 3.5 3.8 24.4 10.9 4.8 5.5 4.3 2.1 3.8
Construction, engineering 5 7.7 7.5 6.8 7.2 3.1 1.7 1.1 3.9 1.4
Housing, real estate 17 2.7 6.1 14.5 7.9 5.6 4.3 3.5 5.0 2.6
Transportation 25 -0.7 3.4 7.2 3.4 0.9 0.3 -0.1 0.3 1.6
Utilities 13 3.4 5.9 11.0 4.7 -7.8 -7.7 -7.0 -8.4 0.4
Note: Figures exclude listed consolidated subsidiaries. Latest estimates as of 24 May 2016, previous estimates as of 21 February 2016.
Source: Nomura
Nomura | JPN Outlook for FY16–17 corporate earnings June 2, 2016
13
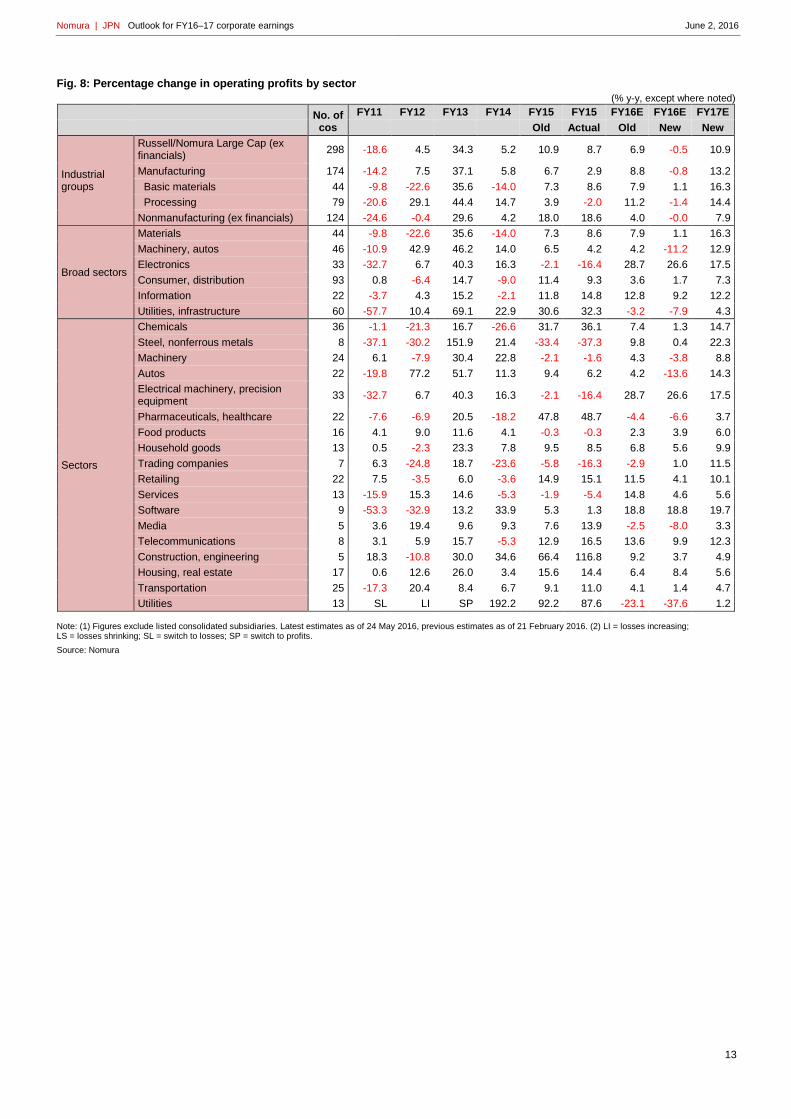
Fig. 8: Percentage change in operating profits by sector
(% y-y, except where noted)
No. of cos
FY11 FY12 FY13 FY14 FY15 FY15 FY16E FY16E FY17E
Old Actual Old New New
Industrial groups
Russell/Nomura Large Cap (ex financials)
298 -18.6 4.5 34.3 5.2 10.9 8.7 6.9 -0.5 10.9
Manufacturing 174 -14.2 7.5 37.1 5.8 6.7 2.9 8.8 -0.8 13.2
Basic materials 44 -9.8 -22.6 35.6 -14.0 7.3 8.6 7.9 1.1 16.3
Processing 79 -20.6 29.1 44.4 14.7 3.9 -2.0 11.2 -1.4 14.4
Nonmanufacturing (ex financials) 124 -24.6 -0.4 29.6 4.2 18.0 18.6 4.0 -0.0 7.9
Broad sectors
Materials 44 -9.8 -22.6 35.6 -14.0 7.3 8.6 7.9 1.1 16.3
Machinery, autos 46 -10.9 42.9 46.2 14.0 6.5 4.2 4.2 -11.2 12.9
Electronics 33 -32.7 6.7 40.3 16.3 -2.1 -16.4 28.7 26.6 17.5
Consumer, distribution 93 0.8 -6.4 14.7 -9.0 11.4 9.3 3.6 1.7 7.3
Information 22 -3.7 4.3 15.2 -2.1 11.8 14.8 12.8 9.2 12.2
Utilities, infrastructure 60 -57.7 10.4 69.1 22.9 30.6 32.3 -3.2 -7.9 4.3
Sectors
Chemicals 36 -1.1 -21.3 16.7 -26.6 31.7 36.1 7.4 1.3 14.7
Steel, nonferrous metals 8 -37.1 -30.2 151.9 21.4 -33.4 -37.3 9.8 0.4 22.3
Machinery 24 6.1 -7.9 30.4 22.8 -2.1 -1.6 4.3 -3.8 8.8
Autos 22 -19.8 77.2 51.7 11.3 9.4 6.2 4.2 -13.6 14.3
Electrical machinery, precision equipment
33 -32.7 6.7 40.3 16.3 -2.1 -16.4 28.7 26.6 17.5
Pharmaceuticals, healthcare 22 -7.6 -6.9 20.5 -18.2 47.8 48.7 -4.4 -6.6 3.7
Food products 16 4.1 9.0 11.6 4.1 -0.3 -0.3 2.3 3.9 6.0
Household goods 13 0.5 -2.3 23.3 7.8 9.5 8.5 6.8 5.6 9.9
Trading companies 7 6.3 -24.8 18.7 -23.6 -5.8 -16.3 -2.9 1.0 11.5
Retailing 22 7.5 -3.5 6.0 -3.6 14.9 15.1 11.5 4.1 10.1
Services 13 -15.9 15.3 14.6 -5.3 -1.9 -5.4 14.8 4.6 5.6
Software 9 -53.3 -32.9 13.2 33.9 5.3 1.3 18.8 18.8 19.7
Media 5 3.6 19.4 9.6 9.3 7.6 13.9 -2.5 -8.0 3.3
Telecommunications 8 3.1 5.9 15.7 -5.3 12.9 16.5 13.6 9.9 12.3
Construction, engineering 5 18.3 -10.8 30.0 34.6 66.4 116.8 9.2 3.7 4.9
Housing, real estate 17 0.6 12.6 26.0 3.4 15.6 14.4 6.4 8.4 5.6
Transportation 25 -17.3 20.4 8.4 6.7 9.1 11.0 4.1 1.4 4.7
Utilities 13 SL LI SP 192.2 92.2 87.6 -23.1 -37.6 1.2
Note: (1) Figures exclude listed consolidated subsidiaries. Latest estimates as of 24 May 2016, previous estimates as of 21 February 2016. (2) LI = losses increasing; LS = losses shrinking; SL = switch to losses; SP = switch to profits.
Source: Nomura
Nomura | JPN Outlook for FY16–17 corporate earnings June 2, 2016
14
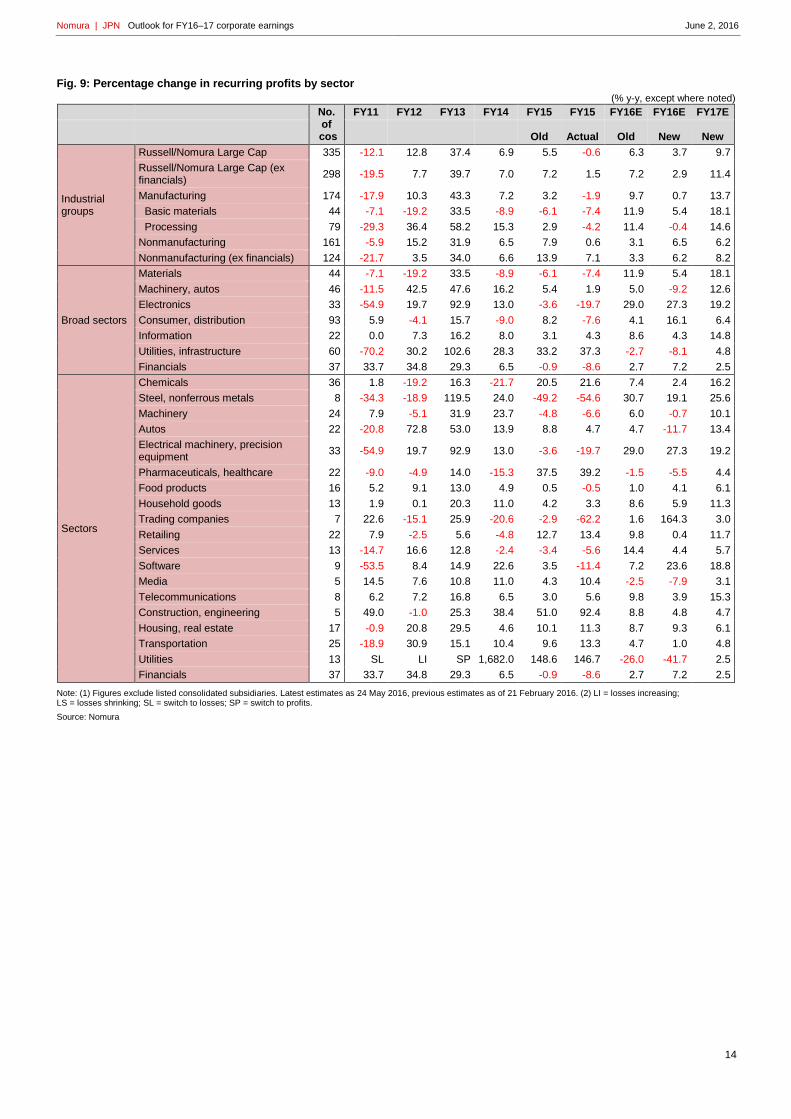
Fig. 9: Percentage change in recurring profits by sector
(% y-y, except where noted)
No. of
cos
FY11 FY12 FY13 FY14 FY15 FY15 FY16E FY16E FY17E
Old Actual Old New New
Industrial groups
Russell/Nomura Large Cap 335 -12.1 12.8 37.4 6.9 5.5 -0.6 6.3 3.7 9.7
Russell/Nomura Large Cap (ex financials)
298 -19.5 7.7 39.7 7.0 7.2 1.5 7.2 2.9 11.4
Manufacturing 174 -17.9 10.3 43.3 7.2 3.2 -1.9 9.7 0.7 13.7
Basic materials 44 -7.1 -19.2 33.5 -8.9 -6.1 -7.4 11.9 5.4 18.1
Processing 79 -29.3 36.4 58.2 15.3 2.9 -4.2 11.4 -0.4 14.6
Nonmanufacturing 161 -5.9 15.2 31.9 6.5 7.9 0.6 3.1 6.5 6.2
Nonmanufacturing (ex financials) 124 -21.7 3.5 34.0 6.6 13.9 7.1 3.3 6.2 8.2
Broad sectors
Materials 44 -7.1 -19.2 33.5 -8.9 -6.1 -7.4 11.9 5.4 18.1
Machinery, autos 46 -11.5 42.5 47.6 16.2 5.4 1.9 5.0 -9.2 12.6
Electronics 33 -54.9 19.7 92.9 13.0 -3.6 -19.7 29.0 27.3 19.2
Consumer, distribution 93 5.9 -4.1 15.7 -9.0 8.2 -7.6 4.1 16.1 6.4
Information 22 0.0 7.3 16.2 8.0 3.1 4.3 8.6 4.3 14.8
Utilities, infrastructure 60 -70.2 30.2 102.6 28.3 33.2 37.3 -2.7 -8.1 4.8
Financials 37 33.7 34.8 29.3 6.5 -0.9 -8.6 2.7 7.2 2.5
Sectors
Chemicals 36 1.8 -19.2 16.3 -21.7 20.5 21.6 7.4 2.4 16.2
Steel, nonferrous metals 8 -34.3 -18.9 119.5 24.0 -49.2 -54.6 30.7 19.1 25.6
Machinery 24 7.9 -5.1 31.9 23.7 -4.8 -6.6 6.0 -0.7 10.1
Autos 22 -20.8 72.8 53.0 13.9 8.8 4.7 4.7 -11.7 13.4
Electrical machinery, precision equipment
33 -54.9 19.7 92.9 13.0 -3.6 -19.7 29.0 27.3 19.2
Pharmaceuticals, healthcare 22 -9.0 -4.9 14.0 -15.3 37.5 39.2 -1.5 -5.5 4.4
Food products 16 5.2 9.1 13.0 4.9 0.5 -0.5 1.0 4.1 6.1
Household goods 13 1.9 0.1 20.3 11.0 4.2 3.3 8.6 5.9 11.3
Trading companies 7 22.6 -15.1 25.9 -20.6 -2.9 -62.2 1.6 164.3 3.0
Retailing 22 7.9 -2.5 5.6 -4.8 12.7 13.4 9.8 0.4 11.7
Services 13 -14.7 16.6 12.8 -2.4 -3.4 -5.6 14.4 4.4 5.7
Software 9 -53.5 8.4 14.9 22.6 3.5 -11.4 7.2 23.6 18.8
Media 5 14.5 7.6 10.8 11.0 4.3 10.4 -2.5 -7.9 3.1
Telecommunications 8 6.2 7.2 16.8 6.5 3.0 5.6 9.8 3.9 15.3
Construction, engineering 5 49.0 -1.0 25.3 38.4 51.0 92.4 8.8 4.8 4.7
Housing, real estate 17 -0.9 20.8 29.5 4.6 10.1 11.3 8.7 9.3 6.1
Transportation 25 -18.9 30.9 15.1 10.4 9.6 13.3 4.7 1.0 4.8
Utilities 13 SL LI SP 1,682.0 148.6 146.7 -26.0 -41.7 2.5
Financials 37 33.7 34.8 29.3 6.5 -0.9 -8.6 2.7 7.2 2.5
Note: (1) Figures exclude listed consolidated subsidiaries. Latest estimates as 24 May 2016, previous estimates as of 21 February 2016. (2) LI = losses increasing; LS = losses shrinking; SL = switch to losses; SP = switch to profits.
Source: Nomura
Nomura | JPN Outlook for FY16–17 corporate earnings June 2, 2016
15
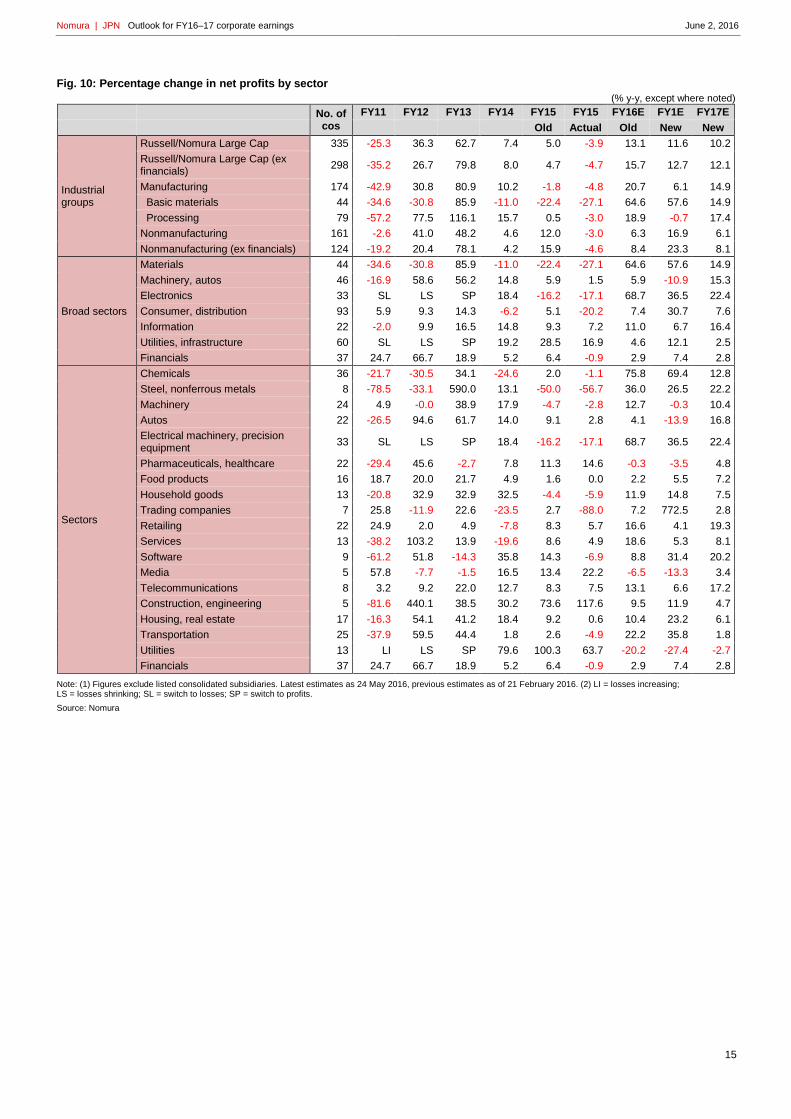
Fig. 10: Percentage change in net profits by sector
(% y-y, except where noted)
No. of cos
FY11 FY12 FY13 FY14 FY15 FY15 FY16E FY1E FY17E
Old Actual Old New New
Industrial groups
Russell/Nomura Large Cap 335 -25.3 36.3 62.7 7.4 5.0 -3.9 13.1 11.6 10.2
Russell/Nomura Large Cap (ex financials)
298 -35.2 26.7 79.8 8.0 4.7 -4.7 15.7 12.7 12.1
Manufacturing 174 -42.9 30.8 80.9 10.2 -1.8 -4.8 20.7 6.1 14.9
Basic materials 44 -34.6 -30.8 85.9 -11.0 -22.4 -27.1 64.6 57.6 14.9
Processing 79 -57.2 77.5 116.1 15.7 0.5 -3.0 18.9 -0.7 17.4
Nonmanufacturing 161 -2.6 41.0 48.2 4.6 12.0 -3.0 6.3 16.9 6.1
Nonmanufacturing (ex financials) 124 -19.2 20.4 78.1 4.2 15.9 -4.6 8.4 23.3 8.1
Broad sectors
Materials 44 -34.6 -30.8 85.9 -11.0 -22.4 -27.1 64.6 57.6 14.9
Machinery, autos 46 -16.9 58.6 56.2 14.8 5.9 1.5 5.9 -10.9 15.3
Electronics 33 SL LS SP 18.4 -16.2 -17.1 68.7 36.5 22.4
Consumer, distribution 93 5.9 9.3 14.3 -6.2 5.1 -20.2 7.4 30.7 7.6
Information 22 -2.0 9.9 16.5 14.8 9.3 7.2 11.0 6.7 16.4
Utilities, infrastructure 60 SL LS SP 19.2 28.5 16.9 4.6 12.1 2.5
Financials 37 24.7 66.7 18.9 5.2 6.4 -0.9 2.9 7.4 2.8
Sectors
Chemicals 36 -21.7 -30.5 34.1 -24.6 2.0 -1.1 75.8 69.4 12.8
Steel, nonferrous metals 8 -78.5 -33.1 590.0 13.1 -50.0 -56.7 36.0 26.5 22.2
Machinery 24 4.9 -0.0 38.9 17.9 -4.7 -2.8 12.7 -0.3 10.4
Autos 22 -26.5 94.6 61.7 14.0 9.1 2.8 4.1 -13.9 16.8
Electrical machinery, precision equipment
33 SL LS SP 18.4 -16.2 -17.1 68.7 36.5 22.4
Pharmaceuticals, healthcare 22 -29.4 45.6 -2.7 7.8 11.3 14.6 -0.3 -3.5 4.8
Food products 16 18.7 20.0 21.7 4.9 1.6 0.0 2.2 5.5 7.2
Household goods 13 -20.8 32.9 32.9 32.5 -4.4 -5.9 11.9 14.8 7.5
Trading companies 7 25.8 -11.9 22.6 -23.5 2.7 -88.0 7.2 772.5 2.8
Retailing 22 24.9 2.0 4.9 -7.8 8.3 5.7 16.6 4.1 19.3
Services 13 -38.2 103.2 13.9 -19.6 8.6 4.9 18.6 5.3 8.1
Software 9 -61.2 51.8 -14.3 35.8 14.3 -6.9 8.8 31.4 20.2
Media 5 57.8 -7.7 -1.5 16.5 13.4 22.2 -6.5 -13.3 3.4
Telecommunications 8 3.2 9.2 22.0 12.7 8.3 7.5 13.1 6.6 17.2
Construction, engineering 5 -81.6 440.1 38.5 30.2 73.6 117.6 9.5 11.9 4.7
Housing, real estate 17 -16.3 54.1 41.2 18.4 9.2 0.6 10.4 23.2 6.1
Transportation 25 -37.9 59.5 44.4 1.8 2.6 -4.9 22.2 35.8 1.8
Utilities 13 LI LS SP 79.6 100.3 63.7 -20.2 -27.4 -2.7
Financials 37 24.7 66.7 18.9 5.2 6.4 -0.9 2.9 7.4 2.8
Note: (1) Figures exclude listed consolidated subsidiaries. Latest estimates as 24 May 2016, previous estimates as of 21 February 2016. (2) LI = losses increasing; LS = losses shrinking; SL = switch to losses; SP = switch to profits.
Source: Nomura
Nomura | JPN Outlook for FY16–17 corporate earnings June 2, 2016
16
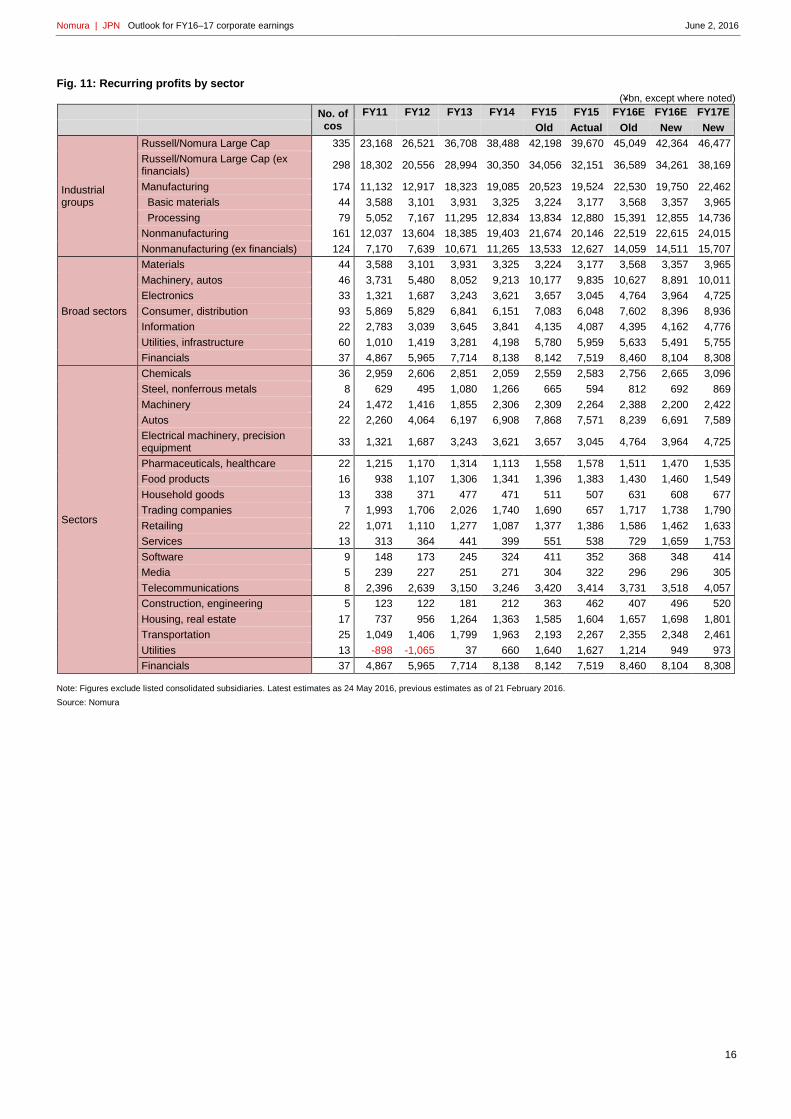
Fig. 11: Recurring profits by sector
(¥bn, except where noted)
No. of cos
FY11 FY12 FY13 FY14 FY15 FY15 FY16E FY16E FY17E
Old Actual Old New New
Industrial groups
Russell/Nomura Large Cap 335 23,168 26,521 36,708 38,488 42,198 39,670 45,049 42,364 46,477
Russell/Nomura Large Cap (ex financials)
298 18,302 20,556 28,994 30,350 34,056 32,151 36,589 34,261 38,169
Manufacturing 174 11,132 12,917 18,323 19,085 20,523 19,524 22,530 19,750 22,462
Basic materials 44 3,588 3,101 3,931 3,325 3,224 3,177 3,568 3,357 3,965
Processing 79 5,052 7,167 11,295 12,834 13,834 12,880 15,391 12,855 14,736
Nonmanufacturing 161 12,037 13,604 18,385 19,403 21,674 20,146 22,519 22,615 24,015
Nonmanufacturing (ex financials) 124 7,170 7,639 10,671 11,265 13,533 12,627 14,059 14,511 15,707
Broad sectors
Materials 44 3,588 3,101 3,931 3,325 3,224 3,177 3,568 3,357 3,965
Machinery, autos 46 3,731 5,480 8,052 9,213 10,177 9,835 10,627 8,891 10,011
Electronics 33 1,321 1,687 3,243 3,621 3,657 3,045 4,764 3,964 4,725
Consumer, distribution 93 5,869 5,829 6,841 6,151 7,083 6,048 7,602 8,396 8,936
Information 22 2,783 3,039 3,645 3,841 4,135 4,087 4,395 4,162 4,776
Utilities, infrastructure 60 1,010 1,419 3,281 4,198 5,780 5,959 5,633 5,491 5,755
Financials 37 4,867 5,965 7,714 8,138 8,142 7,519 8,460 8,104 8,308
Sectors
Chemicals 36 2,959 2,606 2,851 2,059 2,559 2,583 2,756 2,665 3,096
Steel, nonferrous metals 8 629 495 1,080 1,266 665 594 812 692 869
Machinery 24 1,472 1,416 1,855 2,306 2,309 2,264 2,388 2,200 2,422
Autos 22 2,260 4,064 6,197 6,908 7,868 7,571 8,239 6,691 7,589
Electrical machinery, precision equipment
33 1,321 1,687 3,243 3,621 3,657 3,045 4,764 3,964 4,725
Pharmaceuticals, healthcare 22 1,215 1,170 1,314 1,113 1,558 1,578 1,511 1,470 1,535
Food products 16 938 1,107 1,306 1,341 1,396 1,383 1,430 1,460 1,549
Household goods 13 338 371 477 471 511 507 631 608 677
Trading companies 7 1,993 1,706 2,026 1,740 1,690 657 1,717 1,738 1,790
Retailing 22 1,071 1,110 1,277 1,087 1,377 1,386 1,586 1,462 1,633
Services 13 313 364 441 399 551 538 729 1,659 1,753
Software 9 148 173 245 324 411 352 368 348 414
Media 5 239 227 251 271 304 322 296 296 305
Telecommunications 8 2,396 2,639 3,150 3,246 3,420 3,414 3,731 3,518 4,057
Construction, engineering 5 123 122 181 212 363 462 407 496 520
Housing, real estate 17 737 956 1,264 1,363 1,585 1,604 1,657 1,698 1,801
Transportation 25 1,049 1,406 1,799 1,963 2,193 2,267 2,355 2,348 2,461
Utilities 13 -898 -1,065 37 660 1,640 1,627 1,214 949 973
Financials 37 4,867 5,965 7,714 8,138 8,142 7,519 8,460 8,104 8,308
Note: Figures exclude listed consolidated subsidiaries. Latest estimates as 24 May 2016, previous estimates as of 21 February 2016.
Source: Nomura
Nomura | JPN Outlook for FY16–17 corporate earnings June 2, 2016
17
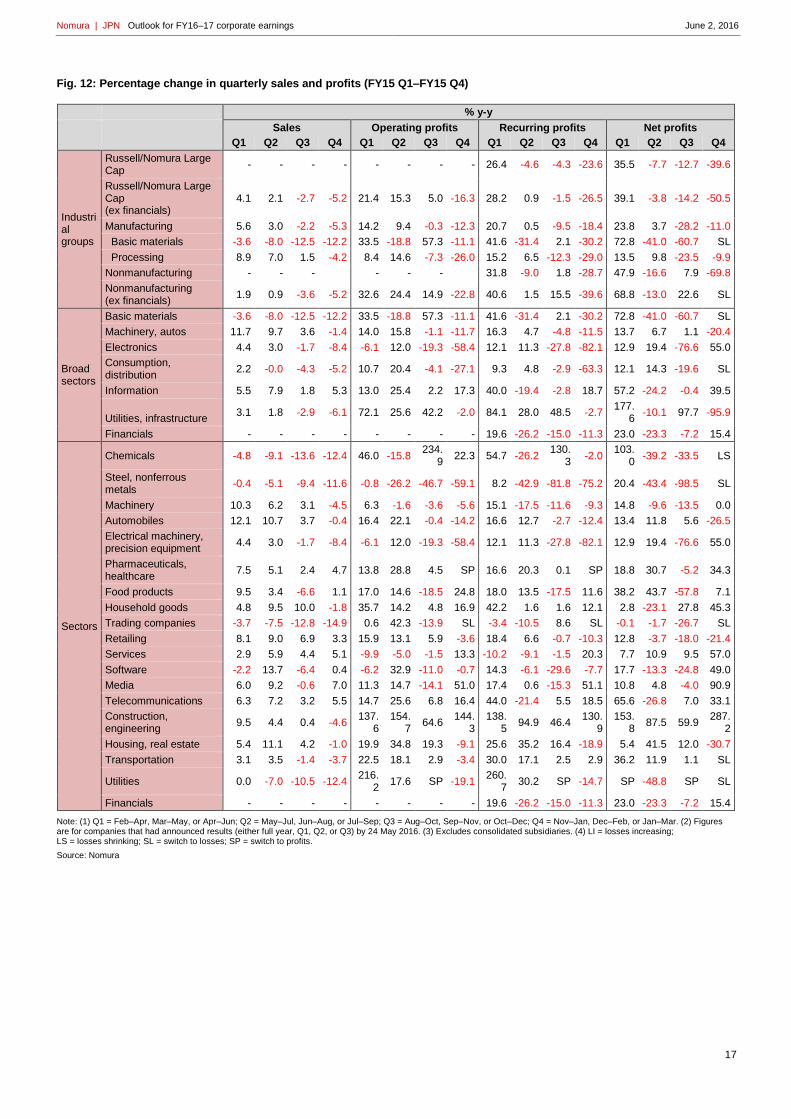
Fig. 12: Percentage change in quarterly sales and profits (FY15 Q1–FY15 Q4)
% y-y
Sales Operating profits Recurring profits Net profits
Q1 Q2 Q3 Q4 Q1 Q2 Q3 Q4 Q1 Q2 Q3 Q4 Q1 Q2 Q3 Q4
Industrial groups
Russell/Nomura Large Cap
- - - - - - - - 26.4 -4.6 -4.3 -23.6 35.5 -7.7 -12.7 -39.6
Russell/Nomura Large Cap (ex financials)
4.1 2.1 -2.7 -5.2 21.4 15.3 5.0 -16.3 28.2 0.9 -1.5 -26.5 39.1 -3.8 -14.2 -50.5
Manufacturing 5.6 3.0 -2.2 -5.3 14.2 9.4 -0.3 -12.3 20.7 0.5 -9.5 -18.4 23.8 3.7 -28.2 -11.0
Basic materials -3.6 -8.0 -12.5 -12.2 33.5 -18.8 57.3 -11.1 41.6 -31.4 2.1 -30.2 72.8 -41.0 -60.7 SL
Processing 8.9 7.0 1.5 -4.2 8.4 14.6 -7.3 -26.0 15.2 6.5 -12.3 -29.0 13.5 9.8 -23.5 -9.9
Nonmanufacturing - - -
- - -
31.8 -9.0 1.8 -28.7 47.9 -16.6 7.9 -69.8
Nonmanufacturing (ex financials)
1.9 0.9 -3.6 -5.2 32.6 24.4 14.9 -22.8 40.6 1.5 15.5 -39.6 68.8 -13.0 22.6 SL
Broad sectors
Basic materials -3.6 -8.0 -12.5 -12.2 33.5 -18.8 57.3 -11.1 41.6 -31.4 2.1 -30.2 72.8 -41.0 -60.7 SL
Machinery, autos 11.7 9.7 3.6 -1.4 14.0 15.8 -1.1 -11.7 16.3 4.7 -4.8 -11.5 13.7 6.7 1.1 -20.4
Electronics 4.4 3.0 -1.7 -8.4 -6.1 12.0 -19.3 -58.4 12.1 11.3 -27.8 -82.1 12.9 19.4 -76.6 55.0
Consumption, distribution
2.2 -0.0 -4.3 -5.2 10.7 20.4 -4.1 -27.1 9.3 4.8 -2.9 -63.3 12.1 14.3 -19.6 SL
Information 5.5 7.9 1.8 5.3 13.0 25.4 2.2 17.3 40.0 -19.4 -2.8 18.7 57.2 -24.2 -0.4 39.5
Utilities, infrastructure 3.1 1.8 -2.9 -6.1 72.1 25.6 42.2 -2.0 84.1 28.0 48.5 -2.7
177.6
-10.1 97.7 -95.9
Financials - - - - - - - - 19.6 -26.2 -15.0 -11.3 23.0 -23.3 -7.2 15.4
Sectors
Chemicals -4.8 -9.1 -13.6 -12.4 46.0 -15.8 234.
9 22.3 54.7 -26.2
130.3
-2.0 103.
0 -39.2 -33.5 LS
Steel, nonferrous metals
-0.4 -5.1 -9.4 -11.6 -0.8 -26.2 -46.7 -59.1 8.2 -42.9 -81.8 -75.2 20.4 -43.4 -98.5 SL
Machinery 10.3 6.2 3.1 -4.5 6.3 -1.6 -3.6 -5.6 15.1 -17.5 -11.6 -9.3 14.8 -9.6 -13.5 0.0
Automobiles 12.1 10.7 3.7 -0.4 16.4 22.1 -0.4 -14.2 16.6 12.7 -2.7 -12.4 13.4 11.8 5.6 -26.5
Electrical machinery, precision equipment
4.4 3.0 -1.7 -8.4 -6.1 12.0 -19.3 -58.4 12.1 11.3 -27.8 -82.1 12.9 19.4 -76.6 55.0
Pharmaceuticals, healthcare
7.5 5.1 2.4 4.7 13.8 28.8 4.5 SP 16.6 20.3 0.1 SP 18.8 30.7 -5.2 34.3
Food products 9.5 3.4 -6.6 1.1 17.0 14.6 -18.5 24.8 18.0 13.5 -17.5 11.6 38.2 43.7 -57.8 7.1
Household goods 4.8 9.5 10.0 -1.8 35.7 14.2 4.8 16.9 42.2 1.6 1.6 12.1 2.8 -23.1 27.8 45.3
Trading companies -3.7 -7.5 -12.8 -14.9 0.6 42.3 -13.9 SL -3.4 -10.5 8.6 SL -0.1 -1.7 -26.7 SL
Retailing 8.1 9.0 6.9 3.3 15.9 13.1 5.9 -3.6 18.4 6.6 -0.7 -10.3 12.8 -3.7 -18.0 -21.4
Services 2.9 5.9 4.4 5.1 -9.9 -5.0 -1.5 13.3 -10.2 -9.1 -1.5 20.3 7.7 10.9 9.5 57.0
Software -2.2 13.7 -6.4 0.4 -6.2 32.9 -11.0 -0.7 14.3 -6.1 -29.6 -7.7 17.7 -13.3 -24.8 49.0
Media 6.0 9.2 -0.6 7.0 11.3 14.7 -14.1 51.0 17.4 0.6 -15.3 51.1 10.8 4.8 -4.0 90.9
Telecommunications 6.3 7.2 3.2 5.5 14.7 25.6 6.8 16.4 44.0 -21.4 5.5 18.5 65.6 -26.8 7.0 33.1
Construction, engineering
9.5 4.4 0.4 -4.6 137.
6 154.
7 64.6
144.3
138.5
94.9 46.4 130.
9 153.
8 87.5 59.9
287.2
Housing, real estate 5.4 11.1 4.2 -1.0 19.9 34.8 19.3 -9.1 25.6 35.2 16.4 -18.9 5.4 41.5 12.0 -30.7
Transportation 3.1 3.5 -1.4 -3.7 22.5 18.1 2.9 -3.4 30.0 17.1 2.5 2.9 36.2 11.9 1.1 SL
Utilities 0.0 -7.0 -10.5 -12.4 216.
2 17.6 SP -19.1
260.7
30.2 SP -14.7 SP -48.8 SP SL
Financials - - - - - - - - 19.6 -26.2 -15.0 -11.3 23.0 -23.3 -7.2 15.4
Note: (1) Q1 = Feb–Apr, Mar–May, or Apr–Jun; Q2 = May–Jul, Jun–Aug, or Jul–Sep; Q3 = Aug–Oct, Sep–Nov, or Oct–Dec; Q4 = Nov–Jan, Dec–Feb, or Jan–Mar. (2) Figures are for companies that had announced results (either full year, Q1, Q2, or Q3) by 24 May 2016. (3) Excludes consolidated subsidiaries. (4) LI = losses increasing; LS = losses shrinking; SL = switch to losses; SP = switch to profits.
Source: Nomura
Nomura | JPN Outlook for FY16–17 corporate earnings June 2, 2016
18
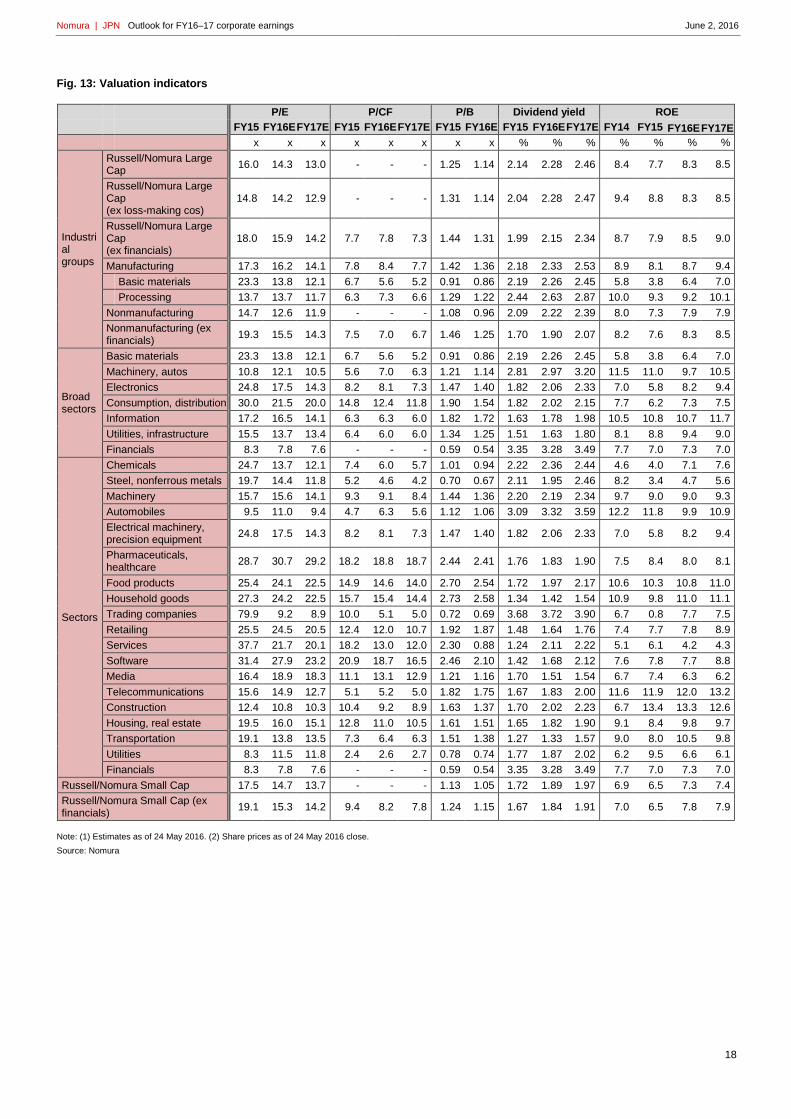
Fig. 13: Valuation indicators
P/E P/CF P/B Dividend yield ROE
FY15 FY16E FY17E FY15 FY16E FY17E FY15 FY16E FY15 FY16E FY17E FY14 FY15 FY16E FY17E
x x x x x x x x % % % % % % %
Industrial groups
Russell/Nomura Large Cap
16.0 14.3 13.0 - - - 1.25 1.14 2.14 2.28 2.46 8.4 7.7 8.3 8.5
Russell/Nomura Large Cap (ex loss-making cos)
14.8 14.2 12.9 - - - 1.31 1.14 2.04 2.28 2.47 9.4 8.8 8.3 8.5
Russell/Nomura Large Cap (ex financials)
18.0 15.9 14.2 7.7 7.8 7.3 1.44 1.31 1.99 2.15 2.34 8.7 7.9 8.5 9.0
Manufacturing 17.3 16.2 14.1 7.8 8.4 7.7 1.42 1.36 2.18 2.33 2.53 8.9 8.1 8.7 9.4
Basic materials 23.3 13.8 12.1 6.7 5.6 5.2 0.91 0.86 2.19 2.26 2.45 5.8 3.8 6.4 7.0
Processing 13.7 13.7 11.7 6.3 7.3 6.6 1.29 1.22 2.44 2.63 2.87 10.0 9.3 9.2 10.1
Nonmanufacturing 14.7 12.6 11.9 - - - 1.08 0.96 2.09 2.22 2.39 8.0 7.3 7.9 7.9
Nonmanufacturing (ex financials)
19.3 15.5 14.3 7.5 7.0 6.7 1.46 1.25 1.70 1.90 2.07 8.2 7.6 8.3 8.5
Broad sectors
Basic materials 23.3 13.8 12.1 6.7 5.6 5.2 0.91 0.86 2.19 2.26 2.45 5.8 3.8 6.4 7.0
Machinery, autos 10.8 12.1 10.5 5.6 7.0 6.3 1.21 1.14 2.81 2.97 3.20 11.5 11.0 9.7 10.5
Electronics 24.8 17.5 14.3 8.2 8.1 7.3 1.47 1.40 1.82 2.06 2.33 7.0 5.8 8.2 9.4
Consumption, distribution 30.0 21.5 20.0 14.8 12.4 11.8 1.90 1.54 1.82 2.02 2.15 7.7 6.2 7.3 7.5
Information 17.2 16.5 14.1 6.3 6.3 6.0 1.82 1.72 1.63 1.78 1.98 10.5 10.8 10.7 11.7
Utilities, infrastructure 15.5 13.7 13.4 6.4 6.0 6.0 1.34 1.25 1.51 1.63 1.80 8.1 8.8 9.4 9.0
Financials 8.3 7.8 7.6 - - - 0.59 0.54 3.35 3.28 3.49 7.7 7.0 7.3 7.0
Sectors
Chemicals 24.7 13.7 12.1 7.4 6.0 5.7 1.01 0.94 2.22 2.36 2.44 4.6 4.0 7.1 7.6
Steel, nonferrous metals 19.7 14.4 11.8 5.2 4.6 4.2 0.70 0.67 2.11 1.95 2.46 8.2 3.4 4.7 5.6
Machinery 15.7 15.6 14.1 9.3 9.1 8.4 1.44 1.36 2.20 2.19 2.34 9.7 9.0 9.0 9.3
Automobiles 9.5 11.0 9.4 4.7 6.3 5.6 1.12 1.06 3.09 3.32 3.59 12.2 11.8 9.9 10.9
Electrical machinery, precision equipment
24.8 17.5 14.3 8.2 8.1 7.3 1.47 1.40 1.82 2.06 2.33 7.0 5.8 8.2 9.4
Pharmaceuticals, healthcare
28.7 30.7 29.2 18.2 18.8 18.7 2.44 2.41 1.76 1.83 1.90 7.5 8.4 8.0 8.1
Food products 25.4 24.1 22.5 14.9 14.6 14.0 2.70 2.54 1.72 1.97 2.17 10.6 10.3 10.8 11.0
Household goods 27.3 24.2 22.5 15.7 15.4 14.4 2.73 2.58 1.34 1.42 1.54 10.9 9.8 11.0 11.1
Trading companies 79.9 9.2 8.9 10.0 5.1 5.0 0.72 0.69 3.68 3.72 3.90 6.7 0.8 7.7 7.5
Retailing 25.5 24.5 20.5 12.4 12.0 10.7 1.92 1.87 1.48 1.64 1.76 7.4 7.7 7.8 8.9
Services 37.7 21.7 20.1 18.2 13.0 12.0 2.30 0.88 1.24 2.11 2.22 5.1 6.1 4.2 4.3
Software 31.4 27.9 23.2 20.9 18.7 16.5 2.46 2.10 1.42 1.68 2.12 7.6 7.8 7.7 8.8
Media 16.4 18.9 18.3 11.1 13.1 12.9 1.21 1.16 1.70 1.51 1.54 6.7 7.4 6.3 6.2
Telecommunications 15.6 14.9 12.7 5.1 5.2 5.0 1.82 1.75 1.67 1.83 2.00 11.6 11.9 12.0 13.2
Construction 12.4 10.8 10.3 10.4 9.2 8.9 1.63 1.37 1.70 2.02 2.23 6.7 13.4 13.3 12.6
Housing, real estate 19.5 16.0 15.1 12.8 11.0 10.5 1.61 1.51 1.65 1.82 1.90 9.1 8.4 9.8 9.7
Transportation 19.1 13.8 13.5 7.3 6.4 6.3 1.51 1.38 1.27 1.33 1.57 9.0 8.0 10.5 9.8
Utilities 8.3 11.5 11.8 2.4 2.6 2.7 0.78 0.74 1.77 1.87 2.02 6.2 9.5 6.6 6.1
Financials 8.3 7.8 7.6 - - - 0.59 0.54 3.35 3.28 3.49 7.7 7.0 7.3 7.0
Russell/Nomura Small Cap 17.5 14.7 13.7 - - - 1.13 1.05 1.72 1.89 1.97 6.9 6.5 7.3 7.4
Russell/Nomura Small Cap (ex financials)
19.1 15.3 14.2 9.4 8.2 7.8 1.24 1.15 1.67 1.84 1.91 7.0 6.5 7.8 7.9
Note: (1) Estimates as of 24 May 2016. (2) Share prices as of 24 May 2016 close.
Source: Nomura
Nomura | JPN Outlook for FY16–17 corporate earnings June 2, 2016
19
What are the Russell/Nomura Japan Equity Indexes? The Russell/Nomura Japan Equity Indexes are Japanese equity indexes developed jointly by Frank Russell Company and the
Global Research Division, Financial Engineering & Technology Research Center, Nomura Securities Co., Ltd.
Russell/Nomura Japan Equity Indexes should be useful in:
Determining investment strategies (strategic asset allocation)
Determining manager structures
Devising asset management benchmarks
Supporting portfolio management activities
Evaluating the performance of various investment styles
Managing risk
Russell/Nomura Japan Equity Indexes have the following characteristics:
They are share price indexes that are weighted by free-float adjusted market capitalization and cover the top 98% of all
listed stocks in terms of float-adjusted market capitalization, thereby offering broad market coverage
In addition to stocks listed on the First Section of the Tokyo Stock Exchange (TSE-1), they include stocks listed on
other exchanges
Because the indexes take into consideration the stable shareholding ratio, they reflect the stocks that are actually
available for investment
There are style indexes for large and small companies and for value and growth stocks
The Prime Index consists of the top 1,000 stocks in the Total Market Index by market cap excluding stable
shareholdings
Stocks are selected quantitatively based on clearly defined criteria
The composition of each index is reviewed once a year.
Complete details of rules for the Russell/Nomura Japan Equity Index can be found in the Russell/Nomura Japan Equity Index
Rulebook.
The intellectual property right and any other rights, in Russell/Nomura Japan Equity Index belong to Nomura Securities Co., Ltd.
("Nomura") and Frank Russell Company ("Russell"). Nomura and Russell do not guarantee accuracy, completeness, reliability,
usefulness, marketability, merchantability or fitness of the Index, and do not account for business activities or services that any
index user and/or its affiliates undertakes with the use of the Index.
Nomura | JPN Outlook for FY16–17 corporate earnings June 2, 2016
20
Any Authors named on this report are Research Analysts unless otherwise indicated
Analyst Certification I, Japan Equity Research, hereby certify (1) that the views expressed in this Research report accurately reflect my personal views about any or all of the subject securities or issuers referred to in this Research report, (2) no part of my compensation was, is or will be directly or indirectly related to the specific recommendations or views expressed in this Research report and (3) no part of my compensation is tied to any specific investment banking transactions performed by Nomura Securities International, Inc., Nomura International plc or any other Nomura Group company.
Important Disclosures The lists of issuers that are affiliates or subsidiaries of Nomura Holdings Inc., the parent company of Nomura Securities Co., Ltd., issuers that have officers who concurrently serve as officers of Nomura Securities Co., Ltd., issuers in which the Nomura Group holds 1% or more of any class of common equity securities and issuers for which Nomura Securities Co., Ltd. has lead managed a public offering of equity or equity linked securities in the past 12 months are available at http://www.nomuraholdings.com/jp/report/. Please contact the Research Product Management Dept. of Nomura Securities Co., Ltd. for additional information. Online availability of research and conflict-of-interest disclosures Nomura research is available on www.nomuranow.com/research, Bloomberg, Capital IQ, Factset, MarkitHub, Reuters and ThomsonOne. Important disclosures may be read at http://go.nomuranow.com/research/globalresearchportal/pages/disclosures/disclosures.aspx or requested from Nomura Securities International, Inc., on 1-877-865-5752. If you have any difficulties with the website, please email [email protected] for help. The analysts responsible for preparing this report have received compensation based upon various factors including the firm's total revenues, a portion of which is generated by Investment Banking activities. Unless otherwise noted, the non-US analysts listed at the front of this report are not registered/qualified as research analysts under FINRA rules, may not be associated persons of NSI, and may not be subject to FINRA Rule 2241 restrictions on communications with covered companies, public appearances, and trading securities held by a research analyst account.
Nomura Global Financial Products Inc. (“NGFP”) Nomura Derivative Products Inc. (“NDPI”) and Nomura International plc. (“NIplc”) are registered with the Commodities Futures Trading Commission and the National Futures Association (NFA) as swap dealers. NGFP, NDPI, and NIplc are generally engaged in the trading of swaps and other derivative products, any of which may be the subject of this report. Any authors named in this report are research analysts unless otherwise indicated. Industry Specialists identified in some Nomura International plc research reports are employees within the Firm who are responsible for the sales and trading effort in the sector for which they have coverage. Industry Specialists do not contribute in any manner to the content of research reports in which their names appear. Distribution of ratings (Global) The distribution of all ratings published by Nomura Global Equity Research is as follows: 49% have been assigned a Buy rating which, for purposes of mandatory disclosures, are classified as a Buy rating; 38% of companies with this rating are investment banking clients of the Nomura Group*. 42% have been assigned a Neutral rating which, for purposes of mandatory disclosures, is classified as a Hold rating; 53% of companies with this rating are investment banking clients of the Nomura Group*. 9% have been assigned a Reduce rating which, for purposes of mandatory disclosures, are classified as a Sell rating; 17% of companies with this rating are investment banking clients of the Nomura Group*. As at 31 March 2016. *The Nomura Group as defined in the Disclaimer section at the end of this report. Explanation of Nomura's equity research rating system in Europe, Middle East and Africa, US and Latin America, and Japan and Asia ex-Japan from 21 October 2013 The rating system is a relative system, indicating expected performance against a specific benchmark identified for each individual stock, subject to limited management discretion. An analyst’s target price is an assessment of the current intrinsic fair value of the stock based on an appropriate valuation methodology determined by the analyst. Valuation methodologies include, but are not limited to, discounted cash flow analysis, expected return on equity and multiple analysis. Analysts may also indicate expected absolute upside/downside relative to the stated target price, defined as (target price - current price)/current price.
STOCKS A rating of 'Buy', indicates that the analyst expects the stock to outperform the Benchmark over the next 12 months. A rating of 'Neutral', indicates that the analyst expects the stock to perform in line with the Benchmark over the next 12 months. A rating of 'Reduce', indicates that the analyst expects the stock to underperform the Benchmark over the next 12 months. A rating of 'Suspended', indicates that the rating, target price and estimates have been suspended temporarily to comply with applicable regulations and/or firm policies. Securities and/or companies that are labelled as 'Not rated' or shown as 'No rating' are not in regular research coverage. Investors should not expect continuing or additional information from Nomura relating to such securities and/or companies. Benchmarks are as follows: United States/Europe/Asia ex-Japan: please see valuation methodologies for explanations of relevant benchmarks for stocks, which can be accessed at: http://go.nomuranow.com/research/globalresearchportal/pages/disclosures/disclosures.aspx; Global Emerging Markets (ex-Asia): MSCI Emerging Markets ex-Asia, unless otherwise stated in the valuation methodology; Japan: Russell/Nomura Large Cap.
SECTORS A 'Bullish' stance, indicates that the analyst expects the sector to outperform the Benchmark during the next 12 months. A 'Neutral' stance, indicates that the analyst expects the sector to perform in line with the Benchmark during the next 12 months. A 'Bearish' stance, indicates that the analyst expects the sector to underperform the Benchmark during the next 12 months. Sectors that are labelled as 'Not rated' or shown as 'N/A' are not assigned ratings. Benchmarks are as follows: United States: S&P 500; Europe: Dow Jones STOXX 600; Global Emerging Markets (ex-Asia): MSCI Emerging Markets ex-Asia. Japan/Asia ex-Japan: Sector ratings are not assigned.
Explanation of Nomura's equity research rating system in Japan and Asia ex-Japan prior to 21 October 2013 STOCKS
Nomura | JPN Outlook for FY16–17 corporate earnings June 2, 2016
21
Stock recommendations are based on absolute valuation upside (downside), which is defined as (Target Price - Current Price) / Current Price, subject to limited management discretion. In most cases, the Target Price will equal the analyst's 12-month intrinsic valuation of the stock, based on an appropriate valuation methodology such as discounted cash flow, multiple analysis, etc. A 'Buy' recommendation indicates that potential upside is 15% or more. A 'Neutral' recommendation indicates that potential upside is less than 15% or downside is less than 5%. A 'Reduce' recommendation indicates that potential downside is 5% or more. A rating of 'Suspended' indicates that the rating and target price have been suspended temporarily to comply with applicable regulations and/or firm policies in certain circumstances including when Nomura is acting in an advisory capacity in a merger or strategic transaction involving the subject company. Securities and/or companies that are labelled as 'Not rated' or shown as 'No rating' are not in regular research coverage of the Nomura entity identified in the top banner. Investors should not expect continuing or additional information from Nomura relating to such securities and/or companies.
SECTORS A 'Bullish' rating means most stocks in the sector have (or the weighted average recommendation of the stocks under coverage is) a positive absolute recommendation. A 'Neutral' rating means most stocks in the sector have (or the weighted average recommendation of the stocks under coverage is) a neutral absolute recommendation. A 'Bearish' rating means most stocks in the sector have (or the weighted average recommendation of the stocks under coverage is) a negative absolute recommendation. Target Price A Target Price, if discussed, reflect in part the analyst's estimates for the company's earnings. The achievement of any target price may be impeded by general market and macroeconomic trends, and by other risks related to the company or the market, and may not occur if the company's earnings differ from estimates. Disclaimers This document contains material that has been prepared by the Nomura entity identified on page 1 and/or with the sole or joint contributions of one or more Nomura entities whose employees and their respective affiliations are also specified on page 1 or identified elsewhere in the document. The term "Nomura Group" used herein refers to Nomura Holdings, Inc. or any of its affiliates or subsidiaries and may refer to one or more Nomura Group companies including: Nomura Securities Co., Ltd. ('NSC') Tokyo, Japan; Nomura International plc ('NIplc'), UK; Nomura Securities International, Inc. ('NSI'), New York, US; Nomura International (Hong Kong) Ltd. (‘NIHK’), Hong Kong; Nomura Financial Investment (Korea) Co., Ltd. (‘NFIK’), Korea (Information on Nomura analysts registered with the Korea Financial Investment Association ('KOFIA') can be found on the KOFIA Intranet at http://dis.kofia.or.kr); Nomura Singapore Ltd. (‘NSL’), Singapore (Registration number 197201440E, regulated by the Monetary Authority of Singapore); Nomura Australia Ltd. (‘NAL’), Australia (ABN 48 003 032 513), regulated by the Australian Securities and Investment Commission ('ASIC') and holder of an Australian financial services licence number 246412; P.T. Nomura Indonesia (‘PTNI’), Indonesia; Nomura Securities Malaysia Sdn. Bhd. (‘NSM’), Malaysia; NIHK, Taipei Branch (‘NITB’), Taiwan; Nomura Financial Advisory and Securities (India) Private Limited (‘NFASL’), Mumbai, India (Registered Address: Ceejay House, Level 11, Plot F, Shivsagar Estate, Dr. Annie Besant Road, Worli, Mumbai- 400 018, India; Tel: +91 22 4037 4037, Fax: +91 22 4037 4111; CIN No: U74140MH2007PTC169116, SEBI Registration No. for Stock Broking activities : BSE INB011299030, NSE INB231299034, INF231299034, INE 231299034, MCX: INE261299034; SEBI Registration No. for Merchant Banking : INM000011419; SEBI Registration No. for Research: INH000001014 and NIplc, Madrid Branch (‘NIplc, Madrid’). ‘CNS Thailand’ next to an analyst’s name on the front page of a research report indicates that the analyst is employed by Capital Nomura Securities Public Company Limited (‘CNS’) to provide research assistance services to NSL under a Research Assistance Agreement. ‘NSFSPL’ next to an employee’s name on the front page of a research report indicates that the individual is employed by Nomura Structured Finance Services Private Limited to provide assistance to certain Nomura entities under inter-company agreements. THIS MATERIAL IS: (I) FOR YOUR PRIVATE INFORMATION, AND WE ARE NOT SOLICITING ANY ACTION BASED UPON IT; (II) NOT TO BE CONSTRUED AS AN OFFER TO SELL OR A SOLICITATION OF AN OFFER TO BUY ANY SECURITY IN ANY JURISDICTION WHERE SUCH OFFER OR SOLICITATION WOULD BE ILLEGAL; AND (III) BASED UPON INFORMATION FROM SOURCES THAT WE CONSIDER RELIABLE, BUT HAS NOT BEEN INDEPENDENTLY VERIFIED BY NOMURA GROUP. Nomura Group does not warrant or represent that the document is accurate, complete, reliable, fit for any particular purpose or merchantable and does not accept liability for any act (or decision not to act) resulting from use of this document and related data. To the maximum extent permissible all warranties and other assurances by Nomura group are hereby excluded and Nomura Group shall have no liability for the use, misuse, or distribution of this information. Opinions or estimates expressed are current opinions as of the original publication date appearing on this material and the information, including the opinions and estimates contained herein, are subject to change without notice. Nomura Group is under no duty to update this document. Any comments or statements made herein are those of the author(s) and may differ from views held by other parties within Nomura Group. Clients should consider whether any advice or recommendation in this report is suitable for their particular circumstances and, if appropriate, seek professional advice, including tax advice. Nomura Group does not provide tax advice. Nomura Group, and/or its officers, directors and employees, may, to the extent permitted by applicable law and/or regulation, deal as principal, agent, or otherwise, or have long or short positions in, or buy or sell, the securities, commodities or instruments, or options or other derivative instruments based thereon, of issuers or securities mentioned herein. Nomura Group companies may also act as market maker or liquidity provider (within the meaning of applicable regulations in the UK) in the financial instruments of the issuer. Where the activity of market maker is carried out in accordance with the definition given to it by specific laws and regulations of the US or other jurisdictions, this will be separately disclosed within the specific issuer disclosures. This document may contain information obtained from third parties, including ratings from credit ratings agencies such as Standard & Poor’s. Reproduction and distribution of third-party content in any form is prohibited except with the prior written permission of the related third-party. Third-party content providers do not guarantee the accuracy, completeness, timeliness or availability of any information, including ratings, and are not responsible for any errors or omissions (negligent or otherwise), regardless of the cause, or for the results obtained from the use of such content. Third-party content providers give no express or implied warranties, including, but not limited to, any warranties of merchantability or fitness for a particular purpose or use. Third-party content providers shall not be liable for any direct, indirect, incidental, exemplary, compensatory, punitive, special or consequential damages, costs, expenses, legal fees, or losses (including lost income or profits and opportunity costs) in connection with any use of their content, including ratings. Credit ratings are statements of opinions and are not statements of fact or recommendations to purchase hold or sell securities. They do not address the suitability of securities or the suitability of securities for investment purposes, and should not be relied on as investment advice. Any MSCI sourced information in this document is the exclusive property of MSCI Inc. (‘MSCI’). Without prior written permission of MSCI, this information and any other MSCI intellectual property may not be reproduced, re-disseminated or used to create any financial products, including any indices. This information is provided on an "as is" basis. The user assumes the entire risk of any use made of this information. MSCI, its affiliates and any third party involved in, or related to, computing or compiling the information hereby expressly disclaim all warranties of originality, accuracy, completeness, merchantability or fitness for a particular purpose with respect to any of this information. Without limiting any
Nomura | JPN Outlook for FY16–17 corporate earnings June 2, 2016
22
of the foregoing, in no event shall MSCI, any of its affiliates or any third party involved in, or related to, computing or compiling the information have any liability for any damages of any kind. MSCI and the MSCI indexes are services marks of MSCI and its affiliates. The intellectual property right and any other rights, in Russell/Nomura Japan Equity Index belong to Nomura Securities Co., Ltd. ("Nomura") and Frank Russell Company ("Russell"). Nomura and Russell do not guarantee accuracy, completeness, reliability, usefulness, marketability, merchantability or fitness of the Index, and do not account for business activities or services that any index user and/or its affiliates undertakes with the use of the Index. Investors should consider this document as only a single factor in making their investment decision and, as such, the report should not be viewed as identifying or suggesting all risks, direct or indirect, that may be associated with any investment decision. Nomura Group produces a number of different types of research product including, among others, fundamental analysis and quantitative analysis; recommendations contained in one type of research product may differ from recommendations contained in other types of research product, whether as a result of differing time horizons, methodologies or otherwise. Nomura Group publishes research product in a number of different ways including the posting of product on Nomura Group portals and/or distribution directly to clients. Different groups of clients may receive different products and services from the research department depending on their individual requirements. Figures presented herein may refer to past performance or simulations based on past performance which are not reliable indicators of future performance. Where the information contains an indication of future performance, such forecasts may not be a reliable indicator of future performance. Moreover, simulations are based on models and simplifying assumptions which may oversimplify and not reflect the future distribution of returns. Certain securities are subject to fluctuations in exchange rates that could have an adverse effect on the value or price of, or income derived from, the investment. The securities described herein may not have been registered under the US Securities Act of 1933 (the ‘1933 Act’), and, in such case, may not be offered or sold in the US or to US persons unless they have been registered under the 1933 Act, or except in compliance with an exemption from the registration requirements of the 1933 Act. Unless governing law permits otherwise, any transaction should be executed via a Nomura entity in your home jurisdiction. This document has been approved for distribution in the UK and European Economic Area as investment research by NIplc. NIplc is authorised by the Prudential Regulation Authority and regulated by the Financial Conduct Authority and the Prudential Regulation Authority. NIplc is a member of the London Stock Exchange. This document does not constitute a personal recommendation within the meaning of applicable regulations in the UK, or take into account the particular investment objectives, financial situations, or needs of individual investors. This document is intended only for investors who are 'eligible counterparties' or 'professional clients' for the purposes of applicable regulations in the UK, and may not, therefore, be redistributed to persons who are 'retail clients' for such purposes. This document has been approved by NIHK, which is regulated by the Hong Kong Securities and Futures Commission, for distribution in Hong Kong by NIHK. This document has been approved for distribution in Australia by NAL, which is authorized and regulated in Australia by the ASIC. This document has also been approved for distribution in Malaysia by NSM. In Singapore, this document has been distributed by NSL. NSL accepts legal responsibility for the content of this document, where it concerns securities, futures and foreign exchange, issued by their foreign affiliates in respect of recipients who are not accredited, expert or institutional investors as defined by the Securities and Futures Act (Chapter 289). Recipients of this document in Singapore should contact NSL in respect of matters arising from, or in connection with, this document. Unless prohibited by the provisions of Regulation S of the 1933 Act, this material is distributed in the US, by NSI, a US-registered broker-dealer, which accepts responsibility for its contents in accordance with the provisions of Rule 15a-6, under the US Securities Exchange Act of 1934. The entity that prepared this document permits its separately operated affiliates within the Nomura Group to make copies of such documents available to their clients. This document has not been approved for distribution to persons other than ‘Authorised Persons’, ‘Exempt Persons’ or ‘Institutions’ (as defined by the Capital Markets Authority) in the Kingdom of Saudi Arabia (‘Saudi Arabia’) or 'professional clients' (as defined by the Dubai Financial Services Authority) in the United Arab Emirates (‘UAE’) or a ‘Market Counterparty’ or ‘Business Customers’ (as defined by the Qatar Financial Centre Regulatory Authority) in the State of Qatar (‘Qatar’) by Nomura Saudi Arabia, NIplc or any other member of Nomura Group, as the case may be. Neither this document nor any copy thereof may be taken or transmitted or distributed, directly or indirectly, by any person other than those authorised to do so into Saudi Arabia or in the UAE or in Qatar or to any person other than ‘Authorised Persons’, ‘Exempt Persons’ or ‘Institutions’ located in Saudi Arabia or 'professional clients' in the UAE or a ‘Market Counterparty’ or ‘Business Customers’ in Qatar . By accepting to receive this document, you represent that you are not located in Saudi Arabia or that you are an ‘Authorised Person’, an ‘Exempt Person’ or an ‘Institution’ in Saudi Arabia or that you are a 'professional client' in the UAE or a ‘Market Counterparty’ or ‘Business Customers’ in Qatar and agree to comply with these restrictions. Any failure to comply with these restrictions may constitute a violation of the laws of the UAE or Saudi Arabia or Qatar. NO PART OF THIS MATERIAL MAY BE (I) COPIED, PHOTOCOPIED, OR DUPLICATED IN ANY FORM, BY ANY MEANS; OR (II) REDISTRIBUTED WITHOUT THE PRIOR WRITTEN CONSENT OF A MEMBER OF NOMURA GROUP. If this document has been distributed by electronic transmission, such as e-mail, then such transmission cannot be guaranteed to be secure or error-free as information could be intercepted, corrupted, lost, destroyed, arrive late or incomplete, or contain viruses. The sender therefore does not accept liability for any errors or omissions in the contents of this document, which may arise as a result of electronic transmission. If verification is required, please request a hard-copy version. ------ Disclaimers required in Japan Credit ratings in the text that are marked with an asterisk (*) are issued by a rating agency not registered under Japan’s Financial Instruments and Exchange Act (“Unregistered Ratings”). For details on Unregistered Ratings, please contact the Research Product Management Dept. of Nomura Securities Co., Ltd. Investors in the financial products offered by Nomura Securities may incur fees and commissions specific to those products (for example, transactions involving Japanese equities are subject to a sales commission of up to 1.404% on a tax-inclusive basis of the transaction amount or a commission of ¥2,808 for transactions of ¥200,000 or less, while transactions involving investment trusts are subject to various fees, such as commissions at the time of purchase and asset management fees (trust fees), specific to each investment trust). In addition, all products carry the risk of losses owing to price fluctuations or other factors. Fees and risks vary by product. Please thoroughly read the written materials provided, such as documents delivered before making a contract, listed securities documents, or prospectuses. ------ Transactions involving Japanese equities (including Japanese REITs, Japanese ETFs, and Japanese ETNs) are subject to a sales commission of up to 1.404% of the transaction amount (or a commission of ¥2,808 for transactions of ¥200,000 or less). When Japanese equities are purchased via OTC transactions (including offerings), only the purchase price shall be paid, with no sales commission charged. However, Nomura Securities may charge a separate fee for OTC transactions, as agreed with the customer. Japanese equities carry the risk of losses owing to price fluctuations. Japanese REITs carry the risk of losses owing to fluctuations in price and/or earnings of underlying real estate. Japanese ETFs carry the risk of losses owing to fluctuations in the underlying indexes or other benchmarks. Transactions involving foreign equities are subject to a domestic sales commission of up to 1.026% of the transaction amount (which equals the local transaction amount plus local fees and taxes in the case of a purchase or the local transaction amount minus local fees and taxes in the case of a sale) (for transaction amounts of ¥750,000 and below, maximum domestic sales commission is ¥7,668). Local fees and taxes in foreign financial instruments markets vary by country/territory. When foreign equities are purchased via OTC transactions (including offerings),
Nomura | JPN Outlook for FY16–17 corporate earnings June 2, 2016
23
only the purchase price shall be paid, with no sales commission charged. However, Nomura Securities may charge a separate fee for OTC transactions, as agreed with the customer. Foreign equities carry the risk of losses owing to factors such as price fluctuations and foreign exchange rate fluctuations. Margin transactions are subject to a sales commission of up to 1.404% of the transaction amount (or a commission of ¥2,808 for transactions of ¥200,000 or less), as well as management fees and rights handling fees. In addition, long margin transactions are subject to interest on the purchase amount, while short margin transactions are subject to fees for the lending of the shares borrowed. A margin equal to at least 30% of the transaction amount and at least ¥300,000 is required. With margin transactions, an amount up to roughly 3.3x the margin may be traded. Margin transactions therefore carry the risk of losses in excess of the margin owing to share price fluctuations. For details, please thoroughly read the written materials provided, such as listed securities documents or documents delivered before making a contract. Transactions involving convertible bonds are subject to a sales commission of up to 1.08% of the transaction amount (or a commission of ¥4,320 if this would be less than ¥4,320). When convertible bonds are purchased via OTC transactions (including offerings), only the purchase price shall be paid, with no sales commission charged. However, Nomura Securities may charge a separate fee for OTC transactions, as agreed with the customer. Convertible bonds carry the risk of losses owing to factors such as interest rate fluctuations and price fluctuations in the underlying stock. In addition, convertible bonds denominated in foreign currencies also carry the risk of losses owing to factors such as foreign exchange rate fluctuations. When bonds are purchased via public offerings, secondary distributions, or other OTC transactions with Nomura Securities, only the purchase price shall be paid, with no sales commission charged. Bonds carry the risk of losses, as prices fluctuate in line with changes in market interest rates. Bond prices may also fall below the invested principal as a result of such factors as changes in the management and financial circumstances of the issuer, or changes in third-party valuations of the bond in question. In addition, foreign currency-denominated bonds also carry the risk of losses owing to factors such as foreign exchange rate fluctuations. When Japanese government bonds (JGBs) for individual investors are purchased via public offerings, only the purchase price shall be paid, with no sales commission charged. As a rule, JGBs for individual investors may not be sold in the first 12 months after issuance. When JGBs for individual investors are sold before maturity, an amount calculated via the following formula will be subtracted from the par value of the bond plus accrued interest: (1) for 10-year variable rate bonds, an amount equal to the two preceding coupon payments (before tax) x 0.79685 will be used, (2) for 5-year and 3-year fixed rate bonds, an amount equal to the two preceding coupon payments (before tax) x 0.79685 will be used. When inflation-indexed JGBs are purchased via public offerings, secondary distributions (uridashi deals), or other OTC transactions with Nomura Securities, only the purchase price shall be paid, with no sales commission charged. Inflation-indexed JGBs carry the risk of losses, as prices fluctuate in line with changes in market interest rates and fluctuations in the nationwide consumer price index.The notional principal of inflation-indexed JGBs changes in line with the rate of change in nationwide CPI inflation from the time of its issuance. The amount of the coupon payment is calculated by multiplying the coupon rate by the notional principal at the time of payment. The maturity value is the amount of the notional principal when the issue becomes due. For JI17 and subsequent issues, the maturity value shall not undercut the face amount. Purchases of investment trusts (and sales of some investment trusts) are subject to a purchase or sales fee of up to 5.4% of the transaction amount. Also, a direct cost that may be incurred when selling investment trusts is a fee of up to 2.0% of the unit price at the time of redemption. Indirect costs that may be incurred during the course of holding investment trusts include, for domestic investment trusts, an asset management fee (trust fee) of up to 5.4% (annualized basis) of the net assets in trust, as well as fees based on investment performance. Other indirect costs may also be incurred. For foreign investment trusts, indirect fees may be incurred during the course of holding such as investment company compensation. Investment trusts invest mainly in securities such as Japanese and foreign equities and bonds, whose prices fluctuate. Investment trust unit prices fluctuate owing to price fluctuations in the underlying assets and to foreign exchange rate fluctuations. As such, investment trusts carry the risk of losses. Fees and risks vary by investment trust. Maximum applicable fees are subject to change; please thoroughly read the written materials provided, such as prospectuses or documents delivered before making a contract. In interest rate swap transactions and USD/JPY basis swap transactions (“interest rate swap transactions, etc.”), only the agreed transaction payments shall be made on the settlement dates. Some interest rate swap transactions, etc. may require pledging of margin collateral. In some of these cases, transaction payments may exceed the amount of collateral. There shall be no advance notification of required collateral value or collateral ratios as they vary depending on the transaction. Interest rate swap transactions, etc. carry the risk of losses owing to fluctuations in market prices in the interest rate, currency and other markets, as well as reference indices. Losses incurred as such may exceed the value of margin collateral, in which case margin calls may be triggered. In the event that both parties agree to enter a replacement (or termination) transaction, the interest rates received (paid) under the new arrangement may differ from those in the original arrangement, even if terms other than the interest rates are identical to those in the original transaction. Risks vary by transaction. Please thoroughly read the written materials provided, such as documents delivered before making a contract and disclosure statements. In OTC transactions of credit default swaps (CDS), no sales commission will be charged. When entering into CDS transactions, the protection buyer will be required to pledge or entrust an agreed amount of margin collateral. In some of these cases, the transaction payments may exceed the amount of margin collateral. There shall be no advance notification of required collateral value or collateral ratios as they vary depending on the financial position of the protection buyer. CDS transactions carry the risk of losses owing to changes in the credit position of some or all of the referenced entities, and/or fluctuations of the interest rate market. The amount the protection buyer receives in the event that the CDS is triggered by a credit event may undercut the total amount of premiums that he/she has paid in the course of the transaction. Similarly, the amount the protection seller pays in the event of a credit event may exceed the total amount of premiums that he/she has received in the transaction. All other conditions being equal, the amount of premiums that the protection buyer pays and that received by the protection seller shall differ. In principle, CDS transactions will be limited to financial instruments business operators and qualified institutional investors. No account fee will be charged for marketable securities or monies deposited. Transfers of equities to another securities company via the Japan Securities Depository Center are subject to a transfer fee of up to ¥10,800 per issue transferred depending on volume.
Nomura Securities Co., Ltd. Financial instruments firm registered with the Kanto Local Finance Bureau (registration No. 142) Member associations: Japan Securities Dealers Association; Japan Investment Advisers Association; The Financial Futures Association of Japan; and Type II Financial Instruments Firms Association. Nomura Group manages conflicts with respect to the production of research through its compliance policies and procedures (including, but not limited to, Conflicts of Interest, Chinese Wall and Confidentiality policies) as well as through the maintenance of Chinese walls and employee training. Additional information is available upon request and disclosure information is available at the Nomura Disclosure web page: http://go.nomuranow.com/research/globalresearchportal/pages/disclosures/disclosures.aspx Copyright © 2016 Nomura Securities Co., Ltd. All rights reserved.


![Transcript of Q4 & FY16 Earnings Conference Call [Company Update]](https://static.documents.pub/doc/80x56/577c78401a28abe0548f4661/transcript-of-q4-fy16-earnings-conference-call-company-update.jpg)


