43
Outlook for the Auto Industry University of Michigan * Auto Lunch Series September 11, 2006
| Date post: | 02-Jan-2016 |
| Category: |
Documents |
| Upload: | egbert-boyd |
| View: | 215 times |
| Download: | 0 times |

Outlook for the Auto Industry
University of Michigan * Auto Lunch SeriesSeptember 11, 2006

DC Strategy, Alliances & Business DevelopmentEconomic & Market Intelligence (S/E)
Ability To Buy
August ’05 August
‘06
Disposable Income Green Yellow
Household Debt Green Yellow
Yield Curve Green Red
Inflation Green Red
Composite Green Red
Auto Industry Leading Indicators
DC Strategy, Alliances & Business DevelopmentEconomic & Market Intelligence (S/E)
-8
-6
-4
-2
0
2
4
6
8
'82 '84 '86 '88 '90 '92 '94 '96 '98 '00 '02 '04 '06
% ChangeYear Over Year
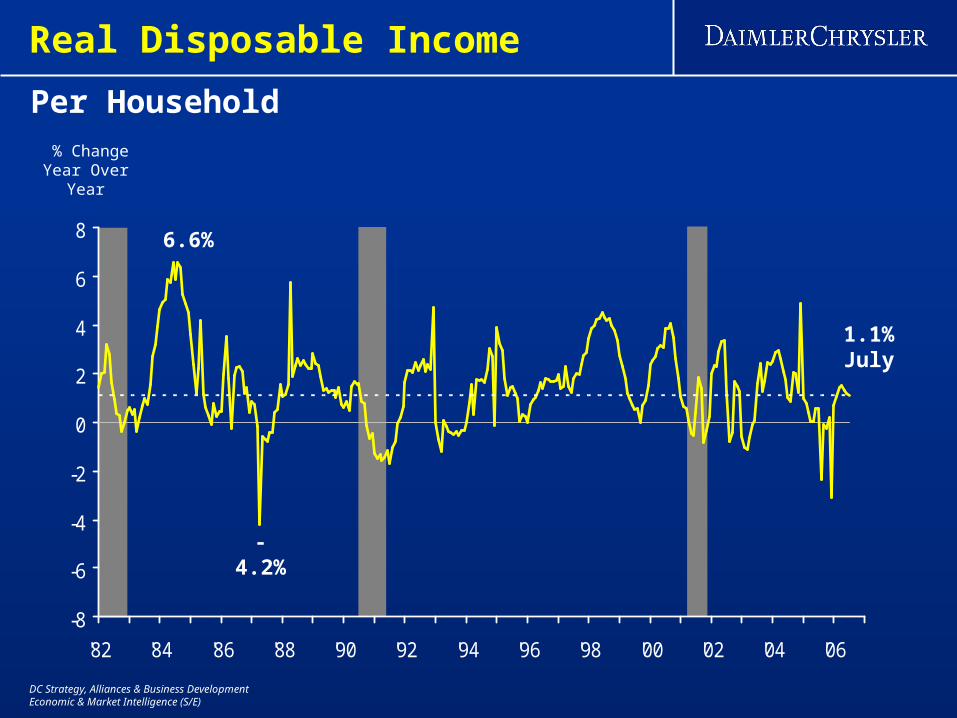
6.6%
- 4.2%
1.1% July
Real Disposable Income
Per Household
DC Strategy, Alliances & Business DevelopmentEconomic & Market Intelligence (S/E)
10.5%
11.0%
11.5%
12.0%
12.5%
13.0%
13.5%
14.0%
14.5%
15.0%
15.5%
'83 '85 '87 '89 '91 '93 '95 '97 '99 '01 '03 '05 '07
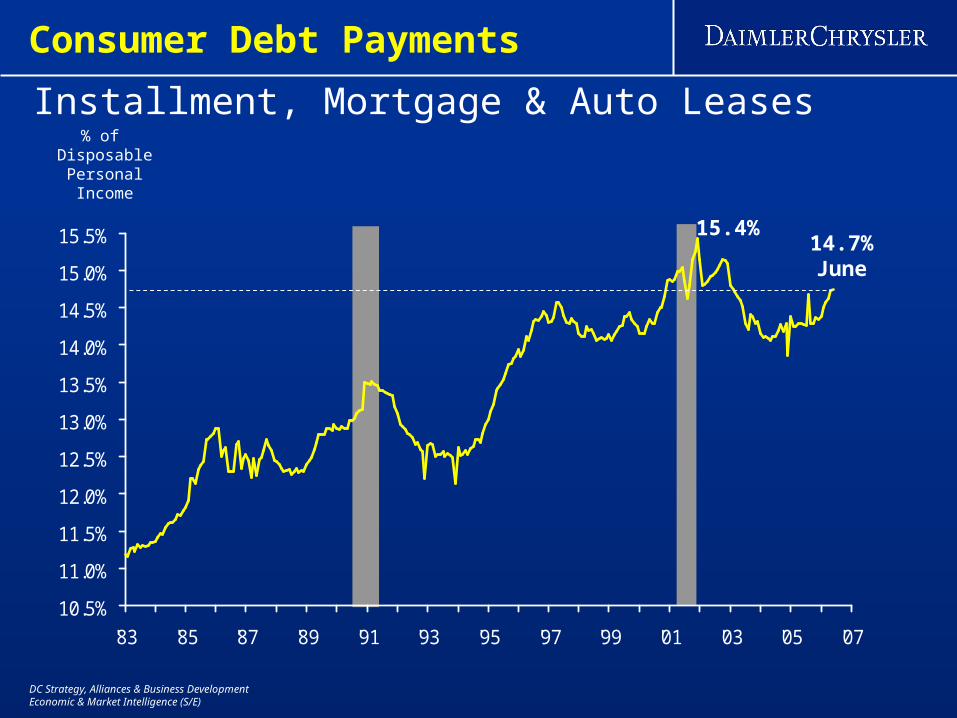
Installment, Mortgage & Auto Leases
% of DisposablePersonal Income
15.4%
Consumer Debt Payments
14.7%June

DC Strategy, Alliances & Business DevelopmentEconomic & Market Intelligence (S/E)
-4
-2
0
2
4
6
'57 '61 '65 '69 '73 '77 '81 '85 '89 '93 '97 '01 '05
10 Yr Minus 1 Yr Treasuries
PercentagePoints
-15 -11
OilShock
OilShock
- 0.21%Aug
-12 -19 -13 -14 -12
The Yield Curve

DC Strategy, Alliances & Business DevelopmentEconomic & Market Intelligence (S/E)
0.0
1.0
2.0
3.0
4.0
5.0
6.0
7.0
'00 '01 '02 '03 '04 '05 '06 '07
Percent
5.25
6.50
1.00
U.S. Federal Funds Target

DC Strategy, Alliances & Business DevelopmentEconomic & Market Intelligence (S/E)
-4
-2
0
2
4
6
8
10
12
14
16
18
'78 '80 '82 '84 '86 '88 '90 '92 '94 '96 '98 '00 '02 '04 '06
All Items, Not Seasonally Adjusted
% Change Yr/Yr
6.3% 4.1% July
14.8%
Consumer Prices

DC Strategy, Alliances & Business DevelopmentEconomic & Market Intelligence (S/E)
0
2
4
6
8
10
12
14
16
18
'78 '80 '82 '84 '86 '88 '90 '92 '94 '96 '98 '00 '02 '04 '06
5.6%
All Items Less Food & Energy, NSA
% Change Yr/Yr
2.7% July
13.6%
Consumer Prices: Core Inflation

DC Strategy, Alliances & Business DevelopmentEconomic & Market Intelligence (S/E)
-2.5%
-1.5%
-0.5%
0.5%
1.5%
2.5%
3.5%
4.5%
'90 '91 '92 '93 '94 '95 '96 '97 '98 '99 '00 '01 '02 '03 '04 '05 '06 '07
% Change Year/Year
+ 0.4%July
Monthly Data
New Vehicle Consumer Prices

DC Strategy, Alliances & Business DevelopmentEconomic & Market Intelligence (S/E)
Willingness to Buy
'91 '92 '93 '94 '95 '96 '97 '98 '99 '00-10
-5
0
5
10
15
20
August ’05 August
‘06
Consumer Attitudes Green Yellow
Unemployment Claims Green Green
Workweek Yellow Green
Stock Market Green Green
Composite Green Green
Auto Industry Leading Indicators

DC Strategy, Alliances & Business DevelopmentEconomic & Market Intelligence (S/E)
40
60
80
100
120
140
'82 '84 '86 '88 '90 '92 '94 '96 '98 '00 '02 '04 '06
Index
58.1
90.8 Aug
Consumer Attitudes
128.4
Average of U of M & Conference Board
Source: University of Michigan & The Conference Board

DC Strategy, Alliances & Business DevelopmentEconomic & Market Intelligence (S/E)
70
80
90
100
110
120
130
140
150
160
170
'82 '84 '86 '88 '90 '92 '94 '96 '98 '00 '02 '04 '06
Index
165
119
124August
Buying Conditions for Vehicles
104
Bad
Good
164
Source: University of Michigan
During Next 12 Months
DC Strategy, Alliances & Business DevelopmentEconomic & Market Intelligence (S/E)
20
40
60
80
100
120
140
160
180
200
'82 '84 '86 '88 '90 '92 '94 '96 '98 '00 '02 '04 '06
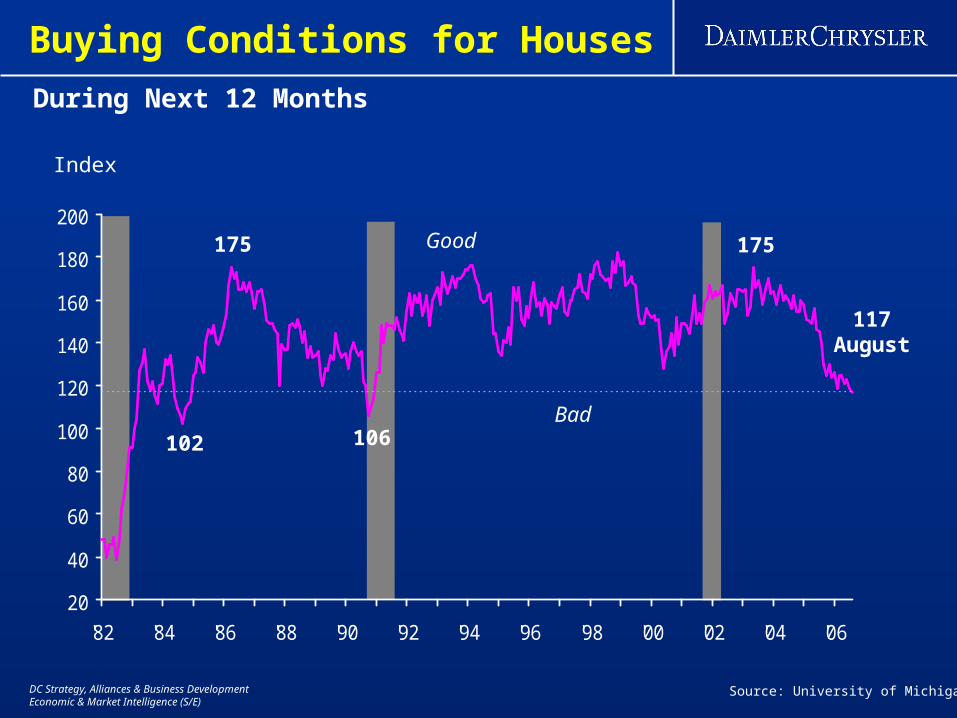
During Next 12 Months
Index
175
102
117 August
Buying Conditions for Houses
106Bad
Good 175
Source: University of Michigan

DC Strategy, Alliances & Business DevelopmentEconomic & Market Intelligence (S/E)
200
300
400
500
600
700
'82 '84 '86 '88 '90 '92 '94 '96 '98 '00 '02 '04 '06
Thousands
Initial Unemployment Claims
501
674
268287
315
497
4 Week Moving Average

DC Strategy, Alliances & Business DevelopmentEconomic & Market Intelligence (S/E)
37
38
39
40
41
42
43
'82 '84 '86 '88 '90 '92 '94 '96 '98 '00 '02 '04 '06
Includes Part-time & Overtime
Hours
41.3 August
Manufacturing Workweek
40.039.7

DC Strategy, Alliances & Business DevelopmentEconomic & Market Intelligence (S/E)
4.4 4.3
-0.1
2.3
3.6
0.40.2
5.1
1.9
-0.6
6.37.0
1.1
4.1
0.0
3.0
6.0
1.8
5.6
-0.5
1.6
-2
0
2
4
6
8
10
Q1 '01 Q1 '02 Q1 '03 Q1 '04 Q1 '05 Q1 '06
% ChangePrevious Quarter
SAAR
U. S. Productivity
9.6

DC Strategy, Alliances & Business DevelopmentEconomic & Market Intelligence (S/E)
0
2,000
4,000
6,000
8,000
10,000
12,000
'82 '84 '86 '88 '90 '92 '94 '96 '98 '00 '02 '04 '06
11,257Aug
Index
Stock Market
Dow Jones Industrial Average

DC Strategy, Alliances & Business DevelopmentEconomic & Market Intelligence (S/E)
-2
-1
0
1
2
3
4
5
6
7
8
'00 '01 '02 '03 '04 '05 '06
U. S. Economic Growth
% change
7.5%
6.4%
5.6%
Quarterly SAAR Data
2.9%

The Effect of Gas Prices on Auto Sales

DC Strategy, Alliances & Business DevelopmentEconomic & Market Intelligence (S/E)
2004 2005YTD2006
Total Industry 17.3 17.4 17.2
Light Vehicles, Million Units
U. S. Auto Industry Sales

DC Strategy, Alliances & Business DevelopmentEconomic & Market Intelligence (S/E)
2005 Dollars Per Barrel
Oil Prices
OilShock
OilShock
0
10
20
30
40
50
60
70
80
90
100
'70 '72 '74 '76 '78 '80 '82 '84 '86 '88 '90 '92 '94 '96 '98 '00 '02 '04 '06
$ 73 August
Real
Nominal
$94

DC Strategy, Alliances & Business DevelopmentEconomic & Market Intelligence (S/E)
OPEC Spare Capacity
0
1
2
3
4
5
'99 '00 '01 '02 '03 '04 '05 '06
MMB/D
PIRA Forecast

DC Strategy, Alliances & Business DevelopmentEconomic & Market Intelligence (S/E)
Major Output Risks
Iraq: 1.9 MMB/DPipeline SabotagePolitical Instability
Saudi Arabia: 9.3 MMB/DInfrastructure Sabotage
Venezuela: 2.6 MMB/DPost-Referendum
Lack of InvestmentLingering Strike Effects
Russia: 9.3 MMB/DYukos Affair
Pipeline SabotageChechnya
Nigeria: 2.3 MMB/DLabor TensionsEthnic Tensions
WeatherAccidents
Loading Delays
NotionalSpare Capacity
0.84 MMB/D
Iran: 3.9 MMB/DConfrontation OverNuclear Weapons
Possible UN Sanctions
2006 Q2

DC Strategy, Alliances & Business DevelopmentEconomic & Market Intelligence (S/E)
Oil Inventories
250
300
350
400
'88 '90 '92 '94 '96 '98 '00 '02 '04 '06
Millions ofBarrels
U.S. Excluding Strategic Reserve Units

DC Strategy, Alliances & Business DevelopmentEconomic & Market Intelligence (S/E)
Crude Oil, Light Sweet
Non-CommercialLong Positions# of Contracts
Oil Futures Speculation
0
50,000
100,000
150,000
200,000
250,000
Jan'02
May'02
Sep'02
Jan'03
May'03
Sep'03
Jan'04
May'04
Sep'04
Jan'05
May'05
Sep'05
Jan'06
May'06
Sep'06

DC Strategy, Alliances & Business DevelopmentEconomic & Market Intelligence (S/E)
Current Oil Price Forecasts
West Texas Intermediate, $/bbl
* July ’06
PIRA
Global Insight
Macro Advisors
Energy Information Agency
Average
2004 2005 2006 2007
Actual Forecast *
$ 41 $ 56
$ 70
72
71
69
$ 71
$ 67
76
74
69
$ 72

DC Strategy, Alliances & Business DevelopmentEconomic & Market Intelligence (S/E)
Cents Per Gallon(2005 $)
0
50
100
150
200
250
300
350
'78 '80 '82 '84 '86 '88 '90 '92 '94 '96 '98 '00 '02 '04 '06
Real
Nominal
$3.06
$1.13
$3.00 August
Gasoline Prices
Average All Types

DC Strategy, Alliances & Business DevelopmentEconomic & Market Intelligence (S/E)
3.0%
4.0%
5.0%
6.0%
7.0%
8.0%
9.0%
'59 '62 '65 '68 '71 '74 '77 '80 '83 '86 '89 '92 '95 '98 '01 '04 '07
6.3% July
% of Disposable Income
Consumer Spending
Energy Goods & Services

DC Strategy, Alliances & Business DevelopmentEconomic & Market Intelligence (S/E)
Cost Per Mile Driven
0
2
4
6
8
10
12
14
16
18
20
'7519
7719
79 '8119
8319
85 '8719
8919
91 '9319
9519
97 '9920
0120
03 '05
Cents
Trucks
Cars
DC Strategy, Alliances & Business DevelopmentEconomic & Market Intelligence (S/E)
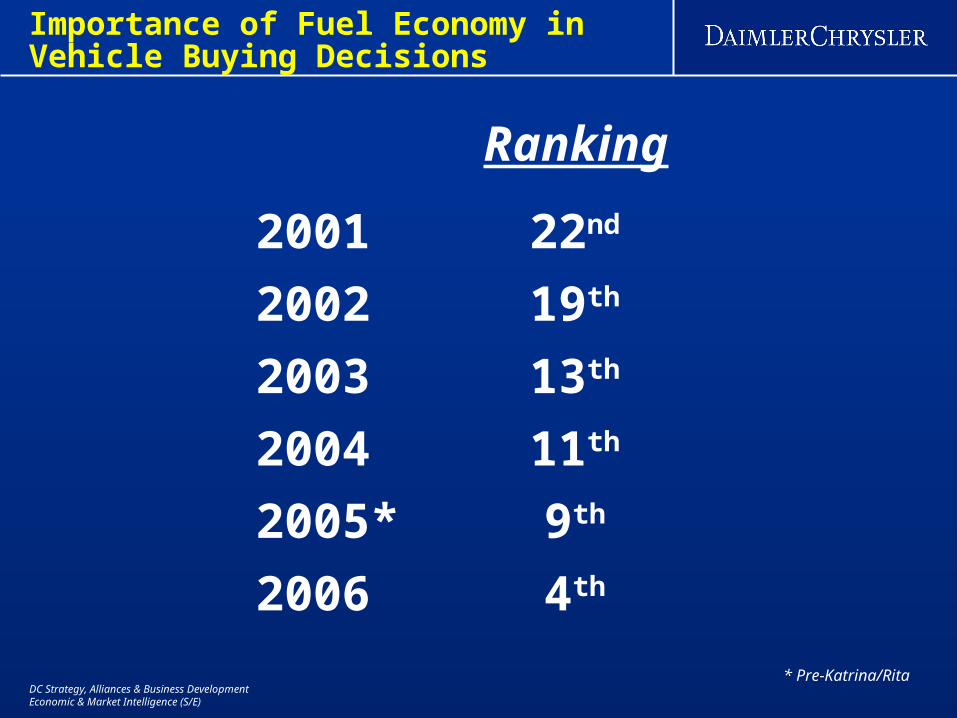
2001
2002
2003
2004
2005*
2006
22nd
19th
13th
11th
9th
4th
* Pre-Katrina/Rita
Ranking
Importance of Fuel Economy inVehicle Buying Decisions

DC Strategy, Alliances & Business DevelopmentEconomic & Market Intelligence (S/E)
20%
30%
40%
50%
60%
70%
80%
'86 '88 '90 '92 '94 '96 '98 '00 '02 '04
Cars
Trucks
% Share of LightVehicle Industry
U. S. Auto Industry
Car/Truck Mix

DC Strategy, Alliances & Business DevelopmentEconomic & Market Intelligence (S/E)
35
40
45
50
55
60
65
Jan'04
Apr'04
Jul'04
Oct'04
Jan'05
Apr'05
Jul'05
Oct'05
Jan'06
Apr'06
Jul'06
Oct'06
% Share of LightVehicle Industry
Trucks
Cars
U. S. Auto Industry
Car/Truck Mix

DC Strategy, Alliances & Business DevelopmentEconomic & Market Intelligence (S/E)
0
5
10
15
20
25
Jan'04
Apr Jul Oct Jan'05
Apr Jul Oct Jan'06
Apr July Oct
Share of Total Light Vehicle Industry
Full & Large SUVs
Pickups
Sports Tourers
Mid Size SUVsMinivans
Small & Compact SUVs
U.S. Auto Industry
Market Share: Light Trucks

DC Strategy, Alliances & Business DevelopmentEconomic & Market Intelligence (S/E)
Used Vehicle Prices & Gasoline
Compact Cars & Full Size SUVs
-0.15
-0.10
-0.05
0.00
0.05
0.10
0.15
0.20
0.25
0.30
Jan '02 Jan '03 Jan '04 Jan '05 Jan '06
100
150
200
250
300
350Compact Car
(left scale)
Gas Prices(right scale)
Full Size SUVS(left scale)
% ChangeYr/Yr
Cents per Gallon

DC Strategy, Alliances & Business DevelopmentEconomic & Market Intelligence (S/E)
20
30
40
50
60
70
80
Jan'04
Apr'04
Jul'04
Oct'04
Jan'05
Apr'05
Jul'05
Oct'05
Jan'06
Apr'06
Jul'06
Oct'06
% Share of SUV
Off-Road
On-Road
U. S. Auto Industry
SUV On-Road / Off-Road Mix

DC Strategy, Alliances & Business DevelopmentEconomic & Market Intelligence (S/E)
Light Vehicle Production
Industry, NAFTA
200520062007
(in 000)
’06/’05’07/’06
% Change Yr/Yr
3,9654,1303,990
4,1384,1023,983
3,7313,4733,701
3,9193,4683,826
15,75315,17315,500
Q1 Q2 Q3 Q4 Total
+4.2%- 3.4%
- 0.9%- 2.9%
- 6.9%+6.6%
- 11.5%10.3%
- 3.7%+2.2%
DC Strategy, Alliances & Business DevelopmentEconomic & Market Intelligence (S/E)
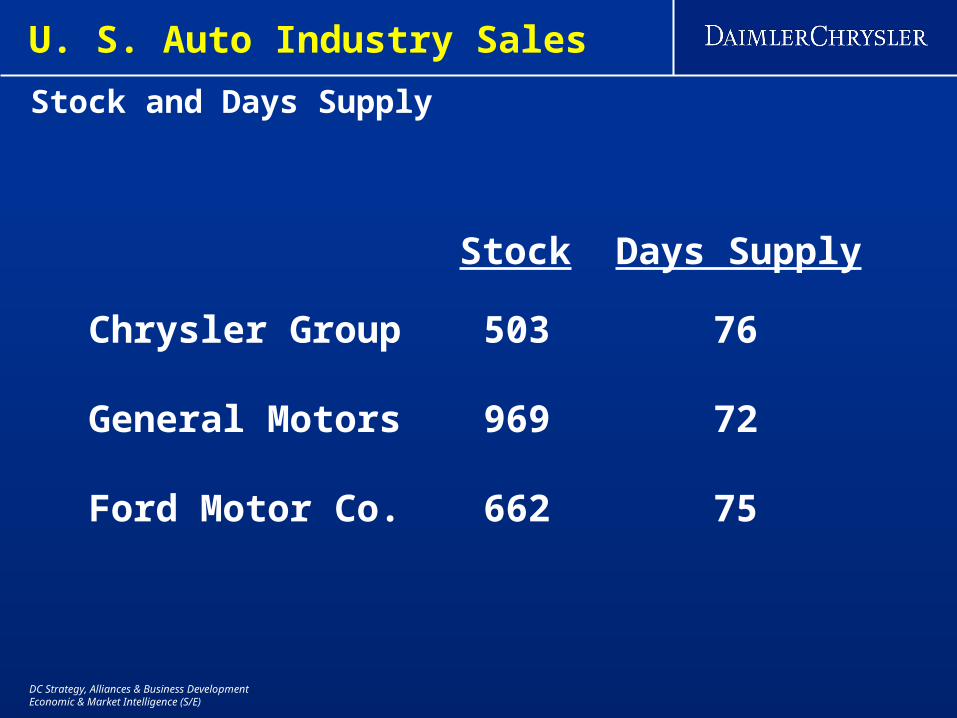
Stock Days Supply
Chrysler Group
General Motors
Ford Motor Co.
503
969
662
76
72
75
Stock and Days Supply
U. S. Auto Industry Sales

DC Strategy, Alliances & Business DevelopmentEconomic & Market Intelligence (S/E)
2006 2007
Outsiders
Blue Chip
DaimlerChrysler
17.1
17.1
17.3
17.0
16.8
17.0
Forecast Consensus
U. S. Auto Industry Sales
Outsides include Global Insight, J.D. Power, CSM & Mike Lucky

DC Strategy, Alliances & Business DevelopmentEconomic & Market Intelligence (S/E)
0
2
4
6
8
10
12
14
16
18
20
'60 '65 '70 '75 '80 '85 '90 '95 '00 '05 '10
U.S. Auto Industry
Million Units
17.8
Number of Vehicles per Year
4%/Yr
OilShock
OilShock
2%/Yr 0.8%/Yr
1.0%/Yr16.3
12.5
10.5
15.4

DC Strategy, Alliances & Business DevelopmentEconomic & Market Intelligence (S/E)
2006Total Worldwide Sales
57 M
NAFTA33.7%
W. Europe26.2%
Japan8.4%
China6.8%
NAFTA30.8%
W. Europe21.6%
Japan7.1%
China9.8%
Worldwide Vehicle Sales
India2.1%
ROW22.8%
2017Total Worldwide Sales
71 M
India4.6%
ROW26.1%
Passenger Vehicles
DC Strategy, Alliances & Business DevelopmentEconomic & Market Intelligence (S/E)
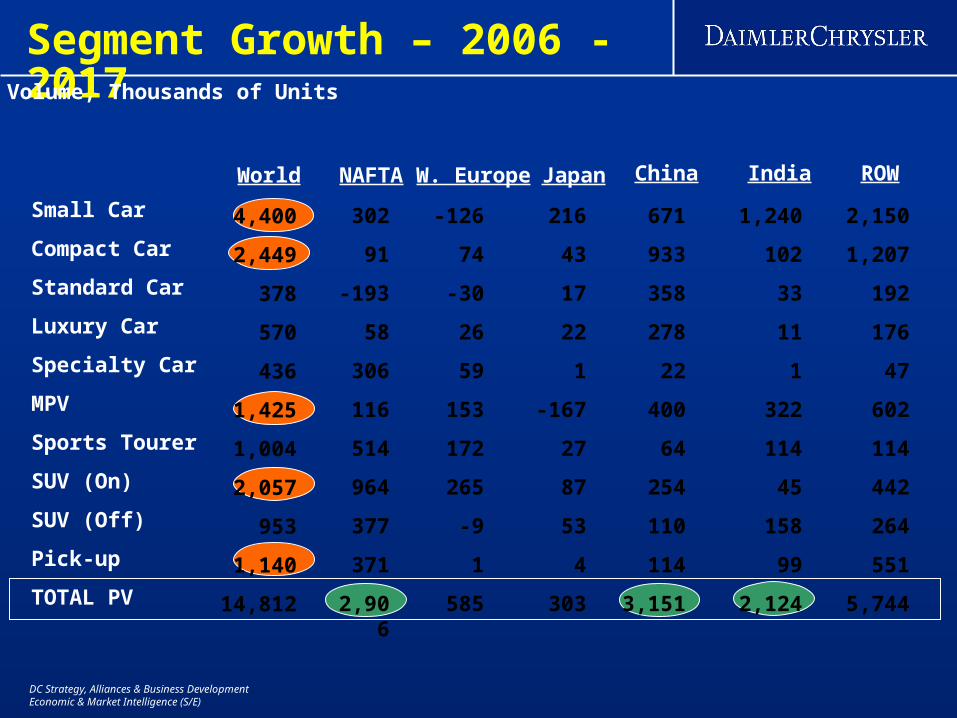
4,400
2,449
378
570
436
1,425
1,004
2,057
953
1,140
14,812
Segment Growth – 2006 - 2017
Small Car
Compact Car
Standard Car
Luxury Car
Specialty Car
MPV
Sports Tourer
SUV (On)
SUV (Off)
Pick-up
TOTAL PV
302
91
-193
58
306
116
514
964
377
371
2,906
-126
74
-30
26
59
153
172
265
-9
1
585
216
43
17
22
1
-167
27
87
53
4
303
671
933
358
278
22
400
64
254
110
114
3,151
1,240
102
33
11
1
322
114
45
158
99
2,124
2,150
1,207
192
176
47
602
114
442
264
551
5,744
World NAFTA W. Europe Japan China India ROW
Volume, Thousands of Units

DC Strategy, Alliances & Business DevelopmentEconomic & Market Intelligence (S/E)
Segment Growth – 2006 - 2017
Small Car
Compact Car
Standard Car
Luxury Car
Specialty Car
MPV
Sports Tourer
SUV (On)
SUV (Off)
Pick-up
TOTAL PV
6.9
3.7
-51.1
10.1
70.2
8.1
51.1
46.9
39.5
32.6
19.6
-2.9
3.0
-7.9
4.5
13.6
10.7
17.1
12.9
-0.9
0.1
4.0
4.9
1.8
4.5
3.8
0.2
-11.7
2.7
4.2
5.5
0.3
2.0
14.0
38.1
94.9
48.7
5.0
28.1
6.3
12.3
11.6
10.0
21.3
28.2
4.2
8.7
1.9
0.2
22.6
11.3
2.2
16.5
8.7
14.3
48.9
49.3
50.8
31.0
10.7
42.2
11.4
21.5
27.7
48.3
38.8
NAFTA W. Europe Japan China India ROW
Percent of Total World PV Growth
DC Strategy, Alliances & Business DevelopmentEconomic & Market Intelligence (S/E)
Economic growth expectations for the second half of 2006 are for below trend at 2.5% due to a combination of the downturn in the housing market, the volatility in the oil markets and high commodity prices.
The Federal Reserve held the Fed Funds rate at 5.25% at its August meeting ending its tightening bias. The meeting minutes from the FOMC indicate that more hikes might be needed due to continuing concerns over consumer prices. The consensus remains for a hike to 5.5% by the end of the year.
Consumer confidence lost ground overall in August, but showed some improvement toward the end of the month as gas prices and inflation expectations fell. Home and vehicle buying attitudes were at their lowest levels since 1990.
The end of the peak driving season and the lack of hurricane activity in the Gulf of Mexico have brought gasoline prices down by over 30 cents per gallon. Most analysts expect the drop to be limited; the hurricane season is only half over, strong world demand is still evident, and geopolitical risks still remain.
Auto industry sales will likely continue to move towards more fuel efficient vehicles. The shifts between segments will not be great, but consumers will shift within segments to more efficient entries. Overall industry sales are likely to be flat to down this year (with risks on the down side) and down modestly in 2007 as the economy slows and consumers feel the pinch of higher debt service costs and falling housing prices, as well as continued expensive energy.
Conclusions


