Overview of Nursing Facility and Elderly Waiver/Assisted Living Funding in Minnesota Health and Human Services Finance Committee Minnesota House of Representatives Thursday, January 13, 2011 Todd Bergstrom, Care Providers of Minnesota Jeff Bostic, Aging Services of Minnesota Jennifer McNertney, Aging Services of Minnesota
Transcript
Overview of Nursing Facility and Elderly Waiver/Assisted Living Funding in Minnesota
Health and Human Services Finance CommitteeMinnesota House of Representatives
Thursday, January 13, 2011
Todd Bergstrom, Care Providers of Minnesota
Jeff Bostic, Aging Services of Minnesota
Jennifer McNertney, Aging Services of Minnesota
WHO WE ARE
2 | The Long-Term Care Imperative
The Long-Term Care Imperative is a collaboration of Aging Services of Minnesota and Care Providers of Minnesota, two of the state’s largest long-term care associations.
The Long-Term Care Imperative is committed to advancing a shared vision and future for older adult housing, health care and supportive services.
Net Additional Expenditures if Elderly Waiver Clients Resided in Nursing Homes
Decrease due to increased
Federal Match
Source: DHS Spending Forecast November 2010
Economic Impact of Long Term Care* Minnesota (in billions)
*Long Term Care (LTC) facilities include nursing homes, assisted living, and other residential care facilities. These facilities do not include government-owned or hospital-based facilities. Source: AHCA 2009
• The total economic impact of nursing facilities, assisted living, and other residential care facilities in the State of Minnesota is more than $6.7 billion annually.
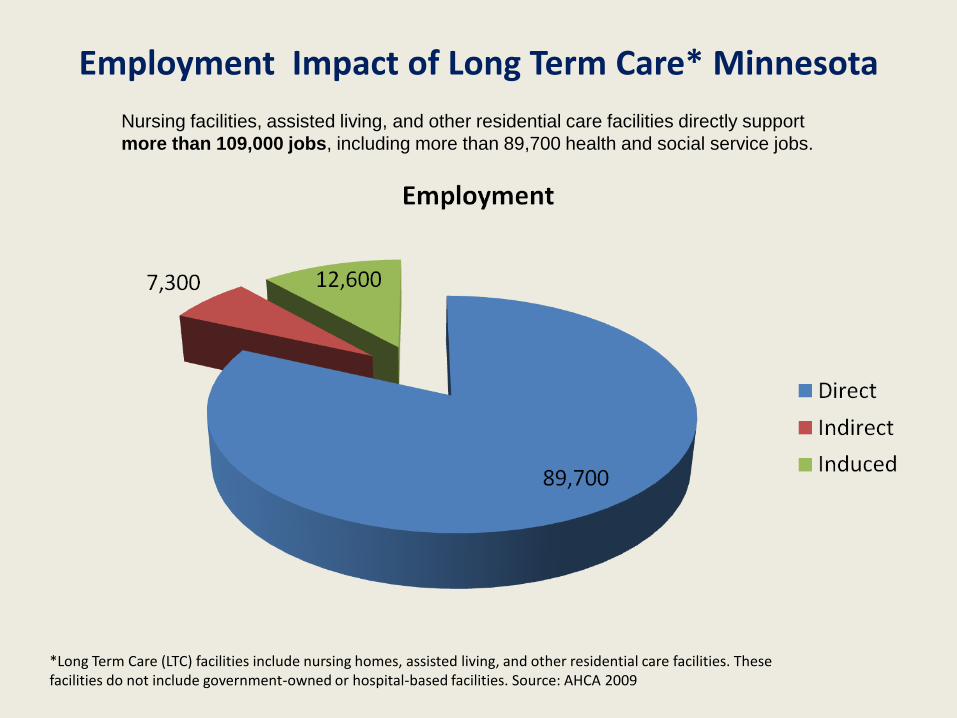
Employment Impact of Long Term Care* Minnesota
*Long Term Care (LTC) facilities include nursing homes, assisted living, and other residential care facilities. These facilities do not include government-owned or hospital-based facilities. Source: AHCA 2009
Nursing facilities, assisted living, and other residential care facilities directly support
more than 109,000 jobs, including more than 89,700 health and social service jobs.
Reform of Long-Term Care In Minnesota
• Key Points– Nursing Homes were the predominant provider of long-term
care services in the 1960s, 1970s, and 1980s.– In response to the limitations of nursing facilities, the consumer
demanded new options such as assisted living and home care.– The State of Minnesota followed the private market in the early
1990’s by developing cost effective and consumer friendly programs like the Elderly Waiver.
– These reforms have had tremendous success in providing consumer choice and reducing Medicaid costs.
– The market and the state continue to rebalance services. In addition, the Legislature began reforming how nursing facilities are paid with the initial steps toward a new payment system starting in 2008.
18.9%
22.1% 23.9%28.4%
31.9% 32.7%
10%
20%
30%
40%
2002 2004 2006 2008 2010 2012
(proj)
State Fiscal Year
State Spending Shifting to Community Alternatives
Source: DHS Spending Forecast November 2010
EW/AC Expenditures as a Percentage of all Elderly
LTC Spending
Decline in Nursing Home Capacity
Over 12,000 Beds Closed 59 Nursing Homes Closed Since 2000
Source: DHS Report to the Minnesota Legislature: Status of Long-Term Care in Minnesota 2010
0
10
20
30
40
50
60
70
80
90
100
1987 1990 1993 1996 1999 2002 2005 2008
Bed
s/1
00
0
Year
Beds/1000 Age 65+: Minnesota, US
MN beds/1000 US Beds/1000
0
100
200
300
400
500
600
700
800
1987 1990 1993 1996 1999 2002 2005 2008
Bed
s/1
00
0
Year
Beds/1000 85+: Minnesota, US
MN Beds/1000 US Beds/1000
Minnesota Nursing Facility Bed Supply Near the National Average
Nursing Facility Sources of Payment
• Services for a client in a nursing home are paid by:
– Medicaid (58% of all days)
– Private Resources
– Medicare (for rehab stays up to 100 days)
– Other products like long-term care insurance
Nursing Facilities in Minnesota: Trends in Payment
Source: Medicaid Cost Reports, Minnesota Department of Human Services
Nursing Facility Medicaid Rates• Each nursing facility has 36 rates that correspond to 36 case
mix classifications (levels of resident need). • Upon admission the nursing facility uses a federally required
assessment to determine client needs. The data from this assessment is used to determine which of the 36 rates will be assigned.
• A client is assessed quarterly and when there are health changes. The rates then change as well.
• A nursing home’s rate is comprised of several components:– An operating component for nursing, dietary, housekeeping, utilities,
etc.– A property component that pays for upkeep, remodeling, and interest
on debt.– An external fixed rate including the bed surcharge, provider
license/fees, property taxes, and other costs outside of provider control
Impact of Rate Equalization
• Minnesota’s policy of limiting rates charged to private residents to the same rates that Medicaid pays means that almost all residents days in Minnesota nursing homes are paid at government controlled rates.
• Because the Medicaid rates do not cover provider costs, the equalization policy forces providers to accept the same inadequate rate for their private pay residents
Why do nursing facility rates differ?
• During the 1980’s and early 1990’s nursing home rates were based on each provider’s costs. – Labor costs differ throughout the state, so limiting of
costs based on peer groups was used – Types of clients served vary, and historical cost
patterns were not the same even within the same geographic region
• In the mid-1990s, Minnesota adopted a system where the historical rates were locked-in and adjusted by inflation.
• Since that time, rate adjustments have been determined annually by the Legislature.
Nursing Facility Medicaid Rates Do Not Cover Provider Costs
• Over time a large gap between the cost of care and the Medicaid rates has developed: – The projected shortfall between average costs of care and
average Medicaid rates in Minnesota is $24.70. For the nation as a whole it is $17.33.
• Minnesota and North Dakota are the only two states with a rate equalization policy. North Dakota’s average FY 10 Medicaid rate covers more than 100% of provider costs compared to 86.8% in Minnesota.
• The lack of a payment system that reflects the cost of care is undermining the viability of nursing facilities throughout Minnesota.
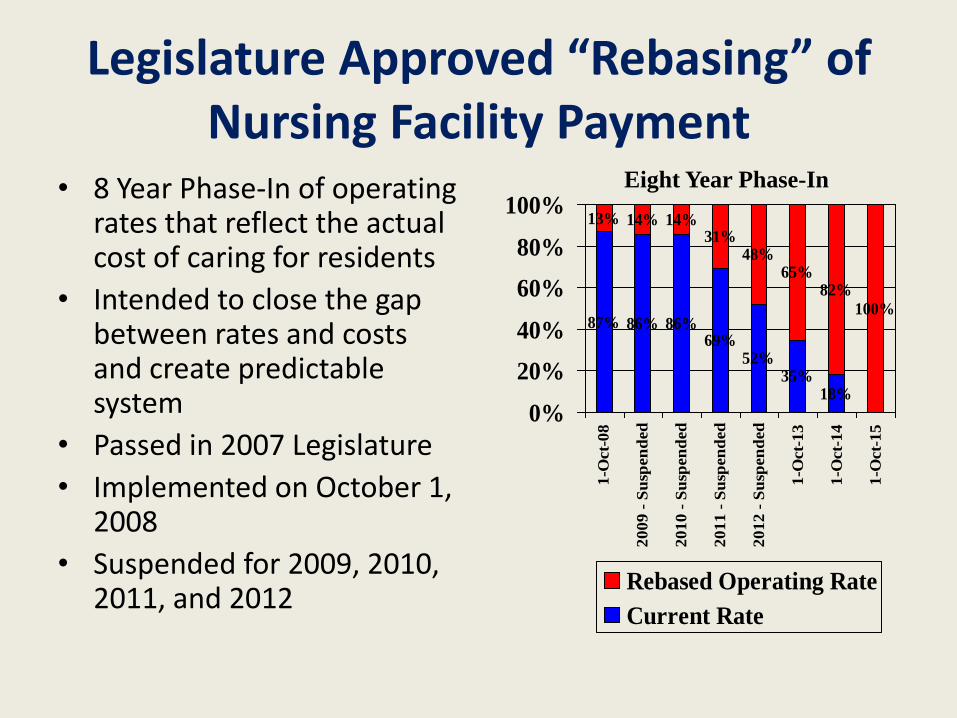
Legislature Approved “Rebasing” of Nursing Facility Payment
• 8 Year Phase-In of operating rates that reflect the actual cost of caring for residents
• Intended to close the gap between rates and costs and create predictable system
• Passed in 2007 Legislature
• Implemented on October 1, 2008
• Suspended for 2009, 2010, 2011, and 2012
87% 86% 86%69%
52%35%
18%
13% 14% 14%31%
48%65%
82%
100%
0%
20%
40%
60%
80%
100%
1-O
ct-
08
20
09
- S
usp
en
ded
20
10
- S
usp
en
ded
20
11
- S
usp
en
ded
20
12
- S
usp
en
ded
1-O
ct-
13
1-O
ct-
14
1-O
ct-
15
Rebased Operating Rate
Current Rate
Eight Year Phase-In
Elderly Waiver
• EW funds home and community-based services for people age 65 and older who are eligible for Medical Assistance (MA) and require the level of medical care provided in a nursing home, but choose to reside in the community.
• Covered services include visits by a – skilled nurse
– home health aide
– homemaker
– Companion
– personal care assistant
– home-delivered meals
– adult day care
– supplies and equipment
– home modifications
Elderly Waiver
• Currently, most of the Elderly Waiver clients are enrolled in Managed Care
• Lead agencies including the counties and Managed Care Organizations assess client and develop payment for clients in the home or assisted living setting
• Legislative cuts in 2009 and 2010 and other administrative actions have cut the Elderly Waiver program by more than 10 percent.
Source: DHS Report to the Minnesota Legislature: Status of Long-Term Care in Minnesota 2010
Medicaid: Nursing Home and Elderly Waiver Utilization (Source: DHS Nov-10 Forecast)
Source: DHS Spending Forecast November 2010
State Medicaid Expenditures for Nursing Homes and the Elderly Waiver (Source: DHS Nov-10 Forecast)
Decrease due to increased
Federal Match
Source: DHS Spending Forecast November 2010
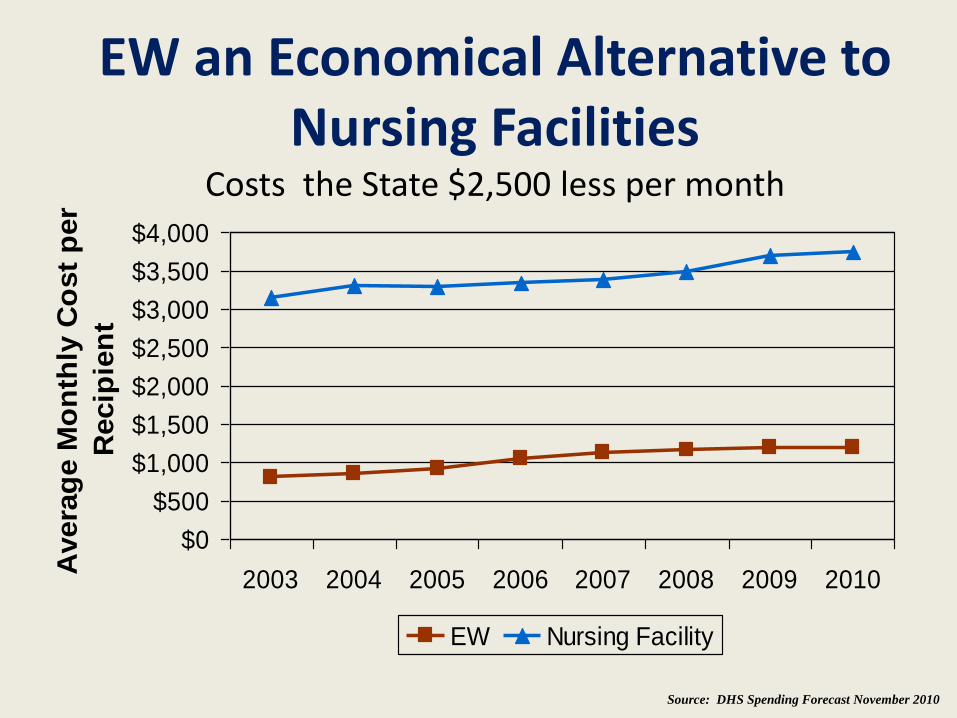
$0
$500
$1,000
$1,500
$2,000
$2,500
$3,000
$3,500
$4,000
2003 2004 2005 2006 2007 2008 2009 2010
Avera
ge M
on
thly
Co
st
per
Recip
ien
t
EW Nursing Facility
Source: DHS Spending Forecast November 2010
EW an Economical Alternative to Nursing Facilities
Costs the State $2,500 less per month
Nursing Home Costs Without The Elderly Waiver ProgramElderly Waiver Program Saved State Up To $275 Million in 2010