43
Bualuang Securities Plc. April 3, 2014 Overview of PTTGC Business and Basic of Petrochemical

Bualuang Securities Plc. April 3, 2014
Overview of PTTGC Business and Basic of Petrochemical

Disclaimer
This presentation includes forward-looking statements that are subject to risks and uncertainties, including those pertaining to the anticipated benefits to be realized from the proposals described herein. This presentation contains a number of forward-looking statements including, in particular, statements about future events, future financial performance, plans, strategies, expectations, prospects, competitive environment, regulation and supply and demand.
PTTGC has based these forward-looking statements on its views with respect to future events and financial performance. Actual financial performance of the entities described herein could differ materially from that projected in the forward-looking statements due to the inherent uncertainty of estimates, forecasts and projections, and financial performance may be better or worse than anticipated. Given these uncertainties, readers should not put undue reliance on any forward-looking statements.
Forward-looking statements represent estimates and assumptions only as of the date that they were made. The information contained in this presentation is subject to change without notice and PTTGC does not undertake any duty to update the forward-looking statements, and the estimates and assumptions associated with them, except to the extent required by applicable laws and regulations.
2

Agenda
q Overview of PTTGC
q Basic Knowledge of Petrochemical Industry
q Competitiveness and Key Driver
q Strategy and Execution
q Conclusion
q Appendix
3 3

Agenda
q Overview of PTTGC
q Basic Knowledge of Petrochemical Industry
q Competitiveness and Key Driver
q Strategy and Execution
q Conclusion
q Appendix
4 4

Overview of PTTGC
Incorporated on October 19, 2011 from the amalgamation of PTTAR and PTTCH
• Total petrochemical capacity: 8.75 MTA
• Total distillation capacity: 280 KBD
• Number of employees 3,660 persons
Top 5 Shareholders
PTT 48.89% Thai NVDR 9.05% State Street Bank Europe Ltd 2.84% State Street Bank and Trust Co. Ltd. 1.92% HMC Polymers Co. Ltd 1.85% As of March 6, 2014
5

2013 Financial Highlights
6

2013 Financial Highlights
7

Historical Dividend Payment
8

Strategic location of each plant in Map Ta Phut Industrial Complex creates proximity to suppliers and customers
9
Our Business Structure
REFINERY & SHARED FACILITIES
AROMATICS
OLEFINS
POLYMERS
EO BASED PERFORMANCE
GREEN CHEMICALS
HIGH VOLUME
SPECIALTIES
Main Products Capacity* Operated by
= Olefins & Derivatives
10

Our Business Structure
REFINERY & SHARED FACILITIES
AROMATICS
OLEFINS
POLYMERS
EO BASED PERFORMANCE
GREEN CHEMICALS
HIGH VOLUME
SPECIALTIES
Main Products Capacity* Operated by
11

Natural Gas
Crude Palm Oil
Crude
Condensate
Cracker
Aromatics
Plants
Refinery
Ethylene
HDPE
LLDPE
LDPE
MEG
Propylene
Oleochemicals
Paraxylene
Benzene
PTAPET Fiber/Resin
EO
Ethanolamine
Ethoxylate
Cyclohexane
Cumene
Phenol
Acetone
EB/SM
PS
BPA
Methyl Ester(B-100)
PC
Caprolactam Nylon 6
Fatty Alcohol
MMA PMMA
Epoxy Resins
ABS
SBR
PP
PTT Phenol
Petroleum Products
- LPG
- Reformate
- Light Naptha
- Jet Fuel
- Diesel
- Fuel Oil
Reformate,
Heavy
Naphtha
Pygas
Condensate
Residue,
Hydrogen
Light
Naphtha
C3,C4
OffGas Mixed C4 Butadiene
PO
PUTDI/HDI
Toluene
Polyols
Orthoxylene
Cracker
Bottom,
Hydrogen
PA Plasticizer
1. PTTGC does not currently produce these products.
REFINERY & SHARED
FACILITIES AROMATICS OLEFINS POLYMERS
EO-BASED
PERFORMANCE GREEN CHEMICALS
HIGH VOLUME
SPECIALTIES
Feedstock Upstream Intermediates Downstream
Proximity to Suppliers and Customers
Exchange Stream Products
By-Products
Potential Product Opportunities (1)
Petroleum Products
- LPG
- Reformate
- Light Naphtha
- Jet Fuel
- Diesel
- Fuel Oil
Fully Integrated Petrochemical and Refinery Operations
with Diversified Product Portfolio
12

Agenda
q Overview of PTTGC
q Basic Knowledge of Petrochemical Industry
q Competitiveness and Key Driver
q Strategy and Execution
q Conclusion
q Appendix
13 13

14

Plastic Resin Codes
15

Petrochemical Raw Materials Come from Petroleum and Gas Fractions
16
Source: www.2b1stconsulting.com/propylene/

Refinery Business
CDU
LPG REFORMATE LIGHT NAPHTHA JET A-1 DIESEL FUEL OIL
17
crude

Refinery Business
18

Aromatics Business
TOLUENE
PARAXYLENE
BENZENE
CONDENSATESPLITTER – REFORMER
19
OTHOXYLENE
CUMENE
PHENOL
ACETONE
BISPHENOL A POLY
CARBONATE
CYCLOHEXANE
TOLUENE DIISOCYANATE HEXAMETHYLENE DIISOCYANATE
POLYURETHANE
TEREPHTHALIC ACID -> PTA PET - POLYESTER
PHTHALIC ANHYDRIDE PLASTICIZER
CAPROLACTAM NYLON 6
POLYMETHYL METHACRYLATE
METHYL METHACRYLATE
Condensate
STYRENE MONOMER
POLYSTYRENE
ABS
STYRENE BUTADIENE RUBBER
XYLENE

Polyester Value Chain
20
Source: Indorama 2Q13 Analyst Meeting Presentation
Aromatics Product Applications
Intermediate Downstream Applications Upstream
Cyclohexane
Benzene Styrene Monomer (SM)
Polystyrene (PS)
Acrylonitrile Butadiene Styrene (ABS)
Caprolactam Nylon-6
Cumene/ Phenol
BPA Polycarbonate
Epoxy Resins
Styrene Butadiene Rubber (SBR)
21

Olefins and Derivatives Business
PROPYLENE
MIXED C4
HDPE
LDPE
LLDPE
MEGETHYLENE OXIDE
POLYSTYRENE
ETHANOLAMINE
ETHOXYLATE
ETHYLENE
BUTENE-1
STYRENE MONOMER
STYRENE BUTADIENE
RUBBER
POLYPROPYLENE
PROPYLENE OXIDE
POLYOLS
CRACKER
POLYURETHANE
BUTADIENE
PET - POLYESTER
22
Natural Gas
Process Block Diagram
Product I
Film Grades Injection Grades Pipe Grades Thermoform
Monofilament Wire & Cable
HDPE – High Density Polyethylene (โพลีเอทิลีนที)มีคา่ความหนาแน่นสูง)
Blow mold Grades
Big Drum
Cap Grades
• มีความหนาแน่นประมาณ 0.941-0.965 g / cm3 การเรียงตวัของโมเลกลุจะมีกิ!งกา้นมาก ทาํใหแ้สงผ่านไดน้อ้ยกว่า LDPE และ LLDPE
• จึงดขูุน่ แต่มีความตา้นทานแรงตา่งๆ ไดด้ี มกัใชง้านเป็นถงุพวก Heavy duty เชน่ ถงุหูหิ !วทั"วไป ลงั ถงั
ตะกรา้
23

Cap & Lid
General Purpose and
Heavy Duty Film Extrusion Coating
Shrink Film
Zip Bag
Cosmetic Tube &
Blow Mold Container Foam & Bubble Sheet
Cap &
LDPE – Low Density Polyethylene (โพลิเอทิลีนความหนาแน่นตํ2า)
• มีความหนาแน่นประมาณ 0.910-0.925 g / cm3 การเรียงตวัของโมเลกลุเป็นระเบียบกวา่ HDPE แตย่งัคงมีกิ!งกา้นอยู ่ มีความใสพอสมควร คณุสมบตัิตา่งๆ ดีกวา่ HDPE แตค่วามตา้นทานแรงตา่งๆ นอ้ยกวา่ มกัใชเ้ป็น Sealing layer
24

Tube
Zip bag
Water storage tank
LLDPE Applications LLDPE – Linear Low Density Polyethylene
LLDPE ตา่งจาก LDPE ตรงการจดัเรียงตวัของโมเลกลุไม่มีกิ!งกา้น ทําใหม้ีความใสมากกว่า LDPE และคณุภาพดา้นต่างๆ ดีกว่า LDPE มกัใชง้านที!อณุหภมูิตํ!าๆ เชน่ บรรจอุาหารแชเ่ย็นหรือแชแ่ขง็ และใชเ้ป็น Sealing layer
25

Agenda
q Overview of PTTGC
q Basic Knowledge of Petrochemical Industry
q Competitiveness and Key Driver
q Strategy and Execution
q Conclusion
q Appendix
26 26

Highly Competitive Cost Structure & Performance mainly driven by Olefins and Derivatives
27
94
244
1019 1030 1039 1107
1177 1199 1228
0
200
400
600
800
1000
1200
1400
MDEEthane
NAMEthane
WEPNaphtha
MDENaphtha
NAMNaphtha
MDELPG
NEANaphtha
SEANaphtha
NEA LPG
2013 Global Ethylene Cash Cost by Region USD/Ton
Source: IHS (formerly CMAI) average 2013. PTTGC cash cost takes into account the effect of the renewal of gas price agreement
Note: MDE = Middle East, NAM = North America, NEA = Northeast Asia, SEA = Southeast Asia, WEP = Western Europe.
MDE cash costs are average values of Iran and Saudi Arabia.
48%
20%
21%
5%
5% 1%
Adj. EBITDA Breakdown
16%
16%
56%
3%
3% 5%
Typical Revenue Breakdown
% Adj. EBITDA Margin
3 8
27
5 7 10
2
10
27
8
2
10
Refinery Aromatics Olefins and
Derivatives
Green HVS PTTGC
2012 2013
s
s

What to look at?
q PRICE & SPREAD
q DEMAND
q Product Producers
q Downstream Chain Producers
q SUPPLY
q New Technologies/New Feedstock
q New Capacity Additions
q Shutdown/Closure
q Cut-Run
q SOURCES OF INFORMATION
q In-house
q Research houses, e.g. ICIS, CMAI, IHS
q Bloomberg
q Brokerage Firms’ researches
28
Agenda
q Overview of PTTGC
q Basic Knowledge of Petrochemical Industry
q Competitiveness and Key Driver
q Strategy and Execution
q Conclusion
q Appendix
29 29

Megatrends and Implications to Business
30
Megatrends and other external factors
New Products
Elec. & Electronic
Construction
Auto & Transp.
Existing Core
Packaging
Textiles
Home & Personal
End Used Platform
Shift in global growth
Smarter, healthier population
Tech& innovation society
Competing for resources
Growing of middle class
Aging society
Emerging markets
Urbanization
Alternative energy
Green tech
New patterns of consumption
Water scarcity
Climate change
Fossil fuel scarcity
AEC 2015
ASEAN connectivity
CHN 12th FYP
Mark
et
back
Demand For
Petrochemical Products

Taking PTTGC’s Strategies into Execution The Double E (2014 – 2018)
31
PTTGC Business Principle : People Conduct & Business Conduct
GREEN
CORE UPLIFT PROJECTS
1-STEP ADJACENCIES
Operational Excellence
Synergy Excellence
Debottlenecking
Marketing Excellence
NEW GEOGRAPHIES NEW PRODUCTS
ASEAN: Pertamina
CHINA: Sinochem
System House
Compounding:
PC, PU, SBR
Olechemical
PLA
Succinic Acid
PLA/PBS Compound
EXCELLENCE
EXECUTION
EBITDA Uplift
15-30% (2012-2017)
1st Quartile
Performance
ROIC > 14%
Listed in Globally
Sustainability Index

Continues to Strive for Strong Profitable Growth
32
~800-900
~620-650
Green
563
Actual
2012
Target
2017
Target
2022
Expected EBITDA Benefit
Uplift 15-30%
Phase 1 : Foundation for Growth Phase 2: The Growth Mode
Green
HVS
New Global Hub
Debottleneck
Synergy Project Excellence
Operational Excellence Marketing Excellence Capital Expenditure Excellence
We aim to grow ~5 percent p.a. in the next ten years
Sales in THB Bn Based on constant Dubai crude year 2012 at USD 109 per bbl
32

33
CORE UPLIFT 1-STEP
ADJACENCIES GREEN
New Products | New Geographies
Adjusted Target
• Revised Operational Excellence target • Include only projects passed stage gates
*
* Debottleneck EBITDA uplift includes
1Q/14 BV project starts up 3Q/15 TOCGC Plant Improvement Project 4Q/15 PX Expansion starts up Not Including PTTPE Cracker Debottlenecking and LLDPE Expansion
>> Excellence Programs Target
EBIT
DA
Up
lift (M
USD
)

34
CORE UPLIFT 1-STEP
ADJACENCIES GREEN
New Products | New Geographies
Phenol 2 Project
TOCGC Plant Improvement Project
BOD approved EPC + Construction
Debottlenecking & Expansion
PTTPE Cracker Debottlenecking
PX Expansion
Target COD: 3Q/15
Target COD: 4Q/15
Target COD: 3Q/15
BEP
Target : 2016
LLDPE Expansion
BEP
Target : 2017
Construction Progress at 16.7%
Construction Progress at 5.3%
Construction Progress at 34.5%
BOD approved Project
BOD approved EPC + Construction
BOD approved EPC + Construction
BOD approved Project
BOD approve EPC
BOD approve EPC
Construction
Construction
2013 2015 - 2018 2014
Construction Progress at 95.3%
Target COD: 2Q/14
Synergy
Pure H2 via New PSA
Off Gas upgrading at Olefins
Construction Progress at 43.15%
Target COD: 4Q/14
Seek for additional and opportunities Synergy Benefits
Note: Progress as of Jan. 2014
>> Execution of Core uplift Projects according to Target

>> New Products: Screened Products for Further Feasibility Study
35
CORE UPLIFT 1-STEP
ADJACENCIES GREEN
New Products | New Geographies
PC Compounding
Commodity Compounding
1st Screen for Further Feasibility Study
Not qualify for 1st Screen
New Application Compounding
Using additives and modifiers to result with a particular color, texture, strength, and etc.
Blending two or more types of polymers together
Polymer Compounding
PU Chain System House HDI Derivatives
Bio-plastics Compounding
Ethylene
HDPE
LLDPE
LDPE
MEG
Propylene
Oleochemicals
Paraxylene
Benzene
PTA
Polyester Fiber
EO
Ethanolamine
Ethoxylate
Cyclohexane
Cumene
Phenol
Acetone
EB/SM
PS
BPA
Methyl Ester(B-100)
PC
Caprolactam Nylon 6
Fatty Alcohol
MMA PMMA
Epoxy Resins
ABS
SBR
PET Resin
PTT Phenol
- LPG
- Reformate
- Light Naptha
- Jet Fuel
- Diesel
- Fuel Oil
Toluene
PO
Mixed C4 Butadiene
Polyols
PP
System
House
HDI
TDI
PU
HDMA
Orthoxylene PA
Plasticizer
PLA Plant PLA
Succinic Acid Plant Succinic Acid
Petroleum
Products
Nylon 6,6
Adipic AcidPhenol
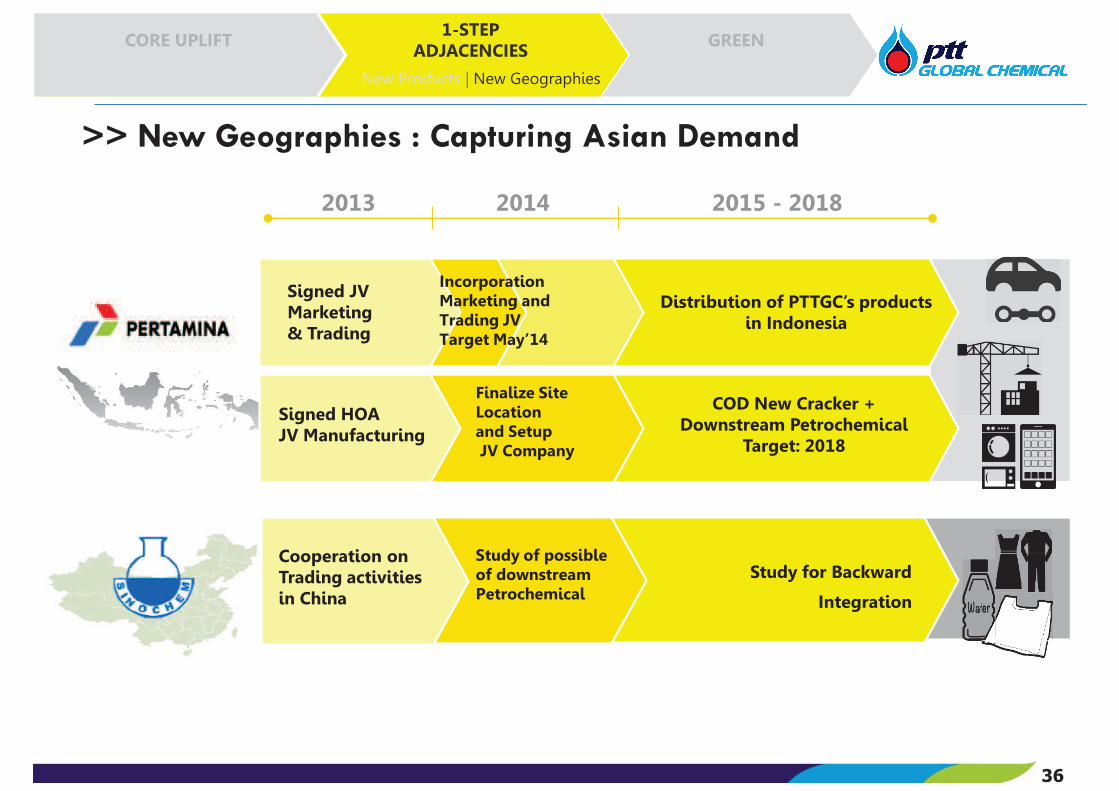
>> New Geographies : Capturing Asian Demand
36
CORE UPLIFT 1-STEP
ADJACENCIES GREEN
New Products | New Geographies
Signed HOA JV Manufacturing
2013 2015 - 2018 2014
COD New Cracker + Downstream Petrochemical
Target: 2018
Distribution of PTTGC’s products in Indonesia
Finalize Site Location and Setup JV Company
Study for Backward
Integration
Cooperation on Trading activities in China
Study of possible of downstream Petrochemical
Signed JV Marketing & Trading
Incorporation Marketing and Trading JV Target May’14

>> Green Business Roadmap
37
CORE UPLIFT 1-STEP
ADJACENCIES GREEN
New Products | New Geographies
Succinic Acid
(SAC)
Butanediol
(BDO)
Poly butylene
Succinate (PBS)
PLA/PBS
Compound
Lactic Acid
(HLA)
Poly Lactic Acid
(PLA)
Acrylic Acid
Corn/
Sugars
Cellulosic
FeedstockPolyacrylic
Acid/Acrylic ester
PLA Resin
Co
Su
PTTGC holds 50% in NatureWorks. A manufacture of polylactic acid (PLA) and lactides,
plant-based biopolymers used to manufacture plastics and fibers with world scale PLA
capacity of 150,000 ton/year. n Planned to build second plant potentially in Asia n Studied the possibilities to use alternative feedstock
PTTGC holds 84.21% in Myriant Corporation. An R&D based company with proven
technology platform.
§ In April 2013, Myriant Corporation had completed the construction of a 14,000 ton/year Succinic Acid Plant in Louisiana State and is currently commissioning.
ABSORBANT MATERIAL
35 41
240 231
101 116
60 44
238 245
137 120
61 67
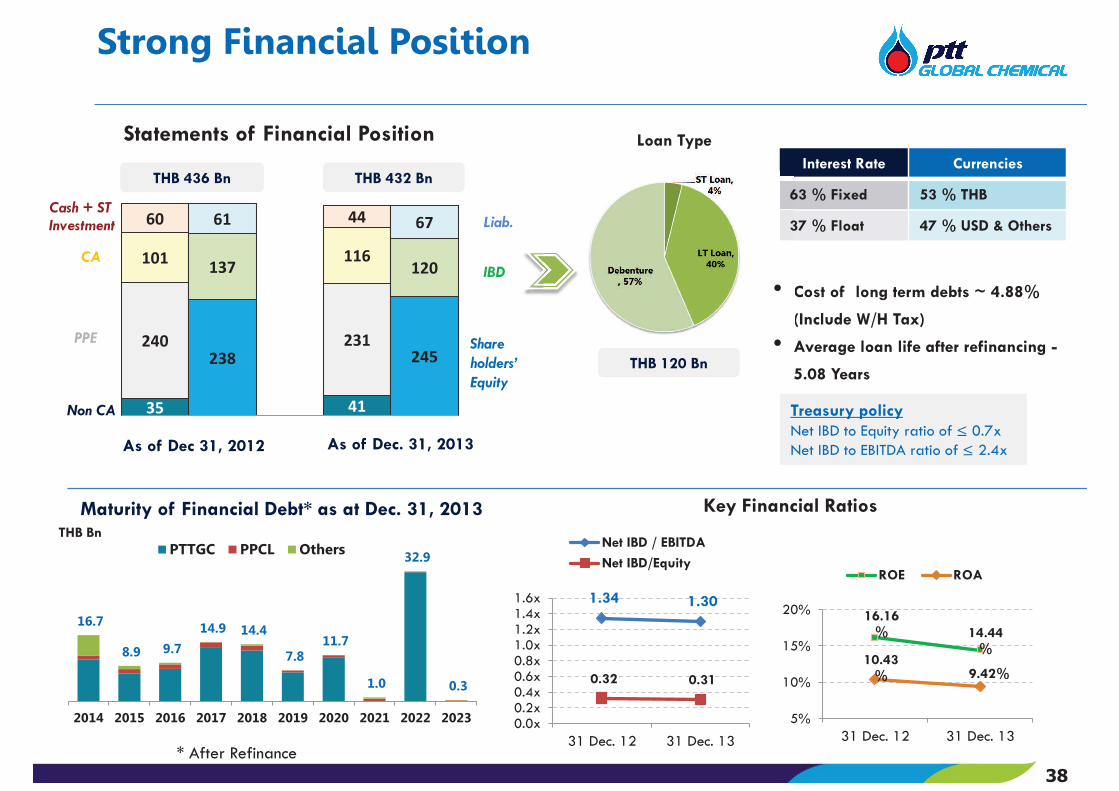
Strong Financial Position
38
Key Financial Ratios
As of Dec 31, 2012 As of Dec. 31, 2013
THB 432 Bn THB 436 Bn
Cash + ST Investment
CA
PPE
Non CA
Share
holders’
Equity
IBD
Liab.
Statements of Financial Position
Interest Rate Currencies
63 % Fixed 53 % THB
37 % Float 47 % USD & Others
Loan Type
• Cost of long term debts ~ 4.88%
(Include W/H Tax)
• Average loan life after refinancing -
5.08 Years
Treasury policy Net IBD to Equity ratio of ≤ 0.7x Net IBD to EBITDA ratio of ≤ 2.4x
Maturity of Financial Debt* as at Dec. 31, 2013
THB 120 Bn
THB Bn
* After Refinance
6
3
• C
16.7
8.9 9.7
14.9 14.4
7.8 11.7
1.0
32.9
0.3
2014 2015 2016 2017 2018 2019 2020 2021 2022 2023
PTTGC PPCL Others
1.34 1.30
0.32 0.31
0.0x0.2x0.4x0.6x0.8x1.0x1.2x1.4x1.6x
31 Dec. 12 31 Dec. 13
Net IBD / EBITDA
Net IBD/Equity
16.16% 14.44
% 10.43
% 9.42%
5%
10%
15%
20%
31 Dec. 12 31 Dec. 13
ROE ROA
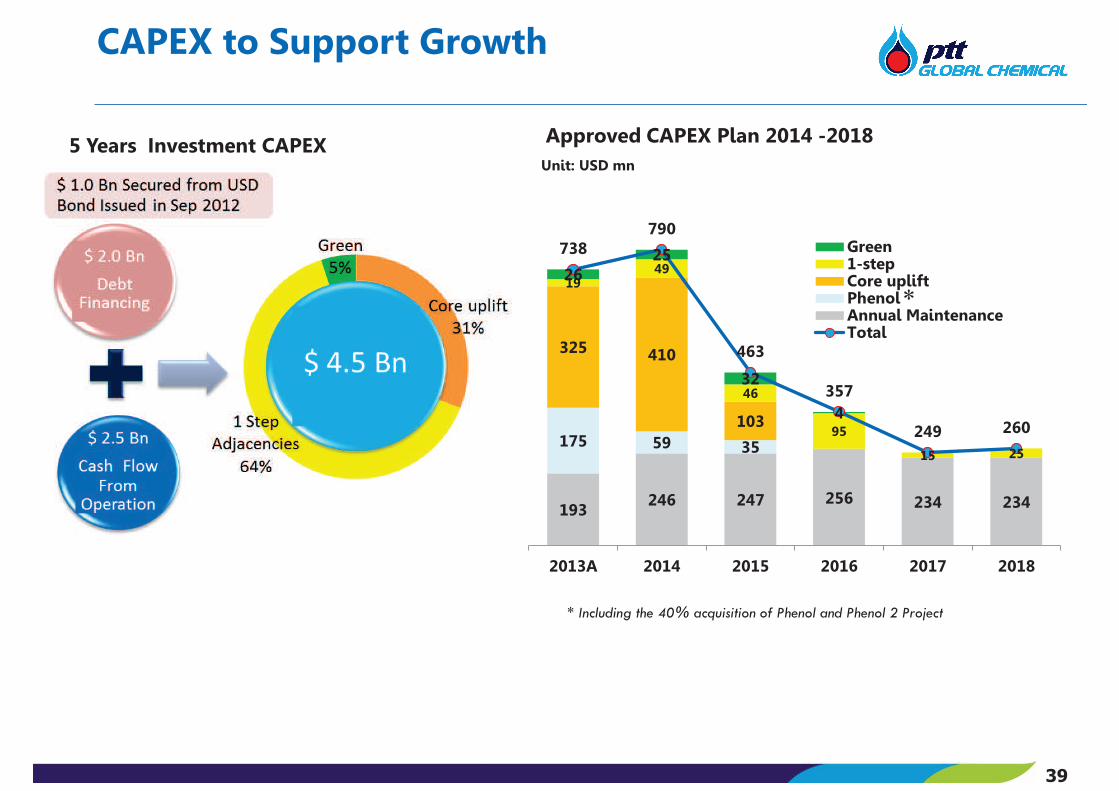
CAPEX to Support Growth Approved and Uncommitted CAPEX Plan for year 2013 - 2017
39
Approved CAPEX Plan 2014 -2018
Unit: USD mn5 Years Investment CAPEX
193 246 247 256 234 234
175 59 35
325 410
103
19 49
46
95
15 25
26 25
32
4
738 790
463
357
249 260
2013A 2014 2015 2016 2017 2018
Green1-stepCore upliftPhenolAnnual MaintenanceTotal
* Including the 40% acquisition of Phenol and Phenol 2 Project
*

Agenda
q Overview of PTTGC
q Basic Knowledge of Petrochemical Industry
q Competitiveness and Key Driver
q Strategy and Execution
q Conclusion
q Appendix
40 40

Commodity Chemical Competitiveness Criteria
41

• Thailand’s largest ethane-base cracker with integrated aromatics and refining businesses
• Highly competitive cost structure with pricing arrangement for gas feedstock based upon
equitable return on investment for both PTT and PTTGC
• Fully integrated petrochemical and refinery operations with diversified product portfolio
covering full hydrocarbon chain
• Strong footprint in fast growing regions with 5 operating countries worldwide
• Committed to operational excellence targeting best in class/ first quartile business efficiency
• PTT’s Chemical Flagship
Overview of PTTGC
42 42

43
For further information & enquiries, please contact our Investor Relations Team at [email protected]
Thank You
1 Thitipong Jurapornsiridee VP - Corporate Finance & IR [email protected] +662-265-8574
2 Puvadol Vasudhara IR Manager [email protected] +662-140-8712
3 Panugorn Puengpradit IR Analyst [email protected] +662-140-8714
4 Prang Chudasring IR Analyst [email protected] +662-265-8327
5 Chutima Jarikasem IR Coordinator [email protected] +662-140-8713


