51
STATE OF THE WATERSHED – Report on Surface Water Quality The San Gabriel River Watershed California Regional Water Quality Control Board – Los Angeles Region June 2000

STATE OF THE WATERSHED – Report on Surface Water Quality
The San Gabriel River Watershed
California Regional Water Quality Control Board – Los Angeles RegionJune 2000

TABLE OF CONTENTS
Executive Summary_______________________________________________________i
State of the Watershed____________________________________________________1Physical Description of River, Tributaries, and Structures___________________________1
The Watershed’s Designated Beneficial Uses______________________________________4
Watershed Stakeholder Groups________________________________________________10
Water Resources, and Groundwater Agencies and Issues___________________________10
Discharges into the Watershed_________________________________________________12
Current Water Quality Impairments____________________________________________16
Overview of Existing Monitoring Data__________________________________________18
Recommendations for Future Monitoring________________________________________23
Potential Long-term Activities_________________________________________________24
References_____________________________________________________________25
Figures________________________________________________________________26

Executive Summary
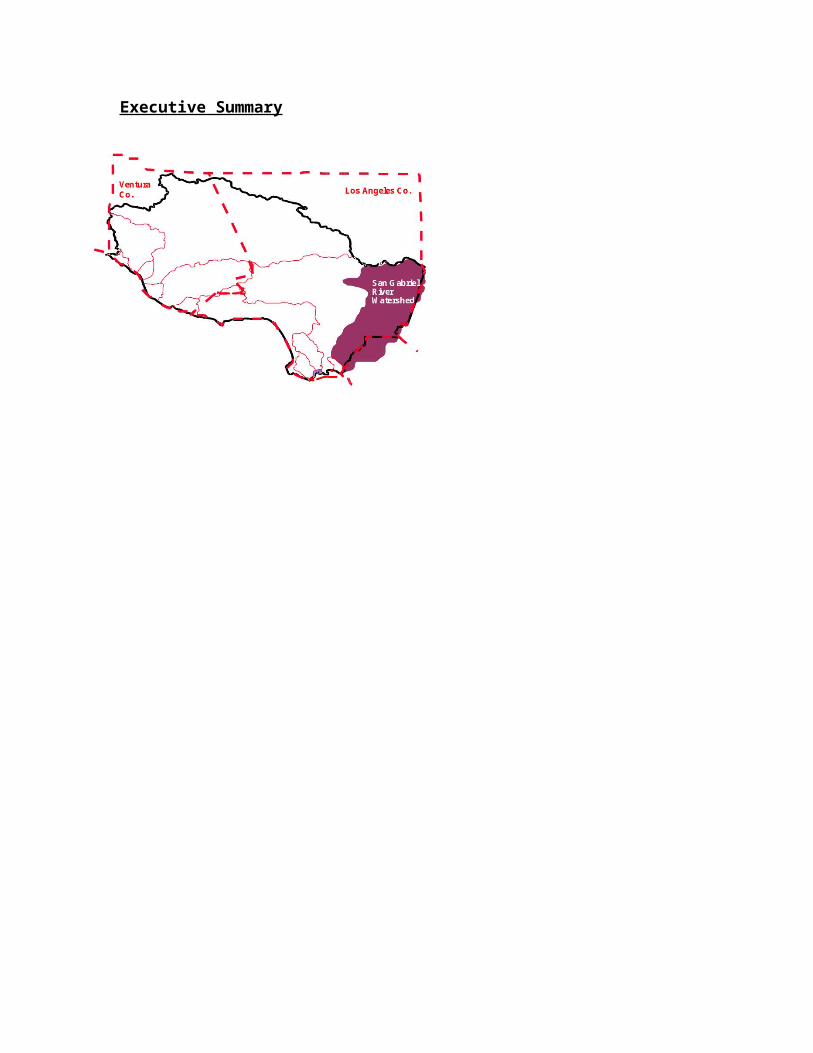
The San Gabriel River receives drainage from a 689 square mile area of eastern Los Angeles County; its headwaters originate in National Forest lands in the San Gabriel Mountains. The watershed consists of extensive areas of undisturbed riparian and woodland habitats in its upper reaches. Much of the watershed of the West Fork and East Fork of the river has been set aside by the U.S. Congress as a wilderness area; other areas (particularly the East Fork and lower North Fork )in the upper watershed are subject to heavy recreational use. The upper watershed also contains a series of flood control dams. Further downstream, toward the middle of the watershed, are large spreading grounds utilized for groundwater recharge. The watershed is hydraulically connected to the Los Angeles River through the Whittier Narrows Reservoir (occurring mostly during high storm flows). The lower part of the river flows through a concrete-lined channel in a heavily urbanized portion of the county before becoming an soft bottom channel once again near the ocean in the city of Long Beach. Large electrical power poles line the river along the channelized portion and nurseries, small stable areas, and a large poultry farm are located in these areas (CRWQCB-LA Region, 2000).
Water Quality Problems and Issues
Pollutants from dense clusters of residential and commercial land uses have impaired water quality in the middle and lower watershed. Tertiary-treated effluent from several sewage treatment plants enters the river in its middle reaches (which is partially channelized) while two power generating stations discharge cooling water into the river's estuary. The watershed is also covered under the municipal storm water NPDES permit. Several landfills are also located in the watershed.
Existing Beneficial Uses designated in the watershed:
Estuary Above Estuary (various reaches) Contact & noncontact Contact & noncontact
water recreation water recreationIndustrial service supply Industrial service supplyProtection of rare & Protection of rare &
endangered species endangered speciesWildlife habitat Wildlife habitatSpawning SpawningMarine habitat Warm- & coldwater habitatEstuarine habitat Municipal water supplyNavigation Groundwater rechargeCommercial & sportfishing Industrial process supplyMigratory Agricultural supply
Three reservoirs, which were constructed primarily for flood control purposes, occur in the upper part of the watershed. Frequent removal of accumulated sediments is necessary to maintain the flood control capacity of these reservoirs. Some of the removal methods previously used have had short-term water quality impacts. Continued need for such maintenance could cause longer-term impacts (CRWQCB-LA Region, 2000).
Permitted discharges:
Nine major NPDES dischargers (five POTWs)
25 minor permits 39 discharges covered under general permits 536 dischargers covered under an industrial
storm water permit 170 dischargers covered under a construction
storm water permit
Significant Issues:
Sluicing of reservoirs Protection of groundwater
recharge areas Trash Watershed-wide monitoring Mining/stream,
modifications Ambient toxicity Urban and storm water
runoff quality Nonpoint source loadings
from nurseries and horse stables
Estuary dynamics Restoration of wetlands
ii

IMPAIRMENTS: The upper reaches of the river (in the Angeles National Forest) are heavily used for recreational purposes and have been impacted from trash (303(d)-listed as an impairment), debris, and habitat destruction. Various reaches of the river are on the 1998 303(d) list due to nitrogen and its effects, trash, PCBs and pesticides, metals, and coliform (CRWQCB-LA Region, 2000).
iii

State of the Watershed
This document is primarily a report on surface water quality in the San Gabriel River Watershed. However, topics such as a physical description of the river and structures, water resources and related issues, groundwater agencies, and other broader topics are also included as needed. The reader may need to consult other documents for more detailed descriptions of habitats, wildlife, and structures than this document is meant to provide. This document will be updated in future watershed cycles.
Physical Description of River, Tributaries, and Structures
The San Gabriel River receives drainage from a 689 square mile area of eastern Los Angeles County and has a main channel length of approximately 58 miles; its headwaters originate in the San Gabriel Mountains with the East, West, and North Forks. The river empties to the Pacific Ocean at Los Angeles/ Orange Counties boundary in Long Beach. The main tributaries of the river are Big and Little Dalton Wash, San Dimas Wash, Walnut Creek, San Jose Creek, Fullerton Creek, and Coyote Creek (LA County DPW, 1994).
The Upper Watershed
The watershed consists of extensive areas of undisturbed riparian and woodland habitats in its upper reaches, much of which is set aside as a wilderness area by the U.S. Congress. Other areas in the upper watershed are subject to heavy recreational use. The upper watershed also contains a series of reservoirs with flood control dams (Cogswell, San Gabriel, and Morris Dams, going downstream) (CRWQCB-LA Region, 2000). Cogswell Dam (formerly San Gabriel Dam No. 2) is located 22 miles north of the city of Azusa on the West Fork of the San Gabriel River. Construction of the dam was begun in 1932 and was completed in 1934. Its primary purposes are flood control and water conservation and it drains an area of 39.2 square miles. San Gabriel Dam (formerly San Gabriel Dam No. 1) is located 7.5 miles north of the city of Azusa on the San Gabriel River. Construction of the dam was begun in 1932 and was completed in 1939. Its primary purposes are flood control and water conservation and it drains an area of 202.7 square miles. Morris Dam is located 5 miles north of the city of Azusa on the San Gabriel River. Construction of the dam was begun in 1932 and was completed in 1935. Its primary purpose is water conservation and it drains an area of 217 square miles (LA County DPW websites). There are a number of “beneficial uses” designated for these reservoirs (as well as all the waters of this watershed) by the CRWQCB-LA Region; see page 5 for further information.
Santa Fe Dam
The river flows out of the San Gabriel Canyon and into the San Gabriel Valley entering first the Santa Fe Dam and spreading grounds. Santa Fe Dam and Reservoir is a flood control project constructed under the authorization of the Flood Control Act of 1936 and operated by the U.S. Army Corps of Engineers, Los Angeles District. Construction of the project started in 1941and was completed in 1949 (USACE LA District, Reservoir Regulation Section website).
The project is located on the San Gabriel River about 4 miles downstream from the mouth of the San Gabriel Canyon. The Rio Hondo, a distributary of the San Gabriel River, branches from the river just below Santa Fe Dam and flows westward to Whittier Narrows Reservoir. From Whittier Narrows Reservoir, the San Gabriel River flows south to the Pacific Ocean, and the Rio Hondo flows southwestward to the Los Angeles River (USACE LA District, Reservoir Regulation Section website).
Santa Fe Dam is an element of the Los Angeles County Drainage Area (LACDA) flood control system. The primary purpose of Santa Fe Dam is to provide flood protection to downstream communities along the San Gabriel River between the Santa Fe Dam and Whittier Narrows Dam, and , in conjunction with the Whittier Narrows Dam, provide flood protection along the Rio Hondo Channel, the Los Angeles River, and the San Gabriel River. The second authorized purpose of the Santa Fe Dam is to provide recreation opportunities. The Santa Fe basin also includes a Wildlife Management Area, a designated sensitive habitat area. The flood control operation of Santa Fe Dam is also coordinated with the operation of other Corps dams in the LACDA system, namely Whittier Narrows Dam, Hansen Dam and Sepulveda Dam.

Although it has no authorized storage allocation for water supply, its flood control operation provides incidental water conservation benefits to the people of San Gabriel Valley and other parts of the Los Angeles Basin (USACE LA District, Reservoir Regulation Section website and USACE LA District, 1998).
Santa Fe Dam contains sixteen hydraulically operated gates set to pass low flows and build a debris pool during high inflows. Discharge rates within the debris pool range allows the Los Angeles County Department of Public Works to divert the flow to its spreading facilities, thereby enhancing water conservation. Once the reservoir level reaches elevation 456 feet, flood control releases are initiated and the flood pool is drained as rapidly as possible, consistent with the achievement of downstream flood control. As soon as the flood pool is drained, releases are reduced so that LACDPW can resume water conservation operation. (USACE LA District, Reservoir Regulation Section website).
The LACDPW has operated and maintained the Santa Fe Reservoir Spreading Grounds (SFRSG) since 1953 through an easement with the USACE. Stormwater and imported water diverted from the San Gabriel River are spread in the area. The spreading grounds are east and west of the San Gabriel River and occupy the northwest portion of the Santa Fe Reservoir. The SFRSG receives controlled releases from Morris Dam; also receives seasonal local flows originating in San Gabriel Canyon and imported water releases from the Upper San Gabriel Valley Municipal Water District’s USG-3 outlet and from the San Gabriel Valley Municipal Water District’s outlet to Beatty Channel (USACE - LA County DPW/Water Conservation Division, 1995).
The spreading grounds recharge water to the Main San Gabriel Basin underlying the San Gabriel Valley. The basin has an estimated storage capacity of 9.5 million acre-feet and is bounded by the San Gabriel Mountains on the north, the Puente Hills on the south, the San Jose Hills to the east, and the San Rafael Hills to the west. The Santa Fe Dam Recreation Area is located approximately one mile southeast of the SFRSG (USACE - LA County DPW/Water Conservation Division, 1995).
The Santa Fe Dam Floodplain has been designated as a LA County Significant Ecological Area (SEA No. 22) as defined by the County Zoning Code. This area has been designated as a Class 3 (5,7) SEA. Class 3 designates an area where the biotic communities, vegetative associations, and habitat of plant and animal species that are either one of a kind or restricted in distribution in LA County. Class 5 designates an area that contains biotic resources that are of scientific interest because they are either an extreme in physical/geographical limitations or they represent an unusual variation in a population or community. Class 7 designates areas that would provide for the preservation of relatively undisturbed examples of the natural biotic communities in LA County. The extensive alluvial fan sage scrub, lowland riparian, and freshwater marsh habitats located in the flood control basin are the major resources supporting the SEA designation (USACE - LA County DPW/Water Conservation Division, 1995).
The Area Between Santa Fe and Whittier Narrows Dams
The San Gabriel River Channel between Santa Fe Dam and the Whittier Narrows Basin is soft-bottomed with riprap sides. LACDPW has constructed a rubber dam in the San Gabriel River channel just downstream of the Walnut Creek confluence which can impound up to 400 AF (USACE LA District, 1998).
Walnut Creek is a tributary to the San Gabriel River above the Whittier Narrows area. Puddingstone Reservoir is located on upper Walnut Creek and is operated for flood control, water conservation, and recreation with a relatively small flood control allocation (USACE LA District, 1998).
San Jose Creek, a soft-bottomed channel, also enters the San Gabriel River upstream of the Whittier Narrows area, but downstream of the Walnut Creek confluence and its dry-weather flow is dominated by tertiary-treated effluent from a nearby treatment plant.
2

Whittier Narrows Dam
Whittier Narrows Dam is a flood control and water conservation project constructed and operated by the USACE, Los Angeles District. Construction of the project was completed in 1957. The Whittier Narrows are a natural gap in the hills that form the southern boundary of the San Gabriel Valley. The Rio Hondo and the San Gabriel River flow through this gap and are impounded by the reservoir (USACE LA District, Reservoir Regulation Section website).
The purpose of the project is to collect runoff from upstream along with releases into the San Gabriel River from Santa Fe Dam, thus, the primary authorized purpose of Whittier Narrows Dam is flood control. Subsequent Acts of Congress authorized the development of the area for park and recreational purposes. There is also a nature area located in the southeast area of the basin which was developed as mitigation for the established recreation facilities. The third authorized purpose of water conservation was granted in 1956 (USACE LA District, Reservoir Regulation Section website and USACE LA District, 1998).
If the inflow to the reservoir exceeds the groundwater recharge capacity of the spreading grounds along the Rio Hondo or the bed of the San Gabriel River downstream, this water is stored temporarily in a water conservation pool. The Rio Hondo and San Gabriel sides of the reservoir each have their own water conservation pools. If the water conservation pool on the Rio Hondo side is exceeded, flows are released into the Rio Hondo at a rate which does not exceed the downstream channel capacity of either the Rio Hondo or the LA River. If the water conservation pool on either side of the reservoir is exceeded a release of approximately 5,000 cfs can be made into the San Gabriel River. If the pool in the reservoir exceeds flood control storage, the gates on the San Gabriel River outlet begin to open automatically and emergency releases are made into the river (USACE LA District, Reservoir Regulation Section website).
The gates on the Rio Hondo outlet are normally wide open. On the San Gabriel side one gate is normally open about 0.5 feet with the remaining gates closed. The reservoir is normally empty and a weir within the reservoir keeps the flows from the Rio Hondo and the San Gabriel River separated. The natural flow to each river therefore normally passes through the dam unhindered. During the initial stages of a flood event, the gates on the Rio Hondo side are partially closed to build a water conservation pool. As long as the pool on the Rio Hondo side of the reservoir is below a certain elevation, releases are made to accommodate the capacity of the spreading grounds downstream along the Rio Hondo. All outflow to the San Gabriel River from Whittier Narrows Dam is through or over the spillway gates. Whittier Narrows currently provides greater than 100-year protection to areas downstream from the spillway on the San Gabriel River. There are plans to retain more water behind both Santa Fe and Whittier Narrows Dams, and in turn increase downstream water recharge, through increasing the size of the pools behind the dams and releasing water at a slower rate (USACE LA District, Reservoir Regulation Section website and USACE LA District, 1998).
Potentially occurring federal and state listed and candidate species in the riparian habitat of the Whittier Narrows Dam area include Least Bell’s Vireo (federal and state listed) and tricolored blackbird (California species of special concern and a candidate for federal listing). The California gnatcatcher potentially occurs in the coastal sage scrub of the dam area and is a California species of special concern and federal threatened species (LA County DPW, 1994).
Recharge Areas Below Whittier Narrows
Further downstream, along the Rio Hondo and San Gabriel River, are large spreading grounds utilized for groundwater recharge. The stretch of the river below the Whittier Narrows area overlies the Central Basin groundwater basin which contains a number of shallow aquifers and three deeper aquifers (the Silverado, the Sunnyside, and the Lynwood). The deep and shallow aquifers are recharged by underflow through the Whittier Narrows from the north, and by percolation from the San Gabriel River and the Rio Hondo Channel, which flows into the Montebello Forebay just south of the Narrows. This surface and subsurface flow through the Narrows represents outflow from the upstream San Gabriel Basin. The San Gabriel River and Rio Hondo are unlined in this area, allowing for groundwater recharge at the San Gabriel Coastal Basin Spreading Grounds and the Rio Hondo Spreading Grounds, respectively (LA County DPW, 1994).
3

The Montebello Forebay is a recharge facility located immediately downstream of Whittier Narrows Dam and allows infiltration into the Central Basin aquifer. The Rio Hondo Coastal Basin Spreading Grounds are located on the banks of the Rio Hondo south of Whittier Boulevard, 2 miles downstream from the Whittier Narrows Dam. The spreading grounds are owned and operated by the LACDPW which uses gates across the Rio Hondo to divert flow to three separate intake structures. The San Gabriel River Coastal Spreading Basins are operated by the LACDPW. They are located on the west side of the San Gabriel River between Whittier Boulevard and Washington Boulevard. Water is diverted to the grounds by way of two rubber dams across the soft-bottomed river channel (USACE LA District, 1998).
Up to an annual average of 50,000 AF per year of reclaimed water is used to supplement local surface water and imported water for replenishing the Central Basin aquifer through the Montebello Forebay. The source of reclaimed water is from the following three water reclamation plants owned and operated by the County Sanitation Districts of Los Angeles County (CSDLAC): Whittier Narrows, San Jose Creek, and Pomona (CSDLAC, 2000).
The Lower Watershed
The lower part of the river flows through a concrete-lined channel in a heavily urbanized portion of the county before becoming an soft bottom channel once again near the ocean in the city of Long Beach. The concrete-lined Coyote Creek joins the San Gabriel River at the tidal prism in Long Beach south of Willow Street (CRWQCB-LA Region, 2000).
The Alamitos Barrier is an engineered freshwater pressure ridge and seawater trough located in the City of Long Beach. The Barrier is designed to protect the Central Groundwater Basin of Los Angeles County and the Orange County Groundwater Basin (which are geologically one basin) from seawater intrusion through an alluvium-filled erosional gap, commonly known as the Alamitos Gap. Currently, the Barrier is maintained through the injection of treated, imported potable water. The seawater trough is created by the extraction of brackish groundwater from four wells located on the seaward side of the injection well arc, and barrier performance is monitored through observations conducted at 230 wells located at multiple sites near the gap (Water Replenishment District of Southern California, 1998).
The combination of wells is designed to reverse the inland gradient of subsurface water and thus prevent further seaward intrusion. The Central Basin Municipal Water District supplies imported water to the Water Replenishment District of Southern California for groundwater replenishment and barrier injection (Water Replenishment District of Southern California, 1998).
The Watershed’s Designated Beneficial Uses
The Los Angeles Regional Board’s Basin Plan is designed to preserve and enhance water quality and protect the beneficial uses of all regional waters. Beneficial uses form the cornerstone of water quality protection. Once beneficial uses are designated, appropriate water quality objectives can be established and programs that maintain or enhance water quality can be implemented to ensure the protection of beneficial uses. The designated beneficial uses, together with water quality objectives, form water quality standards. Such standards are mandated for all waterbodies within the state under the California Water Code. In addition, the federal Clean Water Act mandates standards for all surface waters, including wetlands (CRWQCB-LA Region, 1994).
There are twenty-four beneficial uses in the Region as a whole; examples include wildlife habitat, municipal water supply, navigation, and marine habitat. These uses and their definitions were developed by the State and Regional Boards for use in the Regional Board Basin Plans. Beneficial uses can be designated for a waterbody in a number of ways. Those uses that have been attained for a waterbody on, or after, November 28, 1975, must be designated as “existing” in the Basin Plans. Other uses can be designated, whether or not they have been attained in a waterbody, in order to implement either federal or state mandates and goals (such as fishable and swimmable) for regional waters. Beneficial uses of streams that have intermittent flows, which can support some beneficial uses during dry periods through shallow ground water or small pools, are designated as intermittent. In addition, a use can be designated as
4

“potential” if there are plans or potential to put the water to such future use among other reasons (CRWQCB-LA Region, 1994).
5

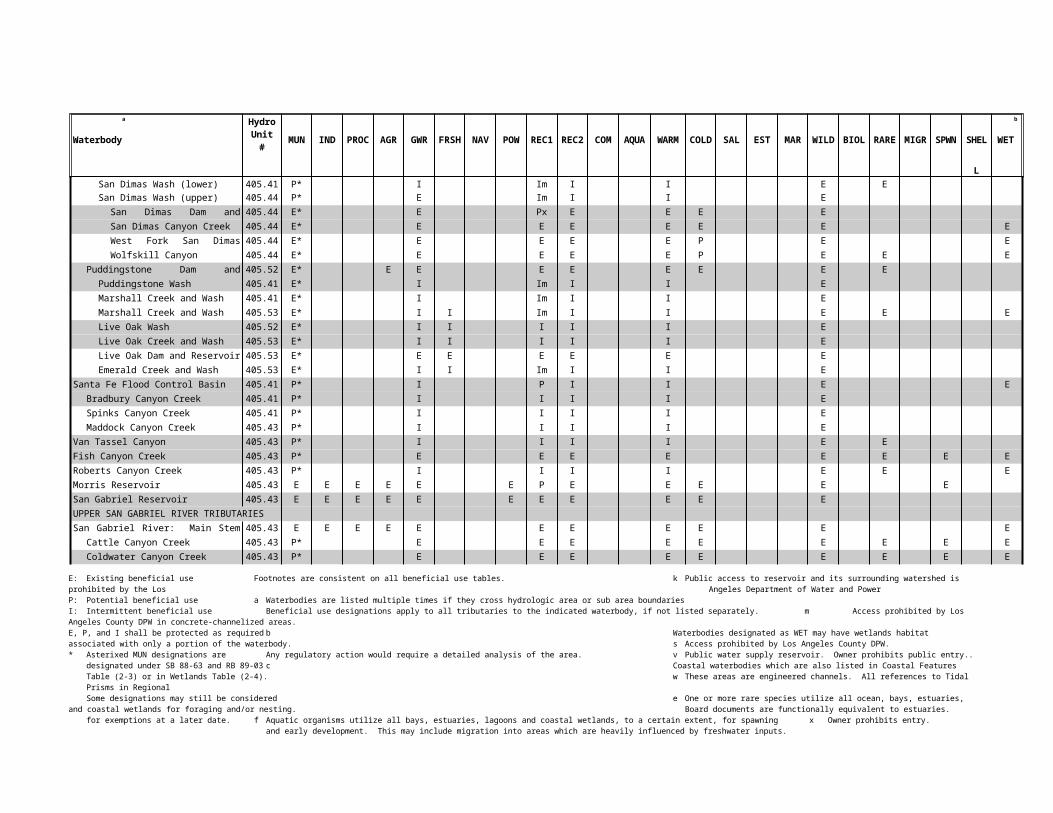
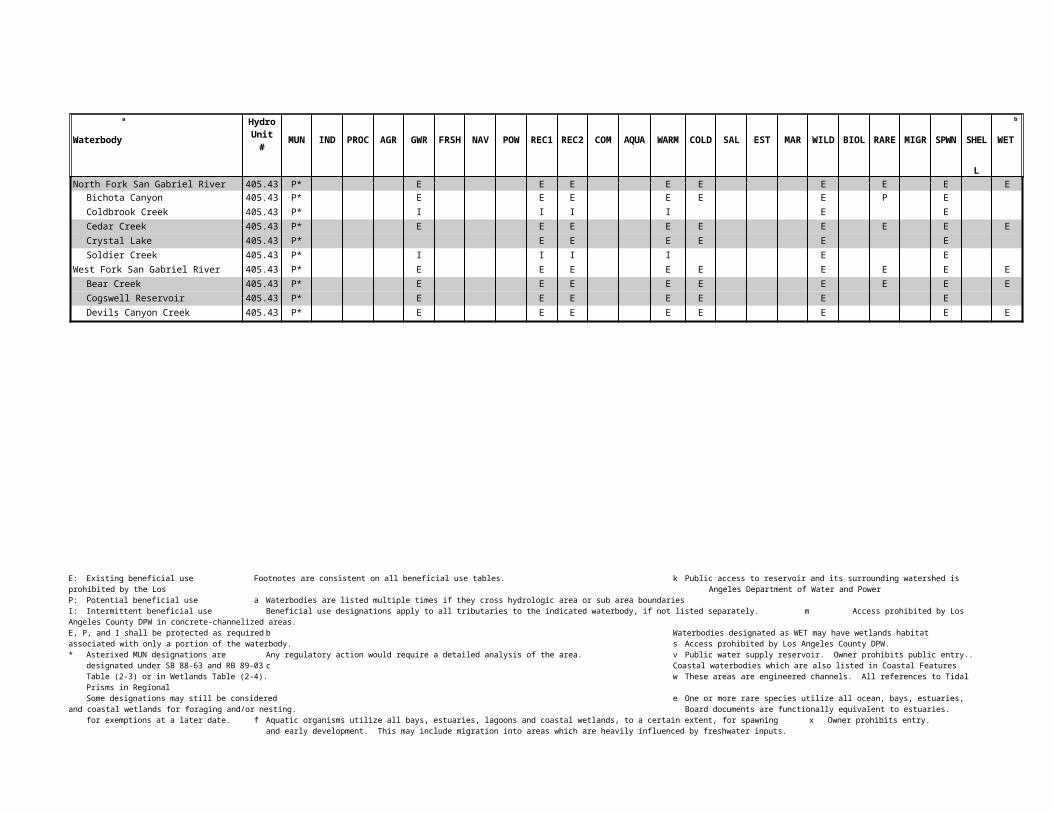
The beneficial uses of the San Gabriel River and its tributaries are listed in the table below as they appear in the Los Angeles Regional Board’s Basin Plan
Waterbody
a Hydro Unit
# MUN IND PRO
C
AGR GWR FRS
H
NAV POW REC
1
REC
2
COM AQU
A
WAR
M
COL
D
SAL EST MAR WIL
D
BIOL RAR
E
MIG
R
SPW
N
SHEL
L
WETb
SAN GABRIEL RIVER WATERSHEDSan Gabriel River Estuary c,w 405.15 E E E E E E E E Ee Ef Ef PSan Gabriel River Firestone Blvd Estuary
405.15 P* Em E P P
San Gabriel River Whittier N-Firestone
405.15 P* P P I Em E I E ESan Gabriel River 405.41 P* I Im I I ESan Gabriel River 405.42 E E E E E E E E E E ESan Gabriel River. Main Stem z 405.43 E E E E E E E E E E E
North Fork San Gabriel River 405.43West Fork San Gabriel River 405.43East Fork San Gabriel River 405.43
Coyote Creek to Estuary 405.15 P* P P Pm I P P EWhittier Narrows Flood Control Basin 405.41 P* E E E E E P
Legg Lake 405.41 P* E E E E E E ESan Jose Creek 405.41 P* I Pm I I ESan Jose Creek 405.51 P* I Pm I I E
Puente Creek 405.41 P* I P I P PThompson Wash 405.52 P* I Im I I EThompson Creek 405.53 P* I I I I E EThompson Creek Dam & Reservoir
405.53 P* I Px I I E EWalnut Creek Wash 405.41 P* I Im I I E E
Big Dalton Wash 405.41 P* I Pm I P PBig Dalton Canyon Creek 405.41 P* I I I I E EMystic Canyon 405.41 P* I I I I EBig Dalton Dam & Reservoir 405.41 P* E Px E E E
Bell Canyon Creek 405.41 P* I I I I ELittle Dalton Wash 405.41 P* I Pm I P P
Little Dalton Canyon Creek 405.41 P* I I I I E E
E: Existing beneficial use Footnotes are consistent on all beneficial use tables. k Public access to reservoir and its surrounding watershed is prohibited by the Los Angeles Department of Water and PowerP: Potential beneficial use a Waterbodies are listed multiple times if they cross hydrologic area or sub area boundaries I: Intermittent beneficial use Beneficial use designations apply to all tributaries to the indicated waterbody, if not listed separately. m Access prohibited by Los Angeles County DPW in concrete-channelized areas.E, P, and I shall be protected as required b Waterbodies designated as WET may have wetlands habitat associated with only a portion of the waterbody. s Access prohibited by Los Angeles County DPW.* Asterixed MUN designations are Any regulatory action would require a detailed analysis of the area. v Public water supply reservoir. Owner prohibits public entry..
designated under SB 88-63 and RB 89-03 c Coastal waterbodies which are also listed in Coastal Features Table (2-3) or in Wetlands Table (2-4). w These areas are engineered channels. All references to Tidal Prisms in Regional Some designations may still be considered e One or more rare species utilize all ocean, bays, estuaries, and coastal wetlands for foraging and/or nesting. Board documents are functionally equivalent to
estuaries.for exemptions at a later date. f Aquatic organisms utilize all bays, estuaries, lagoons and coastal wetlands, to a certain extent, for spawning x Owner prohibits entry.
and early development. This may include migration into areas which are heavily influenced by freshwater inputs.

Waterbody
a Hydro Unit
# MUN IND PRO
C
AGR GWR FRS
H
NAV POW REC
1
REC
2
COM AQU
A
WAR
M
COL
D
SAL EST MAR WIL
D
BIOL RAR
E
MIG
R
SPW
N
SHEL
L
WETb
San Dimas Wash (lower) 405.41 P* I Im I I E ESan Dimas Wash (upper) 405.44 P* E Im I I E
San Dimas Dam and Reservoir
405.44 E* E Px E E E ESan Dimas Canyon Creek 405.44 E* E E E E E E EWest Fork San Dimas
Canyon405.44 E* E E E E P E E
Wolfskill Canyon 405.44 E* E E E E P E E EPuddingstone Dam and Reservoir 405.52 E* E E E E E E E E
Puddingstone Wash 405.41 E* I Im I I EMarshall Creek and Wash 405.41 E* I Im I I EMarshall Creek and Wash 405.53 E* I I Im I I E E ELive Oak Wash 405.52 E* I I I I I ELive Oak Creek and Wash 405.53 E* I I I I I ELive Oak Dam and Reservoir 405.53 E* E E E E E EEmerald Creek and Wash 405.53 E* I I Im I I E
Santa Fe Flood Control Basin 405.41 P* I P I I E EBradbury Canyon Creek 405.41 P* I I I I ESpinks Canyon Creek 405.41 P* I I I I EMaddock Canyon Creek 405.43 P* I I I I E
Van Tassel Canyon 405.43 P* I I I I E EFish Canyon Creek 405.43 P* E E E E E E E ERoberts Canyon Creek 405.43 P* I I I I E E EMorris Reservoir 405.43 E E E E E E P E E E E ESan Gabriel Reservoir 405.43 E E E E E E E E E E EUPPER SAN GABRIEL RIVER TRIBUTARIESSan Gabriel River: Main Stem z 405.43 E E E E E E E E E E E
Cattle Canyon Creek 405.43 P* E E E E E E E E EColdwater Canyon Creek 405.43 P* E E E E E E E E ECow Canyon Creek 405.43 P* E E E E E E E E E
East Fork San Gabriel River 405.43 P* E E E E E E E E EAllison Gulch 405.43 P* E E E E E E E EFish Fork 405.43 P* E E E E E E E E
E: Existing beneficial use Footnotes are consistent on all beneficial use tables. k Public access to reservoir and its surrounding watershed is prohibited by the Los Angeles Department of Water and PowerP: Potential beneficial use a Waterbodies are listed multiple times if they cross hydrologic area or sub area boundaries I: Intermittent beneficial use Beneficial use designations apply to all tributaries to the indicated waterbody, if not listed separately. m Access prohibited by Los Angeles County DPW in concrete-channelized areas.E, P, and I shall be protected as required b Waterbodies designated as WET may have wetlands habitat associated with only a portion of the waterbody. s Access prohibited by Los Angeles County DPW.* Asterixed MUN designations are Any regulatory action would require a detailed analysis of the area. v Public water supply reservoir. Owner prohibits public entry..
designated under SB 88-63 and RB 89-03 c Coastal waterbodies which are also listed in Coastal Features Table (2-3) or in Wetlands Table (2-4). w These areas are engineered channels. All references to Tidal Prisms in Regional Some designations may still be considered e One or more rare species utilize all ocean, bays, estuaries, and coastal wetlands for foraging and/or nesting. Board documents are functionally equivalent to
estuaries.for exemptions at a later date. f Aquatic organisms utilize all bays, estuaries, lagoons and coastal wetlands, to a certain extent, for spawning x Owner prohibits entry.
and early development. This may include migration into areas which are heavily influenced by freshwater inputs.

Waterbody
a Hydro Unit
# MUN IND PRO
C
AGR GWR FRS
H
NAV POW REC
1
REC
2
COM AQU
A
WAR
M
COL
D
SAL EST MAR WIL
D
BIOL RAR
E
MIG
R
SPW
N
SHEL
L
WETb
North Fork San Gabriel River 405.43 P* E E E E E E E E EBichota Canyon 405.43 P* E E E E E E P EColdbrook Creek 405.43 P* I I I I E ECedar Creek 405.43 P* E E E E E E E E ECrystal Lake 405.43 P* E E E E E ESoldier Creek 405.43 P* I I I I E E
West Fork San Gabriel River 405.43 P* E E E E E E E E EBear Creek 405.43 P* E E E E E E E E ECogswell Reservoir 405.43 P* E E E E E E EDevils Canyon Creek 405.43 P* E E E E E E E E
E: Existing beneficial use Footnotes are consistent on all beneficial use tables. k Public access to reservoir and its surrounding watershed is prohibited by the Los Angeles Department of Water and PowerP: Potential beneficial use a Waterbodies are listed multiple times if they cross hydrologic area or sub area boundaries I: Intermittent beneficial use Beneficial use designations apply to all tributaries to the indicated waterbody, if not listed separately. m Access prohibited by Los Angeles County DPW in concrete-channelized areas.E, P, and I shall be protected as required b Waterbodies designated as WET may have wetlands habitat associated with only a portion of the waterbody. s Access prohibited by Los Angeles County DPW.* Asterixed MUN designations are Any regulatory action would require a detailed analysis of the area. v Public water supply reservoir. Owner prohibits public entry..
designated under SB 88-63 and RB 89-03 c Coastal waterbodies which are also listed in Coastal Features Table (2-3) or in Wetlands Table (2-4). w These areas are engineered channels. All references to Tidal Prisms in Regional Some designations may still be considered e One or more rare species utilize all ocean, bays, estuaries, and coastal wetlands for foraging and/or nesting. Board documents are functionally equivalent to
estuaries.for exemptions at a later date. f Aquatic organisms utilize all bays, estuaries, lagoons and coastal wetlands, to a certain extent, for spawning x Owner prohibits entry.
and early development. This may include migration into areas which are heavily influenced by freshwater inputs.

Beneficial Use Definitions
Beneficial uses for waterbodies in the Los Angeles Region are listed and defined below. The uses are listed in no preferential order.
Municipal and Domestic Supply (MUN) Uses of water for community, military, or individual water supply systems including, but not limited to, drinking water supply.
Agricultural Supply (AGR) Uses of water for farming, horticulture, or ranching including, but not limited to, irrigation, stock watering, or support of vegetation for range grazing.
Industrial Process Supply (PROC) Uses of water for industrial activities that depend primarily on water quality.
Industrial Service Supply (IND) Uses of water for industrial activities that do not depend primarily on water quality including, but not limited to, mining, cooling water supply, hydraulic conveyance, gravel washing, fire protection, or oil well re-pressurization.
Ground Water Recharge (GWR)Uses of water for natural or artificial recharge of ground water for purposes of future extraction, maintenance of water quality, or halting of saltwater intrusion into freshwater aquifers.
Freshwater Replenishment (FRSH) Uses of water for natural or artificial maintenance of surface water quantity or quality (e.g., salinity).
Navigation (NAV)Uses of water for shipping, travel, or other transportation by private, military, or commercial vessels.
Hydropower Generation (POW) Uses of water for hydropower generation.
Water Contact Recreation (REC-1) Uses of water for recreational activities involving body contact with water, where ingestion of water is reasonably possible. These uses include, but are not limited to, swimming, wading, water-skiing, skin and scuba diving, surfing, white water activities, fishing, or use of natural hot springs.
Non-contact Water Recreation (REC-2) Uses of water for recreational activities involving proximity to water, but not normally involving body contact with water, where ingestion of water is reasonably possible. These uses include, but are not limited to, picnicking, sunbathing, hiking, beachcombing, camping, boating, tidepool and marine life study, hunting, sightseeing, or aesthetic enjoyment in conjunction with the above activities.
Commercial and Sport Fishing (COMM) Uses of water for commercial or recreational collection of fish, shellfish, or other organisms including, but not limited to, uses involving organisms intended for human consumption or bait purposes.
Aquaculture (AQUA) Uses of water for aquaculture or mariculture operations including, but not limited to, propagation, cultivation, maintenance, or harvesting of aquatic plants and animals for human consumption or bait purposes.
9

Warm Freshwater Habitat (WARM)Uses of water that support warm water ecosystems including, but not limited to, preservation or enhancement of aquatic habitats, vegetation, fish, or wildlife, including invertebrates.
Cold Freshwater Habitat (COLD) Uses of water that support cold water ecosystems including, but not limited to, preservation or enhancement of aquatic habitats, vegetation, fish, or wildlife, including invertebrates.
Inland Saline Water Habitat (SAL) Uses of water that support inland saline water ecosystems including, but not limited to, preservation or enhancement of aquatic saline habitats, vegetation, fish, or wildlife, including invertebrates.
Estuarine Habitat (EST) Uses of water that support estuarine ecosystems including, but not limited to, preservation or enhancement of estuarine habitats, vegetation, fish, shellfish, or wildlife (e.g., estuarine mammals, waterfowl, shorebirds).
Wetland Habitat (WET)Uses of water that support wetland ecosystems, including, but not limited to, preservation or enhancement of wetland habitats, vegetation, fish, shellfish, or wildlife, and other unique wetland functions which enhance water quality, such as providing flood and erosion control, stream bank stabilization, and filtration and purification of naturally occurring contaminants.
Marine Habitat (MAR) Uses of water that support marine ecosystems including, but not limited to, preservation or enhancement of marine habitats, vegetation such as kelp, fish, shellfish, or wildlife (e.g., marine mammals, shorebirds).
Wildlife Habitat (WILD)Uses of water that support terrestrial ecosystems including, but not limited to, preservation and enhancement of terrestrial habitats, vegetation, wildlife (e.g., mammals, birds, reptiles, amphibians, invertebrates), or wildlife water and food sources.
Preservation of Biological Habitats (BIOL)Uses of water that support designated areas or habitats, such as Areas of Special Biological Significance (ASBS), established refuges, parks, sanctuaries, ecological reserves, or other areas where the preservation or enhancement of natural resources requires special protection.
Watershed Stakeholder Groups
Los Angeles/San Gabriel Rivers Watershed Council: This group was formed in 1995 following a large watershed conference held in the area which served to encourage other efforts. The Council has a board of directors and became incorporated as a nonprofit organization in 1996. The group is tracking watershed activities, but has primarily focused on flood control issues in the Los Angeles River as well as opportunities to create greenbelts and restore habitat. The Council's goal is to help facilitate a process to preserve, restore, and enhance all aspects of the double watershed. Currently, the Watershed council is heading up the Los Angeles County Task Force of the Southern California Wetlands Recovery Project. The Council is also initiating a Watershed Management Plan for both the Los Angeles and San Gabriel River. Their website is at http://www.lasgrwc.org/.
Friends of the Los Angeles River: Friends of the Los Angeles River is a non-profit organization founded in 1986 to protect and restore the natural and historic heritage of the Los Angeles River and its riparian habitat through inclusive planning, education, and stewardship. Their website is at http://www.folar.org/.
Friends of the San Gabriel River: Friends of the San Gabriel River is a non-profit organization founded in 1999 that advocates water quality improvements, restoration of habitat, and increased access to the river for the public. Their website is http://www.sangabrielriver.org/.
10

Water Resources, and Groundwater Agencies and Issues
Groundwater in certain areas of the San Gabriel Basin has been impacted by volatile organics attributable to widespread industrial land use and associated contaminant releases over the last several decades. In 1979, VOCs were discovered in a number of public water supply wells in the San Gabriel Basin. As a result, the USEPA and the Regional Board entered into a cooperative agreement in 1989 to identify and cleanup the contamination. Subsequent investigations revealed more widespread soil and groundwater contamination in the Basin. During the last 15 years, more than one quarter of the approximately 366 water supply wells in the San Gabriel Valley has been found to be contaminated. The Regional Board, under authority of the California Water Code, locates and abates the sources of pollutants affecting these wells and oversees the remediation of the pollution. These investigations, conducted through the Well Investigation Program (WIP), are designed to identify and eliminate sources of pollutants in public water supply wells; identify dischargers by establishing a cause-and-effect relationship between the discharge of a pollutant and a polluted well; when necessary, take enforcement action against dischargers in order to force them to undertake site investigations and corrective actions; and oversee remediation of soils.
Soil and groundwater in the San Gabriel Valley are contaminated by volatile organic compounds such as PCE, TCE, and 1,1,1-TCA. Since 1997, new chemicals called emerging chemicals have been found in drinking water and groundwater monitoring wells. These chemicals include perchlorate, NDMA, and 1,4-dioxane which are carcinogens or suspected carcinogens.
The Regional Board has been the lead agency that oversees soil cleanup and “hot spot” groundwater cleanup. These are sites where groundwater contamination is so significant it warrants site-specific cleanup. USEPA is the lead agency for the regional groundwater cleanup. The various operable units (Superfund areas) in the Valley, such as Baldwin Park, Whittier Narrows, Puente Valley, El Monte, South El Monte, and Alhambra are at various stages of site assessment and cleanup.
Although the main goal of hot spot cleanups is the removal of high levels of contaminants, responsible parties are encouraged to reduce their cleanup costs by either sharing soil and/or groundwater treatment systems or reusing treated groundwater in their processes (CRWQCB – LA Region website).
Agencies with a vested interest in water resources in southern California:
Los Angeles County Department of Public Works – The Los Angeles County Flood Control District was created in 1915 by the State legislature with the charge to control and conserve flood, storm, and other wastewaters. Since 1985 the LACDPW has been performing the functions of the flood control district. Under its conservation mission, LACDPW owns or operates 29 water spreading areas where groundwater is recharged. Several dams and reservoirs, including the U.S. Army Corps Whittier Narrows Dam, are operated to store water for post storm releases to downstream spreading grounds.
Metropolitan Water District of Southern California – The MWD is a public agency and quasi-municipal corporation. Currently the MWD imports water from two sources, the Colorado River via the Colorado River Aqueduct and Northern California via the State Water project and its California Aqueduct.. MWD’s primary purpose is to develop, store, and distributed water at wholesale rates to its member agencies. MWD is composed of 27 member agencies, including 14 cities, 12 municipal water districts, and one county water authority.
Department of Water and Power, City of Los Angeles – The DWP imports water from the Owens Valley and Mono Basin through the Los Angeles Aqueducts. The remainder of the City’s needs are supplied by local groundwater supplies and imported water from the MWD.
Water Replenishment District of Southern California – The primary objectives of the WRD are to provide high quality water to its users, minimize adverse effects produced by years of groundwater pumping, and to oversee groundwater recharge operations in the Central and West Coast Basins. WRD purchases water imported through the State Water Project or the Colorado River Project and reclaimed water from CSDLAC to supplement storm runoff to replenish the groundwater basins. Direct groundwater recharge is accomplished through percolation at the spreading grounds adjacent to the Rio Hondo and the San Gabriel River; further replenishment is accomplished by injecting water at three freshwater barriers (West Coast Basin, Dominguez Gap, and Alamitos Barriers).
11

County Sanitation Districts of Los Angeles County – The CSDLAC is a supplier of reclaimed water used during groundwater replenishment. Effluent from its facilities is a major part of the surface flow in the river during dry weather.
San Gabriel Valley Municipal Water District – The District is composed of four cities and imports water to the San Gabriel Basin via the East Branch of the State Water Project.
West Basin and Central Basin Municipal Water Districts – The West basin and Central Basin provide service to more than 40 cities and distribute wholesale water to approximately 50 separate water utilities. The Districts are involved in water conservation programs, water quality improvement projects, recycled water projects, and brackish groundwater desalting.
Upper San Gabriel Valley Municipal Water District – The District was incorporated in 1960 by popular referendum and was annexed to the MWD in 1963. The District was formed to help solve water supply problems of the rapidly developing San Gabriel Valley.
Three Valleys Municipal Water District – The Distract was formed in 1950 by popular referendum and was annexed to the MWD later in 1950. The District was formed to [provide supplemental imported water to serve growing needs of orchards and communities in the Pomona, Walnut, and eastern San Gabriel Valleys (LA County DPW, 1994).
Discharges into the Watershed
Major Dischargers
The Joint Outfall System (JOS) is the CSDLAC’s integrated network of facilities which includes seven treatment plants, five of which are associated with the San Gabriel River Watershed. These five treatment plants (Whittier Narrows, Pomona, Long Beach, Los Coyotes, and San Jose Creek) are connected to the Joint Water Pollution Control Plant (JWPCP) which discharge off of the Palos Verdes Peninsula. This system allows for the diversion of desired flows into or around each “upstream” plant. Sludge (sewage solids separated from the wastewaters) from the upstream plants are returned to the trunk sewer for treatment at JWPCP (CRWQCB – LA Region files).
The Whittier Narrows Water Reclamation Plant is located within the Whittier Narrows basin on the west side of Rosemead Boulevard, between the Pomona Freeway and San Gabriel Boulevard. The facility discharges 10 MGD of tertiary-treated water into the Rio Hondo for groundwater recharge in downstream spreading grounds. Some reclaimed water is used to irrigate a nearby commercial nursery. The plant is constructed to be fully functional during flood events (USACE, LA District, 1998). Discharges from this facility normally are diverted to the Rio Hondo Spreading Grounds for groundwater replenishment. However, during heavy storm runoff, the effluent will enter the Los Angeles River through the Rio Hondo; there are times when discharges may enter the San Gabriel River depending on the depth of water behind the dam.
Two other water reclamation plants, the Pomona and San Jose Creek Water Reclamation Plants, discharge water into the middle reaches of the San Gabriel River. The Pomona plant discharges about 2.5 MGD to San Jose Creek which flows into the Whittier Narrows basin via the San Gabriel River. The San Jose Creek plant has three outlets to the river, one to San Jose Creek, one to the unlined portion of the San Gabriel River upstream of the San Gabriel River Coastal Spreading Grounds, and one outlet to the lined portion of the river downstream of the spreading grounds (USACE, LA District, 1998). The Los Coyotes and Long Beach Water Reclamation Plants discharge into the lower watershed.
In addition, two generating stations discharge into the tidal prism just north of Second St. (Westminster Ave.), the Haynes and Alamitos Generating Stations. Both draw in water from the nearby Los Cerritos Watershed Management Area.
12
POTWs (California Regional Water Quality Control Board – Los Angeles Region files)
County Sanitation Districts of Los Angeles County, Los Coyotes Water Reclamation Plant (Los Coyotes WRP) Order No. 95-077, CA0054011
Located at 16515 Piuma Avenue, Cerritos Design capacity of 37.5 MGD Treatment is primary sedimentation, activated sludge biological treatment, secondary sedimentation,
coagulation, inert media filtration, chlorination, dechlorination Tertiary-treated municipal and industrial wastewater is discharged into the San Gabriel River 1,230
feet upstream of the Artesia Freeway, above the estuary A portion of the treated effluent is reclaimed for landscape irrigation and is regulated under Order No.
87-51.
County Sanitation Districts of Los Angeles County, San Jose Creek Water Reclamation Plant (San Jose Creek WRP) Order No. 95-079, CA0053911
Located at 1965 South Workman Mill Road, Whittier Design capacity of 100 MGD Treatment is primary sedimentation, activated sludge biological treatment, secondary sedimentation,
coagulation, inert media filtration, chlorination, dechlorination Tertiary-treated municipal and industrial wastewater is discharged via three discharge points:
Discharge No. 001 to the San Gabriel River is the primary discharge outfall which is eight miles south of the plant near Firestone Blvd. From this point treated effluent flows directly to a concrete-lined, low flow channel in the river and travels about nine miles prior to reaching the estuary.
Discharge No. 002 to San Jose Creek is used for groundwater recharge at Rio Hondo and the San Gabriel Coastal Spreading Grounds. San Jose Creek is unlined from the discharge point to the San Gabriel River.
Discharge No. 003 delivers treated effluent to the unlined portion of the San Gabriel River as well as both the Rio Hondo and San Gabriel Coastal Spreading Grounds for groundwater replenishment.
In addition to groundwater recharge, a portion of the treated effluent is used for irrigation and industrial process water and is regulated under Order No. 87-50. Treated effluent for groundwater recharge and discharged to lined channels is partially dechlorinated; that used for direct reuse is not dechlorinated. The discharge to the lined channel (No. 001) leaves the treatment plant at about 1 mg/l residual chlorine and is less than 0.1 mg/l upon discharge to the lined portion of the San Gabriel River.
County Sanitation Districts of Los Angeles County, Long Beach Water Reclamation Plant (Long Beach WRP) Order No. 95-076, CA0054119
Located at 7400 East Willow Street, Long Beach Design capacity of 25 MGD Treatment consists of primary sedimentation, activated sludge biological treatment, secondary
clarification, coagulation, inert media filtration, chlorination, and dechlorination. Tertiary-treated municipal and industrial wastewater is discharged to Coyote Creek at a point 2,200
feet upstream from the confluence with the San Gabriel River, above the estuary A portion of the treated effluent is reclaimed for irrigation and regulated under Order No. 87-47.
County Sanitation Districts of Los Angeles County, Whittier Narrows Water Reclamation Plant (Whittier Narrows WRP) Order No. 95-082, CA0053716
Located at 301 North Rosemead Blvd., El Monte Design capacity of 15 MGD Treatment consists of primary sedimentation, activated sludge biological treatment, secondary
clarification, coagulation, inert media filtration, chlorination, and dechlorination.
13

Tertiary-treated municipal and industrial wastewater is discharged via four discharge points: Discharge No. 001 to the San Gabriel River via a point 700 feet upstream from the Whittier
Narrows Dam. The treated effluent generally flows down the river to the San Gabriel River Spreading Grounds
Discharge No. 002 to Zone 1 Ditch at a point 5,500 feet upstream from its juncture with the Rio Hondo. The treated effluent enters the Rio Hondo at a point about 4,000 feet upstream from the Whittier Narrows Dam and generally flows down the river to the Rio Hondo Spreading Grounds.
Discharge No. 003 to a test basin for the study of using reclaimed wastewater for groundwater recharge; there has been no discharge here since 1981 and no plans to discharge here in the immediate future.
Discharge No. 004 directly to the Rio Hondo via a 27-inch diameter discharge line at a point 1,400 feet upstream from San Gabriel Blvd., above Whittier Narrows Dam. The treated effluent generally flows down the river to the Rio Hondo Spreading Grounds.
All or a portion of the effluent is reclaimed and is regulated under Board Order No. 88-107. Reclaimed water directed to reuse is not dechlorinated.
County Sanitation Districts of Los Angeles County, Pomona Water Reclamation Plant (Pomona WRP) Order No. 95-078, CA0053619
Located at 295 Humane Way, Pomona Design capacity of 15 MGD Treatment consists of primary sedimentation, activated sludge biological treatment, secondary
sedimentation, coagulation, inert media filtration, chlorination, and dechlorination. Tertiary-treated municipal and industrial wastewater is discharged to the South Fork of San Jose
Creek, a tributary of the San Gabriel River, at a point near the interchange of the Pomona and San Gabriel River Freeways, above the estuary.
During dry weather, virtually all of the treated effluent is reclaimed for landscape and crop irrigation, as well as for industrial processes and is regulated under Order No. 81-34.
POTW Effluent Annual AveragesConstituent Units Pomona Los
CoyotesSan Jose Creek Whittier
NarrowsLong Beach
East West
Flow MGD 9.65 36.22 52.79 29.45 10.27 17.86
pH pH units 6.98 7.23 7.00 6.97 6.98 7.18
Temperature oF 76 76 77 77 76 76
BOD mg/L 6 6 6 5 3 10
TDS mg/L 506 843 583 560 538 661
Suspended Solids mg/L < 2 < 1 2 < 1 < 1 2
Settleable Solids ml/L < 0.1 < 0.1 < 0.1 < 0.1 < 0.1 < 0.1
A total of nearly 39,000 acre-feet/year of reclaimed water from the Whittier Narrows, San Jose Creek, and Pomona WRPs were used for groundwater replenishment of the Central Basin in 1997-98. An additional 10,000 acre-feet/year were used for irrigation and industrial use at 390 sites. Thirty-six percent of the reclaimed wastewater produced by these facilities in 1997-98 was reused; the remainder was discharged to the watershed. Use of reclaimed water to recharge the Montebello Forebay has helped reduce the need for use of imported water or natural river water (imported water use decreased from 22,551 acre-feet in 1996-97 to 0 acre-feet in 1998-99 (LA/SG Rivers Watershed Council, in press).
14
Types of permitted wastes discharged into the San Gabriel River Watershed:
Nature of Waste Prior to Treatment or Disposal # of Permits Types of PermitsDCSOIL – nonhazardous contaminated soil 1 MinorDCNWTRS – nonhazardous contaminated groundwater 1 MinorDCONTAC – nonhazardous contact cooling water 1
2MajorMinor
DDOMIND – nonhazardous domestic sewage & industrial waste 5 MajorDMISCEL – nonhazardous wastes from dewatering, rec. lake overflow, swimming pool wastes, water ride wastewater, or groundwater seepage
429
MinorGeneral
DNONCON – nonhazardous noncontact cooling water 3 MinorDPROCES – nonhazardous process waste (produced as part of industrial/manufacturing process)
11
MajorMinor
DSTORMS – nonhazardous stormwater runoff 17
MajorMinor
DWSHWTR – nonhazardous washwater waste (photo reuse washwater, vegetable washwater)
1 Minor
HCNWTRS – hazardous contaminated groundwater 76
MinorGeneral
HPROCES – hazardous process waste (produced as part of industrial/manufacturing process)
1 General
HSTORMS – hazardous stormwater runoff 1 MajorIMISCEL – inert wastes from dewatering, rec. lake overflow, swimming pool wastes, water ride wastewater, or groundwater seepage)
2 General
(California Regional Water Quality Control Board – Los Angeles Region files)
Hazardous – influent or solid wastes that contain toxic, corrosive, ignitable, or reactive substances (prior to treatment or disposal) managed according to applicable Department of Health Services standards
Designated – influent or solid wastes that contain nonhazardous wastes (prior to treatment or disposal) that pose a significant threat to water quality because of their high concentrations
Inert – influent or solid wastes that do not contain soluble pollutants or organic wastes (prior to treatment or disposal) and have little adverse impact on water quality
Major discharges are POTWs with a yearly average flow of over 0.5 MGD or an industrial source with a yearly average flow of over 0.1 MGD and those with lesser flows but with acute or potential adverse environmental impacts.
Minor discharges are all other discharges that are not categorized as a Major. Minor discharges may be covered by a general permit, which are issued administratively, for those that meet the conditions specified by the particular general permit.
In addition. approximately 70 oil wells are located in the Whittier Narrows below elevation 230 feet. The wells pre-date the construction of the dam and are part of the Montebello Oil Field discovered in 1918 (U.S. Army Corps of Engineers LA District, 1998).
15

Current Water Quality Impairments(California Regional Water Quality Control Board – LA Region, 2000)
303(d) impairments in watershed and projected TMDL schedule:Type of TMDL Start TMDL
303(d) Listed Waterbody (Reach) Pollutant/ TMDL Date - FY Completion Comments Impairment (start of Date - FY
monitoring) (Basin PlanAmendment)
San Gabriel River Reach 3 (Whittier Narrows to Ramona)
toxicity nitrogen and its effects
1999/00 2002/03
San Gabriel River Reach 2 (Firestone to Whittier Narrows Dam)
NH3
San Gabriel River Reach 1 (Estuary to Firestone)
NH3
San Gabriel River Reach 1 (Estuary to Firestone)
algae
San Gabriel River Reach 1 (Estuary to Firestone)
toxicity
San Jose Creek Reach 1 (SG confluence to Temple St.)
NH3
San Jose Creek Reach 1 (SG confluence to Temple St.)
algae
Coyote Creek NH3Coyote Creek algaeCoyote Creek toxicityWalnut Creek toxicityWalnut Creek pHSan Gabriel River East Fork trash trash 1998/99 1999/00Legg Lake trash trash 2000/01 2008/09Puddingstone Reservoir DDT, PCBs,
chlordanePCBs & pest. 2000/01 2007/08
El Dorado Lakes Hg metals 2000/01 2005/06El Dorado Lakes Cu, PbPuddingstone Reservoir HgLegg Lake Cu, PbSanta Fe Dam Park Lake Pb, CuCoyote Creek abnormal fish
histologyDependent on cause 2000/01 2005/06 Further
Assessment needed - cause of abnormalitiesunknown
San Gabriel River Reach 1 (Estuary to Firestone)
abnormal fish histology
San Gabriel River Estuary abnormal fish histology
El Dorado Lakes algae, NH3, eutroph.
nitrogen and its effects
2006/07 2010/11
El Dorado Lakes pHCrystal Lake algae, nutrientsLegg Lake NH3Legg Lake pHLegg Lake odorsPuddingstone Reservoir low DO, org.
enrichmentSanta Fe Dam Park Lake pHSan Jose Creek Reach 1 (SG confluence to Temple St.)
Pb metals 2000/01 2004/05
San Gabriel River Reach 2 (Firestone to Whittier Narrows Dam)
Pb
San Gabriel River Estuary AsCoyote Creek AgSan Jose Creek Reach 1 (SG confluence to Temple St.)
coliform coliform 2006/07 2010/11
San Gabriel River Reach 2 (Firestone to Whittier Narrows Dam)
coliform
San Gabriel River Reach 1 (Estuary to Firestone)
coliform
Coyote Creek coliform
16
Typical Data Ranges for Waters Listed as Impaired:Pollutant/ Applicable Typical Data Ranges 303(d) Listed Waters/ReachesImpairment Objective/Criteria Resulting in Impairmentammonia Basin Plan narrative objective San Gabriel River Reach 2 (Firestone to Whittier Narrows Dam) San Gabriel River Reach 1 (Estuary to Firestone) Basin Plan numeric objective: ND - 21.1 mg/l (mean of 10.1±4.1) San Jose Creek Reach 1 (SG confluence to Temple St.) varies depending on pH and Coyote Creek temperature but the general Legg Lake range is 0.53 - 2.7 mg/l of total El Dorado Lakes
ammonia (at average pH andtemp.) in waters designated
as WARM to protect against chronictoxicity and 2.3-28.0 mg/l to protect
against acute toxicitytoxicity Basin Plan narrative objective 0 – 100% survival San Gabriel River Reach 3 (Whittier Narrows to Ramona) San Gabriel River Reach 1 (Estuary to Firestone) Coyote Creek Walnut Creekalgae Basin Plan narrative objective San Gabriel River Reach 1 (Estuary to Firestone) San Jose Creek Reach 1 (SG confluence to Temple St.) Coyote Creek El Dorado LakesEutrophication Basin Plan narrative objective El Dorado LakespH Basin Plan numeric objective: 6.9 - 9.4 pH units (mean of 8.5±0.6) Walnut Creek 6.5 - 8.5 pH units El Dorado Lakes Legg Lake Santa Fe Dam Park Lakeodors Basin Plan narrative objective Legg Lakelow DO, organic Basin Plan narrative objective Puddingstone Reservoirenrichment Crystal Lake
Basin Plan numeric objective: 0.1 - 14.9 mg/l (mean of 4.3±3.5)annual mean greater than 7.0 mg/l
no single sample less than 5.0 mg/l trash Basin Plan narrative objective San Gabriel River East Fork Legg LakeLead USEPA water quality criteria: 100 ug/l (maximum) San Jose Creek Reach 1 (SG confluence to Temple St.) varies based on hardness but San Gabriel River Reach 2 (Firestone to Whittier Narrows Dam) typically 3.2 - 25 ug/l Santa Fe Dam Park Lake El Dorado Lakes Legg LakeArsenic State Board numeric objective (tissue): 240 - 300 ng/g (tissue) San Gabriel River Estuary(tissue) Max. Tissue Residue Level 200 ng/gCopper USEPA water quality criteria 90 ug/l (maximum) Legg Lake varies based on hardness but El Dorado Lakes typically 12 - 47 ug/l Santa Fe Dam Park LakeSilver USEPA water quality criteria 30 ug/l (maximum) Coyote Creek
varies based on hardness but typically 4.1 - 65 ug/l Mercury NAS guidelines (tissue): Puddingstone Reservoir (tissue) 500 ng/g 510 ng/g (tissue) El Dorado Lakescoliform Basin Plan numeric objective: ND - 240000 MPN/100ml San Jose Creek Reach 1 (SG confluence to Temple St.) fecal coliform not to exceed log mean San Gabriel River Reach 2 (Firestone to Whittier Narrows Dam) of 200 mpn/100ml in 30-day period and San Gabriel River Reach 1 (Estuary to Firestone)
not more than 10% of samples exceed Coyote Creek400 MPN/100ml
DDT State Board numeric objective (tissue): 25 - 36 ng/g (tissue) Puddingstone ReservoirMax. Tissue Residue Level 32.0 ng/g
PCBs State Board numeric objective (tissue): 54 - 65 ng/g (tissue) Puddingstone ReservoirMax. Tissue Residue Level 2.2 ng/g
chlordane State Board numeric objective (tissue): 16.1 - 31.7 ng/g (tissue) Puddingstone ReservoirMax. Tissue Residue Level 1.1 ng/g
abnormal fish Basin Plan narrative objective Coyote Creekhistology San Gabriel River Reach 1 (Estuary to Firestone) San Gabriel River Estuary
17

Overview of Existing Monitoring Data
Receiving Water Monitoring Data
What follows is an overview of the available receiving water monitoring data from 1988 to present. Figures are included in the Word 97 document FiguresforStateoftheWatershed.doc. All of the data and the rest of the figures are available electronically from the Regional Board as Excel 97 files (with the exception of one report) rather than as hardcopy due to the very large amount of information the files contain. As an informational note, the CRWQCB-LA Region ambient monitoring database contains sampling results from multiple agencies including the CRWQCB, US Forest Service, Department of Water Resources, and the Los Angeles County Department of Public Works. Due to its large volume of data, information in the ambient monitoring database has been separated into files based on broad categories of constituents. In some cases, data from the CSDLAC submittal were added into the constituent files in order to create one file with all chlorides data, for instance.
This overview of the data is not meant to represent an official Water Quality Assessment. Due to time constraints, no statistical analyses were performed. Rather, it is a qualitative review of available information on water quality. At some locations, only older data are available, while at other locations only more recent data exist. The intent of this overview is to generally describe patterns in various constituents which have been sampled in the watershed, to highlight where future data gathering may be most fruitful or needed, and to suggest where a more thorough data analysis could yield decisions for Water Quality Assessment purposes.
•CRWQCB, LA Region ambient monitoring database: SGRiverMetals_ambientonly.xls, SGRiverColiform_ambientonly.xls, SGRiverChloride_alldata.xls , SGRiverNutrients_alldata.xls
•County Sanitation Districts of Los Angeles County electronic submittal of receiving water monitoring data previously submitted in report format: SGRiver LACSD RW Data 1995-1999.xls
•Los Angeles County electronic submittal of municipal stormwater monitoring data: MunStormwaterSGRiver1997-98.xls and MunStormwaterSGRiver1998-99.xls
Monitoring frequency: Parts of the watershed have been monitored much more regularly and frequently than others (see maps in Figures 1-6). The headwaters (based on the data available in the Regional Board ambient database) were monitored fairly intensively in the early 1990s but very infrequently since then. A large monitoring effort was conducted from 1988-1994 by the LA County Department of Public Works at a large number of sites; monitoring under the current municipal stormwater permit is much less intense and at fewer sites. For the most part, sampling is concentrated in the mainstem of the river and in tributaries near confluences (as well as in the vicinity of major point sources for which data from 1995-1999 were examined). As a consequence, much of the tributaries Walnut Creek, San Jose Creek, and Coyote Creek have not been monitored yet these, through the data available at the confluences, appear to be major contributors of pollutants to the mainstem of the river. Also of note are the large storm drains connecting to the mainstem below the spreading grounds which may be worthy of individual monitoring due to patterns seen in the data, particularly for coliform.
When one considers the unusual nature of this watershed, however, a fairly unusual monitoring program may be warranted. Waters from the upper part of the watershed often do not get past the Santa Fe Dam and its spreading grounds. Waters entering the mainstem from San Jose and Walnut Creeks may be diverted through Whittier Narrows area to the Los Angeles River. Those waters remaining in the San Gabriel River will often recharge at the downstream spreading grounds. From the beginning of the concrete portion on downstream is a continuously flowing river through discharges from POTWs as well as through urban runoff. It is joined by Coyote Creek just before meeting the unlined tidal prism.
General observations: The original datasets were in some cases reduced or streamlined to eliminate very infrequent sampling episodes or those not collected on the same date. At times, earlier and later datasets are compared; this is pointed out where it occurs.
Nutrient and related data: Nitrate-N, nitrite-N, ammonia-N, total phosphate, and pH data are generally available for most of the sites monitored. Nitrate (as NO3), BOD5, chemical oxygen demand (COD),
18
total organic carbon (TOC), and dissolved oxygen data are also sporadically available. For example, the County Sanitation Districts of Los Angeles County (CSDLAC) monitors BOD5 and COD but not TOC. Other agencies have occasionally monitored for BOD5 and TOC but never COD. This is unfortunate since the latter parameter has shown the most interesting patterns which will be discussed further below.
Certain parameters can appropriately be generalized into average values (nitrate-N, COD, and total phosphate are examples) since temporal fluctuations are not great in this dataset. Dissolved oxygen levels however fluctuate greatly and must be viewed on a finer scale.
Not surprisingly, nutrient concentrations tend to be quite low in the upper watershed (in the West, North, and East Forks). The average concentration of total phosphate in the North Fork, however, is a little higher than might be expected. pH averages slightly over 8.0 mg/l.
The next site where an array of parameters is collected is just above the confluence with San Jose Creek, many miles downstream. Here, nutrient concentrations are marginally higher than in the upper watershed. pH averages slightly under 8.0 mg/l.
A POTW discharges to San Jose Creek just upstream of its confluence with the main river. Ammonia and nitrate-N are already higher upstream of the POTW than in the upper watershed. Average ammonia, nitrate-N, and total phosphate levels increase noticeably below the POTW while pH averages just under 7.5 mg/l.
Sampling data for the mainstem below the confluence with San Jose Creek is again somewhat sparse until the San Gabriel Spreading Grounds, below the Whittier Narrows Dam. These data were collected from 1988-1994 and include mostly nitrite-N, pH, total phosphate, and TOC but comparisons to sites elsewhere in the watershed are difficult due to the availability of only this older dataset.
The next two sites with a large amount of data are each located downstream of a POTW within the concrete-lined portion of the main river. Nutrient concentrations have increased considerably by the lowermost of the two sites. COD also increases as one progresses downstream.
The next two sampling sites further downstream are much closer to the tidal prism and indeed the lowermost one is influenced at times by tidal overwash onto the concrete. Nutrient levels, particularly total phosphate, are considerably higher here than in the area above the concrete portion of the river. COD levels continue to rise. However, while BOD5 levels were rather high in the older dataset associated with the more upstream site, levels were considerably lower in the more recent data at the downstream site.
As previously mentioned, most of the monitoring in Coyote Creek is concentrated around the major point source, a POTW. An older dataset exists for a site further upstream. The greatest difference in parameters occurs in ammonia-N and total phosphate concentrations which rise downstream of the POTW and are rather low upstream. Nitrate-N levels however are rather uniform both upstream and downstream of the POTW.
Coyote Creek enters the main river at the tidal prism. COD rises sharply within the tidal prism. By contrast, after initially high levels, ammonia-N, nitrate-N, nitrite-N, and total phosphate levels fall sharply.
As described earlier in this document, various reaches of the river are 303(d)-listed as impaired for ammonia, toxicity, algae, or pH.
Bacteriological data: Medians were calculated in order to evaluate bacteriological data for general trends. Total coliform was collected at all sites with fecal coliform and enterococcus collected at some. Coliform levels fluctuated greatly at many locations.
19

What limited data there were for the upper watershed showed consistently low levels of total and fecal coliform. The tributaries Coyote and San Jose Creeks exhibited high median levels of total and fecal coliform as well as enterococcus (higher than the mainstem). Of particular interest is an abrupt increase in median total coliform levels in the concrete portion of the main river. A number of large storm drains enter the river in this stretch.
Various reaches of the main river, San Jose Creek, and Coyote Creek are 303(d)-listed as impaired for coliform.
Metals data: Metals were generally not detected in the upper watershed and only occasionally detected elsewhere in the watershed; they were found most often in the lowermost part of the watershed. Arsenic and zinc were the metals most frequently detected. It can likely be assumed that the majority of sampling took place on dry weather days; wet weather storm sampling is discussed below and exhibited very different results. Various reaches of the river, its tributaries, or lakes associated with reservoirs are currently 303(d)-listed as impaired for lead, copper, arsenic (in tissue), silver, and mercury (in tissue).
Chlorides data: Chlorides are higher in Coyote Creek than in San Jose Creek; chloride levels in the mainstem above the tidal prism are slightly lower than those in San Jose Creek. It’s also clear from the data that full strength seawater is not reached until well into the tidal prism.
Organics data: Except for lindane, other organics were rarely detected.
Specific findings
Nutrients and related data: Dissolved oxygen is the most variable parameter related to nutrient concentrations. At times, average concentrations may be acceptable but extreme fluctuations may be occurring from week to week or from month to month (and probably daily although samples are generally not obtained that often).
A fairly large amount of dissolved oxygen data were obtained for parts of the upper watershed in the early 1990s. Concentrations averaged 9.8 mg/l with little fluctuation. Availability of oxygen to aquatic life is temperature-dependent; with the generally low temperatures of the upper watershed, much of the oxygen was likely available for use.
Dissolved oxygen levels fluctuate greatly in the rest of the watershed with concentrations in San Jose Creek fluctuating the least and those in Coyote Creek fluctuating the most, especially in recent years (Figure 7). The fluctuations are extreme at some sites. Although some reaches are 303(d)-listed for algae, no part of the river or its tributaries are currently listed for low DO/organic enrichment or eutrophication.
Ammonia-N concentrations were also evaluated in more detail. (Figures 8 and 9) Ammonia-N concentrations also fluctuate greatly at times. The graphed locations (other than those in the tidal prism and San Jose Creek) are in concrete-lined portions of the river. San Jose Creek water would likely not reach the lower river; however, it is clear that considerable ammonia enters the more sensitive tidal prism stretch of river and persists for some distance. Often, nearly half of the total nitrogen in the river is in the form of ammonia. Much of the lower reaches of the river and its tributaries are on the 303(d) list for ammonia exceedances.
Chemical oxygen demand is higher in Coyote Creek than in either San Jose Creek or the upper parts of the concrete-lined portion of the main river. (Figure 10) Levels increase gradually at the more downstream stations until the tidal prism is reached where levels increase dramatically and continue to rise all the way to the mouth of the river. Also, COD levels have greatly increased over the past two years. This pattern is not consistent with that for BOD and indeed for many other parameters which tend to decrease partway into the tidal prism. COD in the effluent of tertiary treatment plants is generally less than 20 mg/l. There may be sources of industrial waste entering the lower watershed which are currently unknown and are apparently not associated with stormwater runoff since levels are
20

high virtually year-round. Also of interest is an apparent decrease in overall BOD levels in the watershed when comparing the older dataset (1988-1994) with the later dataset (1995-1999) although the two datasets do not overlap sampling sites exactly (see later discussion on BOD levels in stormwater).
Bacteriological data: Although highly variable, total coliform levels in San Jose and Coyote Creeks have rarely dropped below 1,000 mpn/100ml during the last five years. They are both currently on the 303(d) list for coliform exceedances. The lower reaches of the main river are also 303(d)-listed for coliform; however, there are some differences in total coliform concentrations among the current sampling sites (CSDLAC data). (Figures 11 and 12) Coliform levels below the SJCWRP discharge point (in the main river) are much lower than further downstream which may indicate a nearby source, possibly through a storm drain. Levels below the SJCWRP appear to fluctuate more with the seasons (and, presumably, with storm runoff) while levels further downstream are more consistently high. The beginning section of the tidal prism contains very high levels of coliform and rarely drops below 1,000 mpn/100ml. The estuary is not currently 303(d)-listed for coliform.
Metals data: Coyote Creek is currently 303(d)-listed for silver bioaccumulated in tissue. Recent (non-stormwater) data are largely nondetect for metals. The estuary is also listed for arsenic in fish tissue through the state’s Toxic Substances Monitoring Program. It is unclear from where arsenic may be originating since it is generally found in the water column at low levels. More intense monitoring (with appropriately low detection limits) would be useful to update the status of metals impairments.
Chlorides data: It appears from Figure 13 that the POTW discharge in Coyote Creek is ameliorating high chloride levels coming from further upstream.
LA County Department of Public Works, electronic copies of stormwater monitoring data for Storm Years 1997-98 and 1998-99 – specific findings
Sampling sites are located in Coyote Creek north of Willow Street (not a required site) and in the San Gabriel River south of the Whittier Narrows Dam.
1997-98 storm season
Bacteriological data: Not surprisingly, very high total and fecal coliform as well as fecal streptococcus levels were found in the San Gabriel River during storm events (coliform samples were not collected in Coyote Creek).
Nutrients (and related) data: In general, a “first flush” effect was seen where nutrient concentrations were higher following the first storm and gradually lower throughout the season. Nutrient concentrations were not outside the range found during dry weather although varied considerably from storm to storm. BOD and COD levels, however, were noticeably elevated over that found during dry weather and were higher in Coyote Creek than in the San Gabriel River.
Chlorides data: It is clear from the chloride data that Coyote Creek in particular receives a considerable amount of storm runoff (relative to baseline flow) due to the greatly lowered chloride concentrations during some storms.
Metals data: Metals data were compared with estimated water quality objectives for metals (hardness-adjusted). Potential metals exceedances occurred on 88% of the monitored days (at both an acute and chronic level) at the Coyote Creek site. Potential chronic objective exceedances occurred at the San Gabriel River site on 66% of the monitored days while potential acute exceedances occurred on 33% of the monitored days.
Copper and zinc were the most common problem metals in Coyote Creek. Cadmium and lead were also occasionally at high levels. Many other metals were not detected. The creek is 303(d)-listed for silver only (in tissue) which did not occur at excessive levels in the water column sampling.
21

Potential exceedances at the San Gabriel River site involved copper, lead, and zinc to a fairly equal extent. The river (one reach) is 303(d)-listed for lead but not copper or zinc.
Semivolatiles and pesticides: These were detected very infrequently.
1998-99 storm season
During this storm season, some sampling occurred on non-storm days.
Bacteriological data: The Coyote Creek site was not monitored for coliform. At the San Gabriel River site, one sampling event occurred on a non-storm flow day. Coliform levels were much lower on that date than on early storm-year sampling dates (although still high relative to body contact standards). Later in the storm-year, coliform levels during storm days were much lower (compared to the beginning of the storm-year) and comparable to the one dry weather sample taken. Except for during the first two sample events, fecal coliform and fecal streptococcus were not exceptionally high; total coliform was always high.
Nutrients (and related) data: For Coyote Creek, this year also there appears to have been a “first flush” effect for some constituents (notably nitrate-N and ammonia-N). This effect appeared to occur during what were likely the first significant storm of the season in December. Levels were much higher than in the early season dry-weather sampling event for virtually all constituents except BOD which appeared to fluctuate independent of storm flows. Nutrient levels remained quite high in the second dry sampling event in January. Nutrient levels dropped somewhat throughout the rest of the storm season.
A “first flush” effect was harder to discern in the San Gabriel River data. It’s possible that enough nutrients are carried during regular flows to mask storm effects.
Chlorides data: Chlorides levels dropped considerably during storms in Coyote Creek and more so than in the San Gabriel River.
Metals data: There were far fewer monitoring days with potential exceedances during this storm season than during the previous storm season. Twelve percent of the sampling days at the Coyote Creek site resulted in potential chronic effect level exceedances (copper, zinc, and selenium) while there was only one sampling day where potential acute level exceedances occurred (copper and zinc). Eight percent of the sampling days at the San Gabriel River site resulted in potential chronic level exceedances with no potential acute level exceedances.
Semivolatiles and pesticides: These were detected very infrequently.
Toxicity Study of the Santa Clara River, San Gabriel River, and Calleguas Creek, December 1996
Copies of this report may be obtained from the Regional Board. An electronic version is not available.
Much of the sampling took place in the early 1990s. Persistent toxicity problems were noted in Walnut Creek as well as in Coyote Creek and the San Gabriel River near their confluence; persistent toxicity was also seen in the tidal prism. Attempts were made to determine the causes of toxicity; an organophosphate (such as diazinon) and/or a metals (such as zinc) were implicated at times. A number of fish collected at several sites in the lower watershed exhibited abnormal histopathology associated with pollutants such as metals or certain organics. Coyote Creek and parts of the San Gabriel River are 303(d)-listed for abnormal fish histology. The San Gabriel River Estuary is not currently 303(d)-listed for toxicity.
22

Effluent Monitoring Data
The majority of this information is only available by visiting the Regional Board office by appointment for file review.
CRWQCB, LA Region NPDES (effluent) program monitoring and compliance inspection files
The POTWs in the watershed are generally meeting permit limitations and, except for ammonia-N (and nitrogen effects in general), do not appear to be greatly contributing to current 303(d)-listed exceedances.
Effluent monitoring data from a subsample of other types of discharges (minors) were also evaluated. A number of discharges are of treated groundwater from cleanup of volatile organic compounds. pH readings have been quite high (or at times low) at some sites. Nitrate levels were also elevated in some of these discharges although this parameter was not monitored regularly. A number of sites discharge stormwater runoff under individual NPDES permits. For the most part these permits do not contain limits for metals; they instead focus on parameters such as oil & grease, suspended solids, and pH. There is usually an annual metals scan required and some metals are fairly elevated at times. There are a few sites discharging condensate water with extra monitoring in one case revealing rather high levels of ammonia, COD, and oil & grease.
CRWQCB-LA Region. 1996-1997 Annual Report for Storm Water Industrial Activities General Permit – Analysis of the Sampling Results, August 1998. Final Draft.
The data analyzed in this report were submitted under a statewide General Industrial Activities Storm Water Permit which was initially issued in 1991 and reissued in 1997. The permit requires each regulated facility to prepare and implement a Storm Water Pollution Prevention Plan, develop and implement a monitoring program, and submit an annual self-monitoring report. There are approximately 500 facilities covered by the industrial storm water permit in the San Gabriel River Watershed. The report also addressed some data from 1992-1993. A large number of data exist for the period from 1993 to 1996 but the resources needed to make the data available electronically do not.
Results for the Los Angeles and San Gabriel Rivers Watersheds were combined in this report but it will be assumed that the combined data may be loosely representative of one or the other watershed. It was reported that out of the approximately 2,000 facilities reporting pH results, 13% were outside of the 6.0 – 9.0 mg/l benchmark level in 1996-1997; 24% were above the 100 mg/l benchmark level for total suspended solids; 25% were above the 200 µmhos/cm benchmark level for specific conductance; 14% were above 15 mg/l benchmark level for oil & grease; and 6% were above the 110 mg/l benchmark level for total organic carbon. Some of the samples exceeding the benchmark were orders of magnitude higher. The results in 1992-1993 were similar.
Recommendations for Future Monitoring
Investigate potential contributions from storm drains of coliform and COD in lower San Gabriel River Investigate sources of high coliform in Coyote Creek In general, evaluate water quality in Walnut Creek, San Jose Creek, and Coyote Creek more
intensively including using toxicity tests and Toxicity Identification Evaluations Investigate the need to continue 303(d)-listings for arsenic and silver Evaluate need to newly 303(d)-list reaches for copper and/or zinc Determine impairment status of lead in watershed Evaluate need to 303(d)-list estuary for low dissolved oxygen and ammonia Include nitrate monitoring for discharges of treated groundwater; in general, include COD monitoring
for larger discharges
23

Potential Long-term Activities
The Regional Board considers these as issues of concern in the watershed for the agency over the long-term (California Regional Water Quality Control Board – Los Angeles Region, January 2000)
Development of a coordinated watershed monitoring program Hydrologic study of the estuary to evaluate mixing dynamics and effects on water quality and
beneficial uses Identification of seasonal variations in water quality Evaluation of fish tissue from fish in the lower river and estuary Determination of the fate of ammonia in the estuary Evaluation of habitats in the middle/lower river Evaluation of impacts from reservoir cleaning on water quality, particularly fisheries-related Evaluation of mining on instream beneficial uses Evaluation of success of trash TMDL efforts in upper river Evaluation of impacts from industrial stormwater in the watershed Identification of sources of contributing flows to reaches and tributaries Identification of dry segments in reaches and tributaries Consideration of TMDL-related issues Implementation of biological monitoring
24

References
California Regional Water Quality Control Board, Los Angeles Region. Watershed Management Initiative Chapter, January 2000, and California Regional Water Quality Control Board, Los Angeles Region website (WMI Chapter) http://www.swrcb.ca.gov/~rwqcb4/html/programs/regional_programs.html
California Regional Water Quality Control Board – Los Angeles Region website (annual report) http://www.swrcb.ca.gov/~rwqcb4/html/annual_report/ann_rep.html
California Regional Water Quality Control Board, Los Angeles Region. Toxicity Study of the Santa Clara River, San Gabriel River, and Calleguas Creek. Prepared by UC Davis. December 1996.
California Regional Water Quality Control Board, Los Angeles Region. Water Quality Control Plan, Los Angeles Region (Basin Plan). June 1994.
California Regional Water Quality Control Board, Los Angeles Region. NPDES (effluent) program monitoring and compliance inspection files
California Regional Water Quality Control Board, Los Angeles Region. Monitoring data from CRWQCB, LA Region ambient monitoring database, County Sanitation Districts of Los Angeles County electronic submittal of receiving water monitoring data previously submitted in report format, and Los Angeles County electronic submittal of municipal stormwater monitoring data
Los Angeles County, Department of Public Works. Los Angeles County Drainage Area Project Master Environmental Impact Report. Prepared by Woodward-Clyde Consultants. December 1994.
Los Angeles County, Department of Public Works. Electronic copies of stormwater monitoring data for Storm Years 1997-98 and 1998-99.
Los Angeles County, Department of Public Works. Websites on Morris, San Gabriel, and Cogswell Dams. http://dpw.co.la.ca.us/hwc/dams/morris.cfm, http://dpw.co.la.ca.us/hwc/dams/sangabri.cfm, and http://dpw.co.la.ca.us/hwc/dams/cogswell.cfm.
Los Angeles and San Gabriel Rivers Watershed Council. Beneficial Uses of the Los Angeles and San Gabriel Rivers. Prepared by Heather Trim. In press.
U.S. Army Corps of Engineers, Los Angeles District. Los Angeles County Drainage Area Water Conservation and Supply, Santa Fe – Whittier Narrows Dams Feasibility Study. Final Report with EIR and EIS. September 1998.
U.S. Army Corps of Engineers. Santa Fe Reservoir Spreading Grounds Phase II Improvements. Draft Environmental Assessment/Negative Declaration. Prepared by the Los Angeles County Department of Public Works/Water Conservation Division. January 1995.
U.S. Army Corps of Engineers, Los Angeles District. Los Angeles County Drainage Area Review – Final Feasibility Study, Interim Report and Environmental Impact Statement. December 1991.
U.S. Army Corps of Engineers, Los Angeles District, Reservoir Regulation Section website on Whittier Narrows Dam – http://www.spl.usace.army.mil/resreg/htdocs/wnrh.html
U.S. Army Corps of Engineers, Los Angeles District, Reservoir Regulation Section website on Santa Fe Dam – http://www.spl.usace.army.mil/resreg/htdocs/snfe.html
Water Replenishment District of Southern California. Draft Initial Study/Negative Declaration for the Alamitos Barrier Reclaimed Water Project. Prepared by Psomas and Associates. September 1998.
25

Figures
26

27


