86
ENTRIX, Inc. Overview on Central Valley Project Financing, Cost Allocation, and Repayment Issues

ENTRIX, Inc.
Overview on Central Valley Project Financing, Cost Allocation, and Repayment Issues

ENTRIX, Inc. i
Table of Contents
Overview on Central Valley Project Financing, Cost Allocation, and Repayment Issues 1
Overview 1
History .................................................................................................................................................... 1 Central Valley Project Improvement Act ............................................................................................... 4 Current CVP Organization ..................................................................................................................... 4 Repayment of Project Costs ................................................................................................................... 7
Cost Allocation ................................................................................................................................ 7 Rate Computation .......................................................................................................................... 10 Interest ........................................................................................................................................... 11 Ability to pay ................................................................................................................................. 12 Annual Accounting ........................................................................................................................ 12
Reimbursable Payment Responsibilities of CVP Contractors 14
Repayment Background ....................................................................................................................... 14 Irrigation Repayment ..................................................................................................................... 15 Municipal and Industrial Repayment............................................................................................. 16
San Joaquin Valley Contactors............................................................................................................. 16 Sacramento Valley Contractors ............................................................................................................ 17
Financial Statement Analysis of CVP Contractors 19
Financial Statement Background ................................................................................................... 19 The Ten Largest CVP Irrigation Contractors in the San Joaquin Valley ............................................. 19
Westlands Water District ............................................................................................................... 20 Madera Irrigation District .............................................................................................................. 23 Lower Tule River Irrigation District.............................................................................................. 25 Arvin-Edison Water Storage District............................................................................................. 27 Delano Earlimart Irrigation District ............................................................................................... 29 Chowchilla Water District ............................................................................................................. 31 Southern San Joaquin Municipal Utility District........................................................................... 33 Tulare Irrigation District ................................................................................................................ 35 Del Puerto Water District............................................................................................................... 37 San Luis Water District.................................................................................................................. 39

ENTRIX, Inc. ii
Comparison of the Ten Contractors ..................................................................................................... 41
CVP Power Generation and Distribution 43
CVP Hydropower Background ...................................................................................................... 43 Power Cost Allocations.................................................................................................................. 44 Facility Descriptions and Capacity ................................................................................................ 45 Powerplant Revenue and Expenditures ......................................................................................... 48 Power Plant Repayment................................................................................................................. 50
Summary 51
Appendix 52
Appendix A .......................................................................................................................................... 52 San Joaquin Valley Capital Repayment Responsibilities by Contractor ....................................... 52 Sacramento Valley Capital Repayment Responsibilities by Contractor........................................ 61
Appendix B........................................................................................................................................... 68 Appendix C........................................................................................................................................... 80
Water Year Classification .............................................................................................................. 80 Conversion Table ........................................................................................................................... 81 CVP Power Sales by Customer Category ...................................................................................... 82

ENTRIX, Inc. 1
Overview
As part of its strategic plan, the Delta Vision Task Force is considering in detail the entire California water infrastructure. This report summarizes and expands upon four individual reports prepared for the Task Force on the financial characteristics and status of the Central Valley Project (CVP). It begins with an overview of CVP history, organization, costs, and repayment. It then focuses on the overall repayment responsibilities of irrigation and municipal and industrial (M&I) contractors1 as well as those responsibilities specifically for Sacramento Valley and San Joaquin Valley water users. Next is a review of the summary financial statements of the 10 largest San Joaquin Valley contractors based on reports filed with the California State Controller. Following is a discussion of CVP power generation revenues, expenditures, and repayment. The report is then summarized and conclusions presented, with subsequent appendices showing detailed financial statements and repayment responsibilities by individual contractors; and information on power sales over time to various users.
History
The Central Valley floor of California is a 400 mile long, alluvial fan. Water captured in the northern half of the Valley drains into the Sacramento River and its tributaries, and water captured in the southern half of the Valley drains into the San Joaquin and Tule Rivers and their respective tributaries. The Sacramento and San Joaquin Rivers eventually converge into the Sacramento-San Joaquin Delta (Delta) before reaching the Pacific Ocean at the Golden Gate Bridge. Precipitation in the Central Valley varies significantly from north to south. The north end of the Valley receives about two-thirds of the total Valley precipitation and is prone to severe flooding while the southern end receives only one-third of the precipitation.
1 A contractor is a water and/or power user organization which has an active repayment or water/power service contract with Reclamation, with a Federal power marketing agency, or with a non-Federal operating entity; and which pays or shares in the O&M program costs for operating and maintaining Federal projects or facilities managed by Reclamation. Source: WTR P05 Reclamation Manual Policy 183 09/15/93 http://www.usbr.gov/recman/wtr/wtr-p05.pdf (accessed June 20, 2008).

ENTRIX, Inc. 2
The Central Valley grew rapidly in the mid 1800s following the California gold rush. By the late 1800s, farmers were using groundwater to irrigate tens of thousands of acres in the Valley. With enhanced pumping technology in the early 1900s, farmers in the Valley rapidly expanded their use of groundwater, and severe overdraft problems developed by the late 1920s. During extended periods of low rainfall, farmland was forced from production while, ironically, winter floods remained a perennial threat.
Concurrently, upstream farmers who impounded water for irrigation reduced water flows and caused salt water intrusion into the Delta, damaging crops and contaminating municipal and industrial water supplies. The water balance inequities were the impetus for creating a system that would reduce the risk of catastrophic flooding and could redistribute water throughout the fertile Central Valley for farm production.2
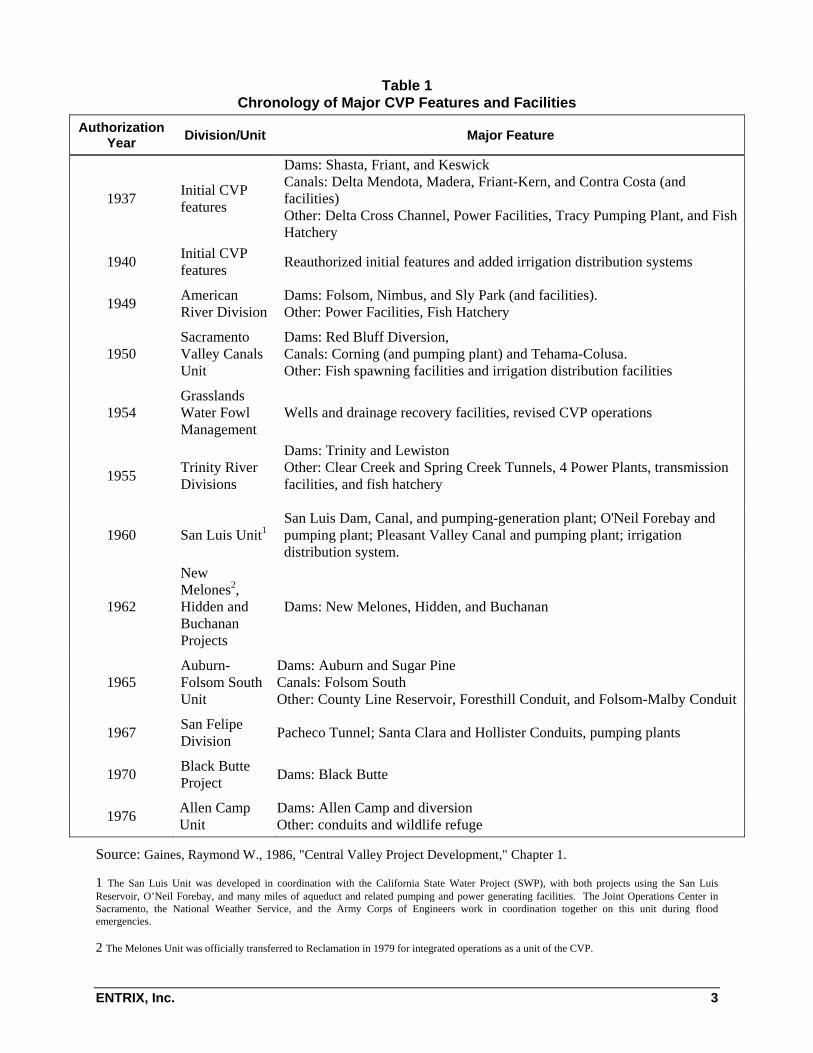
The CVP was discussed formally in the 1920s. In 1933, the State legislature passed the California Central Valley Project Act. Voters approved the issuance of $170 million in revenue bonds, which were issued for the Project. However, because of the Depression, the bonds did not sell and the project was never started. In 1935, the Rivers and Harbors Act was enacted, and President Roosevelt transferred $20 million of reimbursable funds for the authorization and construction of the Federal Central Valley Project.3 The Rivers and Harbors Act was reauthorized in 1937 and placed the Project under Reclamation law, which provided that the first function of the dams and reservoirs was flood control and improved navigation; the second for irrigation and domestic use; and the third for power generation. Table 1 displays a chronology of major CVP features and facilities.
2 Gaines, Raymond W., 1986, "Central Valley Project Development," Chapter 1.
3 Gaines, ibid.
ENTRIX, Inc. 3
Table 1 Chronology of Major CVP Features and Facilities
Authorization Year Division/Unit Major Feature
1937 Initial CVP features
Dams: Shasta, Friant, and Keswick Canals: Delta Mendota, Madera, Friant-Kern, and Contra Costa (and facilities) Other: Delta Cross Channel, Power Facilities, Tracy Pumping Plant, and Fish Hatchery
1940 Initial CVP features Reauthorized initial features and added irrigation distribution systems
1949 American River Division
Dams: Folsom, Nimbus, and Sly Park (and facilities). Other: Power Facilities, Fish Hatchery
1950 Sacramento Valley Canals Unit
Dams: Red Bluff Diversion, Canals: Corning (and pumping plant) and Tehama-Colusa. Other: Fish spawning facilities and irrigation distribution facilities
1954 Grasslands Water Fowl Management
Wells and drainage recovery facilities, revised CVP operations
1955 Trinity River Divisions
Dams: Trinity and Lewiston Other: Clear Creek and Spring Creek Tunnels, 4 Power Plants, transmission facilities, and fish hatchery
1960 San Luis Unit1 San Luis Dam, Canal, and pumping-generation plant; O'Neil Forebay and pumping plant; Pleasant Valley Canal and pumping plant; irrigation distribution system.
1962
New Melones2, Hidden and Buchanan Projects
Dams: New Melones, Hidden, and Buchanan
1965 Auburn-Folsom South Unit
Dams: Auburn and Sugar Pine Canals: Folsom South Other: County Line Reservoir, Foresthill Conduit, and Folsom-Malby Conduit
1967 San Felipe Division Pacheco Tunnel; Santa Clara and Hollister Conduits, pumping plants
1970 Black Butte Project Dams: Black Butte
1976 Allen Camp Unit
Dams: Allen Camp and diversion Other: conduits and wildlife refuge
Source: Gaines, Raymond W., 1986, "Central Valley Project Development," Chapter 1.
1 The San Luis Unit was developed in coordination with the California State Water Project (SWP), with both projects using the San Luis Reservoir, O’Neil Forebay, and many miles of aqueduct and related pumping and power generating facilities. The Joint Operations Center in Sacramento, the National Weather Service, and the Army Corps of Engineers work in coordination together on this unit during flood emergencies.
2 The Melones Unit was officially transferred to Reclamation in 1979 for integrated operations as a unit of the CVP.

ENTRIX, Inc. 4
Central Valley Project Improvement Act
The Central Valley Improvement Act (CVPIA) 4 was signed into law in 1992. It amends previous CVP authorizations to include fish and wildlife protection, restoration, and mitigation as project purposes having equal priority with irrigation and domestic uses; and fish and wildlife enhancement as a project purpose with priority equivalent to power generation. The general purposes of the CVPIA are:
• Protect, restore, and enhance fish, wildlife, and associated habitats in the Central Valley and Trinity river basins;
• Address impact of the CVP on fish, wildlife, and associated habitat;
• Improve operational flexibility of the CVP;
• Increase water-related benefits provided through expanded use of voluntary water transfers and improved water conservation;
• Contribute to the interim and long-term efforts of California to protect the Delta Estuary;
• Achieve a reasonable balance among competing demands for project water, including requirements for fish and wildlife, agriculture, municipal and industrial, and power customers.
Current CVP Organization
Currently, the CVP is the largest surface water storage and delivery system in California and is also the largest irrigation water supply project constructed and operated by U.S. Bureau of Reclamation (Reclamation). Facilities and service areas of the CVP cover a large geographic area, 35 of the 58 counties in California. The CVP includes 20 reservoirs, with a combined storage capacity of approximately 11 million acre feet (AF); eight power plants and two pumping-generating plants; with a combined capacity of approximately two million kilowatts; two pumping plants; and approximately 500 miles of major canals and aqueducts.
4 United States Congress, “Reclamation Projects Authorization and Adjustments Act of 1992,”.Public Law 102-575.

ENTRIX, Inc. 5
The CVP supplies water to more than 250 long term water contractors in the Central Valley, San Francisco Bay Area, and the Santa Clara Valley.5
The CVP is composed of eight separate divisions (see Table 2). Each has one or more units and unique facilities, and each provides at least one project benefit.
5 U.S. Department of the Interior, Bureau of Reclamation, Mid-Pacific Regional Office “CVP Cost Allocation Study,” Final Report. May 2001.

ENTRIX, Inc.
Table 2 Divisions, Units, Benefits, and Facilities of the CVP
Source: U.S. Department of the Interior, Bureau of Reclamation, “Central Valley Project Overview,” Dataweb,
Division Unit Benefits Facilities
American River Folsom and Sly Park
Flood control, water supply, fisheries enhancement and water quality, power generation, and recreation.
Folsom Dam, Lake, and Power Plant; Mormon Island Auxiliary Dam, Nimbus Dam, Power Plant, and Fish Hatchery; Lake Natoma, Sly Park Dam and Jenkins Lake, Camino Conduit, Camp Creek Diversion Dam, and distribution systems.
American River Auburn-Folsom South
Water supply and recreation
Sugar Pine Dan and Reservoir, County Line Dam and Reservoir, and Folsom South Canal.
Delta Irrigation Delta Cross Channel, Contra Costa Canal, Tracy Pumping Plant, Delta-Mendota Canal, and Contra Loma Dam
Friant Flood control and recreation
Friant Dam, Millerton Lake, Madera Canal, and John A. Franchi Diversion Dam
East Side New Melones Flood Control, water supply, recreation, and power generation
New Melones Dam, Lake, and Power Plant
Sacramento River
Sacramento Canals
Irrigation Red Bluff Diversion Dam, Corning Canal, Tehama-Colusa Canal, and pumping plants.
San Felipe Division
Irrigation San Justo Dam and Reservoir, Hollister Conduit, Pacheco Conduit and Tunnel, Santa Clara Conduit and Tunnel, and pumping plants/switchyards
West San Joaquin Division
San Luis Irrigation B.F. Sisk Dam and Reservoir, O’Neill Pumping Plant, William R. Gianelli Pumping –Generating Plant, San Luis Canal, Dos Amigos Pumping Plant, Pleasant Valley Pumping Plant, Coalinga Canal, Los Banos and Little Panoche Detention Dams and Reservoirs, San Luis Drain and Kesterson Reservoir, and distribution systems
Shasta/ Trinity River
Salinity control, flood control, power generation, fish, irrigation, and recreation
Shasta Dam, Lake, and Powerplant; Keswick Dam, Reservoir, and Powerplant; Trinity Dam and Powerplant, Clair Engle Lake, Lewiston Dam, Lake and Powerplant; Trinity River Fish Hatchery, Clear Creek Tunnel, Judge Francis Carr Powerhouse, Whiskeytown Dam and Lake, Spring Creek Debris Dam and Reservoir, Spring Creek Tunnel and Powerplant, and distribution system.
ENTRIX, Inc.
http://www.usbr.gov/dataweb/html/cvp.html (accessed June 20, 2008).
Repayment of Project Costs
The Reclamation Project Act of 1939 (RPA) provides the basic authority for recovering the federal investment in constructing, operating, and maintaining authorized water projects. The Act establishes two primary contract methods for repayment: repayment contracts and water service contracts. Reimbursable CVP project costs are recovered through rates set for each contractor and separate contractor capital payments. Repayment contracts are used when specific cost obligations can be clearly assigned to beneficiaries, e.g. when a specific facility is constructed for the sole benefit of a single contractor. These types of contracts are usually provided for a fixed annual payment, over a 40 year period, for a fixed total amount. Water service contracts are used for projects that provide multiple individual, multipurpose, facilities benefiting different functions and many different contractors (such as the CVP). Costs are allocated to, and recovered from, appropriate beneficiaries based on the amount of water received. The basic unit of measurement for water deliveries (and cost recovery) is AF of water6.
The costs of isolated or out-of-basin facilities7 are the direct repayment responsibility of the contractor (or group of contractors) who benefit from the services provided by the facilities. Accordingly, repayment for operation of isolated or out-of-basin facilities, such as those associated with the San Felipe Unit located west of the Gabilan Mountain Range near Monterey Bay, is not the responsibility of the other CVP contractors, but that of the out-of-basin contractors.8
Cost Allocation
Many major water resource projects are designed and operated to serve multiple purposes. The CVP is no exception and includes both single-purpose and multi-purpose facilities. Cost allocation is used to distribute the costs of project facilities across among the various project
6 U. S. Department of the Interior, Bureau of Reclamation, Mid-Pacific Region, “Ratesetting Process, Overview,” http://www.usbr.gov/mp/cvpwaterrates/docs/indiv_ctr_def_1988/ratesetting_pol.html (accessed June 20th, 2008).
7 The CVP water system facilities located outside the Central Valley Basin of California, i.e., those facilities located in the San Felipe Division service area.
8 U. S. Department of the Interior, Bureau of Reclamation, Mid-Pacific Region, “Ratesetting Process”, Overview, http://www.usbr.gov/mp/cvpwaterrates/docs/indiv_ctr_def_1988/ratesetting_pol.html (accessed June 20th, 2008)

ENTRIX, Inc.
functions according to the benefits provided. Cost allocation also identifies responsibilities for repayment of reimbursable costs. Reimbursable costs are costs that require some level of repayment from project beneficiaries, whereas non-reimbursable costs are the responsibility of the Federal and/or State Government and are paid by taxpayers9 (see Table 3).
Cost allocations for CVP projects are estimated as early as initial construction and are revised as more costs, such as improvements, are incurred. Since many laws, policies, and regulations that affect CVP cost allocations and repayment responsibilities change, cost allocations are reevaluated on an annual basis. Construction costs, annual operation and maintenance (O&M) costs,10 and capital costs are allocated based on the seven authorized purposes of the CVP (shown in Table 3). Costs of single-purpose facilities, such as a canal (water supply) or power plant (power), are allocated directly to the purpose served. Costs of multi-purpose facilities, such as a dam, are allocated among purposes served, including water supply, flood control, and power, using factors developed in the most recent reallocation study.11
9 Construction costs are allocated using the separable cost-remaining benefits (SCRB) method. This is the standard economic approach used by to allocate costs of multipurpose projects to authorized project purposes. Source: U.S. Department of the Interior, Bureau of Reclamation, Mid-Pacific Regional Office “CVP Cost Allocation Study,” Final Report. May 2001.
10 When O&M costs are not specifically related to particular CVP plant-in-service features, alternative factors are used for identifying costs to project purposes.
11 U.S. Department of the Interior, Bureau of Reclamation, Mid-Pacific Regional Office “CVP Cost Allocation Study,” Final Report. May 2001

ENTRIX, Inc.
Table 3 CVP Project Purposes, Reimbursement Status, and Repayment Responsibility
Project Purpose Reimbursement Repayment Responsibility
Flood Control Non-reimbursable Federal Taxpayers
Navigation Non-reimbursable Federal Taxpayers
Water Supply
Irrigation Reimbursable Irrigation Users
M&I Reimbursable M&I Users
Wildlife Refuge
Level 1 Non-reimbursable Federal Taxpayers
Level 2 Increment Reimbursable Irrigation, M&I, Commercial Power Users
Level 4 Increment Non-reimbursable Federal (75%) and State (25%) Taxpayers
Hydroelectric Power Generation
Commercial Power Reimbursable Commercial Power Customers
Project Use Power
Level 1 Non-reimbursable Federal Taxpayers
Level 2 Increment Reimbursable Irrigation, M&I, Commercial Power Users
Level 4 Increment Non-reimbursable Federal (75%) and State (25%) Taxpayers
Water Quality Improvement
Non-reimbursable Federal Taxpayers
Recreation Both Recreation Users and Federal Taxpayers
Fish and Wildlife Protection, Restoration and Enhancement
Non-reimbursable Federal Taxpayers
Source: U.S. Department of the Interior, Bureau of Reclamation, Mid-Pacific Regional Office “CVP Cost Allocation Study,” Final Report, May 2001
The cost allocation updates are performed annually in three phases. Phase 1 is an annual review and update of construction cost allocations. In conducting the review, Reclamation first analyzes the most recent financial statements for CVP facilities; Western Area Power Administration (WAPA) financial statements for power operations; and the Corps of Engineers annual allocation for New Melones Dam and Reservoir. These data, along with updated water delivery and CVP-generated power use data, are used to update the plant-in-service allocation for each plant feature. Plant features include dams, reservoirs, power

ENTRIX, Inc.
plants, canals, pumping plants and other fixed assets. Revisions are also based upon the current-year capital balance, updated water delivery information, and updated costs (or reductions) for any retired or abandoned plants for the most recently-completed fiscal year.
In the second phase, Reclamation allocates costs among purposes served. Because repayment criteria can differ based on authorizing legislation, project purpose, and historical and projected use of the facility, this phase re-establishes the repayment responsibility for the cost of each facility. Repayment for a projects with multi-purposes may be reimbursable, non-reimbursable, or both.
Water supply repayment costs are sub-allocated among irrigation, municipal and industrial (M&I), and wildlife refuge users proportionate to their respective shares of historical and projected CVP water deliveries over the period 1949-2030. Project use power is allocated to the same water supply functions.
Project power costs are allocated between commercial and project use power proportionate to their respective historical and projected utilization of CVP-generated power. Project use power is further sub-allocated among irrigation, M&I, and wildlife refuges proportionate to their respective historical and projected uses of CVP-generated power required to deliver water. Commercial power is reimbursable from CVP power preference customers.
In the third phase, Reclamation prepares and publishes the updated ratebooks for both irrigation and M&I water rates by units of acre-feet.12
Rate Computation
The CVP rate for each contractor is based on cost-of-service (COS),13 with capital costs amortized over a 50-year period. Water rates incorporate the "pooled and averaged costs" approach in accordance with the "operationally and financially integrated project”14 concept
12 U. S. Department of the Interior, Bureau of Reclamation, Mid-Pacific Region, Rate Setting Process, Cost Allocation, http://www.usbr.gov/mp/cvpwaterrates/rate_process/cost_allocation.html (accessed June 20, 2008)
13 Utilities’ revenue requirements (those needed to operate and maintain facilities, cover capital expenses, and earn a profit) are first evaluated. Usually, rates are then established to generate the required revenues. For some utilities, the costs for water, electricity, or natural gas for their customers, and/or fuel to generate power is also part of their revenue requirement but may be reviewed more frequently or in a separate proceeding. Sometimes, these later expenses are approved based on forecasts, then reviewed again after purchased to ascertain if the expense was reasonable.
14 While the facilities are spread over several hundred miles, they are financially and operationally integrated as a single large water project.

ENTRIX, Inc.
initially established by Congress and reaffirmed each time the CVP was reauthorized to include a new unit.
COS rates are used for all contractors other than those for which the ability to pay is limited by a documented payment capacity limitation (discussed below). The COS rates reflect credits for past capital payments and miscellaneous receipts.
The COS water rates apply to all types of water within the CVP, including Class 1,15 Class 2,16 and the storage and/or conveyance of non-project water in CVP facilities. All CVP irrigation COS and full-cost pricing17 determinations are made in accordance with the rate setting policy. The COS water rates are built on a unique assembly of cost components frequently referred to as "cost pools.” Each contractor pays a rate which includes a proportionate share of the cost pools associated with the specific service required to provide that contractor with CVP water. The various cost pools involved are discussed below.
All of the costs of those CVP facilities in service are included in the irrigation water rates. The cost of facilities not being fully utilized (unused capacity) is deferred only if approved by Congress.
Interest
Reclamation has different policies on interest payment responsibilities for irrigation and M&I contractors. Irrigation capital expenses are non-interest-bearing, whereas M&I capital accrue at the project rate of interest (approximately 3.5% per annum).18 Water rates are established at sufficiently high levels to repay the capital investment and interest and, when appropriate, to assist in repayment of irrigation costs which are beyond the ability of the irrigators to repay. Reclamation policy is to include hydroelectric power as a project purpose when it is economically feasible to do so, and to market any such power which is produced in excess of the CVP needs through WAPA. Revenues not needed to repay power costs may be credited in repayment of irrigation costs, if appropriate, after power investments are repaid with interest.
15 Class 1 contracts are based on a firm water supply and are generally assigned to M&I and agriculture water users who have limited access to good quality ground water.
16 Class 2 contracts are for supplemental supplies delivered directly for agricultural use or ground water recharge, generally in areas that have good quality ground water supplies for use during surface water deficiencies.
17 Full cost rates are the equivalent of Cost of Service rates with the exception that full cost rates include interest on capital at the interest rates specified in the Reclamation Reform Act (RRA). In contrast, Cost of Service includes interest based on CVP project interest rates.
18 http://www.usbr.gov/mp/cvpwaterrates/rate_process/faq.html

ENTRIX, Inc.
Irrigation contractor deficits were non-interest-bearing until fiscal year 1985. Interest is now charged to M&I and Irrigation contractors on all O&M deficits incurred on or after October 1, 1985.19 Transactions (either net repayment or deficits) prior to that date are not included in determining the interest bearing deficit amount. The rate of interest applied to the O&M deficits is determined annually by the Treasury Department in accordance with the criteria provided in Public Law 99-546. Unpaid interest charges compound for any deficit accruing or accumulating on or after October 1, 1985.
Ability to pay
Reclamation recognizes the “ability to pay” concept used for a many years in irrigation water contracting. To establish its ability to pay, a contractor can prepare, or have prepared at its expense, an acceptable payment capacity analysis. The contractor is responsible for Reclamation’s costs in reviewing and approving the analysis. All new or amended contracts contain provisions for redetermination and adjustment of a contractor's ability to pay at 5-year intervals.20
Annual Accounting
Each year, Reclamation completes an accounting to determine each contractor’s net financial position for the most recently-completed fiscal year to provide the Agency with information used to establish the contractor’s repayment status. That information in turn is then used to establish water rates for the forthcoming water year. The process compares a contractor’s recorded water revenues against costs and applicable interest based on water deliveries. The analysis is used to generate the contractor’s final Net Results of Operations21 for the year.
The Net Results of Operations may reflect either a deficit or a surplus for the year. An annual M&I deficit is defined as "the excess of allocated annual O&M and applicable interest expense on water deliveries under a contract over revenues earned from the sale of water under that contract." An annual M&I surplus is defined as "the excess of revenues earned from the sale of water under a contract over annual O&M and interest expense allocated to water deliveries under that contract." Annual surpluses are used to repay either accumulated deficits or capital obligations. The results are used annually to update previously-accumulated deficits or surpluses.
19 Section 106 of Public Law 99-546
20 Section 105 of Public Law 99-546.
21 The Net Results of Operations is documented in the M&I and Irrigation Ratebooks, Volume 1.

ENTRIX, Inc.
Annual contractor accountings are performed under both CVP rate setting policies. Prior to the Coordinated Operations Act of 1986 (COA), deficits were pooled on a CVP-wide basis. However, Section 106 of the COA established several new requirements pertaining to CVP O&M deficit accounting. Specifically, Section 106 requires Reclamation to:
1. Include provisions in each new or amended CVP water service contract to ensure repayment of O&M deficits "outstanding and hereinafter arising" incurred by a CVP contractor. To determine these amounts by individual M&I and irrigation water service contractor, Reclamation conducted an individual accounting of all O&M and capital costs for the period from 1949 through 1985. These annual accountings were also conducted for years after fiscal year 1985.22
2. Charge interest on all O&M deficits arising on or after October 1, 1985, using specified interest rates. The main impact of this provision was on irrigation. Prior to this date, no interest was charged on annual irrigation O&M deficits.
For both M&I and irrigation contractors, capital obligations are the total capital costs allocated to a contract based on 50 years of historical and projected water deliveries. Capital rates are computed on only the unpaid capital obligation to date.
The total of all individual annual accountings for the period 1949 -1985 is an overall deficit. Virtually all contracts during that period were nonadjustable fixed rate contracts that did not generate sufficient revenue to cover annual allocated O&M and interest (as applicable) costs. This initial deficit represented the cumulative difference over time between fixed rate revenues and the actual cost of delivering the water. This includes Reclamation costs as well as certain costs incurred by WAPA and the U.S. Army Corps of Engineers.
22 While these accountings establish deficit and/or surplus repayment positions to date, such deficits are not legally binding on fixed rate and adjustable rate contractors until they amend or renew their contracts.

ENTRIX, Inc.
Reimbursable Payment Responsibilities of CVP Contractors
Repayment Background
Ultimately, the capital investment in CVP facilities is recaptured through rates assessed to individual contractors based on the RPA.23 The RPA provided the basic authority for recovering the federal investment in construction, operation, and maintenance of authorized water resource projects. Authorization statutes for the CVP also established reimbursement requirements for some purposes and exempted others from repayment. The non-reimbursable purposes, such as flood control and navigation, were considered national obligations and their costs are borne by the Federal Government. The costs allocable to other purposes, such as recreation and fish and wildlife, are shared by both project beneficiaries and the Federal Government (see Table 1 of “Background on CVP Costs, Allocation, and Repayment Issues”).24
The Reclamation employed a “rolling repayment” policy with the first CVP water deliveries, while the repayment period of the entire CVP was extended each time a new facility was added to the CVP. All long-term contracts were non-adjustable (fixed-rate). M&I contractors were required to pay interest on all capital costs and deficits,25 while irrigation contractors were generally not required to pay interest for irrigation services.26
However, Public Law 99-546 (1986) changed the policies to recover Federal Government investment, including any operation and maintenance (O&M) deficits from CVP contractors. This policy replaced the “rolling repayment” policy and established a definite 50-year block
23 The water rate for a contractor reflects the extent and types of services provided by Reclamation in delivering water to that contractor. Components of the contractor rate include CVP-wide, pooled service area, and individual rates.
24 Gaines, Raymond W., 1986, "Central Valley Project Development," Chapter 1.
25 The terms "deficit" or "operation and maintenance deficit" refer to the accumulation of annual operation and maintenance costs in excess of the annual water service payments made under a contract with a particular entity.
26 U.S. Department of the Interior, Bureau of Reclamation, December 2007, “Water Ratesetting Overview, Ratesetting 101,” Sacramento.

ENTRIX, Inc.
repayment period beginning in 1980 with placement into service of the last major CVP facility, the New Melones Project; and ending in year 2030. This new 50-year policy established required repayment of the costs of all construction, rehabilitation, and major rehabilitations and new facilities added to the CVP for that same period.27 Similarly, it also provided for the automatic adjustment of COS water rates on an annual basis. Water rates are based on “pooled and averaged costs” in accordance with the “operationally and financially integrated project” concept and are recalculated or confirmed each time the CVP is reauthorized to include a new unit.28
Reclamation has two types of contracts for repayment of CVP capital costs, direct repayment or water service contracts. Direct repayment contracts are used when the specific cost obligations and benefits of a CVP facility are allocable to a single contractor. These typically are for fixed, non-adjustable rates for 40 years. Water service contracts are used when a CVP facility provides multiple project functions for multiple contractors. For such projects, costs are allocated to, and recovered from, beneficiaries based on the amount of water they receive.29
Irrigation Repayment
As noted above, most original long-term contracts, including those for irrigation, were for fixed rates and were not adjustable over the 40-year duration of these instruments. Typically, these rates have been insufficient to recover the full O&M and capital costs allocated to contractors. More recently, irrigation COS rates per AF, designed to recover all costs associated with CVP water delivery to contractors, have been determined. Costs to be recovered include, for each contractor, allocated annual O&M costs and capital and deficit costs over the repayment period. O&M rates include provisions for costs of water marketing, storage, conveyance, conveyance pumping, drainage, and direct pumping. Allocated capital costs include those for storage, conveyance, conveyance pumping, drainage, direct pumping, and other related expenses. The deficit rate is to recover aggregated deficiencies between revenues and O&M costs over previous years. Newer contracts require annual adjustments to COS rates and older contracts, with fixed rate provisions, will eventually be replaced with those including annual adjustments.
27 U.S. Department of Interior, Bureau of Reclamation, Mid-Pacific Region, http://www.usbr.gov/mp/cvpwaterrates/docs/indiv_ctr_def_1988/ratesetting_pol.html, accessed June 20, 2008.
28 Ibid.
29 U. S. Department of the Interior, Bureau of Reclamation, Mid-Pacific Region, “Ratesetting Process, Overview,” http://www.usbr.gov/mp/cvpwaterrates/docs/indiv_ctr_def_1988/ratesetting_pol.html, accessed June 20th, 2008.
ENTRIX, Inc.
Rates for each of these categories vary by contractor based upon the CVP irrigation rate setting policy. Under this policy, all irrigation costs are broken down into the components noted above, and contractors are responsible for only the costs of those components used in delivering water to them30. Other factors affecting irrigation contractor water rates include: repayment status, water delivery projections, and amounts of outstanding O&M deficits31.
Municipal and Industrial Repayment
M&I fixed rates are specified in the original long-term water service contracts between Reclamation and CVP M&I water contractors. As noted above, fixed rates have generally been insufficient to recover annual O&M and interest costs, while repaying allocated capital costs. Newer contracts incorporate annually adjusted COS rates. The M&I COS rate includes the same three categories of costs as those for irrigation contractors, the only exceptions being that M&I contractors incur interest on all unpaid capital allocations and on unpaid O&M deficits.
Rates for each of these categories vary by contractor, depending upon the water service components used to deliver contract water (which vary by water service area); repayment status; water delivery projections; and amounts of outstanding O&M deficits32.
San Joaquin Valley Contactors
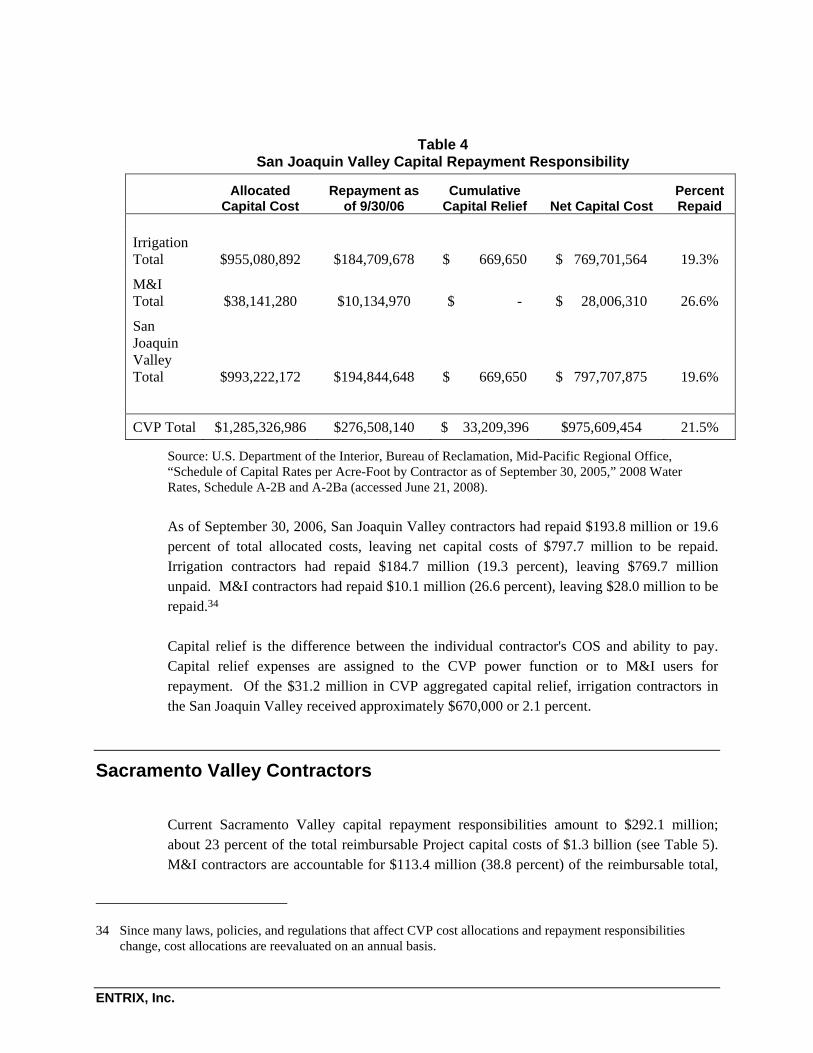
The CVP provides project water to both irrigation and M&I contractors in the San Joaquin Valley. Current San Joaquin Valley capital repayment responsibilities are $993.2 million, which represents over 77 percent of the total reimbursable project capital costs of nearly $1.3 billion. Irrigators are responsible for $955 million or 96.2 percent of the reimbursable total and M&I contractors are responsible for the remaining $38.1 million (See Table 4).33 Repayment responsibilities of individual contractors are in Appendix A.
30 For example, many contractors do not benefit from conveyance, conveyance pumping, drainage and direct pumping cost components. Consequently, their COS O&M rate and the COS capital rate differ from those contractors who do benefit from use of those components.
31 U. S. Department of the Interior, Bureau of Reclamation, Mid-Pacific Region, “Ratesetting Process, Irrigation Ratesetting Document” http://www.usbr.gov/mp/cvpwaterrates/rate_process/irr_water_rates.html (accessed June 26, 2008)
32 U. S. Department of the Interior, Bureau of Reclamation, Mid-Pacific Region, “Ratesetting Process, M&I Ratesetting Document” http://www.usbr.gov/mp/cvpwaterrates/rate_process/mi_water_rates.html (accessed June 26, 2008)
33 See Appendix Table A-1 for a listing of comparable data for individual irrigation and M&I contractors.
ENTRIX, Inc.
Table 4 San Joaquin Valley Capital Repayment Responsibility
Allocated
Capital Cost Repayment as
of 9/30/06 Cumulative
Capital Relief Net Capital Cost Percent Repaid
Irrigation Total $955,080,892 $184,709,678 $ 669,650 $ 769,701,564 19.3%
M&I Total $38,141,280 $10,134,970 $ - $ 28,006,310 26.6%
San Joaquin Valley Total $993,222,172 $194,844,648 $ 669,650 $ 797,707,875 19.6%
CVP Total $1,285,326,986 $276,508,140 $ 33,209,396 $975,609,454 21.5%
Source: U.S. Department of the Interior, Bureau of Reclamation, Mid-Pacific Regional Office, “Schedule of Capital Rates per Acre-Foot by Contractor as of September 30, 2005,” 2008 Water Rates, Schedule A-2B and A-2Ba (accessed June 21, 2008).
As of September 30, 2006, San Joaquin Valley contractors had repaid $193.8 million or 19.6 percent of total allocated costs, leaving net capital costs of $797.7 million to be repaid. Irrigation contractors had repaid $184.7 million (19.3 percent), leaving $769.7 million unpaid. M&I contractors had repaid $10.1 million (26.6 percent), leaving $28.0 million to be repaid.34
Capital relief is the difference between the individual contractor's COS and ability to pay. Capital relief expenses are assigned to the CVP power function or to M&I users for repayment. Of the $31.2 million in CVP aggregated capital relief, irrigation contractors in the San Joaquin Valley received approximately $670,000 or 2.1 percent.
Sacramento Valley Contractors
Current Sacramento Valley capital repayment responsibilities amount to $292.1 million; about 23 percent of the total reimbursable Project capital costs of $1.3 billion (see Table 5). M&I contractors are accountable for $113.4 million (38.8 percent) of the reimbursable total,
34 Since many laws, policies, and regulations that affect CVP cost allocations and repayment responsibilities change, cost allocations are reevaluated on an annual basis.

ENTRIX, Inc.
and irrigators are accountable for the remaining $178.7 million (61.2 percent). Repayment responsibilities of individual contractors are in Appendix A.
Table 5 Sacramento Valley Capital Repayment Responsibility
Allocated Capital
Cost Repayment
as of 9/30/06 Cumulative
Capital Relief Net Capital
Cost Percent Repaid
Irrigation Total $178,749,923 $14,054,321 $32,539,746 $132,155,856 7.9%
M&I Total $113,354,885 $67,609,168 ($1,974,631) $45,745,717 59.6%
Sacramento Valley Total $292,104,808 $81,663,489 $30,565,115 $177,901,573 28.0%
CVP Total $1,285,326,986 $276,508,140 $33,209,396 $975,609,454 21.5%
Source: U.S. Department of the Interior, Bureau of Reclamation, Mid-Pacific Regional Office “Schedule of Capital Rates per Acre-Foot by Contractor as of September 30, 2006,” 2008 Water Rates, Schedule A-2B and A-2Ba (accessed June 21, 2008).
At September 30, 2006, Sacramento Valley CVP contractors had repaid $81.7 million or 28 percent of their total allocated costs, leaving net future capital cost of $177.9 million to be repaid. M&I contractor repayments were $67.6 million (59.6 percent), leaving $45.7 million to be repaid. Irrigation contractors’ repayments were $14.1 million (7.9 percent), leaving $132.2 million to be repaid.35
35 The many laws, policies, and regulations that affect CVP cost allocations and repayment responsibilities change frequently, therefore cost allocations are reevaluated annually.

ENTRIX, Inc.
Financial Statement Analysis of CVP Contractors
Financial Statement Background
The financial statements of California’s public water agencies are generally developed using fund concepts following the Governmental Accounting Standards Board (GASB). Condensed financial statements are published by the California State Controller in the “Special Districts Annual Report.” Reports are compiled from standardized documents utilizing accounting and reporting procedures in accordance with the Uniform Accounting Systems of Special Districts, prescribed in Section 1113.1 of the California Code of Regulations. The financial statements are based on a fiscal year beginning July 1st and ending June 30th. The most recent report was published in March 2008 and contains data for FY 2005-06.36 The earliest available report including detailed financial information for special districts is for FY 1999-98.
The Ten Largest CVP Irrigation Contractors in the San Joaquin Valley
This section includes a review of the condensed financial information for the largest ten CVP irrigation contractors in the Valley. The contractors and information on their respective 2007 CVP deliveries are shown in Table 6. In the financial review for the period from 1998-1999 through 2005-2006, the focus was on the largest sources of revenue and expenses, as well as on operating and non-operating net incomes. The analysis also includes an examination of trends for the contractors.
Collectively, the 10 irrigation contractors shown in Table 6 received over 1.8 million AF of CVP water in 2007, representing 77.5 percent of CVP water for the Valley. The 1.8 million AF also accounted for 51.5 percent of all 2007 CVP water deliveries37.
36 In some cases the actual reports of water agencies are on a calendar year basis and the Special District reports data in the fiscal year.
37 Excluding water deliveries for the Delta-Mendota Exchange Contractors.

ENTRIX, Inc.
Table 6 Largest San Joaquin Valley CVP Contractors Based Upon 2007 Projected
Water Deliveries
Contractor Projected Acre-Feet
Delivered Percentage of San
Joaquin CVP Water
Westlands Water District 701,134 30.0%
Madera Irrigation District 176,103 7.5%
Lower Tule River Irrigation District 160,450 6.9%
Arvin-Edison Water Storage District 159,271 6.8%
Delano-Earlimart Irrigation District 131,953 5.6%
Chowchilla Water District 131,175 5.6%
Southern San Joaquin Municipal Utility District 111,315 4.8%
Tulare Irrigation District 83,763 3.6%
Del Puerto Water District 82,712 3.5%
San Luis Water District 73,325 3.1%
Top Ten Total 1,811,201 77.5%
Source: United States Department of the Interior, Bureau of Reclamation, Mid-Pacific Regional Office, “Schedule of Historical (1981-2006) & Projected (2007-2030) Irrigation Water Deliveries For Calculation of Individual Contractor Prorated Capital Costs,” Irrigation, 2008 Schedule A-14 (accessed July 15, 2008).
Westlands Water District
Westlands Water District (Westlands) is the largest CVP water user in the Valley and receives water by the San Luis Canal. In 2007, its projected water delivery was 701,134 AF; accounting for 30.0 percent of total water for the Valley. Among the 10 districts, Westlands carries the greatest amount of long-term debt. Total outstanding long-term debt at the end of FY 2005-2006 was nearly $190 million; representing 75 percent of the total long-term debt among the ten contractors.38 Westlands also owed $54.3 million in construction costs financed by the Federal and State government in FY 2005-2006, accounting for 83.4 percent of the total for the agencies. The net capital cost allocated to Westland irrigation contractors for CVP repayment was $373.7 million in 2008.39
38 See Appendix B, Table B-1
39 See Appendix B, Table B-2
ENTRIX, Inc.
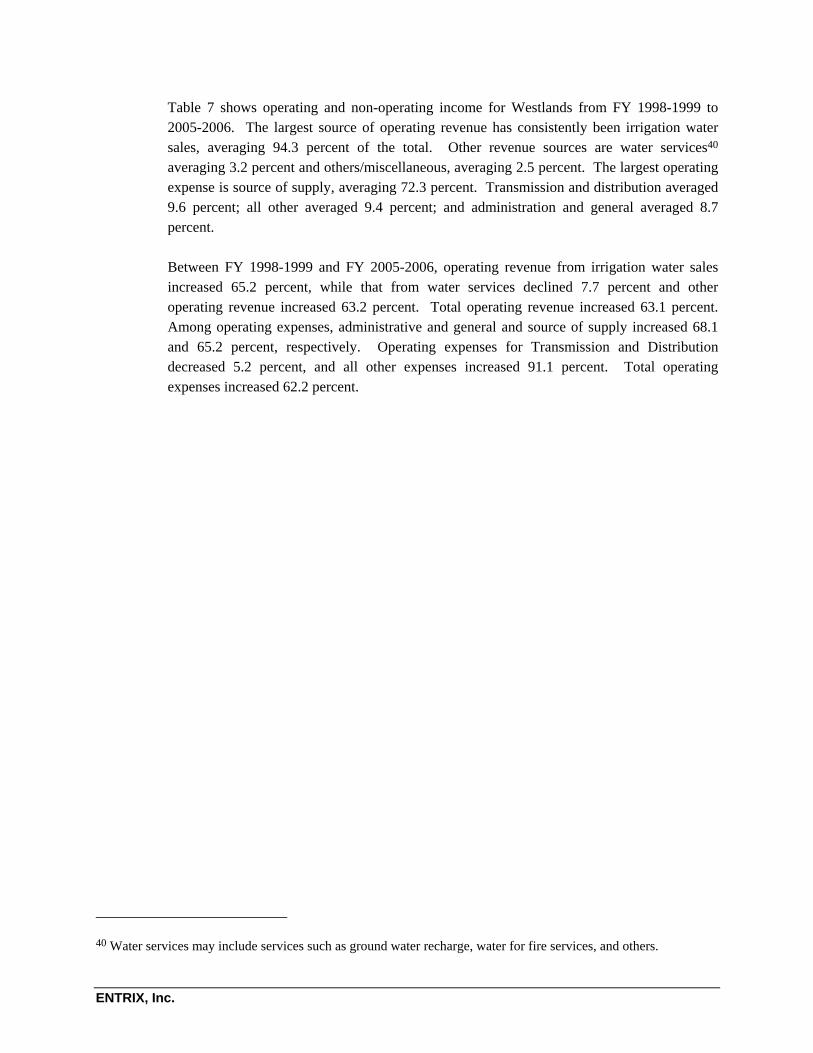
Table 7 shows operating and non-operating income for Westlands from FY 1998-1999 to 2005-2006. The largest source of operating revenue has consistently been irrigation water sales, averaging 94.3 percent of the total. Other revenue sources are water services40 averaging 3.2 percent and others/miscellaneous, averaging 2.5 percent. The largest operating expense is source of supply, averaging 72.3 percent. Transmission and distribution averaged 9.6 percent; all other averaged 9.4 percent; and administration and general averaged 8.7 percent.
Between FY 1998-1999 and FY 2005-2006, operating revenue from irrigation water sales increased 65.2 percent, while that from water services declined 7.7 percent and other operating revenue increased 63.2 percent. Total operating revenue increased 63.1 percent. Among operating expenses, administrative and general and source of supply increased 68.1 and 65.2 percent, respectively. Operating expenses for Transmission and Distribution decreased 5.2 percent, and all other expenses increased 91.1 percent. Total operating expenses increased 62.2 percent.
40 Water services may include services such as ground water recharge, water for fire services, and others.

ENTRIX, Inc.
Table 7 Westlands Water District Financial Statement Review,
FY 1998-99 to FY 2005-06
Average Annual
Composition Percent Change FY 98-99 -
FY 2005-06
Operating Revenues
Water Sales
Irrigation 94.3% 65.2%
Water Services 3.2% -7.7%
All Other 2.5% 63.2%
Total Operating Revenues 100.0% 63.1%
Operating Expenses
Source of Supply 72.3% 65.2%
Administration and General 8.7% 68.1%
Transmission and Distribution 9.6% -5.2%
All Other 9.4% 91.1%
Total Operating Expenses 100.0% 62.2%
Non-Operating Revenues Interest Income 17.5% 198.2%
Property Assessments 58.5% 351.1%
All Other 24.0% -81.6%
Total Non-Operating Revenues 100.0% -81.6%
Non-Operating Expenses
Interest Expenses 98.1% 3,270.7% All Other 1.9% -100.0% Total Non-Operating Expenses 100.0% 2,109.7%
Over the eight years, the largest sources of non-operating revenue for Westlands were property assessments, averaging 58.5 percent, followed by interest income averaging 17.5 percent, and others averaging 24.0 percent. The largest non-operating expense over the same period was for interest, averaging 98.1 percent.

ENTRIX, Inc.
Interest income increased 198.2 percent, property assessments increased 351.1 percent, and other non-operating revenues decreased 81.6 percent. Total non-operating revenues decreased 81.6 percent. Total interest expense increased 3,270.7 percent41 and all other non-operating expenses decreased 100.0 percent. Total non-operating expenses decreased 2,109.7 percent.
Madera Irrigation District
Madera Irrigation District (Madera) is the second largest recipient of CVP water in the Valley and receives water by the Madera Canal. In 2007, its projected water delivery was 176,103 AF, accounting for 7.5 percent of total water for the Valley. Madera also carried the second largest amount of long-term debt. Total outstanding long-term debt at the end of FY 2005-2006 was $47.9 million, 18.9 percent of the 10 Valley contractors.42 Madera also owed $1.9 million in construction costs financed by the Federal and State government in FY 2005-2006, accounting for 3.0 percent of the total for the 10 contractors. The net capital cost allocated to Madera irrigation contractors for CVP repayment was $33.8 million in 2008.43
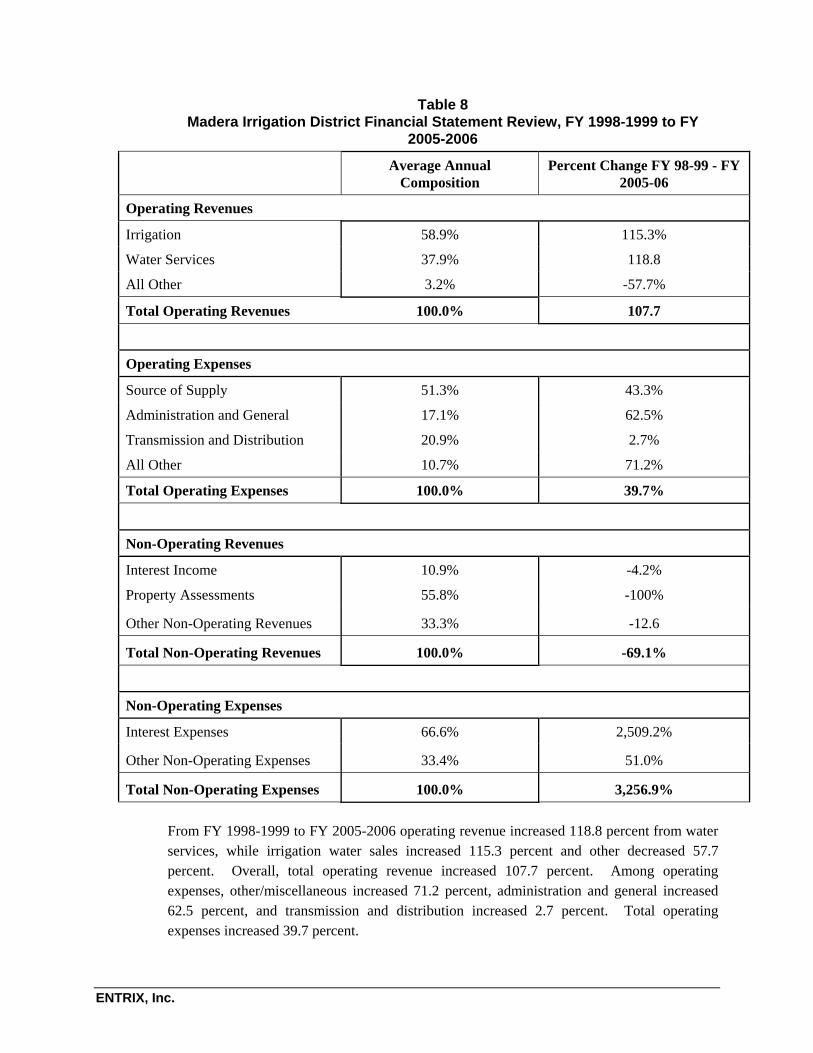
As shown in Table 8, Madera’s largest sources of operating revenue for the eight years were irrigation water sales, averaging 58.9 percent; water services, averaging 37.9 percent; and others, averaging 3.2 percent. Madera’s largest operating expenses over the same period were source of supply, averaging 51.3 percent; transmission and distribution, averaging 20.9 percent; administration and general, averaging 17.1 percent; and others, averaging 10.7 percent.
41 Interest expense increased because Westlands issued long-term debt of more than $222 million between 1999 and 2005. See California State Controller, 2008, Special Districts Annual Report, Sacramento, Table 14.
42 See Appendix B, Table B-1
43 See Appendix B, Table B-2
ENTRIX, Inc.
Table 8 Madera Irrigation District Financial Statement Review, FY 1998-1999 to FY
2005-2006
Average Annual
Composition Percent Change FY 98-99 - FY
2005-06
Operating Revenues
Irrigation 58.9% 115.3%
Water Services 37.9% 118.8
All Other 3.2% -57.7%
Total Operating Revenues 100.0% 107.7
Operating Expenses
Source of Supply 51.3% 43.3%
Administration and General 17.1% 62.5%
Transmission and Distribution 20.9% 2.7%
All Other 10.7% 71.2%
Total Operating Expenses 100.0% 39.7%
Non-Operating Revenues
Interest Income 10.9% -4.2%
Property Assessments 55.8% -100%
Other Non-Operating Revenues 33.3% -12.6
Total Non-Operating Revenues 100.0% -69.1%
Non-Operating Expenses
Interest Expenses 66.6% 2,509.2%
Other Non-Operating Expenses 33.4% 51.0%
Total Non-Operating Expenses 100.0% 3,256.9%
From FY 1998-1999 to FY 2005-2006 operating revenue increased 118.8 percent from water services, while irrigation water sales increased 115.3 percent and other decreased 57.7 percent. Overall, total operating revenue increased 107.7 percent. Among operating expenses, other/miscellaneous increased 71.2 percent, administration and general increased 62.5 percent, and transmission and distribution increased 2.7 percent. Total operating expenses increased 39.7 percent.

ENTRIX, Inc.
The largest sources of non-operating revenue for Madera were property assessments, averaging 55.8 percent; other, averaging 33.3 percent; and interest income, averaging 10.9 percent. Madera’s largest sources of non-operating expenses over the same period were interest expense, averaging 66.6 percent; and other, averaging 33.4 percent.
Over the eight years, non-operating revenue from property assessments decreased 100.0 percent, others decreased 12.6 percent and interest decreased 4.2 percent. Total non-operating revenues decreased 69.1 percent. Non-operating expenses increased 3,256.9 percent. Interest expense rose 2,509.2 percent44 and other expense increased 51.0 percent..
Lower Tule River Irrigation District
Lower Tule River Irrigation District (Lower Tule) is the third largest recipient of CVP water in the Valley and receives water from the Friant-Kern and Cross Valley Canals. In 2007, its projected water delivery was 160,450 AF, accounting for 6.9 percent of total water for the Valley. Among the 10 contractors, Lower Tule carries the least long-term debt. Total outstanding long-term debt at the end of FY 2005-2006 was $305,000. Moreover, in contrast to other contractors, Lower Tule does not owe the United States or California for construction costs.45 The net capital cost allocated to Lower Tule irrigation contractors for CVP repayment was $27.5 million in 2008.46
As shown in Table 9, the largest sources of operating revenue over the eight years were irrigation water sales, averaging 86.1 percent; water services, averaging 11.3 percent; and others, averaging 2.6 percent. The largest sources of operating expenses were source of supply, averaging 69.1 percent; administration and general, averaging 17.6 percent; transmission and distribution, averaging 11.5 percent; and others, averaging 2.6 percent.
Between FY 1998-1999 and FY 2005-2006, operating revenue from irrigation water sales increased 209.6 percent and water services decreased 17.4 percent; other water revenues fell 100 percent. Overall, total operating revenue increased 181.2 percent. Among operating expenses, source of supply increased 149.9 percent, administration and general increased 55.3 percent, other increased 51.2 percent, and transmission and distribution increased 2.2 percent. Overall, total operating expenses increased 101.6 percent.
44 Interest expense increased because Madera issued more than $47 million of long-term debt in 2005. See California State Controller, 2008, Special Districts Annual Report, Sacramento, Table 14.
45 See Appendix B, Table B-1
46 See Appendix B, Table B-2

ENTRIX, Inc.
Table 9 Lower Tule River Irrigation District Financial Statement Review, FY 1998-1999
to FY 2005-2006
Average Annual Composition Percent Change FY 98-99 - FY
2005-06
Operating Revenues
Irrigation 86.1% 209.6%
Water Services 11.3% -17.4%
All Other 2.6% -100%
Total Operating Revenues 100.0% 181.2%
Operating Expenses
Source of Supply 69.1% 149.9%
Administration and General 17.6% 55.3%
Transmission and Distribution 11.5% 2.2%
All Other 1.8% 51.2%
Total Operating Expenses 100.0% 101.6%
Non-Operating Revenues
Interest Income 6.7% -69.1%
Property Assessments 86.2% -0.2%
All Other 7.1% 27.1%
Total Non-Operating Revenues 100.0% -7.5%
Non-Operating Expenses
Interest Expenses 13.6% 64.4%
All Other 86.4% -100%
Total Non-Operating Expenses 100.0% -96.8%
As shown in Table 9, the largest sources of non-operating income were property assessments, averaging 86.2 percent; other, averaging 7.1 percent; and interest, averaging 6.7 percent. Among non-operating expenses, the largest sources were other, averaging 86.4 percent, and interest, averaging 13.6 percent.
Between FY 1998-1999 and FY 2005-2006, non-operating revenue from interest decreased 69.1 percent, others decreased 27.1 percent, and property assessments decreased 0.2 percent.

ENTRIX, Inc.
Overall, total non-operating revenues decreased 7.5 percent. Among non-operating expenses, interest increased 64.4 percent and other decreased 100.0 percent. Overall, total non-operating expenses decreased 96.8 percent.
Arvin-Edison Water Storage District
Arvin-Edison Water Storage District (Arvin-Edison) is the fourth largest recipient of CVP water in the Valley and receives water from the Friant-Kern Canal. In 2007, its projected water delivery was 159,271 AF, accounting for 6.8 percent of total water for the Valley. Total outstanding long-term debt at the end of FY 2005-2006 was $10.2 million, representing 4.0 percent of the total long-term debt among 10 contractors.47 Arvin-Edison also owed $4.1 million in construction costs financed by the United States and California. The net capital cost allocated to Arvin-Edison for CVP repayment was $24.6 million in 2008.48
As shown in Table 10, the largest source of operating revenue for the eight years was irrigation water sales, averaging 55.0 percent. Water services averaged 42.3 percent, and others averaged 2.7 percent. The largest operating expenses over the same period were source of supply, averaging 46.4 percent; transmission and distribution, averaging 25.5 percent; others, averaging 14.8 percent; and administration and general expenses, averaging 13.3 percent.
47 See Appendix B, Table B-1
48 See Appendix B, Table B-2

ENTRIX, Inc.
Table 10 Arvin-Edison Water Storage District Financial Statement Review, FY 1998-1999
to FY 2005-2006
Average Annual Composition
Percent Change FY 98-99 - FY 2005-06
Operating Revenues
Water Sales
Irrigation 55.0% 39.7%
Water Services 42.3% -77.5%
All Other 2.7% -81.1%
Total Operating Revenues 100.0% -20.2%
Operating Expenses
Source of Supply 46.4% 115.3%
Administration and General 13.3% 86.7%
Transmission and Distribution 25.5% 214.6%
All Other 14.8% 104.9%
Total Operating Expenses 100.0% 135.6%
Non-Operating Revenues
Interest Income 23.3% -68.1%
Property Assessments 44.0% 2.3%
All Other 32.7% 189.1%
Total Non-Operating Revenues 100.0% -8.5%
Non-Operating Expenses
Interest Expenses 30.4% 2,939.0%
All Other 69.6% -100.0%
Total Non-Operating Expenses 100.0% -2,752.4%
Over the eight years, operating revenue from irrigation water sales increased 39.7 percent. Operating revenue from water services declined 77.5 percent, and other operating revenue decreased 81.1 percent. Overall, total operating revenue decreased 20.2 percent. Among operating expenses, transmission and distribution increased 214.6 percent, source of supply increased 115.3 percent, others increased 104.9 percent, and administrative and general increased 86.7 percent. Total operating expenses increased 135.6 percent.

ENTRIX, Inc.
The largest sources of non-operating revenue over the eight years were property assessments, averaging 44.0 percent; other, averaging 32.7 percent; and interest income, averaging 23.3 percent. The principal non-operating expenses over the eight years were other, averaging 69.9 percent; and interest expense, averaging 30.4 percent.
Non-operating revenue from other increased 189.1 percent, interest income decreased 68.1 percent, and property assessments increased 2.3 percent. Total non-operating revenues decreased 8.5 percent. Non-operating expenses rose 2,752.4 percent. Interest expense increased 2,939 percent49 and other decreased 100.0 percent.
Delano Earlimart Irrigation District
Delano-Earlimart Irrigation District (Delano-Earlimart) is the fifth largest recipient of CVP water in the Valley and receives water from the Friant-Kern Canal. In 2007, its projected water delivery was 131,953 AF, accounting for 5.6 percent of total water for the Valley. Among the ten contractors, Delano-Earlimart carried the second lowest amount of long-term debt. Total outstanding long-term debt at the end of FY 2005-2006 was $1,871,392. Delano-Earlimart does not owe the United States or California government for construction costs.50 The net capital cost allocated to Delano-Earlimart irrigation contractors for CVP repayment was $29.2 million in 2008.51
As shown in Table 11, Delano-Earlimart’s largest sources of operating revenue for the eight years were irrigation water sales, averaging 58.9 percent; water services, averaging 33.2 percent; and others, averaging 7.9 percent. The largest sources of operating expenses were source of supply, averaging 76.5 percent; administration and general, averaging 12.2 percent; transmission and distribution, averaging 6.2 percent; and others, averaging 5.1 percent.
Between FY 1998-1999 and FY 2005-2006, operating revenue from water service increased 454.3 percent, irrigation water sales increased 117.0 percent, and other decreased 69.4 percent. Total operating revenue increased 199.0 percent. Among operating expenses, source of supply increased 165.4 percent, administration and general increased 61.8 percent, other decreased 47.5 percent, and transmission and distribution decreased 30.0 percent. Total operating expenses increased 69.8 percent.
49 Interest expense increased because Arvin-Edison issued more than $10 million of long-term debt in 2005-2006. See California State Controller, 2008, Special Districts Annual Report, Sacramento, Table 14.
50 See Appendix B, Table B-1
51 See Appendix B, Table B-2

ENTRIX, Inc.
Table 11 Delano-Earlimart Irrigation District Financial Statement Review, FY 1998-1999
to FY 2005-2006
Average Annual Composition Percent Change FY 98-99 - FY
2005-06
Operating Revenues
Irrigation 58.9% 117.0%
Water Services 33.2% 454.3%
All Other 7.9% -69.4%
Total Operating Revenues 100.0% 199.0%
Operating Expenses
Source of Supply 76.5% 165.4%
Administration and General 12.2% 61.8%
Transmission and Distribution 6.2% -30.0%
All Other 5.1% -47.5%
Total Operating Expenses 100.0% 69.8%
Non-Operating Revenues
Interest Income 29.2% -29.6%
Property Assessments 49.5% -100.0%
All Other 21.3% 423.6%
Total Non-Operating Revenues 100.0% -82.3%
Non-Operating Expenses
Interest Expenses 90.7% 721.1%
All Other 9.3% -100.0%
Total Non-Operating Expenses 100.0% 284.2%
Over the eight years, the largest sources of non-operating revenue were property assessments, averaging 49.5 percent; interest, averaging 29.2 percent, and other, averaging 21.3 percent. The largest sources of non-operating expenses were interest, averaging 90.7 percent and other, averaging 9.3 percent.
Over the eight years, non-operating revenues from other increased 423.6 percent, property assessments decreased 100.0 percent, and interest decreased 29.6 percent. Total non-
ENTRIX, Inc.
operating revenues decreased 82.3 percent. Among non-operating expenses, interest increased 721.1 percent52 and other decreased 100.0 percent. Overall, total non-operating expenses increased 284.2 percent.
Chowchilla Water District
Chowchilla Water District (Chowchilla) is the sixth largest recipient of CVP water in the Valley and receives water from the Madera Canal. In 2007, its projected water delivery was 131,175 AF, accounting for 5.6 percent of total water for the Valley. Chowchilla did not carry any long-term debt nor does it owe the United States or California government for construction costs.53 The net capital cost allocated to Chowchilla irrigation contractors for CVP repayment was $23.7 million in 2008.54
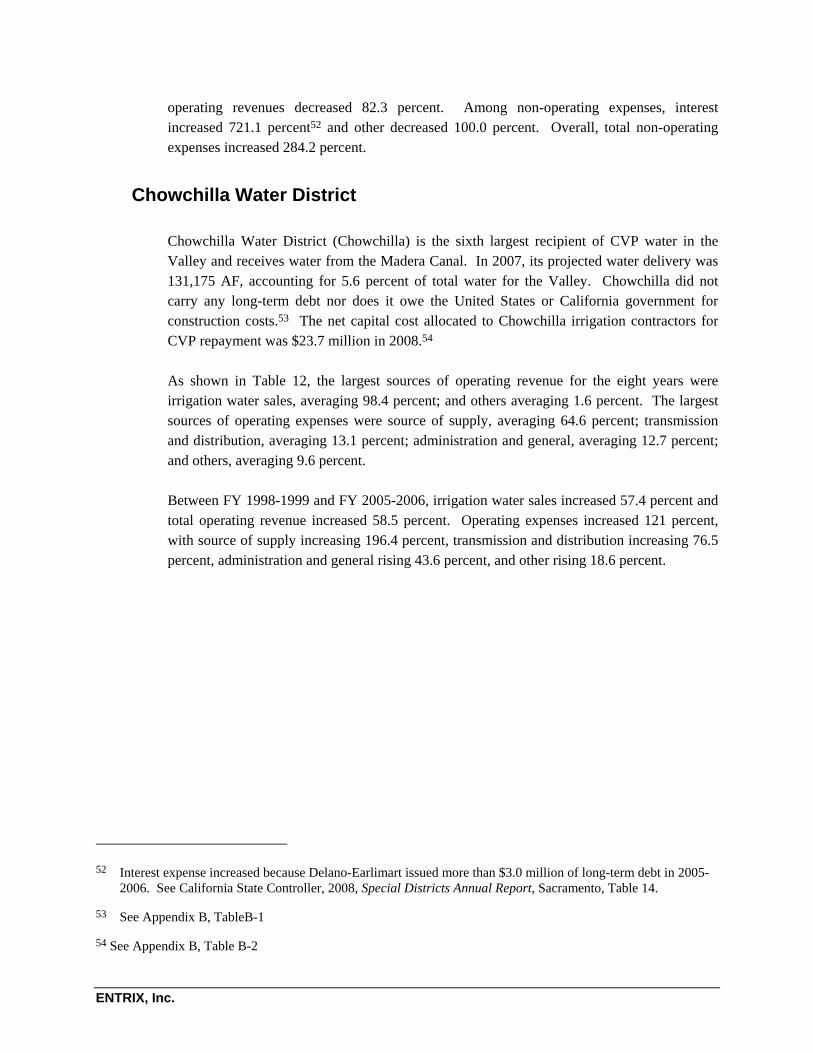
As shown in Table 12, the largest sources of operating revenue for the eight years were irrigation water sales, averaging 98.4 percent; and others averaging 1.6 percent. The largest sources of operating expenses were source of supply, averaging 64.6 percent; transmission and distribution, averaging 13.1 percent; administration and general, averaging 12.7 percent; and others, averaging 9.6 percent.
Between FY 1998-1999 and FY 2005-2006, irrigation water sales increased 57.4 percent and total operating revenue increased 58.5 percent. Operating expenses increased 121 percent, with source of supply increasing 196.4 percent, transmission and distribution increasing 76.5 percent, administration and general rising 43.6 percent, and other rising 18.6 percent.
52 Interest expense increased because Delano-Earlimart issued more than $3.0 million of long-term debt in 2005-2006. See California State Controller, 2008, Special Districts Annual Report, Sacramento, Table 14.
53 See Appendix B, TableB-1
54 See Appendix B, Table B-2

ENTRIX, Inc.
Table 12 Chowchilla Water District Financial Statement Review, FY 1998-1999 to FY
2005-2006
Average Annual Composition Percent Change FY 98-99 - FY
2005-06
Operating Revenues
Irrigation 98.4% 57.4%
All Other 1.6% 0.0%
Total Operating Revenues 100.0% 58.5%
Operating Expenses
Source of Supply 64.6% 196.4%
Administration and General 12.7% 43.6%
Transmission and Distribution 13.1% 76.5%
All Other 9.6% 18.6%
Total Operating Expenses 100.0% 121.0%
Non-Operating Revenues
Interest Income 8.7% -57.5%
Property Assessments 79.8% 65.6%
All Other 11.5% 204.1%
Total Non-Operating Revenues 100.0% 67.3%
Non-Operating Expenses
Interest Expenses 0.3% 0.0%
All Other 99.7% -100.0%
Total Non-Operating Expenses 100.0% -100.0%
Over the eight years, the largest sources of non-operating revenue were property assessments, averaging 65.6 percent; other, averaging 11.5 percent; and interest, averaging 8.7 percent. The largest sources of non-operating expenses were other, averaging 99.7 percent and interest, averaging 0.3 percent.
Non-operating revenue from other increased 204.1 percent, property assessments increased 65.6 percent, and interest income decreased 57.5 percent. Total non-operating revenues

ENTRIX, Inc.
increased 67.3 percent. Non-operating expenses from other decreased 100.0 percent. Total non-operating expenses decreased 100.0 percent.
Southern San Joaquin Municipal Utility District
Southern San Joaquin Municipal Utility District (S. San Joaquin) is the seventh largest recipient of CVP water in the Valley and receives water from the Friant-Kern Canal. In 2007, its projected water delivery was 111,315 AF, accounting for 4.8 percent of the total water for the Valley. S. San Joaquin carries no long-term debt, nor does it owe the United States or California government for construction costs.55 The net capital costs allocated to the district for CVP repayment was $26.8 million in 2008.56
As shown in Table 13, the largest average sources of operating revenue for the eight years were irrigation water sales, averaging 68.0 percent; and water services, averaging 32.0 percent. The largest sources of operating expenses were source of supply, averaging 63.8 percent; others, averaging 12.9 percent; pumping, averaging 12.7 percent; and administration and general, averaging 10.6 percent.
Over the eight years, operating revenue from irrigation water sales increased 47.7 percent and water services increased 37.1 percent. Total operating revenue increased 44.1 percent. Operating expenses for pumping increased 141.1 percent, source of supply increased 96.9 percent, administration and general increased 75.3 percent, and other increased 40.4 percent. Total operating expenses increased 80.6 percent.
55 See Appendix B, Table B-1
56 See Appendix B, Table B-2

ENTRIX, Inc.
Table 13 Southern San Joaquin Municipal Utility District Financial Statement Review, FY
1998-1999 to FY 2005-2006
Average Annual Composition Percent Change FY 98-99 - FY
2005-06
Operating Revenues
Irrigation 68.0% 47.7%
Water Services 32.0% 37.1%
Total Operating Revenues 100.0% 44.1%
Operating Expenses
Source of Supply 63.8% 96.9%
Pumping 12.7% 141.1%
Administration and General 10.6% 75.3%
All Other 12.9% 40.4%
Total Operating Expenses 100.0% 80.6%
Non-Operating Revenues
Interest Income 16.8% 46.6%
Current and Unsecured Debt (1%) 25.0% 76.9%
Property Assessments 5.2% 0%
All Other 53.0% 229.7%
Total Non-Operating Revenues 100.0% 183.7%
Non-Operating Expenses
All Other 100.0% -100.0%
Total Non-Operating Expenses 100.0% -100.0%
As shown in Table 13, the largest sources of non-operating revenue were other, averaging 53.0 percent; current and unsecured debt, averaging 25.0 percent; interest, averaging 16.8 percent; and property assessments, averaging 5.2 percent. The largest sources of non-operating expenses were others, averaging 100.0 percent.
Between FY 1998-1999 and FY 2005-2006, non-operating revenue from other increased 229.7 percent, current and unsecured debt increased 76.9 percent, and interest increased 46.6

ENTRIX, Inc.
percent. Overall, total non-operating revenues increased 183.7 percent. Overall, total non-operating expenses decreased 100.0 percent.
Tulare Irrigation District
Tulare Irrigation District (Tulare) is the eighth largest recipient of CVP water in the Valley and receives water from the Friant-Kern Canal. In 2007, its projected water delivery was 83,763 AF, accounting for 3.6 percent of total water for the Valley. Total outstanding long-term debt at the end of FY2005-2006 was $3.1 million, but Tulare does not owe the United States or California government for construction costs.57 The net capital cost allocated to the district for CVP repayment was $13.0 million in 2008.58
As shown in Table 14, the largest sources of operating revenue for the eight years were irrigation water sales, averaging 74.3 percent; water services, averaging 20.3 percent; and other averaging 5.4 percent. The largest sources of operating expenses were source of supply, averaging 38.3 percent; other, averaging 23.3 percent; administration and general, averaging 23.2 percent; and transmission and distribution, averaging 15.2 percent.
Between FY 1998-1999 and FY 2005-2006, operating revenue from water services increased 1,172.9 percent and irrigation water sales increased 198.5 percent. Overall, total operating revenue increased 303.6 percent. Administration and General operating expenses increased 227.2 percent, other increased 218.9 percent, source of supply increased 160.0 percent, and transmission and distribution decreased 28.0 percent. Overall, total operating expenses increased 136.1 percent.
57 See Appendix B, Table B-1
58 See Appendix B, Table B-2

ENTRIX, Inc.
Table 14 Tulare Irrigation District Financial Statement Review, FY 1998-1999 to FY 2005-
2006
Average Annual Composition Percent Change FY 98-99 - FY
2005-06
Operating Revenues
Irrigation 74.3% 198.5%
Water Services 20.3% 1,172.9%
All Other 5.4% 0%
Total Operating Revenues 100.0% 303.6%
Operating Expenses
Source of Supply 38.3% 160.0%
Administration and General 23.2% 227.2%
Transmission and Distribution 15.2% -28.0%
All Other 23.3% 218.9%
Total Operating Expenses 100.0% 136.1%
Non-Operating Revenues
Interest Income 26.1% -89.8%
Property Assessments 46.2% -4.7%
All Other 27.6% -75.1%
Total Non-Operating Revenues 100.0% 62.6%
Non-Operating Expenses
Interest Expense 31.8% -39.7%
All Other 68.2% -99.3%
Total Non-Operating Expenses 100.0% -31.1%
Over the eight years, the largest sources of non-operating revenue were from property assessments, averaging 46.2 percent; other, averaging 27.6 percent; and interest, averaging 26.1 percent. The largest sources of non-operating expenses were others, averaging 68.2 percent and interest, averaging 31.8 percent.
Between FY 1998-1999 and FY 2005-2006, non-operating interest income decreased 89.8 percent, other decreased 75.1 percent, and property assessments decreased 4.7 percent. Non-

ENTRIX, Inc.
operating expenses from other decreased 99.3 percent and interest decreased 39.7 percent. Overall, total non-operating expenses decreased 31.1 percent.
Del Puerto Water District
Del Puerto Water District (Del Puerto) is the ninth largest recipient of CVP water in the Valley and receives water from the Delta-Mendota Canal. In 2007, its projected water delivery was 82,712 AF, accounting for 3.5 percent of total water for the Valley. At the end of FY2005-2006, Del Puerto carried no long-term debt, but owes the United States or California government $3.5 million for construction costs.59 The net capital costs allocated to the district for CVP repayment was $26.9 million in 2008.60
As shown in Table 15, the largest sources of operating revenues were irrigation water sales, averaging 87.1 percent; and water services averaging 12.9 percent. The largest sources of operating expenses were source of supply, averaging 85.0 percent; administration and general, averaging 14.8 percent; and depreciation and amortization, averaging 0.2 percent.
Between FY 1998-1999 and FY 2005-2006, operating revenue from irrigation water sales increased 1.8 percent and water services decreased 0.7 percent. Overall, total operating revenue increased 1.5 percent. Among operating expenses, depreciation and amortization increased 480.1 percent, source of supply increased 59.6 percent, and administration and general increased 32.2 percent. Overall, total operating expenses increased 55.9 percent.
59 See Appendix B, Table B-1
60 See Appendix B, TableB-2

ENTRIX, Inc.
Table 15 Del Puerto Water District Financial Statement Review, FY 1998-1999 to FY
2005-2006
Average Annual Composition Percent Change FY 98-99 - FY
2005-06
Operating Revenues
Irrigation 87.1% 1.8%
Water Services 12.9% -0.7%
Total Operating Revenues 100.0% 1.5%
Operating Expenses
Source of Supply 85.0% 59.6%
Administration and General 14.8% 32.2%
Depreciation and Amortization 0.2% 480.1%
Total Operating Expenses 100.0% 55.9%
Non-Operating Revenues
Interest Income 83.8% 4.1%
All Other 16.2% 340.9%
Total Non-Operating Revenues 100.0% 38.3%
Non-Operating Expenses
Interest Expense 68.4% 22.7%
All Other 31.6% -100.0%
Total Non-Operating Expenses 100.0% -26.0%
Over the eight years, the largest sources of non-operating revenue were interest, averaging 83.8 percent; and other, averaging 16.2 percent. The largest sources of non-operating expenses were interest, averaging 68.4 percent; and other, averaging 31.6 percent.
Between FY 1998-1999 and FY 2005-2006, non-operating revenue from other increased 340.9 percent and interest increased 4.1 percent. Overall, total non-operating revenues increased 38.3 percent. Non-operating expenses from other decreased 100.0 percent and interest increased 22.7 percent. Overall, total non-operating expenses decreased 26.0 percent.

ENTRIX, Inc.
San Luis Water District
San Luis Water District (San Luis) is the tenth largest recipient of CVP water in the Valley and receives water from the Delta-Mendota and San Luis Canals. In 2007, its projected water delivery was 73,325 AF, accounting for 3.1 percent of the total water for the Valley. At the end of FY2005-2006, San Luis carried $5.7 million in long-term debt and owes the United States or California government $4.2 million for construction costs.61 The net capital cost allocated to the district for CVP repayment was over $46.4 million in 2008.62
As shown in Table 16, the largest sources of operating revenue for the district over the eight fiscal years were irrigation water sales, averaging 83.0 percent; water services, averaging 16.2 percent; and other, averaging 0.7 percent. The largest sources of operating expenses were source of supply, averaging 62.4 percent; administration and general, averaging 14.1 percent; transmission and distribution, averaging 12.2 percent; and other, averaging 11.3 percent.
Between FY 1998-1999 and FY 2005-2006, other operating revenue increased 190.9 percent, irrigation water sales increased 26.9 percent, and water services increased 9.3 percent. Overall, total operating revenue increased 64.1 percent. Among operating expenses, source of supply increased 41.8 percent, administration and general decreased 28.3 percent, transmission and distribution increased 22.0 percent; and other decreased 18.3 percent. Overall, total operating expenses increased 17.7 percent.
61 See Appendix B, Table B-1
62 See Appendix B, Table B-2

ENTRIX, Inc.
Table 16 San Luis Water District Financial Statement Review, FY 1998-1999 to FY 2005-
2006
Average Annual Composition Percent Change FY 98-99 - FY
2005-06
Operating Revenues
Irrigation 83.0% 26.9%
Water Services 16.2% 9.3%
Other 0.7% 190.9%
Total Operating Revenues 100.0% 64.1%
Operating Expenses
Source of Supply 62.4% 41.8%
Administration and General 14.1% -28.3%
Transmission and Distribution 12.2% 22.0%
Other 11.3% -18.3%
Total Operating Expenses 100.0% 17.7%
Non-Operating Revenues
Interest Income 24.2% 20.5%
Property Assessments 57.0% 2.3%
All Other 18.8% -98.9%
Total Non-Operating Revenues 100.0% -51.5%
Non-Operating Expenses
Interest Expense 70.3% -38.8%
All Other 29.7% -424.1%
Total Non-Operating Expenses 100.0% -7.8%
As shown in Table 16, the largest sources of non-operating revenue were from property assessments, averaging 57.0 percent; interest, averaging 24.2 percent; and other, averaging 18.8. The largest sources of non-operating expenses were interest, averaging 70.3 percent; and others, averaging 29.7 percent. Overall, total non-operating revenues decreased 51.5 percent.

ENTRIX, Inc.
Between FY 1998-1999 and FY 2005-2006, non-operating expenses from other decreased 424.1 percent and interest decreased 38.8 percent. Overall, total non-operating expenses decreased 7.8 percent.
Comparison of the Ten Contractors
Collectively, the 10 irrigation contractors shown in Table 17 received over 1.8 million AF of CVP water in 2007, representing 77.5 percent of CVP water for the Valley. The 1.8 million AF was 51.5 percent of all 2007 CVP water deliveries63. The three largest water contractors in the Valley were Westlands, Madera, and Lower Tule, receiving 701,000, 176,000, and 160,000 AF, respectively, of CVP water in 2007. The three contractors with the greatest CVP capital cost repayment obligations are Westlands, San Luis, and Madera owing $373.7, $46.4, and $33.8 million respectively.
Among the 10 contractors, all but two had negative operating incomes. The three contractors with the highest average operating income were San Luis, Del Puerto, and S. San Joaquin netting $3.9, $3.3, and $-1.4 million respectively. The three contractors with the lowest average operating income were Westlands, Arvin-Edison, and Tulare, netting $-23.8, $-20.2, and $-18.4 million respectively.
Of the 10 contractors, all had positive non-operating and net incomes. Contractors with the highest average non-operating incomes were Westlands, averaging $55.6 million; Arvin-Edison, averaging $36.3 million; and Tulare, averaging $34.6 million. Contractors with the lowest average non-operating incomes were Del Puerto, S. San Joaquin, and Delano-Earlimart, averaging $969,000, $7.2 million, and $9.3 million respectively. The highest average net incomes were for Westlands, San Luis, and Arvin-Edison, averaging $32.7, $19.5, and $16.2 million, respectively. The lowest average net incomes were for Madera, Chowchilla, and Lower Tule, averaging $13,500, $1.5 million, and $2.8 million respectively.
63 Water deliveries do not include water for the Delta-Mendota Exchange Contractors.
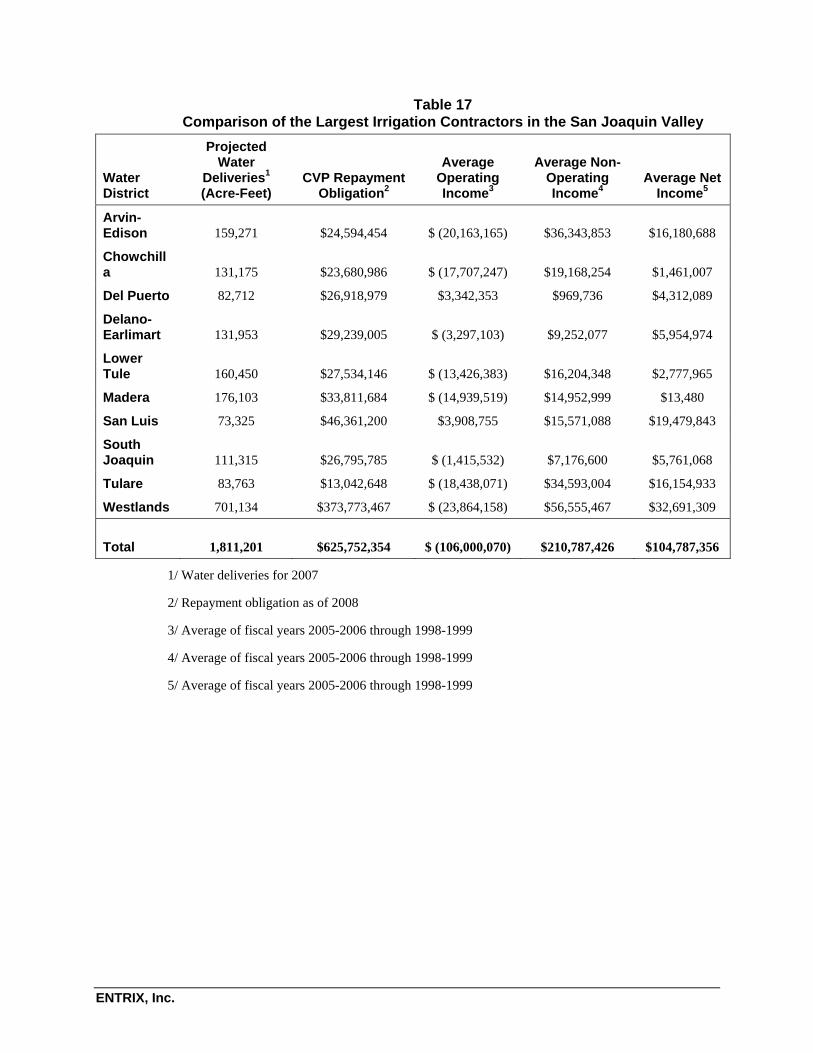
ENTRIX, Inc.
Table 17 Comparison of the Largest Irrigation Contractors in the San Joaquin Valley
Water District
Projected Water
Deliveries1 (Acre-Feet)
CVP Repayment Obligation2
Average Operating Income3
Average Non-Operating Income4
Average Net Income5
Arvin-Edison 159,271 $24,594,454 $ (20,163,165) $36,343,853 $16,180,688
Chowchilla 131,175 $23,680,986 $ (17,707,247) $19,168,254 $1,461,007
Del Puerto 82,712 $26,918,979 $3,342,353 $969,736 $4,312,089
Delano-Earlimart 131,953 $29,239,005 $ (3,297,103) $9,252,077 $5,954,974
Lower Tule 160,450 $27,534,146 $ (13,426,383) $16,204,348 $2,777,965
Madera 176,103 $33,811,684 $ (14,939,519) $14,952,999 $13,480
San Luis 73,325 $46,361,200 $3,908,755 $15,571,088 $19,479,843
South Joaquin 111,315 $26,795,785 $ (1,415,532) $7,176,600 $5,761,068
Tulare 83,763 $13,042,648 $ (18,438,071) $34,593,004 $16,154,933
Westlands 701,134 $373,773,467 $ (23,864,158) $56,555,467 $32,691,309
Total
1,811,201 $625,752,354 $ (106,000,070) $210,787,426 $104,787,356
1/ Water deliveries for 2007
2/ Repayment obligation as of 2008
3/ Average of fiscal years 2005-2006 through 1998-1999
4/ Average of fiscal years 2005-2006 through 1998-1999
5/ Average of fiscal years 2005-2006 through 1998-1999

ENTRIX, Inc.
CVP Power Generation and Distribution
CVP Hydropower Background
The River and Harbors Act of 1937 provided that the first function of the dams and reservoirs was flood control and improved navigation; the second for irrigation and domestic use; and the third for power generation. Initial features included Shasta, Keswick, Folsom, and Nimbus dams and power facilities. Under later reauthorizations and legislation for specific project additions, additional project purposes were added including recreation, fish and wildlife enhancement, and water quality improvements.
Power from the CVP is used first to meet the needs for project pumping or other irrigation needs and any power in excess of project use is offered for commercial sale. Initially, powerplants were installed at dams in order to provide electricity for construction activities. Following construction of those facilities, power was used for pumping water to higher elevations for agricultural and non-agricultural and other needs. Surplus power was provided to electrical distribution systems, which provided benefits to municipal, industrial, and agricultural users and which help pay for a large portion of the construction and operating costs of dams and associated facilities.
In 1955, Congress passed the Trinity River Division Act ("Trinity Act"), which authorized the construction of the Judge Francis Carr, Trinity, Lewiston, and Spring Creek power plants in Trinity County. The Act provided that the Trinity plants "shall be integrated and coordinated, from both a financial and an operational standpoint, with the operation of other features of the Central Valley project. ..." The Act also accorded preference customers in Trinity County a first preference to 25 percent of the "additional energy available from the Central Valley project system as a result of the construction of the plants herein authorized and their integration with that system ..." 64
In 1960, the San Luis (W.R. Gianelli)65 and O’Neill dam and power facilities were authorized and in 1962, Congress passed legislation authorizing the New Melones project. The New Melones Act also provided for integration of the New Melones plants with the CVP and
64 Trinity County Public Utilities District, et al, vs. John S. Harrington et al, January 23,1986, U.S. District Court of Appeals, Ninth Circuit, No 781 F.2d 163, http://bulk.resource.org/courts.gov/c/F2/781/781.F2d.163.85-1874.html (accessed July 25, 2008)
65 The State of California changed the name from San Luis to William R. Gianelli.

ENTRIX, Inc.
accorded customers in Tuolumne and Calaveras counties a first preference to power. Both the New Melones and Trinity Acts are administered in accordance with federal reclamation law.
In 1964, Congress authorized the Secretary of the Interior to import power from the Pacific Northwest for use in California through the Pacific Northwest-Pacific Southwest Intertie ("Intertie"). The federal government has been importing power from the Intertie into the CVP area since 1971.
The Department of Energy Organization Act of 1977, establishing DOE, transferred the power marketing functions of Reclamation, including the construction, operation, and maintenance of transmission lines, to the Western Area Power Administration (WAPA). The plant-in-service costs of CVP transmission lines were subsequently transferred to WAPA and no longer appear on CVP financial statement.66 Power beyond the needs of the CVP itself is sold through WAPA. WAPA owns and maintains about 900 miles of power lines which transmit power from federal dams to customers in 15 western states. The Sierra Nevada Region of WAPA markets about 1,480 MW of power form CVP and other sources.
Power Cost Allocations
CVP power plants have a combined maximum generating capacity of more than 2,000 megawatts (MW). CVP generation has averaged 4.6 billion kilowatt hours (kWh) per year since the early 1980s. At September 30, 2005, total net investment in Reclamation CVP power plants was $179 million.67
Costs allocated to power are first sub-allocated between project use and commercial power using factors derived from the long-term project power generation and project use power studies prepared by Reclamation with input from WAPA. Power costs are distributed between commercial use and project use proportionate to their respective historical and projected uses of CVP-generated power. Project use power is further distributed (sub-
66 United States Department of the Interior, Bureau of Reclamation, Mid-Pacific Regional Office “CVP Cost Allocation Study,” Chapter 3, Final Report, May 2001
67 The latest data available. See Western Area Power Administration, date (?), “2006 Annual Report, Discovering Solutions,” Lakewood Colorado. Completed plant $364,997,000 Accumulated depreciation ($206,247,000) Net completed plant $158,750,000 Construction work-in-progress $ 20,265,000 Net utility plant $179,015,000

ENTRIX, Inc.
allocated) among irrigation, M&I, and wildlife refuges proportionate to their respective historical and projected uses of CVP-generated power required to deliver water.68
Costs allocated to commercial uses are incorporated into the rates which WAPA charges preference power customers. Costs for project use power that is used to convey water to wildlife refuges are further sub-allocated among reimbursable and non-reimbursable functions based on cost sharing criteria included in the Central Valley Project Improvement Act (CVPIA). The distribution of reimbursable power costs for refuge water supply among project water and power users (M&I water, irrigation water, and commercial power contractors) is in proportion to the previous year’s costs allocated to the three reimbursable functions.
Facility Descriptions and Capacity
Table 18 includes information between fiscal year (FY) 1999 and FY 2005 for the 10 CVP power and pump plants in California.69 As shown, power generation during that period varied directly with water year type, although not consistently. In 1999, a wet water year, generation was 6,493 Gigawatt-hours (GWh). In dry years 2001 and 2002, generation was 35 percent lower. In “below normal” year 2004, generation was higher than in either of the contiguous “above normal” years. Generally, however, generation is expectedly higher in wetter than in drier years.
68 U.S. Department of the Interior, Bureau of Reclamation, Mid Pacific Region, Rate Setting Process, Cost Allocation http://www.usbr.gov/mp/cvpwaterrates/rate_process/cost_allocation.html (Accessed July 24, 2008)
69 Fiscal years are from October 1 through September 30. WAPA has completed an annual report for FY 2006, i.e. from October 1, 2005 through September 30, 2006. However, the latest detailed information available by power plant is in the WAPA Statistical Appendix for FY 2005.
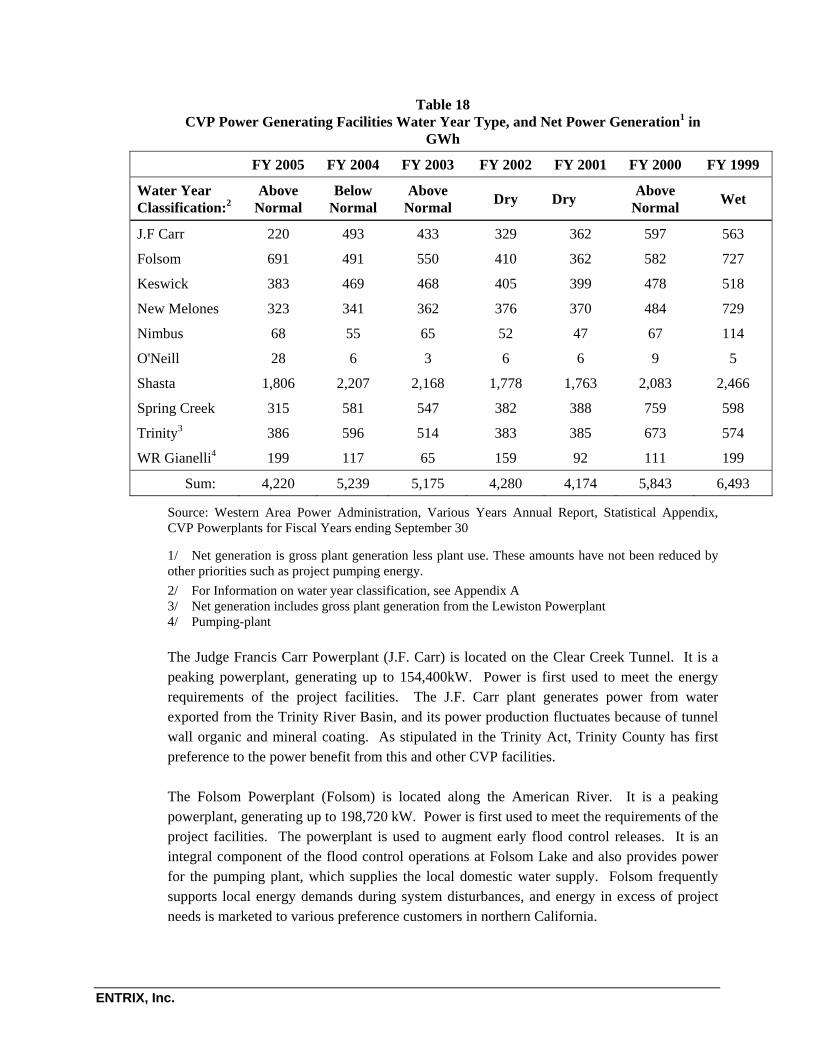
ENTRIX, Inc.
Table 18 CVP Power Generating Facilities Water Year Type, and Net Power Generation1 in
GWh
FY 2005 FY 2004 FY 2003 FY 2002 FY 2001 FY 2000 FY 1999
Water Year Classification:2
Above Normal
Below Normal
Above Normal Dry Dry Above
Normal Wet
J.F Carr 220 493 433 329 362 597 563
Folsom 691 491 550 410 362 582 727
Keswick 383 469 468 405 399 478 518
New Melones 323 341 362 376 370 484 729
Nimbus 68 55 65 52 47 67 114
O'Neill 28 6 3 6 6 9 5
Shasta 1,806 2,207 2,168 1,778 1,763 2,083 2,466
Spring Creek 315 581 547 382 388 759 598
Trinity3 386 596 514 383 385 673 574
WR Gianelli4 199 117 65 159 92 111 199
Sum: 4,220 5,239 5,175 4,280 4,174 5,843 6,493
Source: Western Area Power Administration, Various Years Annual Report, Statistical Appendix, CVP Powerplants for Fiscal Years ending September 30
1/ Net generation is gross plant generation less plant use. These amounts have not been reduced by other priorities such as project pumping energy. 2/ For Information on water year classification, see Appendix A 3/ Net generation includes gross plant generation from the Lewiston Powerplant 4/ Pumping-plant
The Judge Francis Carr Powerplant (J.F. Carr) is located on the Clear Creek Tunnel. It is a peaking powerplant, generating up to 154,400kW. Power is first used to meet the energy requirements of the project facilities. The J.F. Carr plant generates power from water exported from the Trinity River Basin, and its power production fluctuates because of tunnel wall organic and mineral coating. As stipulated in the Trinity Act, Trinity County has first preference to the power benefit from this and other CVP facilities.
The Folsom Powerplant (Folsom) is located along the American River. It is a peaking powerplant, generating up to 198,720 kW. Power is first used to meet the requirements of the project facilities. The powerplant is used to augment early flood control releases. It is an integral component of the flood control operations at Folsom Lake and also provides power for the pumping plant, which supplies the local domestic water supply. Folsom frequently supports local energy demands during system disturbances, and energy in excess of project needs is marketed to various preference customers in northern California.

ENTRIX, Inc.
The Keswick Powerplant (Keswick) is located along the Sacramento River and can generate up to 75,000 kW. Keswick is a run-of-the-river70 powerplant whose primary purpose is to serve project needs, with residual energy marketed to various preferred customers in Northern California. In addition to maintaining and regulating river flows, Keswick helps to supplement local energy demands during system disturbances.
The New Melones Powerplant (New Melones) is located along the Stanislaus River and can generate up to 300,000 kW. It is a peaking powerplant dedicated to meeting the requirements of the project facilities. The remaining energy is marketed to various preferred customers in Northern California. Primary reservoir releases are made through the powerplant.
The Nimbus Powerplant (Nimbus) is located along the American River and is a run-of-the-river powerplant that can generate up to 13,500 kW. It maintains and regulates river releases and provides the Folsom Powerplant station service backup.
The O’Neill Pump-Generating Plant (O’Neill) is located along the San Luis Creek and can generate up to 25,200 kW. Its primary purpose is to pump CVP water for off-stream storage, moving water from the Delta-Mendota Canal to O’Neill Forebay and offsetting CVP pumping demands with generating releases to Delta-Mendota Canal. It operates primarily as a pumping plant and only generates power part of the year. Its authorizing legislation states that power generated at the facilities cannot be used for commercial purposes. Therefore, the energy produced there is allocated as project-use power and associated costs are allocated to the irrigation component of the CVP
The William R. Gianelli/San Luis71 Pump-Generating Plant (Gianelli) is located along the San Luis Creek and can generate up to 424,000 kW. It is a joint Federal-State facility whose primary purpose is to pump CVP water for off-stream storage. Under agreement, this facility is operated and maintained by the State of California. The Gianelli plant pumps water from O’Neill to San Luis Reservoir and also offsets CVP pumping loads with generation releases to O’Neill Forebay.
The Shasta Powerplant (Shasta) is located along the Sacramento River and can generate up to 663,000 kW. It is a peaking powerplant that is dedicated to first meeting the requirements of the project facilities. The remaining energy is marketed to preferred customers in Northern California. Through the mid 1990s, concerns with downstream temperatures resulted in the bypasses of outflows around the powerplant and an estimated loss of about 2,000,000 MWh.
70 A type of hydroelectric generation whereby the natural flow and elevation drop of a river are used to generate electricity.
71 The State of California changed the name from San Luis to William R. Gianelli.
ENTRIX, Inc.
The problem was alleviated with the installation of a temperature control device at Shasta Dam in 1997. Shasta also provides water supply for a downstream hatchery.
The Spring Creek Powerplant (Spring Creek) is located along Spring Creek and can generate up to 180,000 kW. It is a peaking plant, and Trinity County has first preference to the power benefits of the CVP. Water from Spring Creek is discharged into the Keswick Reservoir, and operations are tied to flow regimes aimed at minimizing the concentration of metals in the Spring Creek arm of the Keswick Reservoir.
The Trinity Powerplant (Trinity) is located along the Trinity River and can generate up to 140,000 kW. It is peaking plant, and the primary reservoir releases are made through the powerplant. Trinity County has first preference to the power benefit to the CVP from Trinity.
The Lewiston Powerplant (Lewiston) is located along the Trinity River. It is operated in conjunction with the spillway gates to maintain the minimum flow in the Trinity River downstream. Its capacity is 350 kW, and its turbines are usually set at maximum output with the spillway gates adjusted to regulate river flow. The turbine capacity is exceeded by the Trinity River minimum flow. Available options to increase capacity are not economical at the current price of power. Lewiston provides power to the adjacent fish hatchery and energy in excess of hatchery needs is sold to PG&E at 15 mills/kWh.72 73
Powerplant Revenue and Expenditures
Table 19 shows aggregate revenues and expenditures from CVP hydropower operations from FY 1999 through FY 2005. In FY 1999, net operating income was $5.7 million and net income after interest expenses was $4.9 million. Accumulated net revenues through FY 1999 exceeded $ 35.8 million. In FY 2005, net operating income was $43.8 million and net income after interest expenses was $41.7 million. Accumulated net revenues through FY 2005 revenues exceeded $134.6 million.
72 U.S. Department of the Interior, Bureau of Reclamation, Mid Pacific Region website, Dataweb, Powerplants. http://www.usbr.gov/dataweb/powerplants/index.html (Accessed July 24, 2008)
73 Conversion Table in Appendix C, table C-.2

ENTRIX, Inc.
Table 19 Reclamation’s CVP Hydropower Statement of Revenues and Expenses (in thousand’s)
FY 2005 FY 2004 FY 2003 FY 2002 FY 2001 FY 2000 FY 1999
Operating Revenues
Sales of electric power - - - - - - -
Other operating income $ 166 $ 44 $ (121) $ (346) $ (3) $ (28) $ 11
Gross operating revenues $ 166 $ 44
$ (121) $ (346) $ (3) $ (28) $ 11
Income transfers, net $ 81,808 $ 78,587 $ 51,392 $ 52,445 $ 42,675 $ 31,205 $ 27,486
Total Operating Revenues $ 81,974 $ 78,631 $ 51,271 $ 52,099 $ 42,672 $ 31,177 $ 27,497
Operating Expenses
Operation and maintenance $ 32,984 $ 28,144 $ 31,582 $ 31,059 $ 25,160 $ 45,744 $ 16,664
Administration and general - - - - $ 21 - $ 7
Purchased power - - - - - - -
Purchased transmission services - - - - - - -
Depreciation $ 5,231 $ 4,564 $ 4,518 $ 4,501 $ (609) $ 5,769 $ 5,103
Total Operating Expenses $ 38,215 $ 32,708 $ 36,100 $ 35,560 $ 24,572 $ 51,513 $ 21,774
Net Operating Income $ 43,759 $ 45,923 $ 15,171 $ 16,539 $ 18,100 $ (20,336) $ 5,723
Interest Expenses
Interest on Federal investment $ 2,145 $ 3,449 $ 4,076 $ 4,625 $ (753) $ 14,072 $ 3,757
Interest on non-federally financed funding - - - - - - -
Allowance for funds used during construction $ (60) $ (671) $ (612) $ (647) $ 4,895 $ (10,100) $ (2,965)
Net interest Expenses $ 2,085 $ 2,778 $ 3,464 $ 3,978 $ 4,142 $ 3,972 $ 792
Net Income $ 41,674 $ 43,145 $ 11,707 $ 12,561 $ 13,958 $ 24,308 $ 4,931
Accumulated net revenues:
Balance at beginning of year $ 92,887 $ 49,742 $ 38,034 $ 25,474 $ 11,516 $ 35,824 $ 30,893
Balance at end of year $ 134,561 $ 92,887 $ 49,742 $ 38,035 $ 25,474 $ 11,516 $ 35,824
Source: Western Area Power Administration, Various Years, Annual Report, Statistical Appendix CVP Statement of Revenues and Expenses, and Accumulated Revenues for Years Ending September 30 (in thousands),

ENTRIX, Inc. 50
Power Plant Repayment
Table 20 contains information on repayment of CVP investment in hydropower facilities over time. At the end of FY 1999, Reclamation had been repaid $363.2 million, representing 65.02 percent of its total investment, and had a remaining unpaid balance of $261.1 million dollars. At the end of FY 2005, Reclamation had been repaid $444.2 million, representing 78.5 percent of its total reinvestment, and had a remaining unpaid balance of $204.9 million.
Table 20 Reclamation’s CVP Hydropower Status of Repayment (in thousand’s)
Cumulative
1999 Cumulativ
e 2000 Cumulativ
e 2001 Cumulative
2002 Cumulativ
e 2003 Cumulativ
e 2004 Cumulativ
e 2005
Total Operating Revenues 4,415,829 4,620,262 4,851,101 5,085,197 5,313,034 5,565,077 5,836,038
Total Expenses
4,052,675 4,255,154 4,498,083 4,711,290 4,912,547 5,126,298 5,391,840
Total Investment1
624,220 624,220 624,220 624,220 636,539 639,094 649,081
Total Investment Repaid2
363,154 365,108 365,108 373,907 400,487 438,780 444,198
Total Investment Unpaid
261,066 259,112 259,112 250,313 236,052 200,314 204,883
Percent of federal investment repaid to date
65.02% 65.37% 65.37% 66.95% 71.71% 78.6% 78.5%
Source: Western Area Power Administration, Various Years Annual Report, Statistical Appendix, CVP Status of Repayment, Cumulative Activities for Years Ending September 30 (in thousands).
1/ Includes federally-financed power and non-power investment.
2/ Federal investment repaid.
ENTRIX, Inc. 51
Summary
The repayment of federal capital investment for the CVP is the responsibility of the 250 water contractors that use the San Joaquin and Sacramento Valley water resource. Prior to 1986, deficits in O&M costs accumulated for contractors due to the non-adjustable rate on the 40-year long term contracts. However, the adoption of Public Law 99-546 rectified the deficit situation by allowing COS rates to be adjusted on an annual basis. Currently, each contractor must recover all costs associated with CVP water delivery; including, allocated annual O&M, capital and deficit costs over the 50-year repayment period.
Of the total $1.3 billion in reimbursable CVP project capital costs, the San Joaquin Valley accounts for $993.2 million or 77 percent of the total. The Sacramento Valley capital responsibilities are $292.1 million and are approximately 23 percent of the CVP total. As of September 2006, San Joaquin irrigation contractors have repaid $184.7 million of project capital costs, while M&I contractors have repaid $10.1 million for a total of 19.6 percent of San Joaquin Valley total capital repayment obligations. Similarly, as of September 2006, Sacramento Valley irrigation contractors have repaid $14.1 million of project capital costs and M&I contractors have repaid $67.6 million and account for 28.0 percent of the Sacramento Valley capital repayment obligation.
The top ten San Joaquin Valley irrigation contractors received over 1.8 million AF of CVP water in 2007, representing 77.3 percent of CVP water for the valley. Out of these top ten irrigation contractors, the three largest water users are Westlands, Madera, and Lower Tule and accounted for 701,000, 176,000 and 160,000 AF of CVP water in 2007, respectively. Out of the ten contractors all but two had negative average operating incomes. However, all ten had positive average non-operating and average net incomes. The lowest average net income for the top ten irrigation contractors was Madera with an average net income of $13,500, while Westlands had the highest average net income of $32.7 million. As of 2008, the CVP repayment obligations of these top ten irrigation contractors amount to $625.8 million.
The 10 CVP power and pump plants have produced between 4,174 and 6,493 GWh annually over the FY 1999 to FY 2005 period. In FY 2005, net operating income from hydropower operations was $43.8 million and net income after interest expense was $41.7 million. By the end of FY 2005 accumulated net revenues for CVP hydropower operations was approximately $134.6 million. By the end of FY 2005, hydropower operations had repaid $444.2 million and had a remaining unpaid balance of $204.9 million of the total Reclamation investment.

ENTRIX, Inc. 52
Appendix
Appendix A
San Joaquin Valley Capital Repayment Responsibilities by Contractor
Table A-1 San Joaquin Valley Capital Repayment Responsibility by Individual Irrigation Contractor
Allocated Capital Cost
Repayment as of 9/30/06
(Schedule A-6A)
Cumulative Capital Relief
(Schedule A-2B1) Net Capital Cost Buchanan Unit
Chowchilla WD -BU $ 3,238,900 $ 1,256,620 $ 1,982,280
Cross Valley Canal
County of Fresno $ 250,181 $ 42,218 $ 207,963

ENTRIX, Inc. 53
County of Tulare $ 385,739 $ 68,330 $ 317,409
Hills Valley ID $ 288,941 $ 102,106 $ 186,835
Kern-Tulare ID $ 3,787,866 $ 806,247 $ 2,981,619
Lower Tule River ID -CVC $ 3,077,498 $ 785,392 $ 2,292,106
Pixley ID $ 3,104,627 $ 746,839 $ 2,357,788
Rag Gulch WD $ 1,258,333 $ 268,750 $ 989,583
Tri-Valley ID $ 103,473 $ 22,067 $ 81,406
Total Cross Valley Canal $ 12,256,658 $ 2,841,949 $ - $ 9,414,709
Delta-Mendota Canal
Banta-Carbona ID $ 4,281,684 $ 1,151,229 $ 3,130,455
Broadview WD
Byron Bethany ID $ 4,609,119 $ 766,573 $ 3,842,546
Del Puerto WD $ 33,039,984 $ 6,121,005 $ 26,918,979
Eagle Field WD $ 1,093,615 $ 299,845 $ 793,769
Mercy Springs WD $ 633,888 $ 151,650 $ 482,238
Oro Loma WD $ 1,090,150 $ 280,959 $ 809,191
Pacheco WD -DMC $ 394,360 $ 75,573 $ 318,787
Panoche WD -DMC $ 6,405,289 $ 697,929 $ 5,707,360
Patterson WD $ 3,762,280 $ 295,336 $ 3,466,944
San Luis WD -DMC $ 6,307,078 $ 1,080,310 $ 5,226,768
West Side ID $ 1,193,735 $ 416,204 $ 777,531
West Stanislaus ID $ 12,017,736 $ 2,306,751 $ 9,710,985

ENTRIX, Inc. 54
Total Delta-Mendota Canal $ 74,828,918 $ 13,643,364 $ - $ 61,185,553
Delta Mendota Pool
Coelho Trust $ 728,756 $ 11,416 $ 717,340
Fresno Slough WD $ 971,412 $ 88,890 $ 882,522
James ID $ 8,470,286 $ 947,665 $ 7,522,621
Laguna WD $ 191,920 $ 71,190 $ 120,730
Recl Dist #1606 $ 48,988 $ 6,066 $ 42,922
Tranquility ID $ 3,143,559 $ 183,133 $ 2,960,426
Tranquility PUD $ 16,327 $ 593 $ 15,734
Westlands WD -DMP $ 4,609,516 $ 1,686,386 $ 2,923,130
Total Delta Mendota Pool $ 18,180,764 $ 2,995,339 $ - $ 15,185,425
Friant Dam
Friant Dam -Class 2
Gravelly Ford WD $ 65,595 $ 129,742 $ (64,147)
Friant-Kern Canal -Class 1
Arvin-Edison WSD $ 14,174,433 $ 3,753,515 $ 10,420,918
Delano-Earlimart ID $ 36,228,237 $ 10,352,790 $ 25,875,446
Exeter ID $ 3,839,832 $ 1,098,102 $ 2,741,730
Garfield WD $ 1,182,898 $ 118,783 $ 1,064,116
International WD $ 403,209 $ 105,007 $ 298,202

ENTRIX, Inc. 55
Ivanhoe ID $ 2,591,727 $ 736,196 $ 1,855,531
Lewis Creek WD $ 466,423 $ 80,248 $ 386,175
Lindmore ID $ 11,076,943 $ 3,208,061 $ 7,868,882
Lindsay-Strathmore ID $ 9,315,410 $ 2,465,204 $ 6,850,206
Lower Tule River ID -FKC $ 20,567,272 $ 5,862,316 $ 14,704,956
Orange Cove ID $ 13,004,875 $ 3,574,120 $ 9,430,755
Porterville ID $ 5,455,089 $ 1,352,368 $ 4,102,721
Saucelito ID $ 7,255,995 $ 2,085,972 $ 5,170,023
Shafter-Wasco ID $ 16,590,686 $ 3,321,036 $ 13,269,650
So San Joaquin MUD $ 32,739,643 $ 8,417,487 $ 24,322,156
Stone Corral ID $ 3,309,569 $ 909,422 $ 2,400,147
Tea Pot Dome WD $ 2,541,061 $ 669,258 $ 1,871,802
Terra Bella ID $ 9,426,193 $ 2,682,923 $ 6,743,270
Tulare ID $ 10,284,671 $ 3,293,459 $ 6,991,213
Total Friant-Kern Canal -Class 1 $ 200,454,166 $ 54,086,267 $ - $ 146,367,899
Friant-Kern Canal -Class 2
Arvin-Edison WSD $ 18,687,879 $ 4,514,343 $ 14,173,536
Delano-Earlimart ID $ 4,610,213 $ 1,246,654 $ 3,363,559
Exeter ID $ 1,037,676 $ 222,991 $ 814,685
Fresno ID $ 4,042,684 $ 126,663 $ 3,916,021
Ivanhoe ID $ 467,568 $ 110,471 $ 357,097
Lindmore ID $ 1,291,791 $ 267,645 $ 1,024,146
Lower Tule River ID -FKC $ 14,688,289 $ 4,151,205 $ 10,537,084

ENTRIX, Inc. 56
Porterville ID $ 1,781,075 $ 273,947 $ 1,507,128
Saucelito ID $ 2,014,420 $ 551,234 $ 1,463,186
Shafter-Wasco ID $ 2,423,801 $ 486,381 $ 1,937,420
So San Joaquin MUD $ 2,884,502 $ 410,873 $ 2,473,629
Tulare ID $ 8,608,694 $ 2,557,259 $ 6,051,435
Total Friant-Kern Canal -Class 2 $ 62,538,592 $ 14,919,666 $ - $ 47,618,926
Hidden Unit
Madera ID -HI $ 3,725,653 $ 1,101,220 $ 2,624,433
Madera Canal
Madera Canal -Class 1
Chowchilla WD -MC $ 18,402,939 $ 4,438,700 $ 13,964,239
Madera ID -MC $ 28,011,134 $ 6,195,976 $ 21,815,158
Total Madera Canal -Class 1 $ 46,414,073 $ 10,634,676 $ - $ 35,779,397
Madera Canal -Class 2
Chowchilla WD -MC $ 9,377,164 $ 1,642,697 $ 7,734,467
Madera ID -MC $ 10,649,932 $ 1,277,839 $ 9,372,093
Total Madera Canal -Class 2 $ 20,027,096 $ 2,920,536 $ - $ 17,106,560
New Melones D&R
Central San Joaquin WCD $ 3,368,356 $ 477,664 $ 669,650 $ 2,221,042
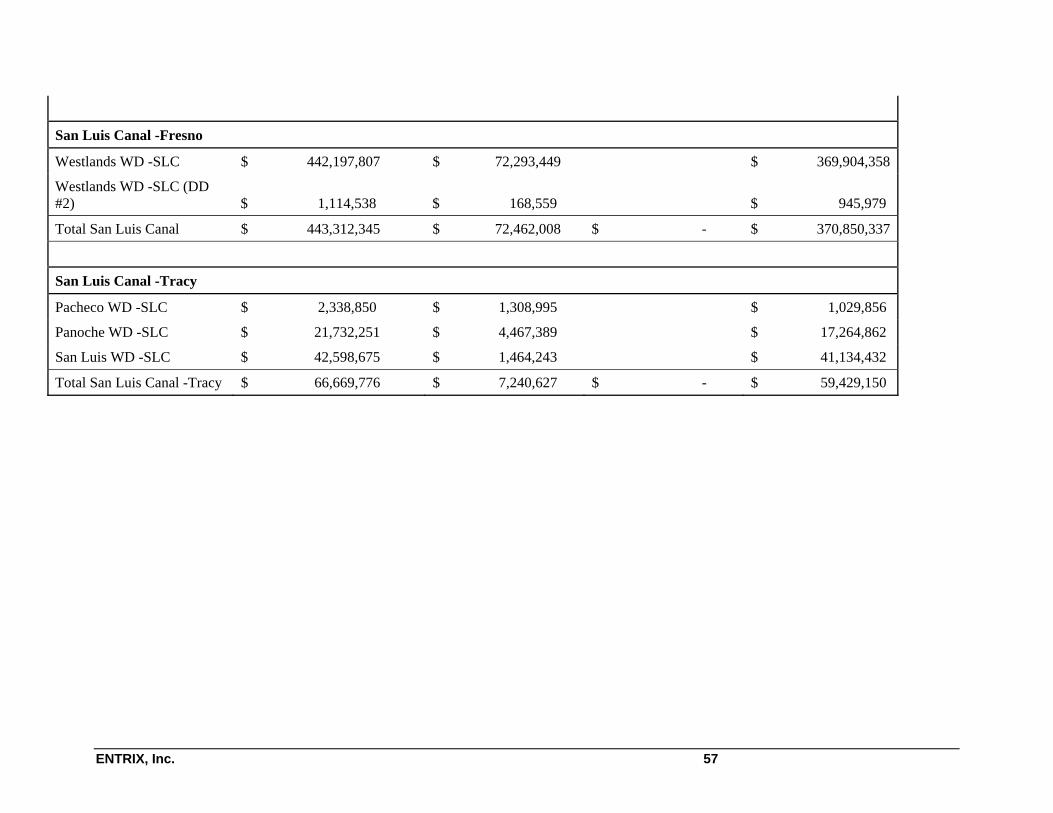
ENTRIX, Inc. 57
San Luis Canal -Fresno
Westlands WD -SLC $ 442,197,807 $ 72,293,449 $ 369,904,358
Westlands WD -SLC (DD #2) $ 1,114,538 $ 168,559 $ 945,979
Total San Luis Canal $ 443,312,345 $ 72,462,008 $ - $ 370,850,337
San Luis Canal -Tracy
Pacheco WD -SLC $ 2,338,850 $ 1,308,995 $ 1,029,856
Panoche WD -SLC $ 21,732,251 $ 4,467,389 $ 17,264,862
San Luis WD -SLC $ 42,598,675 $ 1,464,243 $ 41,134,432
Total San Luis Canal -Tracy $ 66,669,776 $ 7,240,627 $ - $ 59,429,150

ENTRIX, Inc. 58
Table A-2 San Joaquin Valley Capital Repayment Responsibility by Individual M&I Contractor
Allocated Capital Cost
Repayment as of 9/30/06
(Schedule A-6A)
Cumulative Capital Relief
(Schedule A-2B1) Net Capital Cost Cross Valley Canal County of Fresno $ 24,771 $ 26,222 $ (1,451)
County of Tulare $ 68,352 $ 28,361 $ 39,991
Total Cross Valley Canal $ 94,932 $ 54,583 $ 38,540
Delta-Mendota Canal
Byron Bethany ID $ 259,625 $ 159,040 $ 100,585
City of Tracy $ 5,455,420 $ 2,663,970 $ 2,791,450
Del Puerto WD $ 5,907 $ 3,964 $ 1,943
Department of VA $ 144,980 $ 491 $ 144,489
Panoche WD $ 11,752 $ 8,676 $ 3,076
San Luis WD $ 59,900 $ 91,607 $ (31,707)
Total Delta-Mendota Canal $ 5,937,584 $ 2,927,748 $ - $ 3,009,836
Friant Dam
County of Madera $ 28,655 $ 17,304 $ 11,351
Fresno County WW#18 $ 27,862 $ 64,455 $ (36,593)
Total Friant Dam $ 56,517 $ 81,759 $ - $
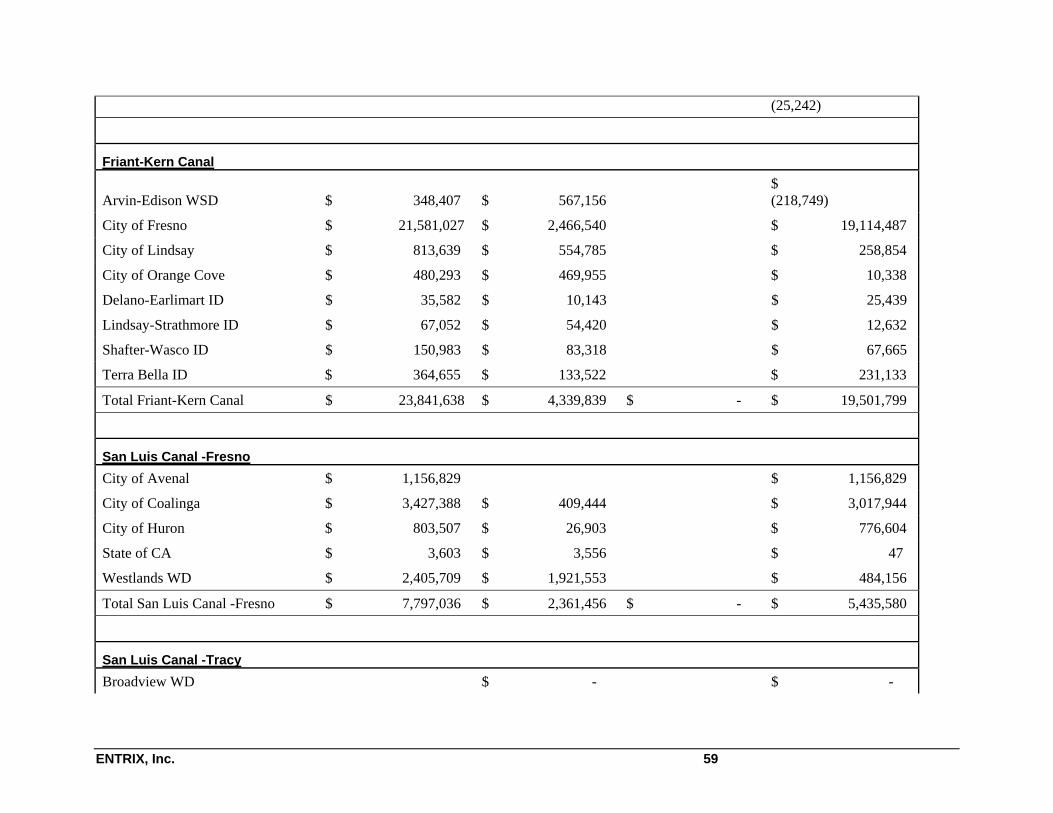
ENTRIX, Inc. 59
(25,242)
Friant-Kern Canal
Arvin-Edison WSD $ 348,407 $ 567,156 $ (218,749)
City of Fresno $ 21,581,027 $ 2,466,540 $ 19,114,487
City of Lindsay $ 813,639 $ 554,785 $ 258,854
City of Orange Cove $ 480,293 $ 469,955 $ 10,338
Delano-Earlimart ID $ 35,582 $ 10,143 $ 25,439
Lindsay-Strathmore ID $ 67,052 $ 54,420 $ 12,632
Shafter-Wasco ID $ 150,983 $ 83,318 $ 67,665
Terra Bella ID $ 364,655 $ 133,522 $ 231,133
Total Friant-Kern Canal $ 23,841,638 $ 4,339,839 $ - $ 19,501,799
San Luis Canal -Fresno
City of Avenal $ 1,156,829 $ 1,156,829
City of Coalinga $ 3,427,388 $ 409,444 $ 3,017,944
City of Huron $ 803,507 $ 26,903 $ 776,604
State of CA $ 3,603 $ 3,556 $ 47
Westlands WD $ 2,405,709 $ 1,921,553 $ 484,156
Total San Luis Canal -Fresno $ 7,797,036 $ 2,361,456 $ - $ 5,435,580
San Luis Canal -Tracy
Broadview WD $ - $ -

ENTRIX, Inc. 60
Pacheco WD -SLC $ 18,835 $ 2,602 $ 16,233
Panoche WD -SLC $ 17,943 $ 12,237 $ 5,706
San Luis WD -SLC $ 378,604 $ 354,746 $ 23,858
Total San Luis Canal -Tracy $ 415,382 $ 369,585 $ - $ 45,797
San Luis Canal -Fresno
City of Avenal $ 1,156,829 $ 1,156,829
City of Coalinga $ 3,427,388 $ 409,444 $ 3,017,944
City of Huron $ 803,507 $ 26,903 $ 776,604
State of CA $ 3,603 $ 3,556 $ 47
Westlands WD $ 2,405,709 $ 1,921,553 $ 484,156
Total San Luis Canal -Fresno $ 7,797,036 $ 2,361,456 $ - $ 5,435,580
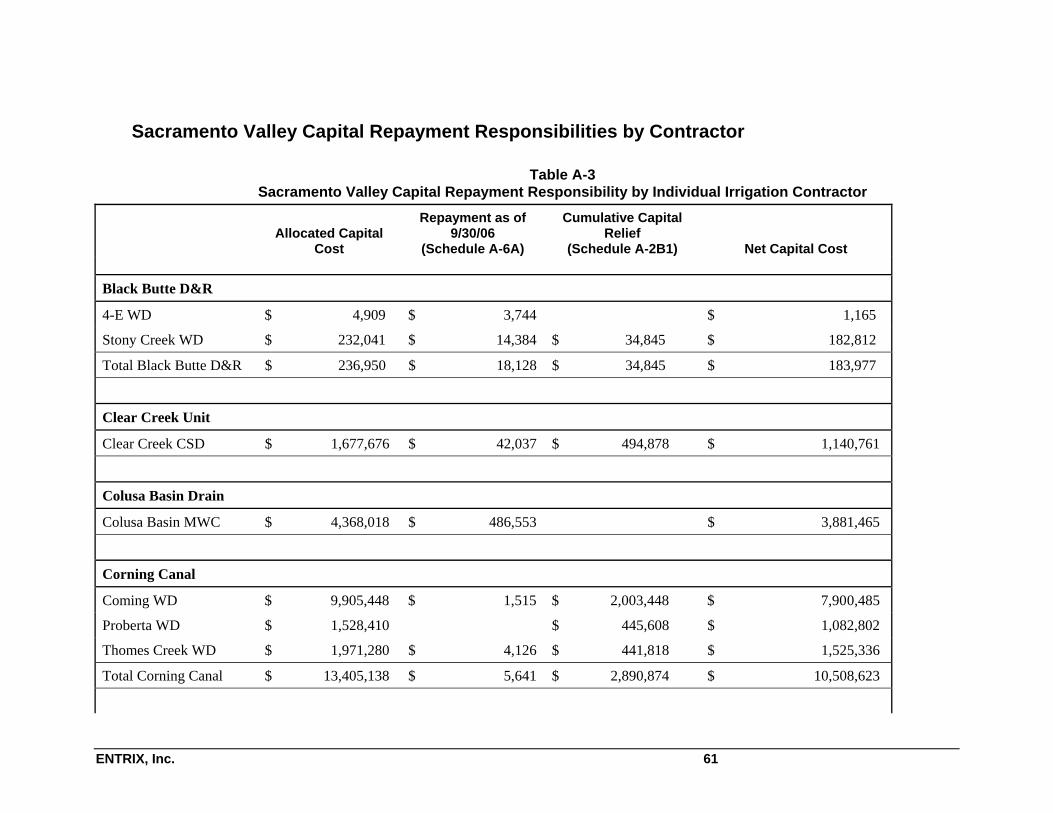
ENTRIX, Inc. 61
Sacramento Valley Capital Repayment Responsibilities by Contractor
Table A-3 Sacramento Valley Capital Repayment Responsibility by Individual Irrigation Contractor
Allocated Capital
Cost
Repayment as of 9/30/06
(Schedule A-6A)
Cumulative Capital Relief
(Schedule A-2B1) Net Capital Cost
Black Butte D&R
4-E WD $ 4,909 $ 3,744 $ 1,165
Stony Creek WD $ 232,041 $ 14,384 $ 34,845 $ 182,812
Total Black Butte D&R $ 236,950 $ 18,128 $ 34,845 $ 183,977
Clear Creek Unit
Clear Creek CSD $ 1,677,676 $ 42,037 $ 494,878 $ 1,140,761
Colusa Basin Drain
Colusa Basin MWC $ 4,368,018 $ 486,553 $ 3,881,465
Corning Canal
Coming WD $ 9,905,448 $ 1,515 $ 2,003,448 $ 7,900,485
Proberta WD $ 1,528,410 $ 445,608 $ 1,082,802
Thomes Creek WD $ 1,971,280 $ 4,126 $ 441,818 $ 1,525,336
Total Corning Canal $ 13,405,138 $ 5,641 $ 2,890,874 $ 10,508,623
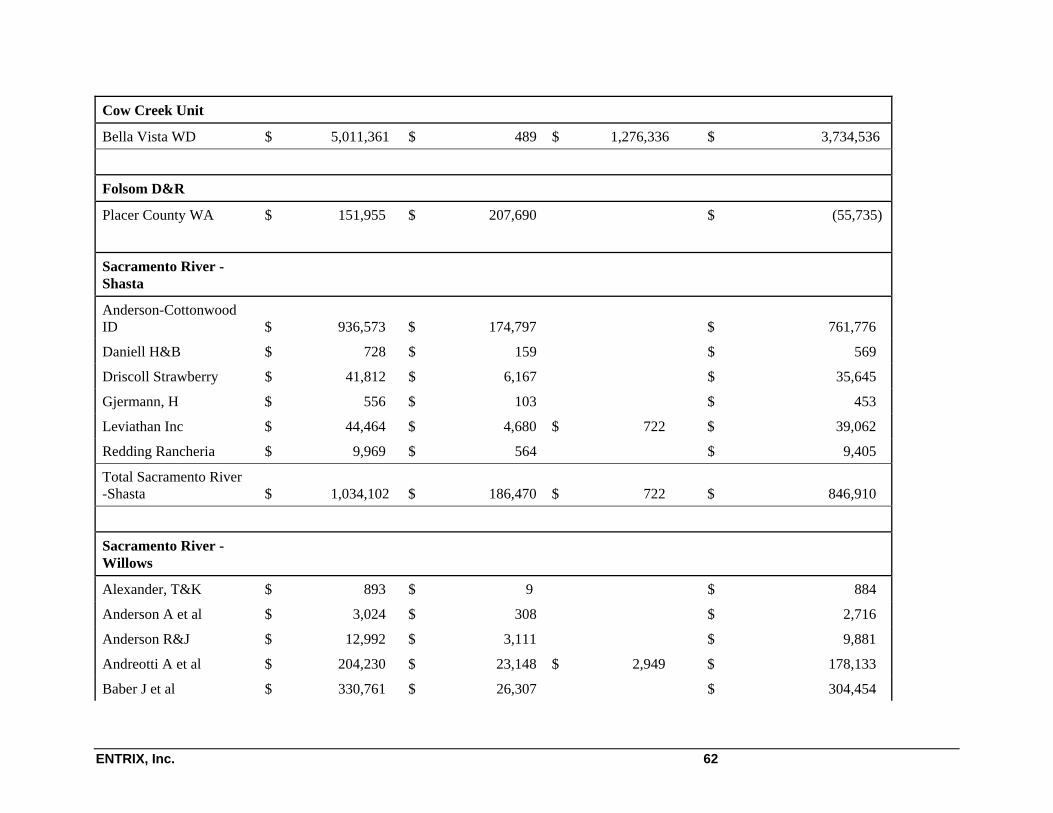
ENTRIX, Inc. 62
Cow Creek Unit
Bella Vista WD $ 5,011,361 $ 489 $ 1,276,336 $ 3,734,536
Folsom D&R
Placer County WA $ 151,955 $ 207,690 $ (55,735)
Sacramento River -Shasta
Anderson-Cottonwood ID $ 936,573 $ 174,797 $ 761,776
Daniell H&B $ 728 $ 159 $ 569
Driscoll Strawberry $ 41,812 $ 6,167 $ 35,645
Gjermann, H $ 556 $ 103 $ 453
Leviathan Inc $ 44,464 $ 4,680 $ 722 $ 39,062
Redding Rancheria $ 9,969 $ 564 $ 9,405
Total Sacramento River -Shasta $ 1,034,102 $ 186,470 $ 722 $ 846,910
Sacramento River -Willows
Alexander, T&K $ 893 $ 9 $ 884
Anderson A et al $ 3,024 $ 308 $ 2,716
Anderson R&J $ 12,992 $ 3,111 $ 9,881
Andreotti A et al $ 204,230 $ 23,148 $ 2,949 $ 178,133
Baber J et al $ 330,761 $ 26,307 $ 304,454

ENTRIX, Inc. 63
Beckley R&O $ 13,700 $ 2,994 $ 10,706
Butler L&M $ 33,760 $ 7,089 $ 1,322 $ 25,349
Butte Creek Farms Inc $ 42,760 $ 5,216 $ 37,544
Cachil Dehe Band of Wintun $ 12,392 $ 4,872 $ 7,520
Carter MWC $ 88,492 $ 26,999 $ 61,493
Churkin M Jr &C $ 4,734 $ 981 $ 3,753
Conaway Consv Grp $ 87,912 $ 9,977 $ 77,935
County of Sacramento $ 21,942 $ 3,633 $ 18,309
Cummings, W $ 12,824 $ 2,725 $ 10,099
Dennis Wilson Farms $ 11,114 $ 1,433 $ 9,681
Driver, Gary et al $ 1,949 $ 861 $ 1,088
Driver, J&C Trustees $ 8,871 $ 1,457 $ 7,414
Driver, Gregory $ 1,130 $ 329 $ 801
Driver, W et al $ 8,559 $ 2,495 $ 6,064
… … … … …
Total Sacramento Willows $ 46,250,542 $ 8,111,248 $ 597,063 $ 37,542,231
San Felipe Unit
San Benito County WD $ 7,561,897 $ 2,926,490 $ 4,635,407
Santa Clara Valley WD $ 6,023,479 $ 1,971,114 $ 4,052,365
Total San Felipe Unit $ 13,585,376 $ 4,897,604 $ - $ 8,687,772
Tehama-Colusa Canal

ENTRIX, Inc. 64
4-M WD $ 919,999 $ - $ 182,938 $ 737,061
Colusa County WD $ 26,548,778 $ 31 $ 6,810,664 $ 19,738,083
Cortina WD $ 491,284 $ 2,659 $ 108,138 $ 380,487
Davis WD -TCC $ 1,036,566 $ 222,242 $ 814,324
Dunnigan WD $ 5,472,329 $ 1,610,392 $ 3,861,937
Glenn Valley WD $ 305,842 $ 79,452 $ 226,390
Glide WD $ 2,568,270 $ 867,003 $ 1,701,267
Holthouse WD $ 493,372 $ - $ 134,391 $ 358,981
Kanawha WD $ 12,614,399 $ 95,451 $ 3,967,564 $ 8,551,384
Kirkwood WD $ 313,029 $ 62,384 $ 250,645
La Grande WD $ 1,543,216 $ - $ 454,533 $ 1,088,683
Myers-Marsh MWC $ 61,155 $ 18,236 $ 42,919
Orland -Artois WD $ 20,800,189 $ 320 $ 6,831,295 $ 13,968,574
Westside WD $ 19,860,377 $ 5,895,796 $ 13,964,581
Total Tehama -Colusa Canal $ 93,028,805 $ 98,461 $ 27,245,028 $ 65,685,316

ENTRIX, Inc. 65
Table A-4
Sacramento Valley Capital Repayment Responsibility by Individual M&I Contractor
Allocated Capital
Cost
Repayment as of 9/30/06
(Schedule A-6A)
Cumulative Capital Relief (Schedule A-
2B1) Net Capital Cost
Black Butte D&R
County of Colusa $ 5,097 $ 5,588 $ (491)
Elk Creek CDS $ 7,312 $ 3,488 $ 3,824
US Forest Service -BB $ 2,838 $ 55 $ 2,783
Whitney Const. $ 3,835 $ 5,990 $ (2,155)
Total Black Butte D&R $ 19,082 $ 15,121 $ - $ 3,961
Clear Creek Unit
Clear Creek CSD $ 1,793,343 $ 306,823 $ 1,486,520
Contra Cost Canal
Contra Cost WD $ 25,129,313 $ 27,103,944 $ (1,974,631)
Cow Creek Unit
Bella Vista WD $ 2,322,365 $ 1,363,828 $ 958,537
Folsom D&R
City of Roseville $ 3,481,242 $ 3,483,517 $ (2,275)
El Dorado ID -FD&R $ 952,883 $ 1,037,517 $ (84,634)
Sacramento County WA $ 1,422,068 $ 107,062 $ 1,315,006

ENTRIX, Inc. 66
San Juan WD $ 1,850,100 $ 1,593,453 $ 256,647
Total Folsom D&R $ 7,706,293 $ 6,221,549 $ - $ 1,484,744
Folsom-South Canal
East Bay MUD $ 13,102,173 $ 1,356,768 $ 11,745,405
Sacramento County WA -FD&R $ 3,577,269 $ 3,577,269
Sacramento MUD $ 7,017,649 $ 7,017,649
Total Folsom-South Canal $ 23,697,091 $ 1,356,768 $ - $ 22,340,323
Sacramento River
City of Redding -SR $ 522,130 $ 665,130 $ (143,000)
City of West Sacramento $ 923,107 $ 997,612 $ (74,505)
Lake California POA $ 26,060 $ 31,084 $ (5,024)
Meyer Crest Ltd. $ 24,729 $ 57,211 $ (32,482)
Riverview Golf & CC $ 3,706 $ 4,737 $ (1,031)
Total Sacramento River $ 1,499,732 $ 1,755,774 $ - $ (256,042)
San Felipe Unit
San Benito County WD $ 2,391,150 $ 1,258,465 $ 1,132,685
Santa Clara Valley WD $ 46,036,755 $ 25,877,078 $ 20,159,677
Total San Felipe Unit $ 48,427,905 $ 27,135,543 $ - $ 21,292,362
Shasta D&R
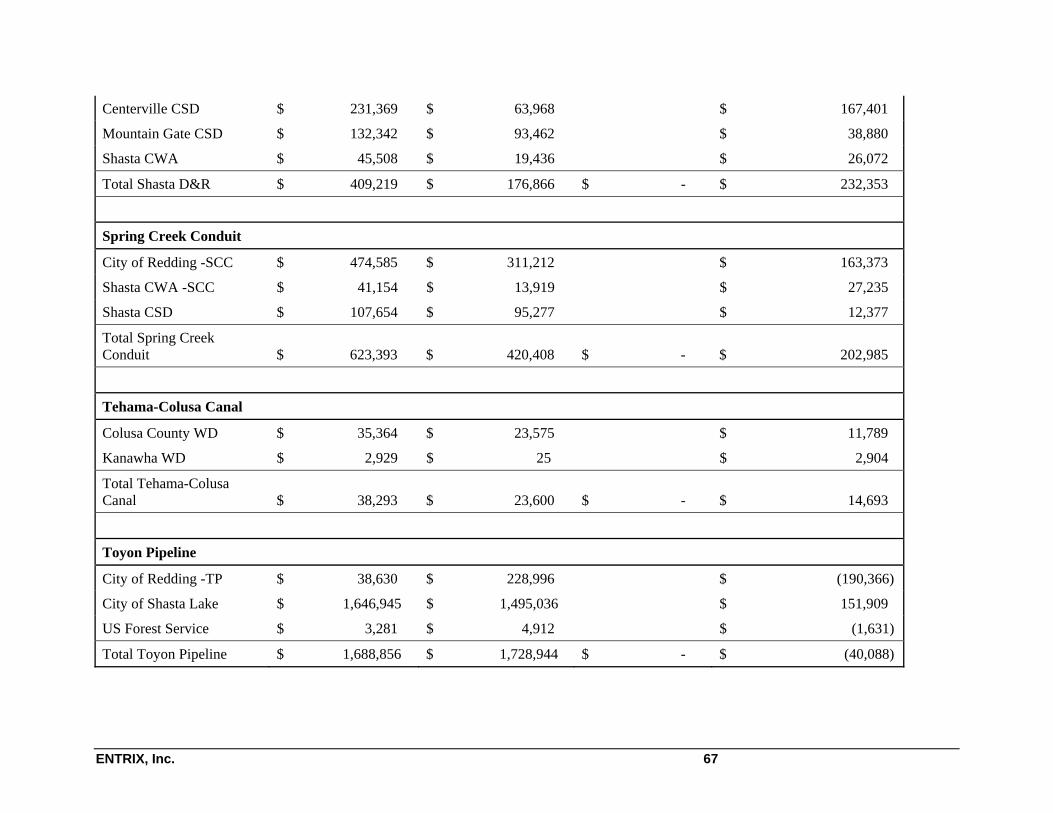
ENTRIX, Inc. 67
Centerville CSD $ 231,369 $ 63,968 $ 167,401
Mountain Gate CSD $ 132,342 $ 93,462 $ 38,880
Shasta CWA $ 45,508 $ 19,436 $ 26,072
Total Shasta D&R $ 409,219 $ 176,866 $ - $ 232,353
Spring Creek Conduit
City of Redding -SCC $ 474,585 $ 311,212 $ 163,373
Shasta CWA -SCC $ 41,154 $ 13,919 $ 27,235
Shasta CSD $ 107,654 $ 95,277 $ 12,377
Total Spring Creek Conduit $ 623,393 $ 420,408 $ - $ 202,985
Tehama-Colusa Canal
Colusa County WD $ 35,364 $ 23,575 $ 11,789
Kanawha WD $ 2,929 $ 25 $ 2,904
Total Tehama-Colusa Canal $ 38,293 $ 23,600 $ - $ 14,693
Toyon Pipeline
City of Redding -TP $ 38,630 $ 228,996 $ (190,366)
City of Shasta Lake $ 1,646,945 $ 1,495,036 $ 151,909
US Forest Service $ 3,281 $ 4,912 $ (1,631)
Total Toyon Pipeline $ 1,688,856 $ 1,728,944 $ - $ (40,088)

ENTRIX, Inc. 68
Appendix B
Table B-1 Long-Term Debt of Largest 10 CVP Irrigation Water Contractors in the San
Joaquin Valley FY 2005-2006
District
Outstanding Debt at End of
Year Percentage of Top Ten
Construction Financed by U.S. or State
Percentage of Top Ten
Arvin-Edison Water Storage District $ 10,213,542 4.0% $ 4,090,485 6.0%
Chowchilla Water District
Del Puerto Water District $ 3,456,811 5.1%
Delano-Earlimart Irrigation District $ 1,871,392 0.7%
Lower Tule River Irrigation District $ 304,999 0.1%
Madera Irrigation District $ 47,920,000 18.7% $ 1,952,114 2.9%
San Luis Water District $ 2,967,500 1.2% $ 4,191,548 6.2%
South San Joaquin Municipal Utility District
Tulare Irrigation District $ 3,055,015 1.2%
Westlands Water District $ 189,991,829 74.1% $ 54,348,623 79.9%
Total $ 253,356,777 100.0% $ 65,171,190 100.0%

ENTRIX, Inc. 69
Table B-2 Allocated Capital Costs and Repayment of the Largest Ten CVP Irrigation
Water Contractors in the San Joaquin Valley 2007
District Allocated
Capital Cost Repayment as of
9/30/06 (Sch A-6A) Net Capital
Cost
Percentage of Net
Capital Cost Westlands Water District $447,921,861 $ 74,148,394 $ 373,773,467 59.7%
Arvin-Edison Water Storage District $ 32,862,312 $ 8,267,858 $ 24,594,454 3.9%
Madera Irrigation District $ 42,386,719 $ 8,575,035 $ 33,811,684 5.4%
Lower Tule River Irrigation District $ 38,333,059 $ 10,798,913 $ 27,534,146 4.4%
Delano-Earlimart Irrigation District $ 40,838,450 $ 11,599,444 $ 29,239,005 4.7%
Chowchilla Water District $ 31,019,003 $ 7,338,017 $ 23,680,986 3.8%
South San Joaquin MUD $ 35,624,145 $ 8,828,360 $ 26,795,785 4.3%
Tulare Irrigation District $ 18,893,365 $ 5,850,718 $ 13,042,648 2.1%
Del Puerto Water District $ 33,039,984 $ 6,121,005 $ 26,918,979 4.3%
San Luis Water District $ 48,905,753 $ 2,544,553 $ 46,361,200 7.4%
Total Top Ten $769,824,651 $ 144,072,297 $ 625,752,354 100.0%
Source: United States Department of the Interior, Bureau of Reclamation, Mid-Pacific Regional Office, “Central Valley Project Schedule of Irrigation Capital Allocation by Contractor, 2008 Irrigation Water Rates.” Irrigation Schedule A-2Bb (accessed July 17, 2008).

ENTRIX, Inc. 70
Table B-3 Westlands Water District Financial Statement FY 1998-99 to FY 2005-06
Average Annual
Amount Average Annual
Percentage of Total Percent Change FY
98-99-05-06 Operating Revenues
Water Sales Industrial $ 9,586,418 1.9% 90.1% Irrigation $ 487,848,384 94.3% 65.2% All Other Sales $ 3,257,597 0.6% -45.2%
Water Services $ 16,376,441 3.2% -7.7% Total Operating Revenues $ 517,068,840 100.0% 6.31% Operating Expenses
Source of Supply $ 390,966,049 72.3% 65.2% Pumping $ 2,113,743 0.4% 56.5% Administration and General $ 47,181,556 8.7% 68.1% Customer Accounts $ 13,381,334 2.5% 21.5% Transmission and Distribution $ 51,964,826 9.6% -5.2% Depreciation and Amortization $ 34,079,372 6.3% 137.8% Other Operating Expenses $ 1,246,118 0.2% -96.9% Total Operating Expenses $ 540,932,998 100.0% 62.2% Operating Income (Loss) $ (23,864,158) 46.9% Non-Operating Revenues
Interest Income $ 15,820,246 17.5% 198.2% Property Assessments $ 52,939,295 58.5% 351.1% Intergovernmental
Federal $ 199,000 0.2% Other Government Agencies $ 5,483,967 6.1%
Other Non-Operating Revenues $ 16,050,743 17.7% -81.6%
Total Non-Operating Revenues $ 90,493,251 100.0% 139.1%
Non-Operating Expenses Interest Expenses $ 33,280,131 98.1% 3,270.7% Other Non-Operating Expenses $ 657,653 1.9% -100.0
Total Non-Operating Expenses $ 33,937,784 100.0% 2,109.7% Non-Operating Income (Loss) $ 56,555,467 3.5% Net Income (Loss) $ 32,661,104 100.0% -41.9%

ENTRIX, Inc. 71
Table B-4 Arvin-Edison Water Storage District Financial Statement FY 1998-99 to FY 2005-06
Average Annual
Amount Average Annual
Percentage of Total Percent Change FY 98-99-05-06
Operating Revenues
Water Sales Industrial $ 1,666,892 1.4% -90.1%
Irrigation $ 64,687,499 55.0% 39.7%
All Other Sales $ 1,471,570 1.3% 30.5%
Water Services $ 49,770,445 42.3% -77.5%
Total Operating Revenues $117,596,406 100.0% 20.2%
Operating Expenses
Source of Supply $ 63,895,686 46.4% 115.3%
Pumping $ 8,012,398 5.8% 118.3%
Administration and General $ 18,288,214 13.3% 86.7%
Customer Accounts $ 1,315,540 1.0% 49.4%
Transmission and Distribution $ 35,130,677 25.5% 214.6%
Depreciation and Amortization $ 10,250,593 7.4% 31.9%
Other Operating Expenses $ 866,463 0.6% 0.0%
Total Operating Expenses $137,759,571 100.0% 135.6%
Operating Income (Loss) $ (20,163,165) -241.8%
Non-Operating Revenues
Interest Income $ 9,054,317 23.3% -68.1%
Rents, Leases, and Franchises $ 40,000 0.1% -100.0
Property Assessments $ 17,133,782 44.0% 2.3%
Intergovernmental
Other Agencies $ 8,002,002 20.6% 0%
Other Non-Operating Revenues $ 4,690,560 12.1% 189.1%
Total Non-Operating Revenues $ 38,920,661 100.0% -18.5%
Non-Operating Expenses
Interest Expenses $ 783,563 30.4% 2,939.0%
Other Non-Operating Expenses $ 1,793,245 69.6% -100.0%
Total Non-Operating Expenses $ 2,576,808 100.0% 2752.4%
Non-Operating Income (Loss) $ 36,343,853 -12.5%
Net Income (Loss) $ 16,180,688 -144.8%

ENTRIX, Inc. 72
Table B-5 Madera Irrigation District Financial Statement FY 1998-99 to FY 2005-06
Average Annual
Amount Average Annual
Percentage Percent Change FY 98-99-05-06
Operating Revenues
Water Sales Industrial $ 41,100 0.1% 127.0%
Irrigation $ 37,369,076 58.9% 115.3%
Sales for Resale $ 2,002,146 3.2%
Water Services $ 24,025,463 37.9% 118.8%
Total Operating Revenues $ 63,437,785 100.0% 107.7%
Operating Expenses
Source of Supply $ 40,194,424 51.3% 43.3%
Administration and General $ 13,423,818 17.1% 62.5%
Transmission and Distribution $ 16,361,087 20.9% 2.7%
Depreciation and Amortization $ 5,446,263 6.9% 80.4%
Other Operating Expenses $ 2,951,712 3.8%
Total Operating Expenses $ 78,377,304 100.0% 39.7%
Operating Income (Loss) $ (14,939,519) -77.4%
Non-Operating Revenues
Interest Income $ 1,713,706 10.9% -4.2%
Rents, Leases, and Franchises $ 301,877 1.9% 523.8%
Current Secured and Unsecured Debt (1%) $ 357,550 2.3%
Voter Approved Taxes $ 486,513 3.1%
Property Assessments $ 8,772,771 55.8% -100.0%
Intergovernmental
Federal $ 664,088 4.2%
State $ 112,039 0.7%
Other Agencies $ 726,653 4.6%
Other Non-Operating Revenues $ 2,587,306 16.5% 149.1%
Total Non-Operating Revenues $ 15,722,503 100.0% -69.1%
Non-Operating Expenses
Interest Expenses $ 512,668 66.6% 2509.2%
Other Non-Operating Expenses $ 256,836 33.4% 51.0%
Total Non-Operating Expenses $ 769,504 100.0% 3256.9%
Non-Operating Income (Loss) $ 14,952,999 -81.5%
Net Income (Loss) $ 13,480 100.0% -88.6%

ENTRIX, Inc. 73
Table B-6 Lower Tule River Irrigation District Financial Statement FY 1998-99 to 2005-06
Average Annual
Amount Average Annual
Percentage Percent Change FY 98-99-05-06
Operating Revenues
Water Sales Irrigation $ 39,980,993 86.1% 209.6%
Sales for Resale $ 665,736 1.4%
All Other Sales $ 517,712 1.1% -100.0%
Water Services $ 5,246,910 11.3% -17.4%
Total Operating Revenues $ 46,411,351 100.0% 181.2%
Operating Expenses
Source of Supply $ 41,335,354 69.1% 149.9%
Administration and General $ 10,507,186 17.6% 55.3%
Transmission and Distribution $ 6,852,674 11.5% 2.2%
Depreciation and Amortization $ 1,142,520 1.9% 51.2%
Total Operating Expenses $ 59,837,734 100.0% 101.6%
Operating Income (Loss) $ (13,426,383) -105.5%
Non-Operating Revenues
Interest Income $ 1,133,421 6.7% -69.1%
Rents, Leases, and Franchises $ 2,502 0.0% -100.0%
Current Secured and Unsecured Debt (1%) $ 447,667 2.6%
Voter Approved Taxes $ 138,798 0.8%
Property Assessments $ 14,670,486 86.2% -0.2%
Prior Year and Penalties $ 108,973 0.6%
Intergovernmental
State $ 10,792 0.1%
Other Agencies $ 388,247 2.3%
Other Non-Operating Revenues $ 118,354 0.7% 109.0%
Total Non-Operating Revenues $ 17,019,240 100.0% -7.5%
Non-Operating Expenses
Interest Expenses $ 110,918 13.6% 64.4%
Other Non-Operating Expenses $ 703,974 86.4% -100.0%
Total Non-Operating Expenses $ 814,892 100.0% -96.8%
Non-Operating Income (Loss) $ 16,204,348 21.8%
Net Income (Loss) $ 2,777,965 100.0% 1919.3%

ENTRIX, Inc. 74
Table B-7 Delano-Earlimart Irrigation District Financial Statement FY 1998-99 to 2005-06
Average Annual
Amount Average Annual
Percentage Percent Change FY 98-99-05-06
Operating Revenues
Water Sales
Irrigation $ 34,087,018 58.9% 117.0%
All Other Sales $ 4,548,255 7.9% -69.4%
Water Services $ 19,214,653 33.2% 454.3%
Total Operating Revenues $ 57,849,926 100.0% 199.0%
Operating Expenses
Source of Supply $ 46,759,214 76.5% 165.4%
Pumping $ 1,163,697 1.9%
Administration and General $ 7,437,806 12.2% 61.8%
Transmission and Distribution $ 3,769,340 6.2% -30.0%
Depreciation and Amortization $ 799,733 1.3% 223.0%
Other Operating Expenses $ 1,217,239 2.0%
Total Operating Expenses $ 61,147,029 100.0% 69.8%
Operating Income (Loss) $ (3,297,103) -108.4%
Non-Operating Revenues
Interest Income $ 2,868,710 29.2% -29.6%
Rents, Leases, and Franchises $ 8,600 0.1%
Property Assessments $ 4,856,314 49.5% -100.0%
Intergovernmental
State $ 99,517 1.0%
Other Agencies $ 390,453 4.0%
Other Non-Operating Revenues $ 1,596,163 16.3% 1151.7%
Total Non-Operating Revenues $ 9,819,757 100.0% -82.3%
Non-Operating Expenses
Interest Expenses $ 515,099 90.7% 721.1%
Other Non-Operating Expenses $ 52,581 9.3% -100.0%
Total Non-Operating Expenses $ 567,680 100.0% 284.2%
Non-Operating Income (Loss) $ 9,252,077 -85.9%
Net Income (Loss) $ 5,954,974 100.0% 20.1%

ENTRIX, Inc. 75
Table B-8 Chowchilla Water District Financial Statement FY 1998-99 to FY 2005-06
Average Annual
Amount Average Annual
Percentage Percent Change FY 98-99-05-06
Operating Revenues
Water Sales
Irrigation $ 29,869,962 98.4% 57.4%
Sales for Resale $ 121,999 0.4%
All Other Sales $ 270,753 0.9%
Water Services $ 81,448 0.3%
Total Operating Revenues $ 30,344,162 100.0% 58.5%
Operating Expenses
Source of Supply $ 31,039,087 64.6% 196.4%
Administration and General $ 6,107,420 12.7% 43.6%
Customer Accounts $ 2,756,639 5.7% 56.4%
Transmission and Distribution $ 6,306,954 13.1% 76.5%
Depreciation and Amortization $ 1,782,411 3.7% -9.8%
Other Operating Expenses $ 58,898
Total Operating Expenses $ 48,051,409 100.0% 121.0%
Operating Income (Loss) $ (17,707,247) 615.4%
Non-Operating Revenues
Interest Income $ 1,802,477 8.7% -57.5%
Current Secured and Unsecured Debt (1%) $ 500,277 2.4%
Voter Approved Taxes $ 121,365 0.6%
Property Assessments $ 16,495,070 79.8% 65.6%
Prior Year and Penalties $ 39,213 0.2%
Intergovernmental
State $ 9,122 0.0%
Other Agencies $ 22,091 0.1%
Other Non-Operating Revenues $ 1,682,103 8.1%
Total Non-Operating Revenues $ 20,671,718 100.0% 67.3%
Non-Operating Expenses
Interest Expenses $ 4,035 0.3%
Other Non-Operating Expenses $ 1,499,429 99.7% -100.0%
Total Non-Operating Expenses $ 1,503,464 -100.0%
Non-Operating Income (Loss) $ 19,168,254 75.2%
Net Income (Loss) $ 1,461,007 100.0% -41.0%

ENTRIX, Inc. 76
Table B-9 Southern San Joaquin Municipal Utility District Financial Statement FY 1998-99 to
2005-06
Average Annual
Amount Average Annual
Percentage Percent Change FY 98-99-05-06
Operating Revenues
Water Sales
Irrigation $ 39,056,500 68.0% 47.7%
Water Services $ 18,338,374 32.0% 37.1%
Total Operating Revenues $ 57,394,874 100.0% 44.1%
Operating Expenses
Source of Supply $ 37,498,738 63.8% 96.9%
Pumping $ 7,458,532 12.7% 141.1%
Administration and General $ 6,259,389 10.6% 75.3%
Transmission and Distribution $ 5,571,075 9.5% 32.9%
Depreciation and Amortization $ 2,013,458 3.4% -40.6%
Other Operating Expenses $ 9,214 0.0%
Total Operating Expenses $ 58,810,406 100.0% 80.6%
Operating Income (Loss) $ (1,415,532) -186.4%
Non-Operating Revenues
Interest Income $ 1,205,040 16.8% 46.6%
Rents, Leases, and Franchises $ 52,159 0.7% 16.7%
Current Secured and Unsecured Debt (1%) $ 1,799,623 25.0% -76.9%
Voter Approved Taxes $ 348,198 4.8%
Property Assessments $ 372,837 5.2%
Prior Year and Penalties $ 12,242 0.2%
Intergovernmental
State $ 49,808 0.7%
Other Non-Operating Revenues $ 3,352,308 46.6% 4531.8%
Total Non-Operating Revenues $ 7,192,215 100.0% 183.7%
Non-Operating Expenses
Interest Expenses
Other Non-Operating Expenses $ 15,615 100.0% -100.0%
Total Non-Operating Expenses $ 15,615 100.0% -100.0%
Non-Operating Income (Loss) $ 7,176,600 185.4%
Net Income (Loss) $ 5,761,068 -36.5%

ENTRIX, Inc. 77
Table B-10 Tulare Irrigation District Financial Statement FY 1998-99 to 2005-06
Average Annual
Amount Average Annual
Percentage Percent Change FY 98-99-05-06
Operating Revenues
Water Sales
Irrigation $ 21,595,935 74.3% 198.5%
Sales for Resale 0.0%
All Other Sales $ 1,587,775 5.5%
Water Services $ 5,890,621 20.3% 1172.9%
Total Operating Revenues $ 29,074,331 100.0% 303.6%
Operating Expenses
Source of Supply $ 18,220,224 38.3% 160.0%
Pumping $ 10,982 0.0%
Administration and General $ 11,028,086 23.2% 227.2%
Transmission and Distribution $ 7,211,036 15.2% -28.0%
Depreciation and Amortization $ 2,219,041 4.7% 304.3%
Other Operating Expenses $ 8,823,033 18.6%
Total Operating Expenses $ 47,512,402 100.0% 136.1%
Operating Income (Loss) $ (18,438,071) -97.2%
Non-Operating Revenues
Interest Income $ 9,977,477 26.1% -89.8%
Rents, Leases, and Franchises $ 42,142 0.1% -100.0%
Current Secured and Unsecured Debt (1%) $ 783,252 2.0% -86.8%
Voter Approved Taxes $ 289,220 0.8%
Property Assessments $ 17,675,030 46.2% -4.7%
Prior Year and Penalties $ 78,269 0.2%
Intergovernmental
State $ 17,651 0.0%
Other Non-Operating Revenues $ 9,358,778 24.5% -75.4%
Total Non-Operating Revenues $ 38,221,819 100.0% -62.6%
Non-Operating Expenses
Interest Expenses $ 1,155,772 31.8% -39.7%
Other Non-Operating Expenses $ 2,473,043 68.2% -99.3%
Total Non-Operating Expenses $ 3,628,815 100.0% -31.1%
Non-Operating Income (Loss) $ 34,593,004 -63.2%
Net Income (Loss) $ 16,154,933 -55.1%

ENTRIX, Inc. 78
Table B-11 Del Puerto Water District Financial Statement FY 1998-99 to 2005-06
Average Annual
Amount Average Annual
Percentage Percent Change FY 98-99-05-06
Operating Revenues
Water Sales
Irrigation $ 27,584,412 87.1% 1.8%
Water Services $ 4,094,483 12.9% -0.7%
Total Operating Revenues $ 31,678,895 100.0% 1.5%
Operating Expenses
Source of Supply $ 24,077,835 85.0% 59.6%
Administration and General $ 4,204,507 14.8% 32.3%
Depreciation and Amortization $ 54,200 0.2% 480.1%
Total Operating Expenses $ 28,336,542 100.0% 55.9%
Operating Income (Loss) $ 3,342,353 -103.3%
Non-Operating Revenues
Interest Income $ 1,210,199 83.8% 4.1%
Rents, Leases, and Franchises $ 5,250 0.4% -100.0%
Other Non-Operating Revenues $ 229,069 15.9% 408.6%
Total Non-Operating Revenues $ 1,444,518 100.0% 38.3%
Non-Operating Expenses
Interest Expenses $ 324,529 68.4% 22.7%
Other Non-Operating Expenses $ 150,253 31.6% -100.0%
Total Non-Operating Expenses $ 474,782 100.0% -26.0%
Non-Operating Income (Loss) $ 969,736 160.8%
Net Income (Loss) $ 4,312,089 100.0% -94.2%

ENTRIX, Inc. 79
Table B-12 San Luis Water District Financial Statement FY 1998-99 to 2005-06
Average Annual
Amount Average Annual
Percentage Percent Change FY
98-99-05-06
Operating Revenues
Water Sales
Industrial $ 418,035 0.7% 190.9%
Irrigation $ 48,177,637 83.0% 26.6%
Water Services $ 9,417,500 16.2% 9.3%
Total Operating Revenues $ 58,013,172 100.0% 64.1%
Operating Expenses
Source of Supply $ 33,770,084 62.4% 41.8%
Pumping $ 466,644 0.9% 378.3%
Water Treatment $ 126,918 0.2% -100.0%
Administration and General $ 7,626,044 14.1% -28.3%
Transmission and Distribution $ 6,587,552 12.2% 22.0%
Depreciation and Amortization $ 5,527,175 10.2% -11.9%
Total Operating Expenses $ 5,410,4417 100.0% 17.7%
Operating Income (Loss) $ 3,908,755 -360.7%
Non-Operating Revenues
Interest Income $ 5,531,380 24.2% 20.5%
Rents, Leases, and Franchises $ 114,166 0.5% -100.0%
Voter Approved Taxes $ 28,884 0.1% -100.0%
Property Assessments $ 13,024,644 57.0% 2.3%
Intergovernmental
State $ 432
Other Non-Operating Revenues $ 4,135,748 18.1% -98.9%
Total Non-Operating Revenues $ 22,835,254 -51.5%
Non-Operating Expenses
Interest Expenses $ 5,105,466 70.3% -38.8%
Other Non-Operating Expenses $ 2,158,700 29.7% -424.1%
Total Non-Operating Expenses $ 7,264,166 100.0% -7.8%
Non-Operating Income (Loss) $ 15,571,088 -60.3%
Net Income (Loss) $ 16,912,987 -3.8%
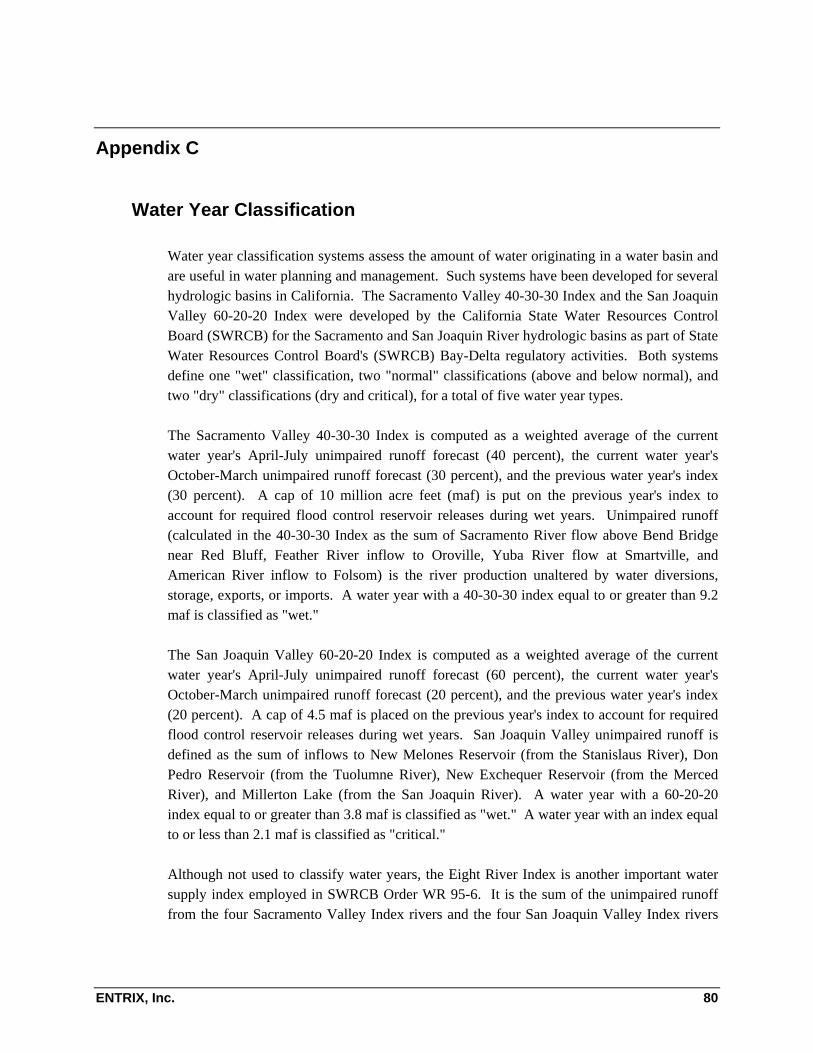
ENTRIX, Inc. 80
Appendix C
Water Year Classification
Water year classification systems assess the amount of water originating in a water basin and are useful in water planning and management. Such systems have been developed for several hydrologic basins in California. The Sacramento Valley 40-30-30 Index and the San Joaquin Valley 60-20-20 Index were developed by the California State Water Resources Control Board (SWRCB) for the Sacramento and San Joaquin River hydrologic basins as part of State Water Resources Control Board's (SWRCB) Bay-Delta regulatory activities. Both systems define one "wet" classification, two "normal" classifications (above and below normal), and two "dry" classifications (dry and critical), for a total of five water year types.
The Sacramento Valley 40-30-30 Index is computed as a weighted average of the current water year's April-July unimpaired runoff forecast (40 percent), the current water year's October-March unimpaired runoff forecast (30 percent), and the previous water year's index (30 percent). A cap of 10 million acre feet (maf) is put on the previous year's index to account for required flood control reservoir releases during wet years. Unimpaired runoff (calculated in the 40-30-30 Index as the sum of Sacramento River flow above Bend Bridge near Red Bluff, Feather River inflow to Oroville, Yuba River flow at Smartville, and American River inflow to Folsom) is the river production unaltered by water diversions, storage, exports, or imports. A water year with a 40-30-30 index equal to or greater than 9.2 maf is classified as "wet."
The San Joaquin Valley 60-20-20 Index is computed as a weighted average of the current water year's April-July unimpaired runoff forecast (60 percent), the current water year's October-March unimpaired runoff forecast (20 percent), and the previous water year's index (20 percent). A cap of 4.5 maf is placed on the previous year's index to account for required flood control reservoir releases during wet years. San Joaquin Valley unimpaired runoff is defined as the sum of inflows to New Melones Reservoir (from the Stanislaus River), Don Pedro Reservoir (from the Tuolumne River), New Exchequer Reservoir (from the Merced River), and Millerton Lake (from the San Joaquin River). A water year with a 60-20-20 index equal to or greater than 3.8 maf is classified as "wet." A water year with an index equal to or less than 2.1 maf is classified as "critical."
Although not used to classify water years, the Eight River Index is another important water supply index employed in SWRCB Order WR 95-6. It is the sum of the unimpaired runoff from the four Sacramento Valley Index rivers and the four San Joaquin Valley Index rivers
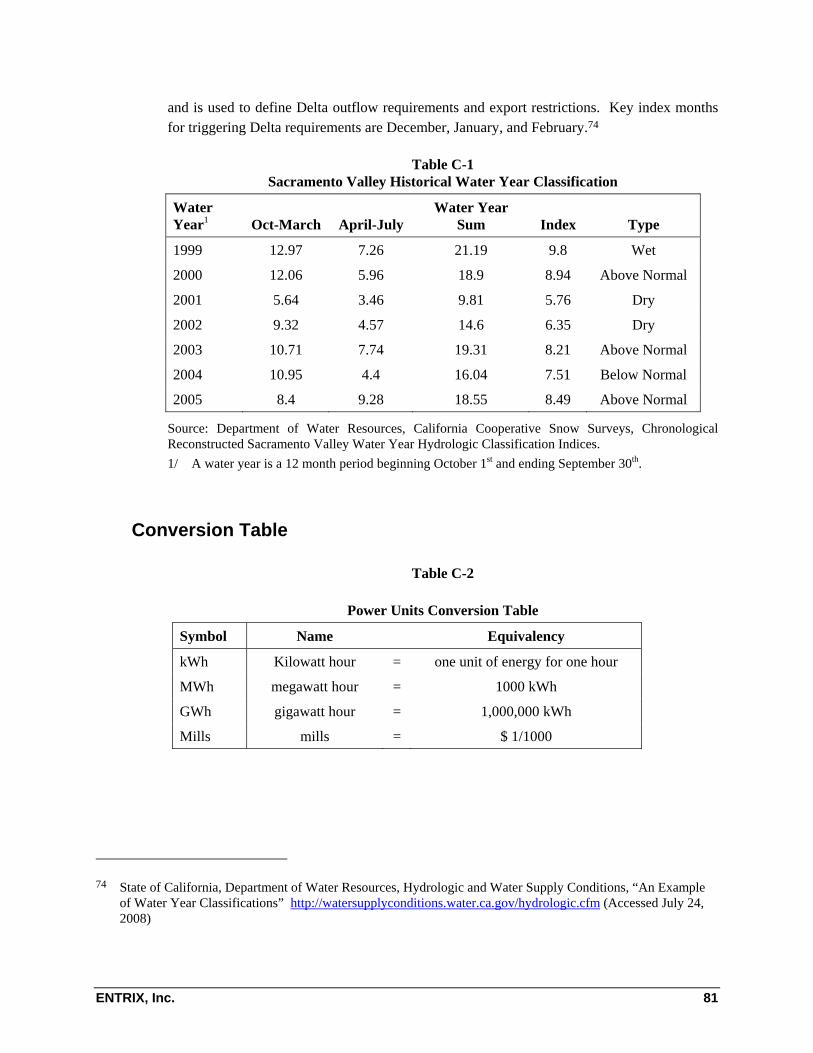
ENTRIX, Inc. 81
and is used to define Delta outflow requirements and export restrictions. Key index months for triggering Delta requirements are December, January, and February.74
Table C-1 Sacramento Valley Historical Water Year Classification
Water Year1 Oct-March April-July
Water Year Sum Index Type
1999 12.97 7.26 21.19 9.8 Wet
2000 12.06 5.96 18.9 8.94 Above Normal
2001 5.64 3.46 9.81 5.76 Dry
2002 9.32 4.57 14.6 6.35 Dry
2003 10.71 7.74 19.31 8.21 Above Normal
2004 10.95 4.4 16.04 7.51 Below Normal
2005 8.4 9.28 18.55 8.49 Above Normal
Source: Department of Water Resources, California Cooperative Snow Surveys, Chronological Reconstructed Sacramento Valley Water Year Hydrologic Classification Indices. 1/ A water year is a 12 month period beginning October 1st and ending September 30th.
Conversion Table
Table C-2
Power Units Conversion Table
Symbol Name Equivalency
kWh Kilowatt hour = one unit of energy for one hour
MWh megawatt hour = 1000 kWh
GWh gigawatt hour = 1,000,000 kWh
Mills mills = $ 1/1000
74 State of California, Department of Water Resources, Hydrologic and Water Supply Conditions, “An Example of Water Year Classifications” http://watersupplyconditions.water.ca.gov/hydrologic.cfm (Accessed July 24, 2008)

ENTRIX, Inc. 82
CVP Power Sales by Customer Category
Table C-3a
CVP Power Sales by Category
FY 2005 FY 2004 FY 2003 FY 2002
Energy (MWh) Revenue ($)
Energy Percent1
Revenue Percent2
Energy (MWh) Revenue ($)
Energy Percent1
Revenue Percent2
Energy (MWh) Revenue ($)
Energy Percent1
Revenue Percent2
Energy (MWh) Revenue ($)
Energy Percent1
Revenue Percent2
Power Marketers 28 $ 146,909 0.0% 0.1% - - 0.0% 0.0% - - - - - - - -
Investor Owned Utilities 1,050 127,686 0.0% 0.1% - - 0.0% 0.0% - - - - 102,368 1,899,895 1.2% 1.0%
Native American Tribes 4,504 54,021 0.1% 0.0% - - 0.0% 0.0% - - - - - - - -
State Agencies 273,201 11,320,508 3.3% 5.1% 223,476 5,688,054 2.3% 2.5% 156,904 4,019,635 1.7% 1.9% 150,474 3,738,451 1.7% 1.9%
Federal Agencies 848,501 29,644,536 10.4% 13.4% 1,075,565 29,072,410 10.9% 13.0% 972,019 25,976,622 10.2% 12.0% 842,464 22,823,493 9.7% 11.7%
Cooperatives 40,488 1,228,917 0.5% 0.6% 148,674 3,482,213 1.5% 1.6% 124,696 2,984,331 1.3% 1.4% 126,277 3,095,874 1.5% 1.6%
Public Utility Districts 3,393,715 106,635,629 41.6% 48.3% 2,881,027 69,337,605 29.1% 30.9% 2,687,645 66,133,348 28.3% 30.7% 2,458,268 59,196,136 28.3% 30.3%
Municipalities 1,573,924 41,944,072 19.3% 19.0% 3,782,803 94,460,894 38.3% 42.1% 3,772,743 95,847,034 39.7% 44.4% 3,240,651 82,117,529 37.3% 42.1%
Irrigation Districts 272,919 5,020,467 3.3% 2.3% 436,147 11,328,473 4.4% 5.1% 342,180 9,113,896 3.6% 4.2% 397,178 10,097,153 4.6% 5.2%
Project Use Sales 1,675,347 18,900,000 20.5% 8.6% 1,336,439 10,770,000 13.5% 4.8% 1,441,378 11,600,000 15.2% 5.4% 1,374,805 12,119,900 15.8% 6.2%
Total California3 8,083,677 215,021,927 99.0% 97.5% 9,884,131 224,139,648 100.0% 100.0% 8,056,187 204,074,866 84.8% 94.6% 7,317,680 182,968,531 84.2% 93.8%
Total CVP 8,165,325 220,565,521 9,885,396 224,243,080 9,497,565 215,674,866 8,692,485 195,088,431
Source: Western Area Power Administration, Annual Report, Statistical Appendix, CVP Sales by State and Customer Category, Years Ending September 30
1/ Percentage of total CVP energy
2/ Percentage of total CVP revenue
3/ Values may not sum due to rounding.

ENTRIX, Inc. 83
Table C-3b
CVP Hydropower Sales by Category FY 2001 FY 2000 FY 1999
Energy (MWh) Revenue ($) Energy Percent1
Revenue Percent2 Energy (MWh) Revenue ($)
Energy Percent1
Revenue Percent2 Energy (MWh) Revenue ($)
Energy Percent1 Revenue Percent2
Power Marketers - - - - - -
Investor Owned Utilities - - 0.0% 0.0% - - 0.0% 0.0% 57,279 1,081,338 0.6% 0.7%
Native American Tribes
State Agencies 199,319 3,797,025 2.1% 2.1% 215,532 3,683,716 2.0% 2.3% 203,159 4,311,331 2.1% 2.7%
Federal Agencies 1,001,691 22,547,038 10.3% 12.7% 1,327,627 21,627,690 12.3% 13.3% 1,254,394 22,288,030 12.9% 14.0%
Cooperatives 129,076 2,369,266 1.3% 1.3% 128,426 2,121,880 1.2% 1.3% 85,905 1,303,270 0.9% 0.8%
Public Utility Districts 2,545,142 50,007,125 26.2% 28.1% 2,775,843 46,248,102 25.6% 28.5% 2,695,552 52,996,469 27.8% 33.4%
Municipalities 4,272,576 79,003,927 44.0% 44.4% 4,513,993 72,821,058 41.7% 44.9% 3,838,224 62,307,465 39.6% 39.2%
Irrigation Districts 398,970 8,408,790 4.1% 4.7% 375,801 6,692,725 3.5% 4.1% 280,380 5,784,893 2.9% 3.6%
Project Use Sales 1,158,361 11,859,984 11.9% 6.7% 1,490,715 9,151,989 13.8% 5.6% 1,288,322 8,700,000 13.3% 5.5%
Total California 8,546,774 166,133,172 88.1% 93.3% 9,337,222 153,195,170 86.2% 94.4% 8,414,893 150,072,795 86.7% 94.5%
Total CVP 9,705,136 177,993,157 10,827,937 162,347,159 9,703,215 158,772,795
Source: Western Area Power Administration, Annual Report, Statistical Appendix, CVP Sales by State and Customer Category, Years Ending September 30
1/ Percentage of total CVP energy
2/ Percentage of total CVP revenue
3/ Values may not sum due to rounding.


