Draft for Comments. August 29, 2000. Overview: Private Sector Development and Infrastructure (PSI) and Poverty Reduction Outline Purpose 1. Introduction 2. Analysis 3. Options Option 1 Sector reform Option 2 Changes in service delivery mechanisms Option 3 Sources of funding and subsidies Option 4 Institutional reform 4. Implementing the framework in the PRSP Process 5. From the Overview to the chapter Annexes: Annex 1. Comceptual Framework Annex 2. Subsidy Design Annex 3. Sectoral Tables Boxes and Figures Box 1. Linkages between household well being, Sectoral Activities, and Government Policies and Programs, and their fiscal implications Figure 1. Private Sector Development, Infrastructure and Poverty Reduction: Conceptual Framework
Transcript
Draft for Comments. August 29, 2000.
Overview: Private Sector Development andInfrastructure (PSI) and Poverty Reduction
Outline
Purpose
1. Introduction
2. Analysis
3. OptionsOption 1 Sector reformOption 2 Changes in service delivery mechanismsOption 3 Sources of funding and subsidiesOption 4 Institutional reform
Box 1. Linkages between household well being, Sectoral Activities, and GovernmentPolicies and Programs, and their fiscal implications
Figure 1. Private Sector Development, Infrastructure and Poverty Reduction: ConceptualFramework
Draft for Comments. August 29, 2000.
2
Purpose
This overview describes the common analytical approach that underpins the Sourcebook’ssectoral chapters for infrastructure—Energy, Water, Transport, Information andCommunication Technologies, Urban Services, Mining, and Private Sector Development(PSD). It further summarizes the major policy and program choices that are available togovernments in meeting their growth and equity objectives. This framework is intended to helpreaders in integrating the guidance provided in the individual infrastructure chapters; it is thesechapters that will assist governments in preparing detailed policies, strategies, and actions foreach sector. The Private Sector Development chapter is still being developed and will not beavailable in this edition of the Sourcebook.
The Energy, Water, Transport, Information and Communication Technologies, and UrbanServices chapters all concern products and services that are best provided to households andfirms—by either governments or the private sector—in the context of government regulation thatallows them to function efficiently and equitably. A Mining chapter is included in the overallinfrastructure section due to the importance of governments in regulating this otherwise privatelyrun sector. The summary recommendations for government interventions outlined in thisoverview chapter, however, apply mostly to the non-mining parts of the infrastructure section.
1. Introduction
As noted in Chapter 1 of the Sourcebook, poverty reduction is measured by improvements infour dimensions: economic opportunities, capabilities, security, and empowerment. Householdswill experience changes in these dimensions in two primary ways: 1) increased consumptionthat results from growth in household incomes, and 2) increased access to and consumption ofgoods and services that are made more affordable by a) efficiency improvements, and b)government actions in support of meeting social equity objectives.
Increased consumption that results from growth in household incomes. Beyond the limited roleof public sector employment, incomes of poor households result from private sector activitiessuch as sale of food and cash crops, labor, and other services. These activities are facilitatedby quantity, quality, and reliability of access to infrastructure services that result in more, andbetter quality, goods as well as more reliable supply of these goods. Also, several measurescan help support the income and growth-generating activities of the poor. These include supportto small- and medium-size enterprises (SMEs) and currently missing labor market measuresincluding training, and home-based income -generating activities (for detailed discussion, seethe Urban chapter, section 2.1.1).
The availability of modern infrastructure also increases the main asset of the poor, that is, labor,by reducing the time that households spend on basic subsistence activities, the time thatwomen spend on domestic chores, and the time lost through negative impact on the health ofhouseholds. However, infrastructure investments have a strongly complementary relationshipwith other physical and human capital in a process of balanced growth.1 Consequently,governments should make investment decisions based not only on the immediate economicimpact of a specific infrastructure investment but also on its potential impact on overall growth.Such an analysis is normally undertaken in the context of evaluating a country’s growth 1 Canning 2000
Draft for Comments. August 29, 2000.
3
patterns; the analytical tools for this purpose are presented in the Private Sector Developmentchapter that will be available in subsequent editions of the Sourcebook.
Increased access to and consumption of infrastructure services that have been made moreaffordable by government actions in order to meet social equity objectives. Householdconsumption is influenced by the need for and availability of infrastructure services andespecially by the affordability—determined by price levels in relation to household incomes—ofthese services. Governments can influence these prices through a variety of measures thateither increase efficiency of service provision—for example, competition policy and increasedprivate sector provision—or through subsidies that result in prices below the cost of serviceprovision generally, or for targeted groups of households.
Infrastructure plays an important role in the growth and equity dimensions of poverty reductionand is closely tied to PSD. Infrastructure investments need appropriate links to PSD to supporteconomic growth, and the private sector can assist governments in achieving their equityobjectives.
The conceptual framework that captures these relationships is outlined in Annex 1 and isapplied in the sections that follow. The framework is being implemented for the first time in thecontext of the PRSP process, and thus the learning opportunities it presents will be an importantpart of the process.
The rest of this Overview is organized into four sections. The first discusses the analyses thatwould be helpful in clarifying the issues that must be addressed in developing the infrastructureand private sector parts of the poverty reduction strategy. The second sets out the range ofoptions that governments may consider in detailing their strategy. The third briefly discussesimplementing the framework discussed in the overview in the context of the PSRP. Finally, theoverview makes the link to the chapters through the sectoral tables attached, which summarizeevery sector's applications of the framework.
2. Analysis
The objective of the analytical stage is to understand how the various infrastructure sectorsaffect the growth and equity dimensions of poverty reduction. Potentially, significant linkageshave been identified between household well being and sectoral activities, that is, the impact ofsectoral indicators on poverty indicators, and are presented in the attached sectoral tables.These linkages are discussed at length in each sectoral chapter and are summarized in Box 1below under the four generic categories: 1) impacts of infrastructure on poverty; 2) intermediatesectoral goals; 3) tools and instruments; and 4) fiscal implications of policy and programchanges. The analysis at the country level would investigate the specific nature and extent ofthese linkages.
Based on the linkages between these four categories, some measurable indicators ofinfrastructure services are suggested in the tables for each infrastructure sector, along the twodimensions of income growth and equity. For a detailed description of the suggested indicators,see the sectoral chapters of the Sourcebook. In general, there are two basic types of indicators:1) service delivery indicators that measure the quantity, quality, reliability, accessibility, andaffordability of infrastructure services, including education and health where appropriate, and 2)other indicators that, where applicable, measure the environmental impacts, level of regionalintegration, trade, and competition. The first step for users, then, is to measure the current level
Draft for Comments. August 29, 2000.
4
of these indicators in the country. Governments should find this information particularly usefulby comparing the status of their country with appropriate benchmarks, such as the indicatorlevels in other countries at a similar level of development.
Box 1. Linkages Between Household Well being, Sectoral Activities, and GovernmentPolicies and Programs, and Their Fiscal Implications
Benchmarks for equity–that is, household access to and consumption of infrastructure services--are often more readily available. Urban and rural benchmarks would be expected to vary andshould be considered separately. As discussed earlier, the impact of infrastructure on growth isinterlinked with other sectors. Consequently, benchmarks for measuring infrastructure impact ongrowth are less readily available. Proxy indicators that could be used are those that indicatewhether demand is being fully satisfied at full cost recovery rates–for example, absence ofbacklogs or waiting lists. In keeping with the emphasis on learning by doing, this is an area thatwill be refined in future versions of the chapters.
Several methods may be used to identify country-level equity and growth indicators that wouldfacilitate assessing their present situation. The sectoral chapters provide sources from whichcountries can find international and regional averages that may be used as benchmarks. Amongthe methods for collecting relevant information are household and or community surveys, whichmay entail stand-alone surveys or 'piggy-backing' on other poverty research efforts. Also, data
Equity Impact on Household Influence Patterns of Growth
1. Poverty ImpactsDefine impact of infrastructureon poverty outcomeindicators, based on country-specific data and internationalnorms
3. Tools and InstrumentsDefine policies and programs
1. Programs to fulfill orincrease availability andaffordability
2. Competition policy3. Regulatory framework4. Governance5. Privatization, PPI
4. FISCAL IMPLICATIONSOF POLICY & PROGRAM
1. Restructuring of Subsidies 1. Changes in Government Income,or tax revenues, and Expenditure
Draft for Comments. August 29, 2000.
5
on users and their needs, audits of physical, educational, and institutional infrastructure alreadyin place, and information on business services are often collected by statistical offices,academic and research institutions, and universities. The next step is to assess the presentsituation in the specific country and, by comparing the outcome with the establishedbenchmarks, based on industry norms or characteristic to the specific region, to identify criticalgaps. The information gathered could be used in conducting a service gap analysis and povertymapping (see Urban chapter, sections 1.2 and 1.3). A development gap could be examined byusing a simple yet informative scoring system, where the score is assigned based on attributesof the sector. Where the score indicates that a development gap exists, this area shouldbecome a priority for reform (for examples and details, see the Sectoral chapters: Energy,section 3.5; ICT, section 4.1; Water, section 4.1).
3. Options
After examining the gaps revealed by country-level indicators compared to the benchmarks,governments will need to consider the goals that they want to achieve in the medium term forpoverty targets and the associated changes in sector performance that would be reflected insectoral indicators. Along with these goals, they will need to analyze the options available tochange existing, or introduce new, policies and programs to improve sector performance asmeasured by the indicators (for a discussion, see the Urban chapter, section 2.3). Theseoptions can be grouped into four broad categories:
• Sector reforms for competition in service delivery, price regulation, regulation of servicequality, and regulatory institutions.
• Changes in service delivery mechanisms , including privatization• Changes in service funding, including subsidies• Institutional reforms
A general objective will be to minimize the fiscal costs of public actions. Furthermore, during theoption analysis phase, the governments will need to consider potential complementarities aswell as trade-offs, including looking for complementary choices:
• Within each infrastructure sector, that is, where the analysis indicates that equity andgrowth objectives are closely interlinked and require the same policy reform andprogram changes;
• Across infrastructure sectors, that is, where the analysis indicates that a consolidatedpackage of infrastructure services is needed to have a positive impact on equity andgrowth; and
• Where complementary choices are not available, options can be developed thatmaximize improvements in service delivery and access indicators. For example, wheregovernments would like to increase service delivery performance, they could chooseprivate investment and participation in the context of increased competition in the sector,which also has the advantage of reducing fiscal costs. Similarly, if governments wouldlike to increase access, they also could choose from a variety of instruments withdifferential fiscal impact, such as rollout obligations in concession agreements andcross-subsidies.
This phase of setting goals and designing options is closely linked to the overall PSRP,including the Rural and Human Development chapters of the Sourcebook. Parts of theprocess that relate to consultations with communities to establish priorities and preferences willoverlap and need to be integrated with the larger participation process specified under theParticipation Chapter of the Sourcebook. However, special attention will need to be given to
Draft for Comments. August 29, 2000.
6
including infrastructure and PSD specific stakeholders, such as network and nonnetwork serviceproviders and commercial users, in the consultation process.
Option 1: Sector reform
International experience has shown that among the most productive directions for sectoralreform are measures to increase competition in service delivery and to separate policydevelopment from service delivery and regulation. Among the important benefits sectorrestructuring and enhanced competition have provided are improved service delivery and often,an improved fiscal situation. However, because the sector reform process is complex and canentail political costs, it needs to be managed carefully. The technical parts of the process—increasing competition in service delivery; price regulation; service quality regulation; and,regulatory institutions—are discussed below. Separating the roles of policy development fromservice delivery and regulation is discussed under Option 4: Institutional reform.
Increasing competition in service delivery
Traditional utility-type services are delivered through networks connecting many consumers.Historically, it was not considered feasible to have competition in delivering these services andas a result, these utilities were considered natural monopolies. However, technological changesin many infrastructure services, such as mobile phones, efficient small-scale electricitygenerators, electronic metering, and billing of a range of utility services, have createdpossibilities for competition by restructuring the network service delivery system.
Another way to increase infrastructure service delivery is to encourage the entry of smallalternative service providers, competing with, or complementary to, traditional utilities whoseservices may not reach the poorest households. Higher unit cost or lower quality of alternativeservice delivery has often led to these service deliverers being ignored or even legally prohibitedby policymakers (see, for example, the Water and Sanitation chapter, section 2.4). But it isclear they can play an important role in supplying communities ignored by traditional networkdelivery, even if only on a transitional basis until conventional services can be provided (seeBox 3 for details). Frequently, rural populations cannot be efficiently served by traditionalnetworks because of the physical dispersal and small concentration of communities combinedwith lower monetary incomes than urban populations. As a result, service delivery for these ruralcommunities must be based on alternative technologies and strategies. For more details, seethe Energy chapter, section 4.7.)
The main elements and options to increase competition through these two types of measures,that is, restructuring the main network service providers and using alternative/nonnetworkservice providers, are outlined further in Boxes 2 and 3.
Draft for Comments. August 29, 2000.
7
Box 2. Restructuring of the Main Network Providers
• Horizontal unbundiling, or introducing competition between industry participants, forexample, multiple electricity generators competing with each other.
• Vertical unbundling, which separates operation of the different sectors, for example,separating production from transmission, facilitating competition within unbundled sectors;
• Free entry, enabling new entrants or the threat of new entrants, which can provide strongincentives for existing service providers to improve their services. Unnecessary restrictionson entry should be removed, and any residual licensing should be minimized to thatnecessary to ration scarce resources or guarantee minimum quality of operators.
• Competition for the market, or introduction of competitive processes used to award the rightto serve a group of customers in areas where it is not possible to have multiple operators–for example, a transmission grid
Box 3. Increasing Competition From Alternative Providers: Measures and Benefits
Measures to increase competition fromalternative providers could include:• Lifting legal prohibitions on entry into the
market--for example, eliminatingmonopolies, avoiding exclusivity provisionsin contracts;
• Removing biases against small operatorsin tariffs, quality, and other regulations;
• Providing effective, simple rules preventingsmall operators from engaging in unsafe orenvironmentally harmful practices;
• Assisting small operators to provide lower-cost, higher-quality services by facilitatinginterconnection with formal networkoperators, where requested.
Benefits from alternative providers to poor households:
• Provision of services in areas where network servicesare physically unavailable
• Despite often higher per unit cost than formal utilityservices, consuming small quantities may be moreaffordable for poor households because of the absenceof large up-front expenditures such as connectioncharges.
• Choice of services can be adjusted to households’needs and affordability--that is, they can reduce ordiscontinue purchases when their incomes aretemporarily reduced
• More innovative than traditional utilities in paymentmethods offered--tariff schemes and creditarrangements
• Potential source of employment
Price regulation
Price regulation is normally required in markets that continue to retain the characteristics ofnatural monopolies and are not fully contestable–for example, electricity transmission; or awater distribution company, which has been granted an exclusive monopoly. At the same time,the starting point in infrastructure service pricing is that total revenues must cover the totalcosts, including operations, maintenance, capital replacement, and network expansion. Unlesscosts are covered, a vicious cycle of declining service, reduced payments by customers, andinsufficient revenue to improve service will result.
Various tariff schemes can be used to ensure that poor households bear relatively less of theburden of the fixed costs than other consumers–for example, richer households or businessconsumers. However, if prices for new connections are set below the cost of supplying peoplein remote or high-cost locations, the service provider will have little incentive to make those newconnections. It is possible to mandate these provisions, for example, by Universal ServiceAccess, although care is needed to ensure that the entire operation does not become
Draft for Comments. August 29, 2000.
8
unattractive as a consequence. Households without access to network services do not benefitfrom price regulation that makes it unprofitable to serve them without compensation elsewhere.
In determining how to regulate prices, governments should consider:• Establishing objectives for price regulation that are consistent with sectoral and poverty
goals. For most developing countries, expanding access is usually the primary objectivefor network services, whereas in middle- and higher-income countries, the objective maybe to control prices for those who already have access. The different emphasis indeveloping countries suggests that pricing arrangements, which allow for sufficientrevenue to be generated to finance increased investment, may be more appropriate.Nevertheless, the issue of affordability is also a significant problem.
• Reducing administrative price regulation where competition among suppliers and fromsubstitute products is sufficient to keep prices as low as is viable. For example,unbundled infrastructure sectors, such as electricity generation or mobiletelecommunications, sectors with sufficient numbers of alternative service providers, forexample, water vendors, and sectors with substitute products, for example, alternativefuels competing with electricity, could be considered for less intensive forms of priceregulation (see Box 4).
Box 4. Less Intensive Forms of Price Regulation
Less intensive forms of price regulation could include the following measures:
• Monitoring and publishing prices, enhancing public awareness of the reasonable prices, and signalingmarket opportunities for potential rival suppliers.
• Freeing prices, but granting a reserve power to a regulator to set prices if they become excessive.• Setting a relatively loose ceiling for infrastructure service prices.
Regulation of service quality
Care should be taken to ensure that quality standards are not set any higher than necessary toachieve public policy objectives--that is, to ensure accessibility to, and availability, affordability,and sustainability of, the basic infrastructure services to all household levels. Higher qualityusually implies higher costs, which may result in infrastructure services becoming unaffordableto the poorest households. Permitting differing quality levels with corresponding pricedifferentials may be a good way of improving the affordability of infrastructure services. Theability to offer multiple price and quality options may be enhanced in an environment whereadditional suppliers are free to enter, and different operators can offer different types of service.
Regulatory Institutions
There is considerable international experience in institutions regulating private infrastructureservices. A regulatory agency is usually required to administer pricing and interconnectionrules, to monitor compliance with these and other norms, and to enforce the rules, directly orthrough the courts. These demanding tasks require skills in economics, finance, law, and otherdisciplines, as well as integrity and some measure of political acumen. Adequate and securefunding is required to ensure that regulatory agencies have access to adequate expertise.Where agencies regulate prices or resolve disputes, it is important that they operateindependently of regulated firms and short-term political influences. Safeguards ofindependence include appointing regulators on technical rather than political criteria, ensuring
Draft for Comments. August 29, 2000.
9
terms of appointment do not coincide with political terms, and providing protection againstdismissal without just cause. Independence needs to be balanced with accountability to ensurethat regulators fulfil their statutory duties. Accountability measures include scrutiny ofexpenditures by the government and legislature, annual activity reports, public reporting ofdecisions, explanation of reasons for decisions, appeal to the courts, or specialist appealsbodies and processes for receiving stakeholder views. For more in-depth discussion, see theGovernance chapter.
Option 2: Changes in service delivery mechanisms
Options for service delivery, other than government departments and parastatals, includecorporatized entities that are owned by the public sector but function under private sector rulesin a competitive environment. Also, across the telecommunications, water and sanitation,energy, and transport sectors, the private sector is making a growing contribution to theinvestments needed to provide infrastructure services in developing countries. Infrastructureprivatization is being welcomed because it brings to the sector significant additional resources.Also, competitive environments have been more efficient than the public sector in delivering lessexpensive, reliable infrastructure services to the whole community, including the pooresthouseholds. The competitive advantage of the private sector has been in its sharpercommercial focus, with more attention to the costs of service and to the demands of consumers.
About 15 percent of investments in infrastructure in developing countries are now made by theprivate sector. Annual private infrastructure investment commitments grew from $16 billion in1990 to $66 billion in 1999, with a total of $575 billion during the decade. Donors areincreasingly reluctant to assist in financing infrastructure services that could be developed andoperated by the private sector, and annual private sector long-term financial flows to developingcountries are now around five times those of donors. Yet Africa is an exception to thisexperience; there, private sector investment in infrastructure is still low.
Developing-country governments need to be aware of the challenges of moving to privatedelivery of infrastructure services. Managing the transition to private delivery also is a complexprocess, and should be accompanied by the market structure reforms and regulatory reformsdiscussed earlier. Managed carefully, the reform process offers more efficient infrastructureservices, with increased consumer access and cheaper and more reliable infrastructure inputsinto other businesses. Poverty can thus be lessened by growing the economy and by directlyimproving the services available to the poor.
Privatization
Almost every country has begun to privatize its formal infrastructure utilities in some form.Privatization is used here as a general term covering a range of options for involving the privatesector in service provision. The main forms available for privatization are shown in Box 5 below.
Draft for Comments. August 29, 2000.
10
An over-arching rationale for privatization is its potential to create more efficient firms and tostimulate economic growth, generating the conditions for poverty reduction. Apart from positivegross domestic product (GDP) growth, privatization’s direct effects on poor households may bemixed—usually with some early negative effects in exchange for greater longer-term positiveoutcomes:
• Employment consequences may be mixed, sometimes with a short-term decrease inemployment in the affected industry, but greater longer-term increases in employment inother industries as a result of improved reliability or cost of the privatized service.
• More efficient firms may offer lower prices, benefiting all consumers.• Access to private financing may lead to increased investment and hence improved
access to services by the poor.• Private investors will, however, require cost-covering tariffs. If tariffs are initially below
cost, tariffs will need to rise, to the short-term detriment of all consumers. In themedium-term, these changes generate the funds needed to pay for enhancedinvestment and maintenance and should result in improved services for all.
• More efficient operators are unlikely to tolerate illegal connections or theft of services.To the extent that poor households engage in these practices they are likely to sufferfrom privatization.
Governments must give careful attention to the design of their privatization processes tomaximize the positive and minimize the negative consequences for the poor. The terms andconditions under which infrastructure privatization occurs will have an impact on the pooresthouseholds. As a result, governments should seek to include contractual conditions at the timeof privatization that will improve service delivery to poor households. Box 6 shows someoptions. The governments also should ensure that as a result of privatization a state monopolyis replaced by competing firms, rather than by a private monopoly. This will result in fasterservice expansion, more rapid introduction of modern technology, and potentially higheremployment growth (see ICT chapter, section 4.2). In addition to avoiding private monopolies,governments should also avoid exclusive licenses, service standards that force the use ofparticular technology, and high fixed administrative costs for businesses entering the market(see Water chapter, section 4.1.1).
Box 5 . Main Methods for Privatization
Option Assetownership
Operations andmaintenance
Capitalinvestment
Commercial risk
Typicalduration
Service contract Public Public andprivate
Public Public 1-2 years
Management contract Public Private Public Public 3-5 yearsLease Public Private Public Shared 8-15 yearsConcession Public Private Private Private 25-30
Box 6. Maximizing the Benefits of Privatization to Poor Households
Measures maximizing the benefits of privatization to poor households could also include the following:• If the greatest problem facing poor households is lack of access to network infrastructure, a
concession contract could be awarded to the firm that commits to connect the greatest number ofnew consumers during the period of the concession.
• If the greatest problem is the price of services, the contract could be awarded to the firm that commitsto the lowest prices to consumers within a given set of minimum standards.
• If the primary motivation for privatization is raising revenue for the government budget, it is importantthat the regulatory environment be established in advance, including any obligations to expandconnections and arrangements for setting future tariffs. Privatization of a monopoly without anyrestrictions on tariffs or other business conduct might raise the most revenue, but the resulting privatemonopoly is likely to behave contrary to the interests of the poorest and may not be politicallysustainable.
Examples from the specific sectors include the use of negative concessions in privatization contracts(Transport chapter, section 2.2), benchmarking utility performance based on coverage in poorneighborhoods (Water chapter, section 4.1.1), and concessions with investment obligations (Energychapter, section 4.6).
A strong political commitment is required to successfully manage reforms that adjust marketstructures, introduce new regulatory arrangements, and increase private sector delivery ofinfrastructure services. Success also requires rigorous management, a high degree of technicalskill, careful attention to stakeholder concerns, and transparency and fairness. Prospectiveprivate sector investors should also be consulted for their views about the local environment andtheir ideas about what is possible.
Infrastructure privatization processes may easily take one to two years to finalize. Whenentering into what may be a 25- to 30-year contract with important consequences for citizen wellbeing, it is important that all of the necessary reform preconditions are put into place beforeprivatization.
• Government needs to set up its own unit to manage the reform process and tocoordinate the work of advisors. The reform unit should have highly skilled staff, shouldreceive strong political support, and should have good access to political decision-makers.
• Help is available for the reform process. One of the best sources of advice will often beother people who have gone through similar processes. Donors have a range oftechnical assistance methods available to support infrastructure privatization, and privateconsultants offer a wide range of supporting services.
• Requiring prospective investors to compete with each other for privatization contracts isthe most effective way of ensuring that the best-qualified firm is chosen. Competitiveprocesses almost always yield better terms than negotiated contracts, and they stand upbetter to political scrutiny.
• A frequent key challenge is raising consumer tariffs. If prices are below cost, a transitionpath will need to be established to ensure that the sector can be returned to costrecovery, permitting private investors to make a reasonable return while expanding andimproving service delivery.
Draft for Comments. August 29, 2000.
12
Option 3: Sources of funding and subsidies
Funding sources for delivering infrastructure services include direct users, or user charges);other users, or cross-subsidies within the sector; and other taxpayers, or subsidies from generalgovernment revenues. Along with often lacking physical access to infrastructure services, poorhouseholds may find it difficult to afford services when they are available. Subsidies may beused to address these problems; however, it is important that government objectives be clearand that the chosen subsidy arrangements be sustainable and well-targeted (see also SocialPolicy chapter for further discussion).
A subsidy exists when users receive services without bearing the full cost of those services.Costs still need to be covered, including operating expenses, maintenance, replacementinvestment, and system expansion, to avoid progressive deterioration in service quality andongoing failure to extend services. The potential funding sources are taxpayer revenue orrevenue from other service users. Box 7 below provides a set of considerations thatgovernments should take into account while designing a subsidy scheme; for more details, seeAnnex 2.
Potential subsidies need to be evaluated according to criteria such as: coverage, or extent towhich the poor are reached; targeting, or share of subsidies to the poor, firms and households,geographic distribution, type of service; predictability, or reliability of receiving subsidies; pricedistortion and unintended effects; costs of subsidies; delivery mechanisms; and ease ofadministration. There are a variety of methods for providing subsidies. These include generalprice subsidies; lifeline subsidies, restricted to basic need levels; burden limit, or share ofhousehold income spent on service; and cash transfers. For a detailed discussion, see theEnergy chapter, section 4.2).
Box 7. Subsidies as Part of the Reform Agenda
General considerations that the governments should take into account while designing asubsidy scheme (Waddams Price, 2000)
• Identify the motivation for the subsidy Is it economic efficiency? If so, connection and rentalshould be subsidized. Or is it equity? If so, particular groups should be targeted. Or is it onpolitical grounds? If so, it may be important to identify the powerful potential ‘losers’ and findanother way to compensate them so that overall gains from reform are not jeopardized.Where reforms generate winners and losers, the losers tend to identify themselves inadvance and organize themselves in opposition, while the winners are likely to be dispersedand less well organized.
• Determine whether the subsidy is temporary or permanent; if temporary, make a credibletimetable and arrangement for its removal.
• Subsidies require information about costs and demand. Arrange to collect this informationover time, to provide an initial baseline and to monitor changes.
• Ensure that the regulatory system is sufficiently strong and knowledgeable to handle theseissues. There are arguments for close connections between infrastructure regulators toshare knowledge, since many of the issues, and some of the household demandinformation, will be common between the industries.
Draft for Comments. August 29, 2000.
13
• Identify the opportunity costs of subsidies. If subsidies are direct, how else might the fundshave been used, and what is the cost of raising them? If cross-subsidies are involved, whatare their distortions and equity implications?
Meeting poverty objectives while restructuring utility cost recovering policies (see Waterchapter, section 4.1.1):
• Avoiding reverse cross-subsidy—ensuring that poor people are not charged more for theirwater than better-off users.
• Identifying the poor and providing direct government payment to the utility for a portion oftheir bill.
• Easing the cost of connections for low-income users by subsidizing connection costs, or byallowing connection fees to be spread over a longer period, and included in monthly bills.
• Using a lifeline tariff—charging a low, often flat, rate for low-income or low-volume users. Atypical ceiling for the tariff would be 6-8 liters per capita per day
Most subsidy schemes exclude some poor households, or errors of exclusion, while providingbenefits to some richer households, or errors of inclusion.2 Difficult targeting issues arise whenfunds are insufficient to subsidize all of the target groups. A useful principle to follow is toprioritize resources according to greatest impact. Where the benefits appear to be equal, thealternative that is less costly should be selected. On this basis, for example, network expansionfunds could be directed to periurban areas rather than rural areas. Or, if poverty is greater inrural areas, the scarce funds might be directed to alternative lower-cost interventions in ruralareas. The trade-offs between potential beneficiaries may be more easily considered whensubsidies are direct, for example, cash grants, rather than indirect, for example, cross-subsidies.
In allocating subsidies, it is desirable where possible to use a competitive allocation mechanism.For example, in the mid-1990s, Chile used a universal access fund to increase access totelecommunications services for about one third of those in rural areas who did not previouslyhave access. The government identified target regions, and by means of a competitive lenderawarded a subsidy and a non-exclusive license to the firm asking for the least subsidy to meetcertain target outcomes—for example, number of public pay phones in the region. In this way,Chile could carefully ration its universal access fund, generating around $40 million of additionalprivate investment while spending just $2 million of public funds.
Option 4: Institutional reform
Separating policy formulation from service delivery and regulation—Capacity building
A government can seek to maximize the benefits of the reform by assigning the appropriateroles to itself and its various entities. The critical role is to ensure that services are available anddelivered to poor households. This provision responsibility does not necessarily require that the
2 These errors can often be remedied by adjusting the subsidy scheme with experience. For example, in1989 the drinking water subsidy scheme in Chile reached only 14 percent of the target group, but by1997, almost 75 percent benefited, by gradually altering the quantity of water subsidized and the level ofthe subsidy, and by extending the conditions for a household to qualify. Institutional changes were alsoimportant. The water companies were allowed to inform municipalities about households that seemed tobe struggling to pay bills, so identifying likely targets for subsidies.
Draft for Comments. August 29, 2000.
14
government deliver these services itself, as the preceding sections have shown. Theinescapable aspects of this responsibility are to make policies and write rules--laws orregulations--by which the system must operate, and to ensure these rules are enforced.
In addition to policymaking and regulation, government may need to allocate budget resourcesto support these policies. The Public Spending chapter highlights general principles that apply.In this context, the role of civil society and sub-national governments in public resourceallocation should be identified. Governments may also reorganize themselves to be morepoverty focused and efficient in fulfilling their governance functions. Often this entails buildingnew capacities at central and local levels. It is particularly important in increasing theparticipation the poor in the decision-making process (see discussion in the Urban chapter,section 2.1.5).
When a government agency must deliver a service, it is critical that the regulatory responsibilityfor the service is outside of that agency in a body with the characteristics and responsibilitiespreviously discussed under “Regulatory Institutions.” This omission, which is frequent, usuallyresults in poor performance of public service delivery.
Further, where services are publicly delivered, government should also focus on ensuring thatthe delivery agency is guaranteed managerial autonomy in the use of assigned resources and instaffing decisions. Also, transparency of operations and accountability for results are critical.
4. Implementing the Framework in the PRSP Process
The analysis and review of options described above will generate choices that would have to bemade. However, choices for infrastructure sectors would need to be considered and prioritizedin the context of strategies for other sectors, which would also be formulated as part of thePoverty Reduction Strategy Process. Further, budgetary choices and their fiscal implicationswould need to be considered during the Public Expenditure Review Process.
Limited, scarce, or unavailable country-level PSI information
It is reasonable to expect that especially during the initial PRSP cycle, data and resourcelimitations will constrain governments' ability to undertake comprehensive analysis. Often, forexample, information will be available on infrastructure supply, especially for network supply, forexample, roads and power, water, and telecommunications utilities, but much more limitedinformation is available on household and commercial consumption of infrastructure services,which are self-provided or provided by nonnetwork suppliers, for example, small-scale suppliersof water, nongrid electricity. Similarly, while many countries now have regular surveys ofhousehold income and consumption, the availability of surveys on the impact of PSD andinfrastructure constraints on farms and firms is much more limited.
Considering these circumstances, it is suggested that governments adopt a phased strategy:• First, focus on readily determined impacts, for example, expanding service access to
the poor while minimizing the fiscal and public capacity burden by leveraging as muchprivate sector, non-governmental organization (NGO), and community resources asfeasible.
• Simultaneously, identify key information gaps to be addressed in time for the next PRSPcycle. Options include leveraging existing survey resources and capabilities, forexample, by expanding the content of Living Standards Measurement Surveys, and
Draft for Comments. August 29, 2000.
15
identifying how new surveys, for example, service delivery surveys, firm surveys, can beundertaken by incrementally building on domestic survey and analytical capabilities asmuch as possible. Using NGOs and communities in data collection activities has theadded advantage of raising stakeholder awareness.
Monitoring and Evaluation
It is to be expected that the first round of implementation of the described framework will notproduce completely satisfactory results. Monitoring and evaluation of the process and results incomparison with the objectives and targets will be critical to learning what parts of the processshould be adjusted. Also, the lessons learned should offer guidance on what adjustmentsshould be made. Details of appropriate frameworks are described in the Monitoring andEvaluation chapter
Assessing the poverty outcomes of PSI services requires re-examining the linkages betweenhousehold well being, sectoral activities, and government policies and programs and their fiscalimplications; examining the performance or impact of chosen interventions compared to growthand equity targets; and assessing whether the correct needs, constraints, and opportunitieshave been identified. Publicizing the results to stakeholders, including the poor, is critical to theprocess. (See discussion in Water chapter, section 5.0.)
Evaluating the changes in impact indicators may use several instruments: 1) householdsurveys; 2) focus groups; 3) visual observations; and 4) analysis of official records (seeTransport chapter, section 5.3). Several monitoring and evaluation indicators are suggested inICT chapter, Table 4.1, and in Urban chapter, section 2.2. These include indicators of thesector, macro and enabling environments, program content, access to infrastructure and impacton household, communities, and organizations.
. From the Overview to the Chapters
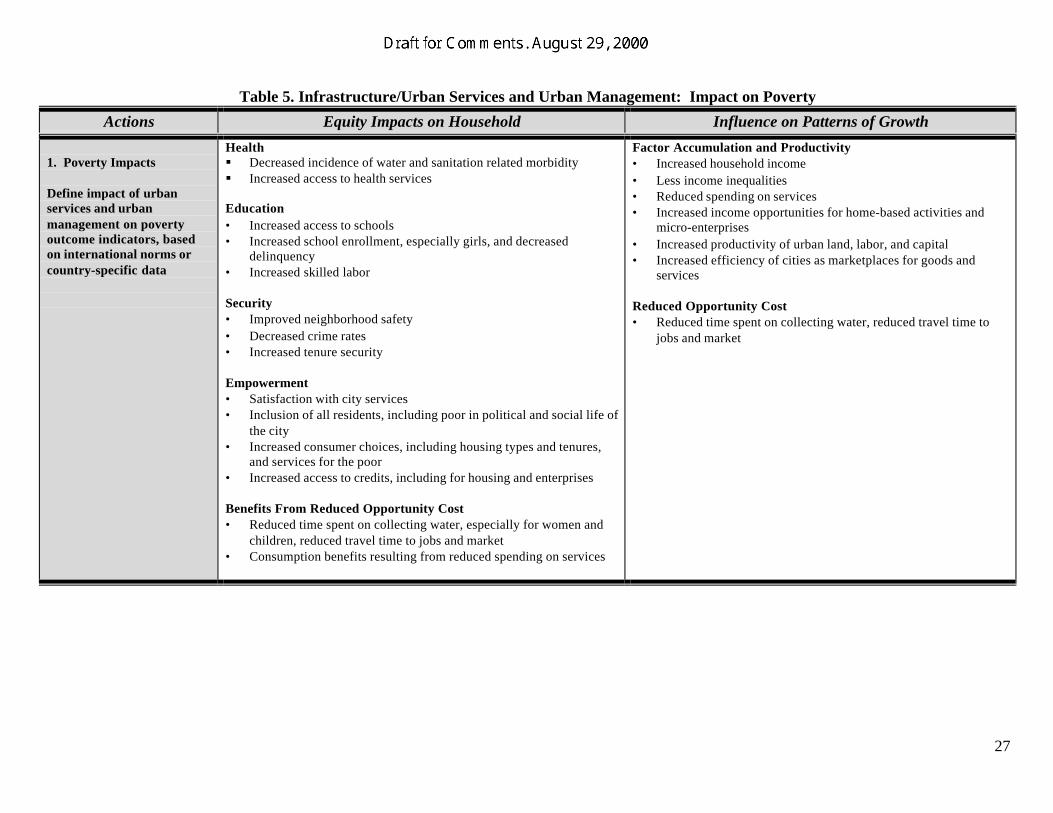
This overview provides a generic framework, which has been synthesized from sector- specificcontext within each chapter. A set of summary sectoral tables for the major parts of eachchapter are attached to this overview—Energy (Table 1); Water and Sanitation (Table 2);Transport (Table 3); Information and Communication Technologies (Table 4); UrbanServices (Table 5); Mining (Table 6), and Private Sector Development (Table 7 – work inprogress). The tables provide guidance on the four elements discussed earlier:§ Impact of sectoral activities on final poverty indicators;§ Goals and sectoral indicators for infrastructure or private sector development;§ Tools and instruments that define options for policies and programs; and§ Fiscal impact of policies and programs options.
Governments can leverage the technical guidance provided in the chapters to prepare similarcountry-specific tables for each infrastructure sector. They can then use these tables as a guidein integrating and reconciling individual sectoral strategies to arrive at the PSI elements of theoverall PRSP strategy.
Identify access/service delivery levels, funding, sector policies and institutionalarrangements for infrastructure services
Define options for achieving impactincluding policy changes and programs
ANALYSIS
Implementing policies to improve service delivery, efficiency and affordability
Infrastructure tools- Private delivery options - Strengthening public sector institutions- Investment financing- Education, information & consultation
Implement strategy for broad-based growth
PSD tools, e.g.•Improve business environment•Foster enterprise learning
ACTION
LEARNINGFEEDBACK LOOP
Draft for Comments. August 29, 2000.
17
Annex 2: Subsidy Design
Objectives of subsidizing infrastructure services. While improving the living conditions ofpoor households is often the stated goal, subsidized services of network infrastructure are onlyone among several important items of consumption, such as food, clothing, and housing, whichcould be subsidized. Cash transfer payments may allow poorest households more choice inselecting consumption items. Public health or environmental issues may provide additionaljustifications; for example, subsidizing water and sewer services may reduce outbreaks ofdisease. Infrastructure subsidies may be less administratively costly than a social securitysystem making cash transfer payments to poor households.
Beneficiaries of the subsidies. Given budget constraints, some means of identifying thebeneficiaries need to be found. Possible identifiers include household characteristics, forexample, living in a particular region, retired, head of household unemployed, single parentfamily, or demand characteristics, for example, low level of consumption or using prepaymentmethods that are prevalent among low-income groups. Some subsidies are universallyavailable, such as lifeline tariffs where the first one or two consumption blocks are sold below-cost to assist low-consumption households. Schemes that identify particular households maydo a better job of targeting the scarce funds, but may be more expensive to administer. SeeSocial Policy chapter for further discussion.
What should be subsidized (connections, rental, or consumption)? Infrastructure pricingoften has three elements: a one-off payment for connection, a fixed monthly rental payment,and a per-unit consumption payment. Where the poorest lack access to infrastructure services,they are more likely to benefit from subsidized connections rather than subsidized rental orconsumption. Where the principal problem is affordability for those who are already connected,targeted rental or consumption subsidies may be more appropriate.
To whom should the subsidy be given? Regardless of who the ultimate beneficiaries are,subsidies can be delivered to consumers or producers.
• Delivery to consumers has the benefit of reaching the target group directly but may bemore administratively complex than paying producers. These subsidies can bedelivered through lower prices or subsidized credit; universally or selectively; toindividuals or communities.
• If subsidies are delivered by a producer, the amount of subsidy should be used tocompensate the producer for some part of the service delivered to target households,permitting the producer to offer lower prices to the target households. When firms areresponsible for delivering subsidies, they may be required to establish cross-subsidies.Cross-subsidies may be applied between different groups of consumers,for example,from industrial to residential consumers, or within consumer groups, for example, fromone group of households to another.
Draft for Comments. August 29, 2000.
18
• How should subsidies be financed? The two basic sources of finance for subsidies aregeneral tax revenue and cross-subsidies. Something of a hybrid-financing source is anindustry levy, which is raised from all operators in an industry, and then used tosubsidize particular target groups, for example, all telephone companies pay 1percent oftheir revenues towards a universal service fund, which subsidizes network expansion inrural areas. Cross-subsidies often have the undesirable consequence of encouragingincreased consumption by high-cost consumers, thereby indirectly raising costs for all,and directly impose costs upon other consumers who must pay higher prices to financethe subsidy. General tax revenue has the advantage of not distorting prices in the targetindustry, but imposes costs elsewhere in the economy. Cross-subsidies are oftenregarded as inconsistent with competition. Cross-subsidies require that some consumerspay more than the cost of service to subsidize consumption by others. In a competitivemarket, attempts to raise prices above cost will lead to cherry-picking of high-priceconsumers by competitors, leaving no one to bear the costs of the subsidy. The effectsof a cross-subsidy can be reproduced in a competitive market through an industry levyon all operators, the proceeds of which can be allocated to subsidize particularconsumers. Because of the importance of competition in providing increased services tothe poor, industry levy schemes may be more appropriate than monopoly franchises thatsupport nontransparent cross-subsidies.
Are the costs justified? Direct costs to be considered include the costs imposed on non-beneficiaries, and the administration costs, incurred by the companies and by the government.The administration costs involve not just the salaries of those involved but also the use ofscarce skilled professionals who could be used in other parts of government for other purposes.Consideration should also be given to the opportunity costs of using funds to subsidizeinfrastructure services. Should a funding source be used to extend telecommunicationsservices to the rural poor, or to provide better education, or any other potential use of publicfunds? The trade-offs between the costs and benefits of subsidy schemes should occur in theframework of general public expenditure review, and should extend to consideration of lesstransparent cross-subsidy schemes.
19
ANNEX 3: SECTORAL TABLES
Table 1. Infrastructure/Energy: Impact on PovertyActions Equity Impacts on Household Influence on Patterns of Growth
1. Poverty Impacts
Define impact ofinfrastructure on povertyoutcome indicators, basedon international norms orcountry-specific data
Capability (Health, education, urban services)• Realizing consumption and welfare benefits from reducing the
physical effort and time spent gathering biomass fuels for cooking• Reducing health risks through use of clean fuels• Enabling the provision of complementary social and infrastructure
services—health, water supply, communications• Providing a subsistence level of heating in cold climates• Improving illumination, leading to increased educational attainment
and income-producing activity
Security• Stabilizing energy prices smooths out energy consumption patterns• Improving illumination leads to increased security and safety,
especially of women working on night shifts.
Empowerment• Ability to choose energy services to meet specific needs• Improved access to information and communication services• Increased accountability of service providers• Positive influence of employment on work ethic and household self-
esteem
Growth and Productivity• Essential input for businesses—supports economic growth,
which can increase farm and non-farm employmentopportunities for the poor Income increased by boostingproductivity of labor and capital through irrigation, cropprocessing, and mechanization
Economic Stability• A fiscally sustainable energy service industry improves
macrostability through: increased tax revenue, both direct andindirect; reduced claims on public financing; and reduced fiscalrisk.
Sustainability of Resource Use• Preventing unsustainable natural resource exploitation and
depletion
Reduced Opportunity Costs• Reducing the physical effort and time spent gathering biomass
fuels for cooking
2. Sectoral Goals
Define changes inintermediate sectoralindicators
AVAILABILITY INDICATORS• Availability of electricity and modern cooking fuels by
administrative district—prefecture, county, or municipality(Section 3.2, Table 3.1 in energy toolkit)
AFFORDABILITY• Connection costs as percentage of income• Energy use costs as percentage of income
(Section 3.2, Table 3.1 in energy toolkit)
Reliability Indicators• Reduction in production time lost, or downtime, due to energy
supply interruptions.• Reduction in alternative supply arrangements: self-generation;
Cost Efficiency• Production and delivery costs in line with international
benchmarks of economic efficiency
20
Actions Equity Impacts on Household Influence on Patterns of GrowthHealth Indicators• Reduced incidence of respiratory illness among poor women and
children.
Governance and Regulatory Indicators(Section 3.5, Table 3.4 in energy toolkit)
Fiscal Responsibility Indicators• Net indirect tax revenue from energy commodities• Income taxes paid by energy enterprises and utilities• Public financing of energy-sector investments
(Section 3.4, Table 3.3 in energy toolkit)
1. Optimize consumer pricing policies(Section 4.1 in energy toolkit)
2. Subsidy targeting and delivery mechanisms(Section 4.2 in energy toolkit)
3. Ease first-cost constraints for modern energy access(Section 4.3 in energy toolkit)
4. Encourage community participation in service delivery and management(Section 4.4 in energy toolkit)
5. Deregulate the energy service industry(Section 4.5 in energy toolkit)
6. Encourage private participation in energy services(Section 4.6 in energy toolkit)
7. Develop sustainable rural electrification programs(Section 4.7 in energy toolkit)
8. Encourage and promote natural gas development and use(Section 4.8 in energy toolkit)
9. Improve natural resource exploitation and management(Section 4.9 in energy toolkit)
3. Tools and Instruments
Define policies andprograms
10. Mitigate health effects of biomass use(Section 4.10 in energy toolkit)
4. Fiscal Implications ofPolicy and ProgramChanges
• Restructuring of subsidies • Net tax, direct and indirect, contribution by the energy sector• Reduction of budget cost of energy subsidies• Reduction of the fiscal burden of energy service provision
21
Table 2. Infrastructure/Water and Sanitation: Impact on Poverty
Actions Equity Impacts on Household Influence on Patterns of Growth
1. Poverty Impacts
Define impact ofinfrastructure on povertyoutcome indicators, basedon international norms orcountry-specific data
Health• Reduced incidence of water- and sanitation-related morbidity• Reduced prevalence of stunting from diarrhea-caused malnutrition in
children under five years• Increased life expectancy
Education• Reduced illiteracy rates• Increased school enrollment
Security• Reduced vulnerability to seasonal or other pressures on water and
sanitation services• Reduced vulnerability, especially of women, when attending to
hygiene needs
Benefits From Reduced Opportunity Costs• Consumption benefits from reduced spending on water by lowest-
income decile• Welfare benefits from reduced opportunity cost of collecting water
Factor (Labor) Productivity• Reduced morbidity and mortality• Improved literacy rates
Reduced Opportunity Costs• Reduced spending on water by lowest income decile• Reduced opportunity cost of collecting water
Sustainability of Resource Use• Reduced water stress to the national economy• Improved allocation of water resources by introducing efficient
pricing mechanisms
2. Sectoral Goals
Define changes inintermediate sectoralindicators
Accessibility• Percent of households with consumption of 20 liters or more per
capita per day throughout the year• Percent of households with distance to source under 30 meters• Percent of households with distance to latrines under 10 meters
Affordability (Tariffs)• Percent of total household income spent by the lowest-income decile
on water• Unit cost by type of service provision—self provision, nonnetwork
or network provision
Service Delivery Indicators (Reliability and Quality)• Increase in the number of cost-recovering service providers• Reduction in unaccounted-for water• Reduction in supply interruptions throughout the year
Environmental Indicators• Percent reduction of water- and sanitation-related diseases
22
Actions Equity Impacts on Household Influence on Patterns of Growth
3. Tools and Instruments
Define Policies andPrograms
• Promote a demand-responsive approach where communities makeinformed choices about their participation, service level, and servicedelivery mechanisms
• Promote full cost recovery in service delivery and target subsidies tolower-income households
• Promote liberalization, competition policy, and regulatory reform• Ensure appropriate legal and policy framework for ownership
and management• Promote or establish pro-poor financing mechanisms, such as
micro-credit or incorporation of connection charges in monthlybills
4. Fiscal Implications ofPolicy and ProgramChanges
• Restructuring of subsidies • Increased PSP in service provision and financing• Reduced subsidy demands on government budget from current
services• Better-targeted public expenditure on the poor measured by the
percent of public expenditure for water reaching poor households
23
Table 3. Infrastructure/Transport: Impact on Poverty
Actions Equity Impacts on Household Influence on Patterns of Growth
1. Poverty Impacts
Define impact ofinfrastructure on povertyoutcome indicators, basedon international norms orcountry-specific data
Health and Education• Easier and faster access to schools and health facilities
Security• Faster response to emergencies• Lower vulnerability to crop failures• Ability to follow seasonal jobs• Improved Non-Motorized Transport (NMT) and pedestrian safety• Improved safety of women traveling to and from night-time jobs
Empowerment• Expanded constituency area• User representation on road boards• Increased time for women and girls, enabling more independence• Positive influence of employment on work ethic and household self-
esteem
Factor Accumulation and Productivity (Labor and Land)• Increased farm gate or net market price and revenue• Reduced input prices and spending on transport- intensive goods• Increased access to extension services• Reduced travel times to market and other destinations• Higher real wages• Additional employment in and outside transport services• Lower vehicle operating costs and resource savings resulting
from improved road conditions• Reduced morbidity and mortality from road accidents or from
access to health facilities• Improved literacy• Lower road accidents
Improved Terms of Trade to Households• Product substitutions to exports and generation of value-added
2. Sectoral Goals
Define changes inintermediate sectoralindicators
Accessibility (access value indicators)• Farm gate crop prices• Cash income• Percent poor households, by district, within 30 minutes walk of all-
weather motorized passability road• Percent eligible children attending primary school• Percent of working population, especially women, working on
second and third shifts• Availability of affordable motorized vehicle service• Percent participation in elections
Affordability (fares, tariffs, travel time costs)• Percent of total household income spent by poor households—the
lowest- income decile—on priced transport services• Commuting cost and real wage• Travel time to preferred hospital• Travel time in search of job and employment• Percent time spent by household for transport of food, fuel, and
water
Increased Physical Access• All-weather motorized passability• Service reliability
Service Delivery Indicators• Lower freight and passenger costs, cents per kilogram /
passenger-kilometer• Average travel speed in urban areas during business hours,
kilometer per hour• Road-related fatalities per motorized vehicle, urban and rural• Service coverage—distance to nearest public transport; kilometer
and hours• Percent rural freight task performed by NMT, including
headloading
Increased Inter-Regional Trade, Integration, and Integration andCompetition• Reduced spatial and intertemporal imbalances in supply and
demand
24
Actions Equity Impacts on Household Influence on Patterns of Growth• Percent of poor households who have used micro-credit for NMT• Percent of poor households using motorized services at least once
per week• Percent of poor households using nonmotorized transport
• Smaller price differences across regions; smaller incomeinequalities
• Lower transport, transaction, and logistics costs• Lower delivered prices• Reduced congestion on urban roads, reduced port delays• Increased contestability and effective competitiveness in services
3. Tools and Instruments
Define Policies andPrograms
• Integrate transport interventions with other complementary sectoralinterventions and assess jointly--for example, schooling, health,security, agricultural extension
• Define cost recovery for highly utilized infrastructure and serviceswith direct targeting of subsidies or related assistance, for example,micro credit,) to poor households
• Encourage community participation on options and priorities
• Promote efficient labor-based and /low- skill technology--forexample, road works
• Provide for NMT, including pedestrians
• Promote clean vehicle emissions for better health and environment
• Support and engage community participation in local programsand projects
• Liberalize entry to and for service markets; promote competitionpolicy and regulatory reform
• Where viable and efficiency enhancing, expandcommercialization and privatization of transport publicenterprises (PEs), especially ports and railways, throughinfrastructure management, contracting-out, concessioning anduser charges, and cost recovery, for example, primary andsecondary roads
• Ensure appropriate legal and policy framework for ownershipand management
• Facilitate private sector participation and ”micro-enterprise”development in road maintenance
• Promote pro-poor financing mechanisms, for example, micro-credit
• Ensure sustainable financing of road maintenance through theprinciple of beneficiary burden sharing
4. Fiscal Implications ofPolicy and ProgramChanges
• Restructuring of subsidies • Percent reduction in public expenditure on transport• Percent national government budget allocated to transport
subsidies, by mode
25
Table 4. Infrastructure/Information and Communication Technology (ICT): Impact on Poverty
Actions Equity Impacts on Household Influence on Patterns of Growth
1. PPoverty Impacts
Define impact ofinfrastructure on povertyoutcome indicators, basedon international norms orcountry-specific data
Health, Education, and Welfare• Improved health outcomes due to more efficient delivery of health
services, that is, life expectancy, maternal and infant mortality rate• Distance learning opportunities and improved teaching resources--
improved school attendance, literacy, IT training• Efficient delivery of social safety net services• Decreased vulnerability of households
Empowerment• Increased access to information and decisionmakers• Development of social capital through networks of shared concern
Security• Advanced warning and faster response to natural disaster
Benefits From Reduced Opportunity Costs• Consumption and welfare benefits from reducing the physical effort
and time spent gathering and disseminating knowledge andinformation
Factor Accumulation and Productivity• Increased household income• Employment opportunities in providing ICT services and services
over ICTs• Increased value-added and production through reduction in costs
of other infrastructure services• Increased access to markets and investment
Reduced Opportunity Costs• Consumption and welfare benefits from reducing the physical
effort and time spent gathering and disseminating knowledge andinformation
Sustainability of Resource Use• Improved information on local environments and sources of
pollution• Reduction in resource use, such as transportation
2. Sectoral Goals
Define changes inintermediate sectoralindicators
Accessibility (Private/Public access to)• Radio• Telephone--fixed or mobile• Computer• Fax machine• TV• Internet• Post office
AFFORDABILITY (TARIFFS)• Subscription fee• Network connection costs• Monthly payment for telephone/Internet• Cost to reach the nearest public service
Pro-Poor National Information Infrastructure Strategy
Increased Physical Access• Access to ICTs within walking distance
Service Delivery Indicators• Teledensity—residential versus business, urban versus rural,
universal access versus universal services• Employment in the sector• Percent of unsuccessful phone calls• Waiting list for mainlines• Minutes/person/year local and international calls• USD/person/year ICT-sector revenues• Computers per student• Computers per person• Schools/hospitals/government offices online• USD/person/year e-commerce revenues
26
Actions Equity Impacts on Household Influence on Patterns of Growth
Increased Interregional trade, regional integration, andcompetition• Reduced spatial and intertemporal imbalances in supply and
demand• Smaller price differences across regions; smaller income
Empowerment• Satisfaction with city services• Inclusion of all residents, including poor in political and social life of
the city• Increased consumer choices, including housing types and tenures,
and services for the poor• Increased access to credits, including for housing and enterprises
Benefits From Reduced Opportunity Cost• Reduced time spent on collecting water, especially for women and
children, reduced travel time to jobs and market• Consumption benefits resulting from reduced spending on services
Factor Accumulation and Productivity• Increased household income• Less income inequalities• Reduced spending on services• Increased income opportunities for home-based activities and
micro-enterprises• Increased productivity of urban land, labor, and capital• Increased efficiency of cities as marketplaces for goods and
services
Reduced Opportunity Cost• Reduced time spent on collecting water, reduced travel time to
jobs and market
28
Actions Equity Impacts on Household Influence on Patterns of Growth
2. Sectoral Goals
Define changes inintermediate sectoralindicators
Accessibility• Percent of households with access to basic urban services— water,
sanitation, electricity, solid waste collection• Mean travel time to work and schools• School enrollment rates• Access to police and legal system protections• Discrimination in access to services and jobs
Affordability• Percent of household expenditure on potable water, energy,
sanitation, and transportation• House price and income ratio
Service Delivery Indicators• Increased employment• Share of employment in informal sector• Private sector investments, including FDI• Quality of services that private sector receives• Income distribution and urban poverty rates• Productivity of labor• Productivity of capital—private sector• Transaction costs imposed by urban regulations• Costs of urban land development--efficiency of land market
1. Policies: Land, Housing, and Infrastructure3. Tools and Instruments
Define policies andprograms
• Provide tenure security to the poor within the countries’ culturalcontext and communities’ particular needs
• Make infrastructure standards relevant to the needs and affordabilityof urban poor. Flexible standards are important to keep the costslow. Let households make their own trade-offs between costs andquality of services
• Target subsidies to low-income households
• Simplify subscription policies to enable poor become subscribers tourban infrastructure services, allow subscribers to pay fees inaffordable installments
29
Actions Equity Impacts on Household Influence on Patterns of Growth
1. Policies: Land, Housing, and Infrastructure (cont.)• Property rights designed to allow free transactions of property and its use as a collateral by the owner
• Ensure transparency in land supply by openness of transactions and simple rules and regulations.
• Ensure efficiency of urban service delivery. Policies governing urban service delivery should aim to produce outputs that reflect consumerpreferences, at the lowest unit costs permitted by available technology and good management practice.
• Clarify service provision responsibilities and proper division of labor between public and private sectors and among public agencies.
• Encourage private sector participation and competition in service provision, which will increase efficiency and transparency.
• Ensure that the rationale behind financing reflects, first of all, the communal and individual, or public and private, nature of services. Whilesubsidies should be targeted to low-income households, cost effectiveness and cost recovery should be ensured where possible.
2. Policies: Labor and Job Creation
• Support small and micro enterprises by improving regulatory frameworks to decrease constraints on their operations and increasing theiraccess to credits and advisory networks, and by increasing their access to infrastructure.
• Increase access to job opportunities and training. National governments and cities can contribute to employment creation through policyactions such as eliminating regulations which distort labor markets, as well as by supporting well-targeted public works and job training bythe private sector, and by information dissemination.
3. Other Policies
• Develop anticorruption policies. Corrupt management practices in service provision typically lead to increases in supply costs, which in turnresult in increased tariffs or alternatively, mounting financial losses leading to reduced services.
• Initiate capacity building. Incapacity of service provision in cities and cumbersome regulatory requirements lead to various forms ofdeprivations like inadequate water and increase the vulnerability of urban poor.
• Clarify intergovernmental fiscal relations. Unclear responsibilities and conflicting incentives within intergovernmental fiscal relations areamong the major causes of failures in service provision, from which the poor suffer most. Various elements need to be synchronized:
1) Revenue sharing: Decentralization should not just shift basic service expenditures to local governments without revenue sources;2) Taxation: Local authorities should be given authority to levy taxes; 3) Intergovernmental transfers should be allocated on a transparentbasis, such as competitively among municipalities, provided the municipalities with lowest capacity are given assistance in applying forfunds under competitive arrangements; 4) Municipal borrowing: Municipal governments should be provided with channels to accesscredits for financing capital investments.
30
Actions Equity Impacts on Household Influence on Patterns of Growth
4. Programs
• Develop community-driven upgrading programs : Service provisionto the urban poor and upgrading projects should be carried outthrough community-driven principles, and coordinated by municipalgovernments. Community empowerment should be among theobjectives of urban upgrading and service provision projects. Citiesare heterogeneous and different groups may suffer from differenttypes of deprivations. Communities should make their ownpriorities.
• Cooperate with water vendors and other informal-sector providerswhere the municipality or public utility is unable to extend servicessufficiently.
• Create and support public works programs that are typicallyprepared as infrastructure-sector operations to address urbanunemployment and social and economic infrastructure deficiencies.
• Develop microfinance and saving mechanisms . The poor have littleaccess to credits and formal savings programs. Governments canaddress the problem through regulatory changes, and also supportcredit and savings programs carried out by NGOs.
• Create safety nets, including in-kind transfer programs such as childfeeding and vouchers for schooling and housing that supplementincome. Sources of non-governmental safety nets such as NGOprograms can also be fostered as they may be suitable in reaching thepoor who remain outside of formal employment and formal safetynets.
• Institutional and regulatory matters/bottlenecks should beaddressed to scale up integrated packages of multiple services tothe poor (for example, slum upgrading programs) .
• Develop city and nation wide monitoring and evaluation ofservice provision to see inter-city and intra city differences, aswell as incidence of expenditures and benefits
4. Fiscal Implications ofPolicy and ProgramChanges
• Increased payments for services from the poor who can and arewilling to pay if the services respond to their effective demand
• Increased accountability and transparency in public expenditures• Increased cost recovery, decreased burden on public budgets• Good municipal and intergovernmental finance principles
31
Table 6. Infrastructure/Large-and Small-Scale Mining: Impact on Poverty
Actions Equity Impacts on Household Influence on Patterns of Growth
1. Poverty Impacts
Define impact of miningoperations and miningsector on povertyoutcome indicators,based on internationalnorms or countryspecific data
Large-scale and small -scale mining have the potential to improvehuman welfare indicators• Life expectancy and communicable diseases• Maternal and infant mortality rate• School attendance/ and literacy• Reduced household vulnerability
Large-scale and small-scale mining have the potential to generatebenefits to households from reduced opportunity costs• Welfare and consumption benefits from reductions in time spent in
nonremunerated activities
Large-scale and small-scale mining contribute to factor accumulationand productivity• Increased household income• Increased factor, or labor, productivity
Large-scale mining can accelerate growth• Catalytic for of trade and foreign direct investment, and in the
mining area for further investment and small business development• Accelerated economic development (SME sector) and improved
market access in rural and isolated areas
2. Sectoral Goals
Define changes inintermediate sectoralindicators
Large–scale mining has the potential for changing humandevelopment indicators amongst sector employees and their families:• Investment, by mining operation, in training and skill transfer, and
prevention of work related health risks
Large–scale mining has the potential for changing humandevelopment indicators within region of mining operation:• Investment, by mining operation, in accessible:
♦ Basic health services and health education♦ General education and education facilities—schools♦ Community activities♦ Infrastructure, for example, transport, water♦ Community and cooperative activities
Large and small-scale mining have the potential for changing humandevelopment indicators depending on techniques introduced:• Mining techniques applied in relation to health and safety and
environmental damage and water use
Large and small-scale mining have the potential for impacting oncultural profiles of entire regions that need to be monitored:• Cultural distance between miners and indigenous groups• Number of migrant miners and indigenous people
Large-scale mining contributes to factor accumulation—labor andcapital• Employment by mining operation• Employment by lateral and vertical business developing around
mining operation• Investment, by mining operation, in:
♦ Environmental protection and monitoring♦ Public consultation, disclosure of information♦ Post-closure planning♦ Infrastructure–for example, transport, water
• FDI inflow
Large-scale mining indicators to be observed in the context of factoraccumulation:• Ownership structure and degree of state ownership or quasi-state
ownership• Dependency profile of mining region
32
Actions Equity Impacts on Household Influence on Patterns of Growth
3. Tools andInstruments
Define Policies andPrograms
FOR LARGE-SCALE MININGRegulatory policy: Set framework, in context of mining rights:• On closure planning• On environmental and social safeguards and responsibilities, and
public disclosure
Public/private partnership: Include in agreements on mining rightsarrangements concerning investments in:• Health and education services• Local infrastructure• Building local capacity not reliant on mining
Public funding and implementation: Capacity building of localgovernment and communities to:• Manage local infrastructure, social services and fiscal revenues in the
context of local development planning• Manage local revenues for investments anticipating mine closure• Protect indigenous peoples’ rights
FOR SMALL-SCALE MININGPolicy, regulatory and institutional framework:• Promote implementation and enforcement of regulatory framework• Support miners cooperatives in purchasing, mining and
marketing/sales
Public funding and implementation:• Basic health education and services• Education in environmentally sustainable mining techniques• Basic education services• Capacity building for local community based governance structures• Protection of indigenous peoples’ rights
FOR LARGE-SCALE MININGPolicy and regulatory actions• Liberalization, competition policy and privatization of SOEs• Reformed mining code, with legal and regulatory framework for:• Ownership / security of mining rights• Property rights• Carefully developed licensing process• Protection of mining rights• Environmental protection• Legislation for public information/disclosure
Public and private partnership:• Investment in labor market interventions in anticipation of/at mine
closure• Building local capacity not reliant on mining
Public funding and implementation: Investment by local authorities:• Closure planning• Complementary infrastructure and social services
FOR SMALL-SCALE MININGPolicy, regulatory and institutional framework:• Ownership and security of mining rights• Property rights• Carefully developed licensing process
4. Fiscal Implications ofPolicy and ProgramChanges
From large- and small-scale mining• Decreased fiscal expenditure on local government capacity building,
as well as on basic health education and services, and in othereducation and capacity building programs due to financing providedby the mining operators.
From large-scale mining• Increased fiscal income from tariffs and revenues from mining• Increased fiscal income from concessions• Reduced fiscal expenditures initially spent on maintaining state
owned enterprises or on supporting quasi-state owned mining firms• Increased export revenues and foreign exchange income
33
Table 7. Private Sector Development: Impact on Poverty (work in progress)Actions Equity Impacts on Household Influence on
Patterns of Growth
1. Poverty Impacts
Define impact of PSD sectoron poverty outcomeindicators (based oninternational norms orcountry specific data)
CONSUMPTION OF GOODS AND SERVICES• Increased consumption per capita• Changes in the consumption structure--food, clothing, services -
including health and education-- especially in the lowest incomebracket households
• Ability to choose from a wider variety of goods and services to meetspecific needs
SECURITY AND EMPOWERMENT• Improved access to information and communication services• Positive influence of employment on work ethic and households'
self-esteem
BENEFITS FROM REDUCED OPPORTUNITY COSTS• Consumption and welfare benefits from additional income• Increased time for productive activities as well as for relaxation, etc.
GROWTH AND PRODUCTIVITY• Increased employment• Increased GDP per capita• Increase disposable income• Reduced income inequality• Reduced income volatility (increased stability and security)• Improved access to markets and financial services
BENEFITS FROM REDUCED OPPORTUNITY COSTS• Consumption and welfare benefits from additional income• Increased time for productive activities as well as for relaxation,
• Refer to sectoral/infrastructure tablesFACTOR ACCUMULATION AND PRODUCTIVITYCapital• Total investment as percent GDP• Private investment (including FDI) as percent GDP• Public investment as percent GDP
Labor• Overall employment• Employment by economic activity—agriculture, industry,
manufacturing, services• Number of school graduates (quality of labor)• Value-added per worker in industry, manufacturing and services
Land• Percent of productive land• access to and availability of productive land• Percent of total land that can be collateralized• Value of land in productive use
34
Actions Equity Impacts on Household Influence on Patterns of Growth
ECONOMIC STRUCTURE AND FACTOR PRODUCTIVITY
Structural and Technological Change• GDP structure• Private sector share in GDP, employment, output/production• Import and export as percent GDP• Value–added in industry, manufacturing and services as percent
of GDP• Manufacturing exports as percent of total exports--composition
of export• Size of informal sector--production, employment
Process Change• Transaction costs in terms of money and time (TBD)
Infrastructure• Refer to sectoral tables
3. Tools and Instruments
Define Policies andPrograms
Overall policy and business environment• Competition policy—removing barriers to firms' entry and exit; more efficient allocation and usage of resources• Commercial/legal sector and judicial reform - implementing a credible and transparent legal framework for ownership and property rights,
including bankruptcy laws, taxation, labor laws, FDI; improving government administration, transparency and accountability and thusreducing the scope for corruption
Sector-specific laws and regulations• Competition policy• Market liberalization
Private sector development, including privatization• Large firms• Small and medium-size enterprises• Micro firms
Private sector funding of public services through• Taxation of private sector• Cross-subsidies out of user charges (see section on infrastructure)
35
Actions Equity Impacts on Household Influence on Patterns of Growth
Institutional and capacity building• Public- and private sector consultation• Addressing firm level constraints and improving competitiveness through firm learning
4. Fiscal Implications ofPolicy and Program Changes • Reduced transfer payments for unemployed
• Restructuring of subsidies• Increased tax revenue from the private sector• Increased export revenues—foreign exchange income• Reduced subsidies to and arrears with the PE sector