34
Jefferson County Public Utility District OWSI Water System Acquisition Feasibility Study Final Report June 30, 2015

Jefferson County
Public Utility District
OWSI Water System
Acquisition Feasibility Study
Final Report
June 30, 2015

Public Utility District
OWSI Water System Acquisition Feasibility Study
June 30, 2015 | i
Contents
1 Introduction .......................................................................................................................................... 1
2 OWSI Water System Description ........................................................................................................ 1
2.1 Background ............................................................................................................................... 1
2.2 Water Demands ........................................................................................................................ 2
2.3 Key System Components .......................................................................................................... 2
2.4 System Limiting Capacities ....................................................................................................... 4
2.5 Water System Personnel........................................................................................................... 5
3 Needed System Improvements ........................................................................................................... 5
3.1 Identified Capital Improvement Needs ...................................................................................... 5
3.2 Other Considerations ................................................................................................................ 5
4 System Valuation ................................................................................................................................ 7
4.1 Valuation Methodologies Overview ........................................................................................... 7
4.2 Net Operating Income Approach ............................................................................................... 8 4.2.1 Overview of the Net Income Approach ........................................................................ 8 4.2.2 Calculation of Net Income Value .................................................................................. 9
4.3 Replacement Cost New Less Depreciation (RCNLD) ............................................................. 10 4.3.1 Overview of the RCNLD Approach ............................................................................ 10 4.3.2 Calculation of Replacement Cost New Less Depreciation......................................... 10
4.4 Book Value .............................................................................................................................. 12 4.4.1 Overview of the Book Value Approach ...................................................................... 12 4.4.2 Calculation of Book Value .......................................................................................... 12
4.5 Summary of OWSI Water System Valuation........................................................................... 13
5 Financing Strategies .......................................................................................................................... 13
5.1 Acquisition Financing .............................................................................................................. 13
5.2 Customer Rate Comparison .................................................................................................... 14
Tables
Table 1. Water Demand Forecast ........................................................................................................... 2
Table 2. Water Rights Summary ............................................................................................................. 3
Table 3. Water Supply Wells ................................................................................................................... 3
Table 4. Water Storage Reservoirs ......................................................................................................... 4
Table 5. Water System Transmission Piping .......................................................................................... 4
Table 6. Summary of Capacity Limiting Factors ...................................................................................... 4
Table 7. Utility Rate Setting Models Cash and Utility Basis .................................................................... 9
Table 8. Net Operating Income Value ................................................................................................... 10
Table 9. Replacement Cost New Less Depreciation ............................................................................. 11
Table 10. Book Value Approach .............................................................................................................. 12
Table 11. Valuation Results for OWSI ..................................................................................................... 13
Table 12. Comparison of the Residential Water Rates ........................................................................... 14
Public Utility District OWSI Water System Acquisition Feasibility Study
ii | June 30, 2015
Figures
Figure 1. OWSI Water System Service Area (Exhibit 1-1 from WSP) .................................................... 17
Figure 2. OWSI Water System Key Features (Exhibit 5-1 from WSP) ................................................... 18
Figure 3. Summary of Water Supply Capacity Analyses ........................................................................ 19
Figure 4. OWSI Organizational Chart ..................................................................................................... 20
Figure 5. OWSI Capital Improvement Program ...................................................................................... 21
Appendix
Water System Valuation Analysis
Public Utility District
OWSI Water System Acquisition Feasibility Study
June 30, 2015 | 1
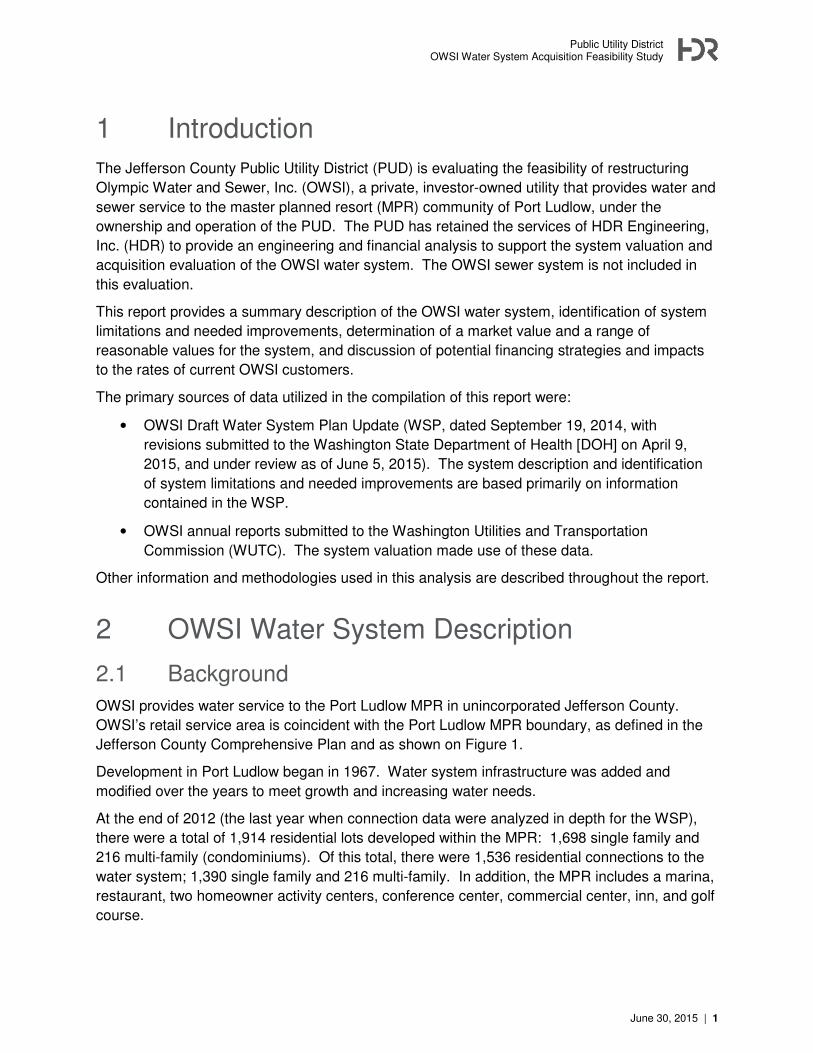
1 Introduction
The Jefferson County Public Utility District (PUD) is evaluating the feasibility of restructuring
Olympic Water and Sewer, Inc. (OWSI), a private, investor-owned utility that provides water and
sewer service to the master planned resort (MPR) community of Port Ludlow, under the
ownership and operation of the PUD. The PUD has retained the services of HDR Engineering,
Inc. (HDR) to provide an engineering and financial analysis to support the system valuation and
acquisition evaluation of the OWSI water system. The OWSI sewer system is not included in
this evaluation.
This report provides a summary description of the OWSI water system, identification of system
limitations and needed improvements, determination of a market value and a range of
reasonable values for the system, and discussion of potential financing strategies and impacts
to the rates of current OWSI customers.
The primary sources of data utilized in the compilation of this report were:
• OWSI Draft Water System Plan Update (WSP, dated September 19, 2014, with
revisions submitted to the Washington State Department of Health [DOH] on April 9,
2015, and under review as of June 5, 2015). The system description and identification
of system limitations and needed improvements are based primarily on information
contained in the WSP.
• OWSI annual reports submitted to the Washington Utilities and Transportation
Commission (WUTC). The system valuation made use of these data.
Other information and methodologies used in this analysis are described throughout the report.
2 OWSI Water System Description
2.1 Background
OWSI provides water service to the Port Ludlow MPR in unincorporated Jefferson County.
OWSI’s retail service area is coincident with the Port Ludlow MPR boundary, as defined in the
Jefferson County Comprehensive Plan and as shown on Figure 1.
Development in Port Ludlow began in 1967. Water system infrastructure was added and
modified over the years to meet growth and increasing water needs.
At the end of 2012 (the last year when connection data were analyzed in depth for the WSP),
there were a total of 1,914 residential lots developed within the MPR: 1,698 single family and
216 multi-family (condominiums). Of this total, there were 1,536 residential connections to the
water system; 1,390 single family and 216 multi-family. In addition, the MPR includes a marina,
restaurant, two homeowner activity centers, conference center, commercial center, inn, and golf
course.

Public Utility District OWSI Water System Acquisition Feasibility Study
2 | June 30, 2015
2.2 Water Demands
Current (2012) OWSI water usage is approximately 270,000 gallons per day (gpd) on an
average day demand (ADD) basis and 590,000 gpd on a maximum day demand (MDD) basis,
reflecting a peaking factor of roughly 2.2. Growth is anticipated to be slow in the short-term,
with full build-out of the water system occurring just beyond the 20-year planning horizon. The
demand forecast is summarized in Table 1.
Table 1. Water Demand Forecast
Year Average Day Demand (gpd) Maximum Day Demand (gpd)
2012 270,000 590,000
2020 310,000 780,000
2034 400,000 1,000,000
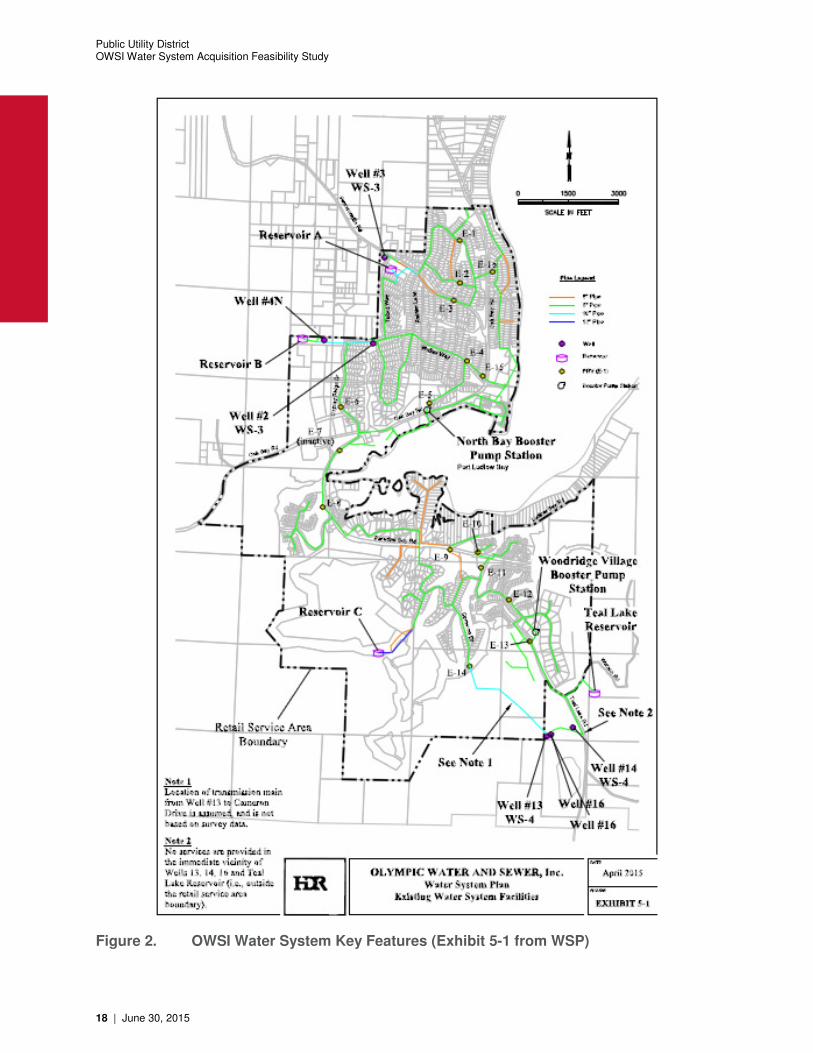
2.3 Key System Components
The service area is comprised of two distinct service zones. Service Zone A refers to the
developed area north of Port Ludlow Bay, and Service Zone B refers generally to the area south
of the bay.
Service Zone A receives its water supply from three groundwater wells having a present
combined pumping capacity of approximately 310 gallons per minute (gpm). Storage is
provided by two ground-level steel reservoirs, with a combined capacity of approximately
450,000 gallons. Water is conveyed to two pressure zones within Service Zone A. Water
treatment for the removal of iron and manganese is provided at two of this service zone’s wells.
Service Zone B receives its water supply from two groundwater wells having a present
combined pumping capacity of approximately 475 gpm. Storage is provided by two ground-
level steel reservoirs, with a combined capacity of approximately 445,000 gallons. Water is
conveyed to eight pressure zones within Service Zone B.
Details regarding the system’s water rights, wells, reservoirs, and distribution piping are
provided in Tables 2 through 5. The key system features are depicted in Figure 2.

Public Utility District
OWSI Water System Acquisition Feasibility Study
June 30, 2015 | 3
Table 2. Water Rights Summary
Water Right No. Qa (afy) (1)
Qi (gpm) (2)
Service Zone A
Well 2 G2-00194C 120 150
Well 3 G2-00193C 88 110
Well 4N G2-25627C 122 150
Sub-Total 330 410
Service Zone B
Active Wells(3)
Well 13 G2-25816C 35 (45 S) 175
Well 14
Well 13, 14, 16
G2-27492P
G2-30442P
(161 S)
90
300
100
Sub-Total 125 (206 S) 575
Inactive Wells
Well 4A G2-21542C 30 23
Well 9 G2-21543C 70 46
Sub-Total 100 69
System Total 555 1,054
Notes: afy = acre-feet per year; gpm = gallons per minute
Information in this table is based on information in Department of Ecology’s water right records.
(1) Annual quantity. Numbers in parentheses indicate supplemental quantities, which are not additive to primary quantities.
(2) Instantaneous quantities.
(3) The water rights for Wells 13 and 14 include Well 16 as an additional point of withdrawal.
Table 3. Water Supply Wells
Well Name Current Pumping Capacity (1)
(gpm) Date Drilled
Service Zone A
Well 1 (inactive) NA December 1941
Well 2 120 April 1967
Well 3 74 November 1968
Well 4N 115 April 1980
Service Zone B
Well 4A (inactive) NA September 1972
Well 9 (inactive) NA October 1972
Well 13 (emergency) 130 August 1975
Well 14 155 (2)
October 1988
Well 16 320 October 2005
Notes:
(1) Based on OWSI pumping records as of December 2013.
(2) Rated capacity is 300 gpm; however, its capacity is limited to 155 gpm when pumping with Well 16 so as to maintain a blended arsenic concentration within acceptable levels.

Public Utility District OWSI Water System Acquisition Feasibility Study
4 | June 30, 2015
Table 4. Water Storage Reservoirs
Name Diameter (ft) Overflow Height (ft)
Base Elev (ft)
Overflow HGL (ft)
Total Volume (gallons)
Reservoir A 28 32 411 443 147,386 Reservoir B 40 31.5 411.5 443 296,089 Reservoir C 27.5 38.5 329 367.5 171,048 Teal Lake Reservoir 32 44.5 497.5 542 267,702 Notes: HGL = Hydraulic Grade Line
Table 5. Water System Transmission Piping Diameter (in.) Length (ft) 6 12,169 8 83,353 10 7,203 12 1,326
Total 104,051
2.4 System Limiting Capacities
The WSP contains an analysis of the capacities of the key system components (water rights,
pumping capacity, and storage) to determine the system’s carrying capacities and limiting
factors. Table 6 summarizes this analysis, with water demands presented in the form of
Equivalent Residential Units (ERUs). The system’s existing source and storage capacities are
sufficient to support projected 20-year growth. This is also depicted graphically in Figure 3. The
most limiting system component is source pumping, at a current maximum capacity of 2,592
ERUs.
Table 6. Summary of Capacity Limiting Factors
ERU Projections (1)
Carrying Capacities (2)
Current (2012)
6-Year (2020)
20-Year (2034)
Water Rights
(3)
Source Pumping Storage
Total System 1,444 1,682 2,164 2,676 2,592 3,426 Sub-Areas Service Zone A 548 616 771 1,080 1,082 1,794 Service Zone B 896 1,066 1,393 1,596 1,510 1,632 Woodridge Village BPS
(4) 35 36 36 NA 44 NA
Notes:
ERU = Equivalent Residential Unit; NA = Not Applicable
(1) Year 2013 is defined as the “base” year for projection purposes. Year 2012 data are shown as “current,” as they represent the most recent complete year of water production and usage information (as of the time of this analysis). One future ERU is equal to an average day demand of 185 gallons per day (gpd) per single-family household. The associated maximum day demand is 464 gpd per household. ERU projections include both residential and commercial ERUs.
(2) Maximum number of ERUs supported by existing or planned facilities.
(3) All carrying capacities are based on comparison of annual water rights (Qa) with average day demand, as annual quantities are more limiting than instantaneous quantities.
(4) Woodridge Village ERUs are included in the Service Zone B sub-total. Water supply to the Woodridge Village subdivision is boosted by a booster pump station (BPS). Water rights analysis for this small area alone is not applicable; it is included in the Service Zone B analysis. No storage is provided in the subdivision; a fire flow pump provides the required fire flow.

Public Utility District
OWSI Water System Acquisition Feasibility Study
June 30, 2015 | 5
2.5 Water System Personnel
The personnel that manage and operate the OWSI water system are included in the overall
OWSI organizational chart provided in Figure 4. The system currently has four certified water
system operators, including the operations supervisor.
3 Needed System Improvements
3.1 Identified Capital Improvement Needs
The OWSI water system has operated well in recent years, providing reliable water service to its
customers. However, as with all systems, improvements and modifications are occasionally
necessary to maintain compliance with regulatory requirements.
The WSP identifies capital improvements to address deficiencies in the system and provide
improvements to system operation. The complete capital improvement program (CIP) is
provided in Figure 5. Of the projects listed in OWSI’s current CIP, there are two that serve to
address key regulatory or infrastructure deficiencies. Other items listed in the CIP are not as
critical, do not address a primary regulatory requirement or deficiency that necessitates
immediate attention, and are therefore not discussed in detail below nor are they considered in
the valuation of the system in Section 4. The two primary CIP items are:
1) Well No. 18 Design and Construction. $250,000. Well 18 is the planned development
of a replacement well for Well 2 in Service Zone A, whose production has declined. This
improvement is necessary to bolster the reliability of supply to this portion of the system.
2) Improvements in High Elevation Area near Reservoir A. $200,000. This project
involves further evaluation of the high elevation area surrounding Reservoir A. Portions
of this area experience static pressures less than the required 30 psi. Pressures are
significantly reduced during modeled fire flow events. Presently, residences have
individual, private booster pumps to maintain pressures during normal operating
conditions. A potential remedy includes the construction of a booster pump station to
serve this discreet area, which is comprised of approximately 100 parcels.
Because these projects are needed to address identified system deficiencies, their costs are
factored into the system valuation discussed in Section 4.
3.2 Other Considerations
Beyond the CIP items discussed in Section 3.1, there are other items the PUD should bear in
mind when considering the potential purchase of the OWSI water system, as summarized
below.
a) Hydrocarbon Contamination at Walker Way. Well 2 is located at 781 Walker Way in
Service Zone A. It was noted in the Robinson Noble 2005 Annual Report on the Port
Ludlow Area Groundwater Monitoring Program that the well was becoming inefficient,
which led to the decision to drill a replacement well (designated Well 17) on the same
site, approximately 150 feet away from the existing wellhead. Drilling commenced in

Public Utility District OWSI Water System Acquisition Feasibility Study
6 | June 30, 2015
early 2009 and proceeded without incidence to a depth of 50 feet where hydrocarbon
odors were observed. Drilling ceased and an investigation was undertaken. It was
determined that the source of the “contamination” was residual gasoline from
underground storage tanks (USTs) that were removed in 1990. While the former
presence of these tanks and small amount of contamination was documented, the
conclusion of the geotechnical report for the tank removal indicated that there was little
likelihood of the contamination migrating as it was contained beneath a building (the
reason for the contaminated soil not being removed in 1990).
The investigation is detailed in Site Characterization Report, Olympic Water & Sewer
Inc. Property, 781 Walker Way, Port Ludlow, Washington, SLR International Corp,
December 17, 2010, wherein the aerial and vertical extent of the contamination was
defined. The conclusion is that the existing Well 2 is upgradient of and not impacted by,
the hydrocarbon contamination. Annual VOC analysis performed on the well since the
discovery confirms this conclusion.
In 2013, an agreement was reached with the former property owner whereby the third
party (Pope Resources) would enter the Department of Ecology Voluntary Cleanup
Program (VCP) in order to obtain a No Further Action (NFA) determination for the
property. That VCP (identification number SW1311) has been entered into, and a draft
remediation plan is under review. The preferred alternative contained within that draft
plan is predicated on natural attenuation and continued monitoring.
Although a NFA has not yet been issued by Ecology, it is HDR’s understanding, based
upon the above summary of actions, that the OWSI water system bears no liability
regarding this contamination. Furthermore, as noted previously, the site characterization
and recent water quality sampling indicates that the nearby Well 2 has not been, and is
not anticipated to be, impacted by the contamination.
b) Manganese-Related Customer Complaints. Manganese levels in Wells 14 and 16, in
Service Zone B, are slightly elevated and have led to some customer complaints. OWSI
has begun investigating this issue and exploring options to resolve it. At this time, no
specific solution has yet been arrived at. The potential options are quite varied, ranging
from adjusting the flow of water in this portion of the system through the closing of
specific valves (minimal cost) to implementation of sequestration or filtration processes
to remove the manganese (a project that could cost in excess of $1,000,000). This is an
aesthetic issue, and does not relate to a public health concern or regulatory deficiency.
As such, it is not factored into the system valuation described in Section 4. However,
the PUD should recognize it as an issue that may potentially have associated costs in
the future. It is possible that the PUD may be able to address this, at least in part,
through the use of a currently unused filtration system that it owns; however, the
applicability of that system to these wells has not been fully evaluated.
c) Additional Desired System Improvements. While the above analysis has focused on
previously identified needs and improvements, mainly from a regulatory perspective, it is
important to consider additional upgrades that the PUD may desire, to bring the
operation of the OWSI system inline with current operation of other PUD systems. For
example, the PUD may desire to convert customer meters to the drive-by automated

Public Utility District
OWSI Water System Acquisition Feasibility Study
June 30, 2015 | 7
meter reading (AMR) system that it utilizes elsewhere. The costs of such an upgrade
are not considered in the system valuation presented in Section 4, since it is not required
to meet functional or regulatory system requirements. However, the PUD may elect to
consider such items when deciding whether or not to pursue acquisition of the system.
4 System Valuation
The valuation of the OWSI water system was completed using generally accepted valuation
methods. The approach was guided by the following objectives:
• Utilization of conventional cost valuation approaches
• Identification of considerations, financial and others, influencing the values established
• Establish a range of system values.
HDR relied on information provided by OWSI to develop portions of the valuation study. Other
sources of information include state agencies, the laws and rules of the State of Washington,
and other water utility industry personnel. The goal of this analysis is to establish a range of
values for OWSI’s water system using generally accepted methods. Generally accepted
methods used in determining the water system’s value are:
• Net Operating Income Approach
• Replacement Cost New Less Depreciation (RCNLD)
• Book Value.
4.1 Valuation Methodologies Overview
In the development of valuation studies, there are several approaches used to determine the
value of a water system. The net operating income approach is based on the income received
or earned by the owner/operator(s), the RCNLD approach determines the value of rebuilding the
system to current conditions, and the final approach is based on the current book value of the
system. Each of these is discussed in more detail below.
Calculating the value under the net operating income approach requires historical documents
such as income statements and balances sheets to determine the annual revenues and
expenses of the system. The information used in this study was taken from the annual reports,
which were submitted to the WUTC and supplied by Olympic Water & Sewer, Inc.
When calculating the RCNLD and the book value, detailed asset listings are utilized for the
valuation. The RCNLD value is then determined at today’s construction cost less all
accumulated depreciation expense. The book value is simply the original cost of the assets less
the accumulated depreciation of those assets. This number provides a base value on the asset
of the system and the current asset lives.
Public Utility District OWSI Water System Acquisition Feasibility Study
8 | June 30, 2015
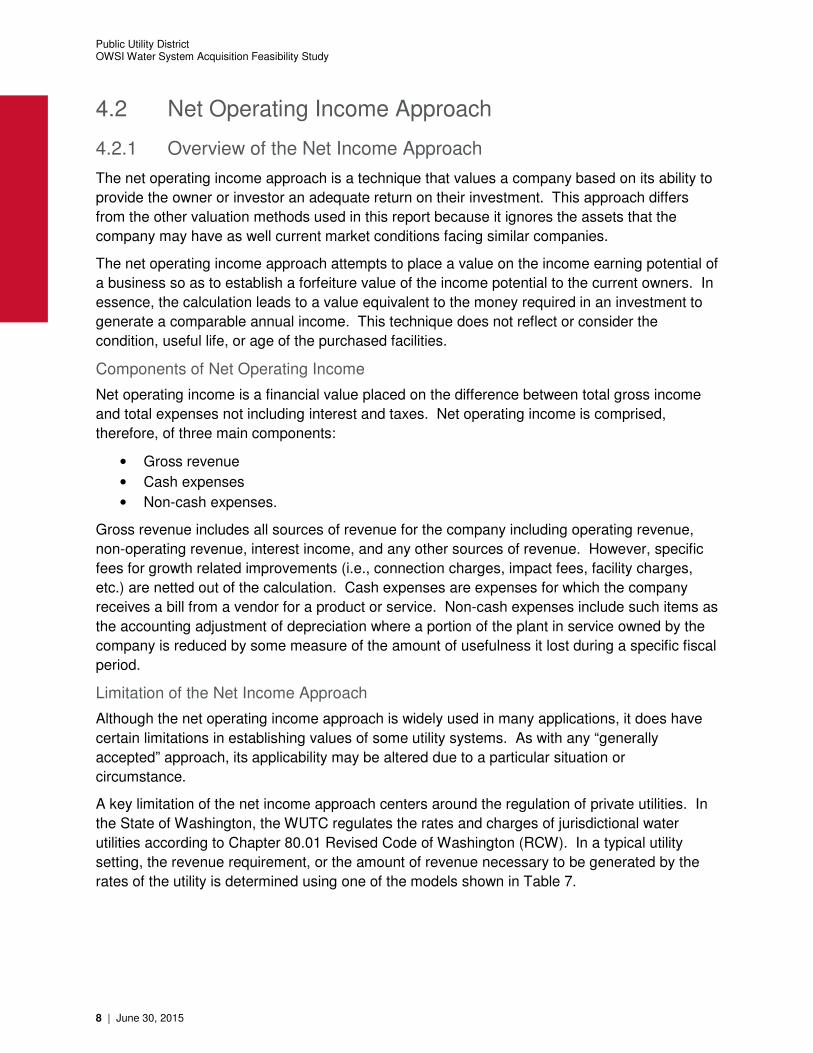
4.2 Net Operating Income Approach
4.2.1 Overview of the Net Income Approach
The net operating income approach is a technique that values a company based on its ability to
provide the owner or investor an adequate return on their investment. This approach differs
from the other valuation methods used in this report because it ignores the assets that the
company may have as well current market conditions facing similar companies.
The net operating income approach attempts to place a value on the income earning potential of
a business so as to establish a forfeiture value of the income potential to the current owners. In
essence, the calculation leads to a value equivalent to the money required in an investment to
generate a comparable annual income. This technique does not reflect or consider the
condition, useful life, or age of the purchased facilities.
Components of Net Operating Income
Net operating income is a financial value placed on the difference between total gross income
and total expenses not including interest and taxes. Net operating income is comprised,
therefore, of three main components:
• Gross revenue
• Cash expenses
• Non-cash expenses.
Gross revenue includes all sources of revenue for the company including operating revenue,
non-operating revenue, interest income, and any other sources of revenue. However, specific
fees for growth related improvements (i.e., connection charges, impact fees, facility charges,
etc.) are netted out of the calculation. Cash expenses are expenses for which the company
receives a bill from a vendor for a product or service. Non-cash expenses include such items as
the accounting adjustment of depreciation where a portion of the plant in service owned by the
company is reduced by some measure of the amount of usefulness it lost during a specific fiscal
period.
Limitation of the Net Income Approach
Although the net operating income approach is widely used in many applications, it does have
certain limitations in establishing values of some utility systems. As with any “generally
accepted” approach, its applicability may be altered due to a particular situation or
circumstance.
A key limitation of the net income approach centers around the regulation of private utilities. In
the State of Washington, the WUTC regulates the rates and charges of jurisdictional water
utilities according to Chapter 80.01 Revised Code of Washington (RCW). In a typical utility
setting, the revenue requirement, or the amount of revenue necessary to be generated by the
rates of the utility is determined using one of the models shown in Table 7.

Public Utility District
OWSI Water System Acquisition Feasibility Study
June 30, 2015 | 9
Table 7. Utility Rate Setting Models Cash and Utility Basis
Cash Basis Utility (Accrual) Basis
+ O&M Expense + O&M Expense + Taxes + Taxes + Capital Improvements Financed with Operating Revenues
+ Depreciation Expense
+ Debt Service + Return on Investment (Rate Base x Rate of Return)
= Revenue Requirement = Revenue Requirement
Most municipal utilities use the cash basis approach, while most regulated utilities use the utility
basis approach. OWSI uses the utility basis for accounting purposes. The rate setting
approach generally used by the WUTC is the utility basis. This method allows a regulated utility
to recover the reasonable cost of operations as well as a return on the investment as
recognized by the WUTC.
For a regulated utility, the “return on investment” is its net operating income. Return on
investment is calculated by multiplying the allowed rate of return by the recognized rate base of
the utility. Both the allowed rate of return and recognized rate base are determined by the
WUTC. Net operating expenses, taxes, and depreciation expense are added to the calculated
return on investment to determine the utility’s revenue requirement. This revenue requirement
is then spread over the customer base to establish the rate level. Therefore, the net incomes of
privately owned water systems in the State of Washington are set by the WUTC. Regulation of
a utility limits the applicability of this approach because WUTC intervention can change the
values of any or all of the components of the utility rate setting models, thereby impacting the
results of the net operating income analysis.
4.2.2 Calculation of Net Income Value
HDR performed the net operating income using OWSI’s 2014 Annual Report filed with the
WUTC. Additional detailed data was supplied to HDR by OWSI staff. The following discusses
the calculation of the net income value.
Net Operating Income
The first component of this approach was to determine the net operating income for OWSI over
a historical time period. For this analysis, the 2014 income statement was used to develop the
net operating income of OWSI’s water system. Given the 2014 results, the analysis projected
revenues and expenses through 2025. The projection was based on HDR’s recent water rate
study completed for OWSI. Given these assumptions, the net income was calculated for 2014
through 2025. For purposes of calculating the net operating income for the valuation study the
results for 2014 and projected 2015 were the focus of the analysis.
Rate of Return
To calculate the appropriate rate of return, HDR reviewed the previous OWSI filings to the
WUTC. Historically, the WUTC was observing a range of return components from 4% to 12%.
Part of the reason for such a wide variation in utility rates of return is the cost of debt (e.g.,
Drinking Water State Revolving Fund Loans (DWSRF) vs. revenue bonds, etc.). Utilizing the
Public Utility District OWSI Water System Acquisition Feasibility Study
10 | June 30, 2015
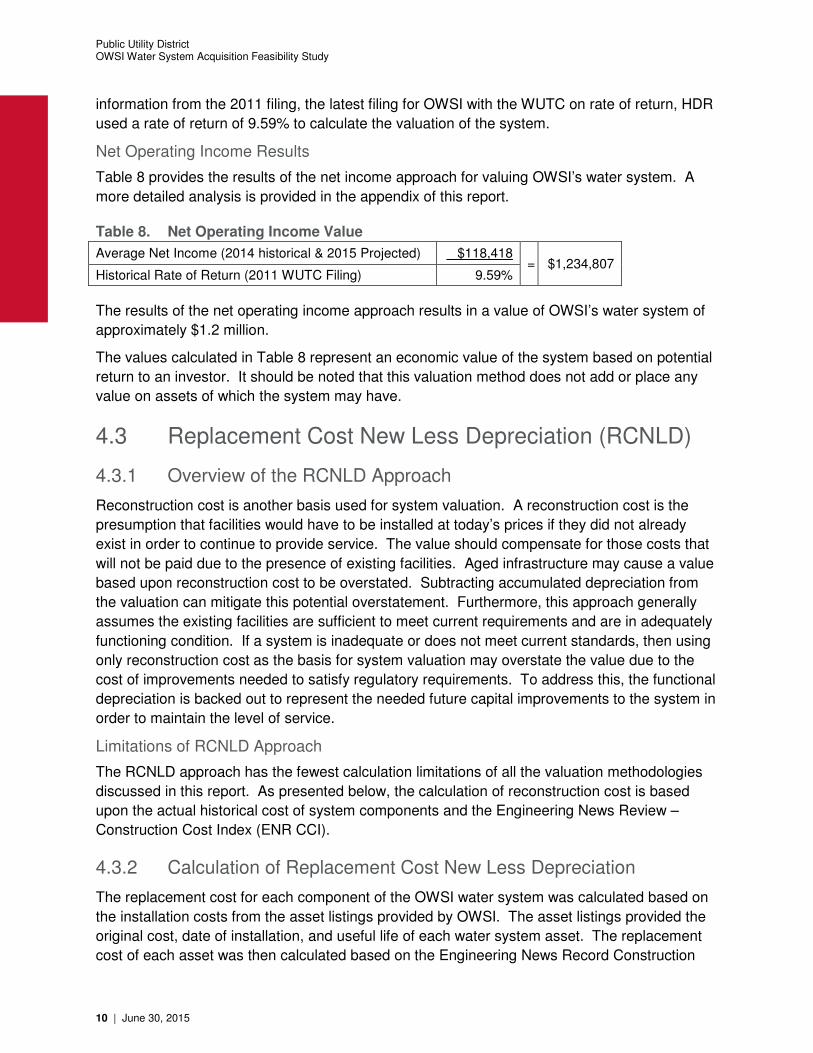
information from the 2011 filing, the latest filing for OWSI with the WUTC on rate of return, HDR
used a rate of return of 9.59% to calculate the valuation of the system.
Net Operating Income Results
Table 8 provides the results of the net income approach for valuing OWSI’s water system. A
more detailed analysis is provided in the appendix of this report.
Table 8. Net Operating Income Value
Average Net Income (2014 historical & 2015 Projected) $118,418 = $1,234,807
Historical Rate of Return (2011 WUTC Filing) 9.59%
The results of the net operating income approach results in a value of OWSI’s water system of
approximately $1.2 million.
The values calculated in Table 8 represent an economic value of the system based on potential
return to an investor. It should be noted that this valuation method does not add or place any
value on assets of which the system may have.
4.3 Replacement Cost New Less Depreciation (RCNLD)
4.3.1 Overview of the RCNLD Approach
Reconstruction cost is another basis used for system valuation. A reconstruction cost is the
presumption that facilities would have to be installed at today’s prices if they did not already
exist in order to continue to provide service. The value should compensate for those costs that
will not be paid due to the presence of existing facilities. Aged infrastructure may cause a value
based upon reconstruction cost to be overstated. Subtracting accumulated depreciation from
the valuation can mitigate this potential overstatement. Furthermore, this approach generally
assumes the existing facilities are sufficient to meet current requirements and are in adequately
functioning condition. If a system is inadequate or does not meet current standards, then using
only reconstruction cost as the basis for system valuation may overstate the value due to the
cost of improvements needed to satisfy regulatory requirements. To address this, the functional
depreciation is backed out to represent the needed future capital improvements to the system in
order to maintain the level of service.
Limitations of RCNLD Approach
The RCNLD approach has the fewest calculation limitations of all the valuation methodologies
discussed in this report. As presented below, the calculation of reconstruction cost is based
upon the actual historical cost of system components and the Engineering News Review –
Construction Cost Index (ENR CCI).
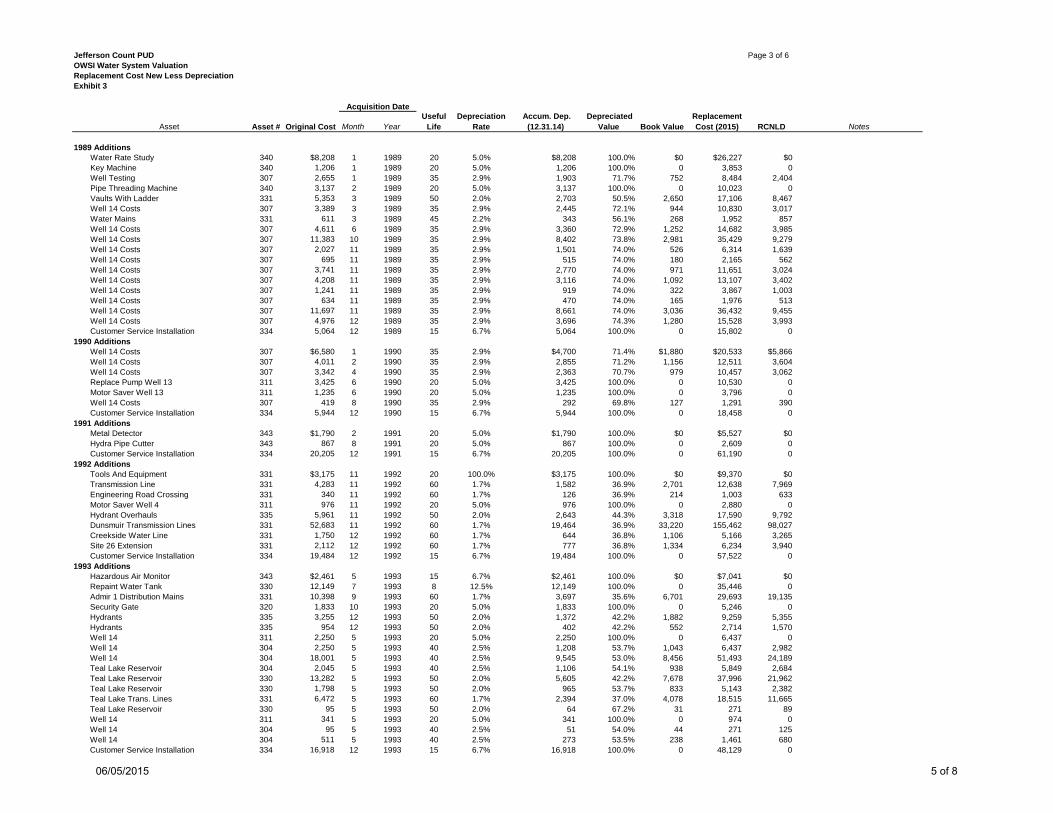
4.3.2 Calculation of Replacement Cost New Less Depreciation
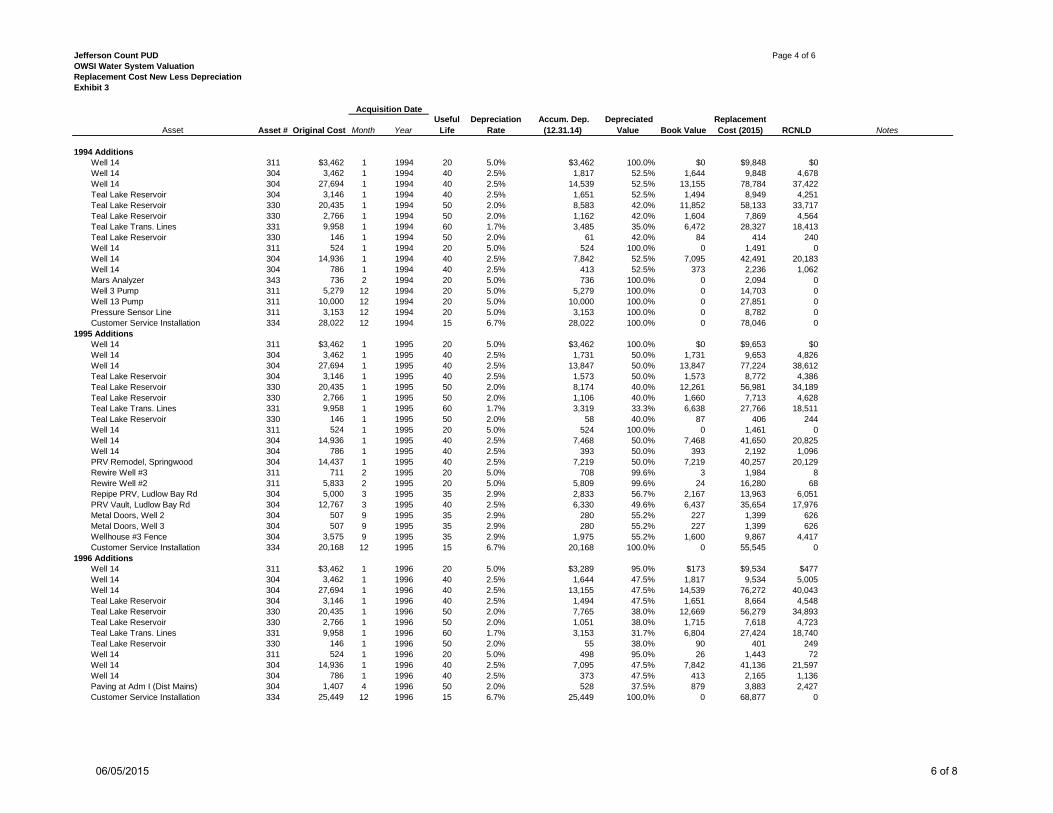
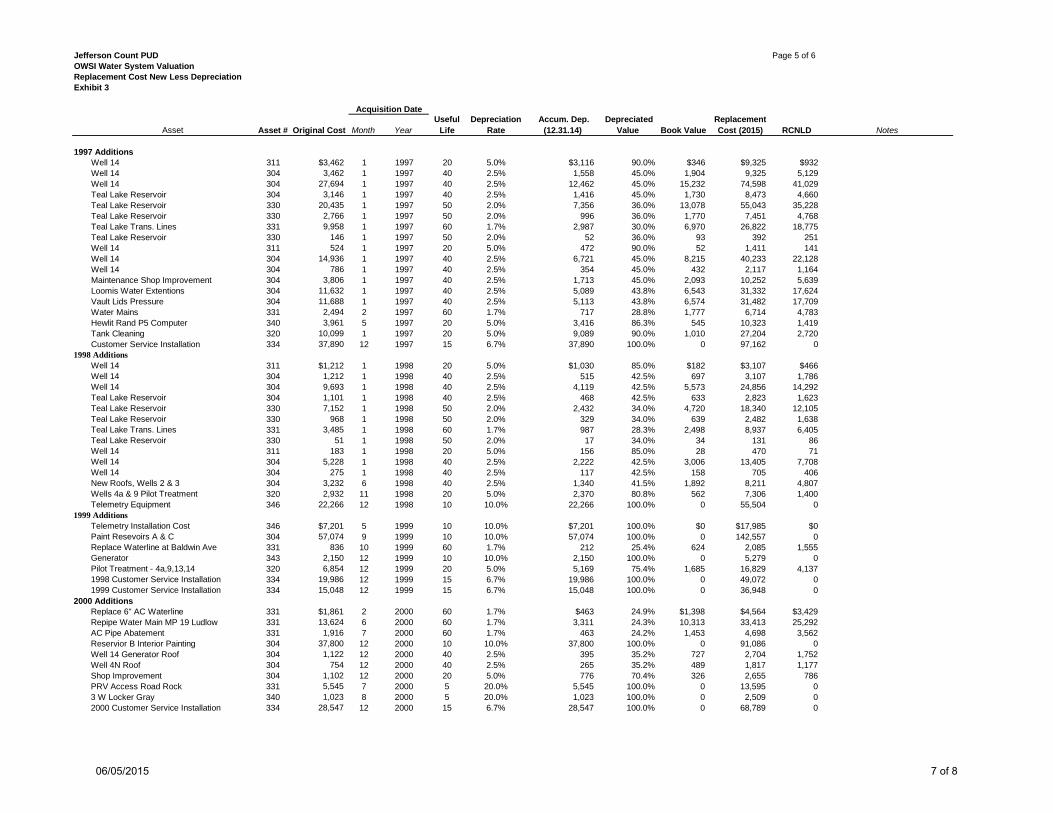
The replacement cost for each component of the OWSI water system was calculated based on
the installation costs from the asset listings provided by OWSI. The asset listings provided the
original cost, date of installation, and useful life of each water system asset. The replacement
cost of each asset was then calculated based on the Engineering News Record Construction

Public Utility District
OWSI Water System Acquisition Feasibility Study
June 30, 2015 | 11
Cost Index (ENR CCI) and the difference between the installation date and the February 2015
value of the ENR CCI. The ENR-CCI is an engineering industry generally accepted accounting
of construction costs in areas throughout the U.S. For this analysis, the Seattle based ENR-CCI
was used to represent the change in costs of construction since the asset installation dates to
February 2015.
In order to account for physical depreciation from the loss of usefulness of infrastructure due to
wear and tear over time, the assets were depreciated based on the current depreciation amount
provided in the asset listing. The replacement cost was calculated based on the original cost
and the year in which it was installed and adjusted by the appropriate ENR CCI factor. The total
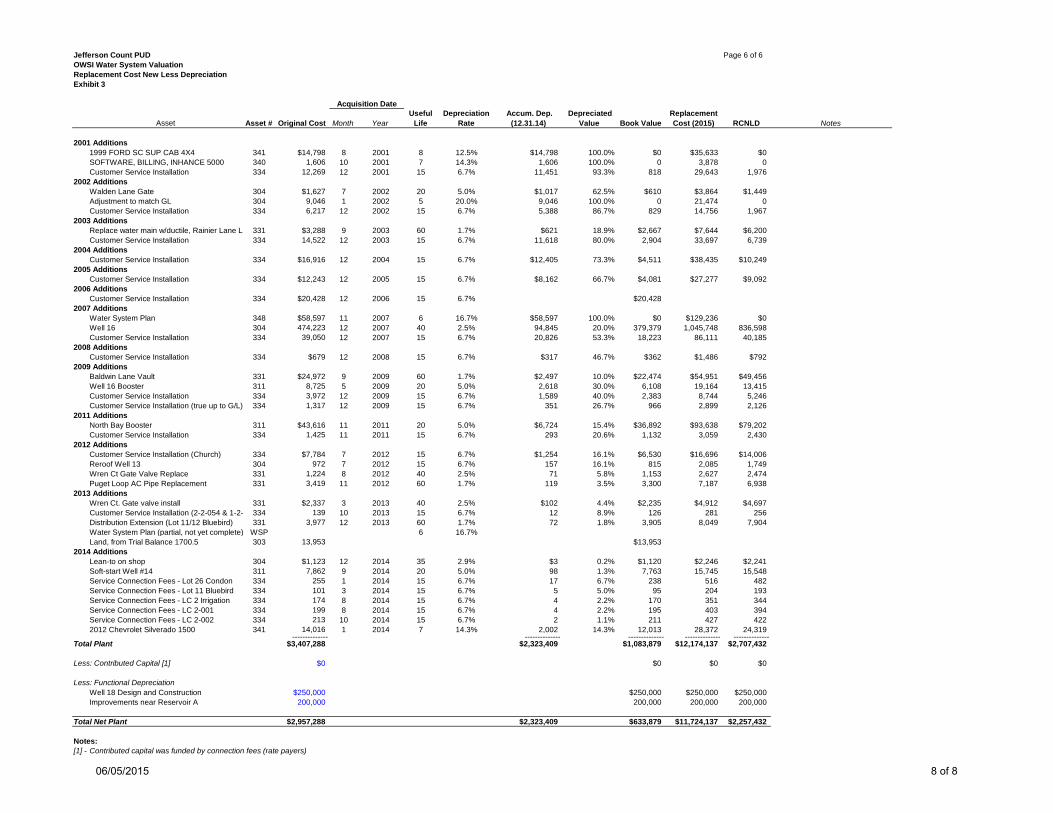
replacement cost of the system is $12,174,137. The replacement cost is then decreased by the
percent, or value, that the asset has depreciated to determine the replacement cost new less
depreciation. The replacement cost new less depreciation value of the OWSI water system was
$2,707,432. A summary of the calculation of the replacement cost new less depreciation is
shown in Table 9.
Table 9. Replacement Cost New Less Depreciation
Replacement Cost New $12,174,137
Less: Depreciation (9,466,705)
Replacement Cost New Less Depreciation (RCNLD) $2,707,432
Less: Contributed Capital (0)
Less: Functional Depreciation (450,000)
Adjusted RCLD Value $2,257,232
The reconstruction cost less accumulated physical depreciation value was then further reduced
by any contributions or functional depreciation of the water system. As stated earlier,
deficiencies in infrastructure can cause the calculated reconstruction cost to be overstated.
Provided below is a discussion of this functional deficiency.
Typically, in a replacement cost analysis, the contributed capital that has been deeded to the
utility is backed out as the utility did not invest in said capital and it should therefore not be
compensated for such. However, in the case of OWSI, the contributed capital was paid for by
rate payers in the form of connection charges, which are reimbursements to OWSI for
infrastructure funded by OWSI. Therefore, the contributed capital is not backed out in this
instance because it was a reimbursement to OWSI for infrastructure funded by OWSI.
One of the aforementioned pitfalls of the replacement cost new less depreciation approach is
that it fails to take into account the level of service that the system will provide going forward.
This view should also consider any additions, maintenance, improvements, etc. that may need
to be completed to maintain the system at its current level of service. To address this,
functional depreciation is used to adjust the system value for any projects that may need to
happen in the future to improve the system. To do this, the CIP was examined to identify any
projects that would fit the above definition to match the intent of functional depreciation. After
the CIP was explored, two future projects were identified: the Well 18 design and construction
costing $250,000 and the improvements near Reservoir A costing $200,000. Both of these
values were then backed out of the RCNLD figure to determine the adjusted replacement cost
new less depreciation.

Public Utility District OWSI Water System Acquisition Feasibility Study
12 | June 30, 2015
Summary of the RCNLD Approach
The calculated adjusted replacement cost new less accumulated physical and functional
depreciation value for the System is $2,257,432. The calculation showing all components of the
water system value is shown in the appendix. It should be emphasized that this analysis was
based upon the information made available to HDR for the purposes of this valuation study.
4.4 Book Value
4.4.1 Overview of the Book Value Approach
The book value approach is similar to the replacement cost new less depreciation whereby they
both start with the system’s asset listing and detail. When attempting to valuate a system, it is
important to seek a range of values. Part of the range is creating ‘book ends’ so to speak, and
the book value approach aims to provide a book end to the range. Typically, it will produce the
low end of the range, providing the lowest valuation of the system. The approach takes the
original cost of the assets and backs out depreciation. In this analysis, and similarly to the
replacement cost new less depreciation approach, contributed capital and functionalized
depreciation were deducted.
Limitations of Approach
As with any approach to valuing a system, there are advantages and disadvantages to each
and it is important to manage expectations and identify those issues. Just like in the RCNLD
approach, it is difficult to incorporate the condition of assets, not just their age or useful life.
Also, this approach does not take into account the financial detail that the net income approach
would include.
4.4.2 Calculation of Book Value
The analysis begins with the asset schedule and details about original cost, acquisition date
depreciation rate, useful life, etc. With all of these, the book value can be calculated. The
original cost is the starting point, then the accumulated depreciation is backed out. If it is a
straight-line depreciated asset, the accumulated depreciation can be calculated by dividing the
original cost by the useful life and that will produce the annual depreciation. Multiply that
number by the number of years since the acquisition date and that equals the accumulated
depreciation. The results of the analysis are presented in Table 10.
Table 10. Book Value Approach
Original Cost $3,407,288
Less: Accumulated Depreciation ($2,323,409)
Book Value $1,083,879
Less: Contributed Capital ($0)
Less: Functional Depreciation ($450,000)
Net Book Value $633,879
Public Utility District
OWSI Water System Acquisition Feasibility Study
June 30, 2015 | 13
Summary of the Book Value Approach
The book value approach arrived at a system value of $633,879. For greater depth regarding
the book value approach please refer to the appendix.
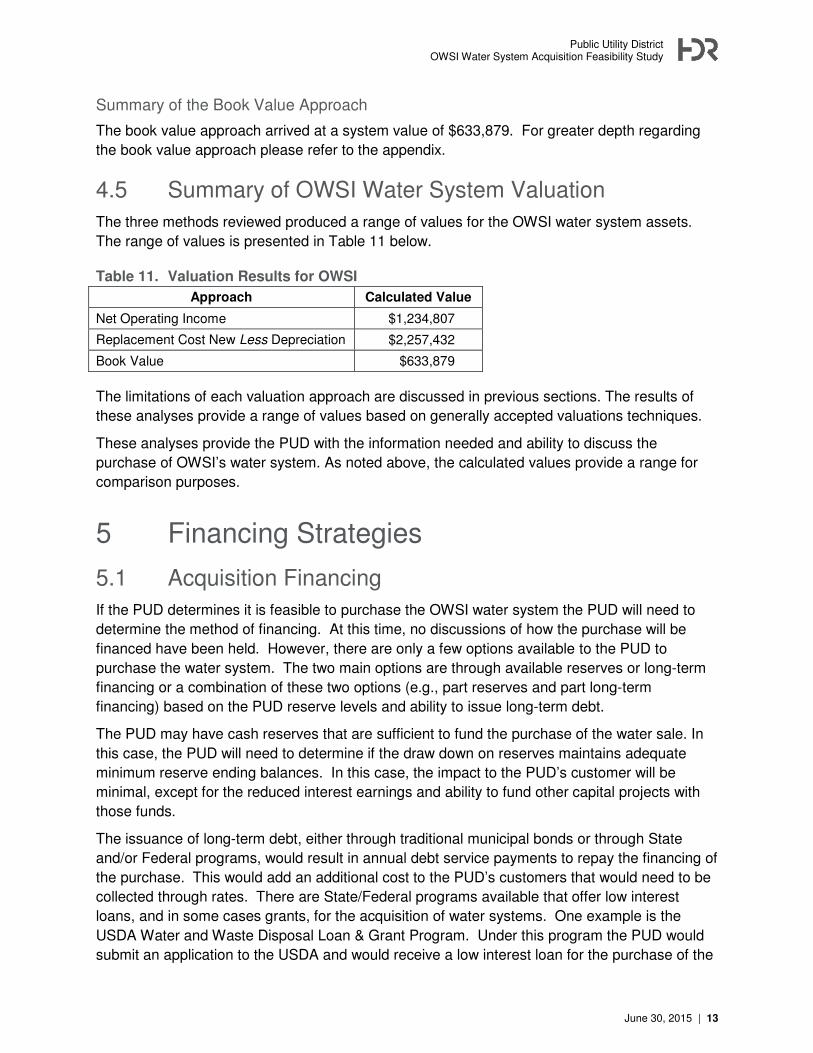
4.5 Summary of OWSI Water System Valuation
The three methods reviewed produced a range of values for the OWSI water system assets.
The range of values is presented in Table 11 below.
Table 11. Valuation Results for OWSI
Approach Calculated Value
Net Operating Income $1,234,807
Replacement Cost New Less Depreciation $2,257,432
Book Value $633,879
The limitations of each valuation approach are discussed in previous sections. The results of
these analyses provide a range of values based on generally accepted valuations techniques.
These analyses provide the PUD with the information needed and ability to discuss the
purchase of OWSI’s water system. As noted above, the calculated values provide a range for
comparison purposes.
5 Financing Strategies
5.1 Acquisition Financing
If the PUD determines it is feasible to purchase the OWSI water system the PUD will need to
determine the method of financing. At this time, no discussions of how the purchase will be
financed have been held. However, there are only a few options available to the PUD to
purchase the water system. The two main options are through available reserves or long-term
financing or a combination of these two options (e.g., part reserves and part long-term
financing) based on the PUD reserve levels and ability to issue long-term debt.
The PUD may have cash reserves that are sufficient to fund the purchase of the water sale. In
this case, the PUD will need to determine if the draw down on reserves maintains adequate
minimum reserve ending balances. In this case, the impact to the PUD’s customer will be
minimal, except for the reduced interest earnings and ability to fund other capital projects with
those funds.
The issuance of long-term debt, either through traditional municipal bonds or through State
and/or Federal programs, would result in annual debt service payments to repay the financing of
the purchase. This would add an additional cost to the PUD’s customers that would need to be
collected through rates. There are State/Federal programs available that offer low interest
loans, and in some cases grants, for the acquisition of water systems. One example is the
USDA Water and Waste Disposal Loan & Grant Program. Under this program the PUD would
submit an application to the USDA and would receive a low interest loan for the purchase of the

Public Utility District OWSI Water System Acquisition Feasibility Study
14 | June 30, 2015
system if approved. The loans are up to a 40 year period and provide an interest rate
depending on the need for the project and the median household income of the area to be
served. Other grant and loan programs have historically been provided depending on the State
budget and resources allocated to these types of programs.
The additional cost of annual debt service payments is generally shared with all PUD
customers, both existing and, in this case, OWSI customers, as the OWSI customers have been
funding the OWSI water system through rates. Therefore, any “surcharge” on OWSI customers
would result in OWSI customers paying for the system twice. In addition, any sale of the OWSI
water system would need to go through the Washington Utilities and Transportation
Commission (UTC) for approval and agencies, such as the UTC, have typically limited the
change in rates for customers of a purchased system for a short-term period to minimize any
“rate shock” to the new customers.
5.2 Customer Rate Comparison
As part of the valuation analysis, a review of the OWSI and PUD rates was developed to
compare the impact to customers should a purchase of the OWSI water system occur. Both
utilities rate structures include a monthly fixed charge and an increasing block consumption
charge. However, OWSI has a two block structure and the PUD has a three block structure,
with the tier levels set at slightly different levels. In addition, the unit charge for OWSI is in cubic
fee (CF) and 1,000 gallons for the PUD. Provided below is a summary of the OWSI and PUD
residential rates.
Table 12. Comparison of Residential Water Rates
OWSI Fixed Meter Charge (3/4”) $18.25 Consumption Charge ($/CF)
0-1,000 $0.0225 > 1,000 $0.0335
PUD [1]
Fixed Meter Charge $17.50 Consumption Charge ($/100 gal)
0-5,000 $0.25 5,001-10,000 $0.35
10,000 $0.47
(1) PUD meter charge assumes Group A customers
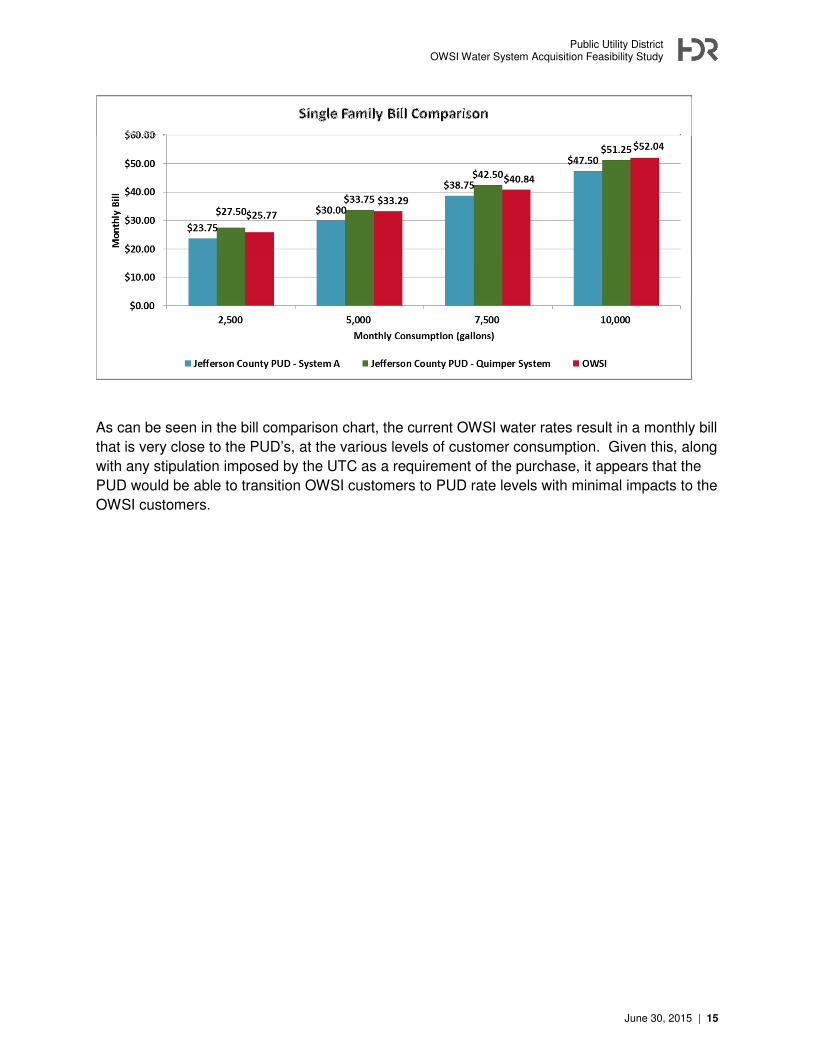
Given these rates a bill comparison was developed to determine the monthly bill difference
between the OWSI and PUD customers. Provided below is a summary of the monthly bill
comparison, which also includes an example based on the PUD Quimper rate.
Public Utility District
OWSI Water System Acquisition Feasibility Study
June 30, 2015 | 15
As can be seen in the bill comparison chart, the current OWSI water rates result in a monthly bill
that is very close to the PUD’s, at the various levels of customer consumption. Given this, along
with any stipulation imposed by the UTC as a requirement of the purchase, it appears that the
PUD would be able to transition OWSI customers to PUD rate levels with minimal impacts to the
OWSI customers.

Public Utility District OWSI Water System Acquisition Feasibility Study
16 | June 30, 2015
Figures

Public Utility District
OWSI Water System Acquisition Feasibility Study
June 30, 2015 | 17
Figure 1. OWSI Water System Service Area (Exhibit 1-1 from WSP)
Public Utility District OWSI Water System Acquisition Feasibility Study
18 | June 30, 2015
Figure 2. OWSI Water System Key Features (Exhibit 5-1 from WSP)

Public Utility District
OWSI Water System Acquisition Feasibility Study
June 30, 2015 | 19
Water Rights Capacity Analysis
Pumping Capacity Analysis (Service Zone A)
Pumping Capacity Analysis (Service Zone B)
Figure 3. Summary of Water Supply Capacity Analyses

Public Utility District OWSI Water System Acquisition Feasibility Study
20 | June 30, 2015
Figure 4. OWSI Organizational Chart

Public Utility District
OWSI Water System Acquisition Feasibility Study
June 30, 2015 | 21
Figure 5. OWSI Capital Improvement Program
Table 13-1
Olympic Water and Sewer, Inc.
Capital Improvement Program
Pro
ject
Cod
e (1
)P
roje
ct D
escr
ipti
on
Fu
ndi
ng
Sou
rce(2
)T
otal
Cos
t
(20
14
dol
lars
)2
01
52
01
62
01
72
01
82
01
92
02
02
02
1-2
03
4
Wa
ter
Su
pp
ly P
roje
cts
WS
-1W
ater
Rig
hts
Ap
plica
tio
n (
Wel
l No
. 1
- 50
gp
m)
S$1
0,0
00$1
1,25
5
WS
-2W
ell 1
8 D
esig
n a
nd
Co
nstr
ucti
on
S$25
0,0
00$2
57,
500
WS
-3G
reen
san
d F
ilter
Back
wash
Co
ntr
olle
rS
$10,0
00$1
0,00
0
WS
-4W
ells
14/
16
Man
gan
ese
Rem
ov
al (
Wate
r Q
ual
ity
Aest
het
ic I
mp
rov
em
ent)
ST
BD
TB
D
Dis
trib
uti
on
Syst
em
Pro
jects
WD
-1
Po
rtab
le G
en
era
tor
- S
erv
ice
Zo
ne
A (
20
kW)
S$3
5,0
00$3
7,13
2
WD
-2T
ran
sfe
r S
wit
ch -
Ser
vic
e Z
on
e A
Wel
l (2
, 3, o
r 4N
)S
$5,0
00$5,
305
WD
-3Im
pro
vem
ents
in h
igh
ele
vat
ion
are
a n
ear
Res
erv
oir
A (
Des
ign
an
d C
on
st) (
4)
S$20
0,0
00$53
,045
$173,
891
WD
-4O
T2
Ph
II
Dis
trib
uti
on
Im
pro
vem
ents
(2,0
00 f
t o
f p
ipe)
D$18
0,0
00$2
08,
669
WD
-7A
C P
ipe
Rep
lacem
en
tS
TB
DT
BD
WD
-8W
ell 3
Wate
r Q
ualit
y A
est
het
ic I
mp
rov
emen
ts (
inle
t p
ipin
g in
Rese
rvo
ir A
)S
TB
DT
BD
Ma
na
gem
en
t P
roje
cts
WM
-1W
ater
Sy
ste
m P
lan
Up
date
s (5
)S
$60,0
00$2
3,18
5$4
6,3
71
$7
50
,00
0$
10
,00
0$
29
9,9
36
$5
3,0
45
$0
$1
1,2
55
$4
05
,74
6$
46
,37
1
$5
70
,00
0$
10
,00
0$
29
9,9
36
$5
3,0
45
$0
$1
1,2
55
$1
97
,07
7$
46
,37
1
Note
s:
TB
D =
Fu
ture
pro
ject
to b
e fu
rther
def
ined
in s
ubse
quen
t W
SP
up
dat
es in t
erm
s of
scop
e, c
ost
, an
d t
imin
g.
(1)
Pro
ject
loca
tion
s sh
ow
n o
n E
xhib
it 1
3-1
.
(2)
S =
Sy
stem
Cust
om
ers
(i.e
., O
WS
I fu
nd
ed);
D
= D
evel
op
er C
ontr
ibuti
on
(3)
Co
sts
for
pro
ject
s im
ple
men
ted
aft
er 2
014 a
re in
flat
ed a
t 3%
per
yea
r to
acc
ount
for
infl
atio
n.
(4)
Co
sts
incl
ude
eval
uat
ion (
~$
50,0
00)
and d
esig
n/c
onst
ruct
ion (
~$1
50
,000).
(5)
Ass
um
es a
n u
pdat
e occ
urs
ever
y s
ix y
ears
, at
a c
ost
of
$20
,000 e
ach
.
(6)
Pip
ing
unit
cost
is
$9
0/f
t fo
r 8
-inch
dia
met
er p
ipe.
T
his
incl
ud
es a
ll p
roje
ct-r
elat
ed c
ost
s, in
clud
ing
des
ign a
nd p
erm
itti
ng.
Tot
al (
fun
ded
by O
WS
I)
Tot
al
Sch
edu
le o
f Im
plem
enta
tion
an
d C
ost
by Y
ear
(3)


Appendix Water System Valuation Analysis

Jefferson Count PUDOWSI Water System ValuationSummary
Net Income Approach (Historical 2014 & Projected 2015)
$118,4189.59% [1]
Replacement Cost New Less Depreciation
$11,724,137- (9,466,705)
Book Value
$2,957,288- 2,323,409
Notes:[1] - Rate of return based on last OWSI UTC filing in 2011
Average Net Income/Rate of Return = Value
Replacement cost new minus depreciation
Original cost minus accumulated depreciation = $633,879
= $1,234,807
= $2,257,432
06/05/2015 1 of 8

Jefferson Count PUDOWSI Water System ValuationRevenue RequirementExhibit 2
Income Stmt2014 2015 2016 2017 2018 2019 2020 2021 2022 2023 2024 2025 Notes:
RevenueRate Revenue $678,773 $695,064 $711,745 $728,827 $746,319 $764,230 $782,572 $801,354 $820,586 $840,280 $860,447 $881,098 As Customer Growth Misc. Revenue 0 0 0 0 0 0 0 0 0 0 0 0 As Customer Growth Other Revenue 34,989 35,829 36,689 37,569 38,471 39,394 40,340 41,308 42,299 43,314 44,354 45,418 As Customer Growth Connection Fee Revenue 1,000 1,024 1,049 1,074 1,100 1,126 1,153 1,181 1,209 1,238 1,268 1,298 As Customer Growth
---------- ---------- ---------- ---------- ---------- ---------- ---------- ---------- ---------- ---------- ---------- ----------Utility Operating Revenue $714,762 $731,916 $749,482 $767,470 $785,889 $804,750 $824,064 $843,842 $864,094 $884,832 $906,068 $927,814
ExpensesOperation Expense Accounts $427,408 $440,230 $453,437 $467,040 $481,051 $495,483 $510,348 $525,658 $541,428 $557,670 $574,401 $591,633 As Operating Expense GrowthDepreciation Expense 62,659 62,659 62,659 62,659 62,659 62,659 62,659 62,659 62,659 62,659 62,659 62,659 As FlatAmmortization Expense (7,203) (7,203) (7,203) (7,203) (7,203) (7,203) (7,203) (7,203) (7,203) (7,203) (7,203) (7,203) As FlatOther Tax & Licensing 53,176 54,771 56,414 58,107 59,850 61,646 63,495 65,400 67,362 69,383 71,464 73,608 As Operating Expense GrowthFederal Income Tax 60,761 62,584 64,461 66,395 68,387 70,439 72,552 74,728 76,970 79,279 81,658 84,107 As Operating Expense GrowthOwners Draw Down/Dividens 0 0 0 0 0 0 0 0 0 0 0 0 As Operating Expense Growth
---------- ---------- ---------- ---------- ---------- ---------- ---------- ---------- ---------- ---------- ---------- ----------Utility Operation Expense $596,801 $613,041 $629,769 $646,998 $664,745 $683,023 $701,850 $721,242 $741,216 $761,788 $782,978 $804,804
Utility Operating Income (Loss) $117,961 $118,875 $119,713 $120,472 $121,145 $121,727 $122,214 $122,600 $122,879 $123,044 $123,090 $123,010
Other Income and Deductions
Other Income Interest & Dividend Income $0 $0 $0 $0 $0 $0 $0 $0 $0 $0 $0 $0Miscellaneous Nonutility Income 0 0 0 0 0 0 0 0 0 0 0 0
---------- ---------- ---------- ---------- ---------- ---------- ---------- ---------- ---------- ---------- ---------- ----------Total Other Income $0 $0 $0 $0 $0 $0 $0 $0 $0 $0 $0 $0
Other DeductionsInterest Expense $0 $0 $0 $0 $0 $0 $0 $0 $0 $0 $0 $0Miscellaneous Nonutility Expense 0 0 0 0 0 0 0 0 0 0 0 0 Amortization 0 0 0 0 0 0 0 0 0 0 0 0 Expired Loan Fees 0 0 0 0 0 0 0 0 0 0 0 0
---------- ---------- ---------- ---------- ---------- ---------- ---------- ---------- ---------- ---------- ---------- ----------Total Other Deductions $0 $0 $0 $0 $0 $0 $0 $0 $0 $0 $0 $0
Net Income (Loss) $117,961 $118,875 $119,713 $120,472 $121,145 $121,727 $122,214 $122,600 $122,879 $123,044 $123,090 $123,010
Average Net Income 10 year moving average $121,063 $121,576 $121,989
Projected
06/05/2015 2 of 8

Jefferson Count PUD Page 1 of 6OWSI Water System ValuationReplacement Cost New Less DepreciationExhibit 3
Asset Asset # Original Cost Month YearUseful
LifeDepreciation
Rate Accum. Dep.
(12.31.14) Depreciated
Value Book ValueReplacement Cost (2015) RCNLD Notes
Pre 1981 AdditionsWater Storage Tank A 330 $24,900 1 1968 50 2.0% $24,900 100.0% $0 $231,363 $0Water Mains PL #1 331 56,266 1 1968 45 2.2% 56,266 100.0% 0 522,806 0Water Mains PL #2 331 166,286 1 1969 45 2.2% 166,286 100.0% 0 1,460,028 0Water Mains PL #3 331 46,622 1 1973 45 2.2% 46,622 100.0% 0 309,242 0Water Storage Tank B 330 58,109 1 1973 50 2.0% 58,109 100.0% 0 385,434 0Water Mains SB #1 331 49,857 1 1973 45 2.2% 49,857 100.0% 0 330,699 0Water Mains SB #2 331 15,748 1 1975 45 2.2% 15,748 100.0% 0 83,642 0Water Mains Community B 331 60,728 10 1975 45 2.2% 60,728 100.0% 0 322,545 0Water Mains ADM #2 331 10,823 10 1976 45 2.2% 10,823 100.0% 0 52,958 0Water Mains PL #5 331 22,000 1 1979 45 2.2% 22,000 100.0% 0 87,333 0Water Mains PL #4 331 101,729 10 1979 45 2.2% 101,729 100.0% 0 403,830 0Water Mains SB #3 331 55,315 10 1979 45 2.2% 55,315 100.0% 0 219,582 0Well 2 307 4,300 1 1968 35 2.9% 4,300 100.0% 0 39,954 0Well House 2 304 8,000 1 1968 40 2.5% 8,000 100.0% 0 74,333 0Well House 3 304 8,000 1 1973 40 2.5% 8,000 100.0% 0 53,064 0Teal Lake Water Drill/Exp 307 73,581 1 1975 35 2.9% 73,581 100.0% 0 390,811 0Well 3 307 7,000 1 1978 35 2.9% 7,000 100.0% 0 29,743 0Water Treatment Filter 339 15,000 1 1973 40 2.5% 15,000 100.0% 0 99,494 0
1982 AdditionsWater Storage Tank #3N Co 330 $206,509 1 1982 50 2.0% $136,295 66.0% $70,214 $713,291 $242,522Port Ludlow Well 3 Commun 307 41,701 1 1981 35 2.9% 39,359 94.4% 2,342 152,055 8,538
1985 AdditionsRehab Tank 330 $4,400 5 1985 50 2.0% $2,611 59.3% $1,789 $14,435 $5,869Teal Lake Well Trans. Line 331 86,258 5 1985 45 2.2% 56,811 65.9% 29,447 282,989 96,608Teal Lake Well Pumphouse 304 53,760 5 1985 40 2.5% 39,872 74.2% 13,888 176,371 45,562Teal Lake Well 307 47,006 5 1985 35 2.9% 39,882 84.8% 7,124 154,214 23,372Teal Lake Well Power Line 307 37,036 5 1985 35 2.9% 31,424 84.8% 5,612 121,505 18,412Teal Lake Well Access Road 307 9,000 5 1985 35 2.9% 7,636 84.8% 1,364 29,527 4,474Teal Lake Well Fire Hydra 335 1,500 5 1985 50 2.0% 890 59.3% 610 4,921 2,001
1986 AdditionsBackhoe Service, Dist. Lin 331 $210 6 1986 45 2.2% $133 63.2% $77 $683 $252Install Auto System NM We 311 2,165 10 1986 45 2.2% 1,355 62.6% 810 7,098 2,656Water Test Kit, Rockwell 339 411 3 1986 40 2.5% 296 72.0% 115 1,348 378Filter Media, Wells 2 & 3 339 12,331 3 1986 40 2.5% 8,862 71.9% 3,468 40,428 11,371
1987 AdditionsCustomer Service Installation 334 $6,915 1 1987 45 $0 0.0% $6,915 $22,419 $22,419Pipe 330 900 3 1987 45 2.2% 555 61.7% 345 2,918 1,119Copy Machine 340 400 3 1987 20 5.0% 400 100.0% 0 1,297 0Weed Eater 345 400 6 1987 20 5.0% 400 100.0% 0 1,292 0Reshingle Wellhouse #2 307 1,700 3 1987 35 2.9% 1,348 79.3% 352 5,512 1,142Access Road, Well 2 307 800 6 1987 35 2.9% 630 78.8% 170 2,583 548
Acquisition Date
06/05/2015 3 of 8

Jefferson Count PUD Page 2 of 6OWSI Water System ValuationReplacement Cost New Less DepreciationExhibit 3
Asset Asset # Original Cost Month YearUseful
LifeDepreciation
Rate Accum. Dep.
(12.31.14) Depreciated
Value Book ValueReplacement Cost (2015) RCNLD Notes
Acquisition Date
1988 AdditionsGround Water Study 307 $1,927 1 1988 31.5 3.2% $1,652 85.7% $275 $6,162 $880Water Lines 331 9,902 6 1988 31.5 3.2% 8,357 84.4% 1,546 31,504 4,917Ground Water Study 307 11,410 8 1988 31.5 3.2% 9,569 83.9% 1,841 36,492 5,889Water Lines 331 208 8 1988 31.5 3.2% 175 83.9% 34 666 107Water Lines 331 1,143 8 1988 31.5 3.2% 958 83.9% 184 3,655 590Water Lines 331 727 8 1988 31.5 3.2% 610 83.9% 117 2,326 375Water Lines 331 506 8 1988 31.5 3.2% 425 83.9% 82 1,619 261Water Lines 331 8 8 1988 31.5 3.2% 7 83.9% 1 27 4Water Plan 307 870 4 1988 31.5 3.2% 739 84.9% 131 2,782 419Water Plan 307 1,504 5 1988 31.5 3.2% 1,273 84.7% 231 4,811 738Water Plan 307 6,219 6 1988 31.5 3.2% 5,248 84.4% 971 19,786 3,088Well Drilling 307 217 8 1988 31.5 3.2% 182 83.9% 35 695 112Water Mains 331 46 8 1988 31.5 3.2% 39 83.9% 7 148 24Water Mains 331 599 8 1988 31.5 3.2% 502 83.9% 97 1,916 309Water Mains 331 1,688 8 1988 31.5 3.2% 1,415 83.9% 272 5,397 871Water Mains 331 898 8 1988 31.5 3.2% 753 83.9% 145 2,873 464Drilling Well #14 307 17,494 9 1988 31.5 3.2% 14,624 83.6% 2,869 55,585 9,117Water Mains 331 23 9 1988 31.5 3.2% 19 83.6% 4 74 12Water Mains 331 213 9 1988 31.5 3.2% 178 83.6% 35 677 111Water Mains 331 171 9 1988 31.5 3.2% 143 83.6% 28 545 89Water Mains 331 115 9 1988 31.5 3.2% 96 83.6% 19 365 60Water Mains 331 30 9 1988 31.5 3.2% 25 83.6% 5 96 16Water Mains 331 546 9 1988 31.5 3.2% 457 83.6% 90 1,736 285Well Testing 307 1,471 9 1988 31.5 3.2% 1,229 83.6% 241 4,673 766Water Plan 307 853 9 1988 31.5 3.2% 713 83.6% 140 2,709 444Well Drilling 307 11,857 10 1988 31.5 3.2% 9,881 83.3% 1,976 37,921 6,320Water Plan 307 1,432 10 1988 31.5 3.2% 1,194 83.3% 239 4,581 764Well Drilling 307 2,929 10 1988 31.5 3.2% 2,441 83.3% 488 9,367 1,561Water Mains 331 14,570 10 1988 31.5 3.2% 12,142 83.3% 2,428 46,600 7,767Water Mains 331 133 10 1988 31.5 3.2% 111 83.3% 22 426 71Water Mains 331 96 10 1988 31.5 3.2% 80 83.3% 16 306 51Water Mains 331 60 10 1988 31.5 3.2% 50 83.3% 10 191 32Well Drilling, Golf Course 307 1,263 11 1988 31.5 3.2% 1,049 83.1% 214 4,040 684Well Drilling 307 10,698 11 1988 31.5 3.2% 8,887 83.1% 1,811 34,215 5,793Water Rate Study 307 598 11 1988 31.5 3.2% 497 83.1% 101 1,913 324Well #13 307 4,215 11 1988 31.5 3.2% 3,501 83.1% 714 13,481 2,282Water Mains 331 12,037 11 1988 31.5 3.2% 9,999 83.1% 2,038 38,498 6,518Water Mains 331 824 11 1988 31.5 3.2% 685 83.1% 140 2,635 446Water Mains 331 3,974 11 1988 31.5 3.2% 3,301 83.1% 673 12,708 2,152Water Mains 331 369 11 1988 31.5 3.2% 306 83.1% 62 1,180 200Water Mains 331 2,731 11 1988 31.5 3.2% 2,268 83.1% 462 8,734 1,479Water Mains 331 2,960 11 1988 31.5 3.2% 2,459 83.1% 501 9,466 1,603Water Mains 331 6,203 11 1988 31.5 3.2% 5,153 83.1% 1,050 19,839 3,359Water Mains 331 1,230 11 1988 31.5 3.2% 1,022 83.1% 208 3,935 666Well #14 Report 307 2,060 12 1988 31.5 3.2% 1,706 82.8% 354 6,575 1,131Water Mains 331 673 12 1988 31.5 3.2% 557 82.8% 116 2,147 369Water Mains 331 151 12 1988 31.5 3.2% 125 82.8% 26 481 83Water Mains 331 177 12 1988 31.5 3.2% 147 82.8% 31 566 97Water Mains 331 2,033 12 1988 31.5 3.2% 1,683 82.8% 350 6,488 1,116Well #1 Drilling Work 307 1,950 12 1988 31.5 3.2% 1,615 82.8% 335 6,224 1,070
06/05/2015 4 of 8
Jefferson Count PUD Page 3 of 6OWSI Water System ValuationReplacement Cost New Less DepreciationExhibit 3
Asset Asset # Original Cost Month YearUseful
LifeDepreciation
Rate Accum. Dep.
(12.31.14) Depreciated
Value Book ValueReplacement Cost (2015) RCNLD Notes
Acquisition Date
1989 AdditionsWater Rate Study 340 $8,208 1 1989 20 5.0% $8,208 100.0% $0 $26,227 $0Key Machine 340 1,206 1 1989 20 5.0% 1,206 100.0% 0 3,853 0Well Testing 307 2,655 1 1989 35 2.9% 1,903 71.7% 752 8,484 2,404Pipe Threading Machine 340 3,137 2 1989 20 5.0% 3,137 100.0% 0 10,023 0Vaults With Ladder 331 5,353 3 1989 50 2.0% 2,703 50.5% 2,650 17,106 8,467Well 14 Costs 307 3,389 3 1989 35 2.9% 2,445 72.1% 944 10,830 3,017Water Mains 331 611 3 1989 45 2.2% 343 56.1% 268 1,952 857Well 14 Costs 307 4,611 6 1989 35 2.9% 3,360 72.9% 1,252 14,682 3,985Well 14 Costs 307 11,383 10 1989 35 2.9% 8,402 73.8% 2,981 35,429 9,279Well 14 Costs 307 2,027 11 1989 35 2.9% 1,501 74.0% 526 6,314 1,639Well 14 Costs 307 695 11 1989 35 2.9% 515 74.0% 180 2,165 562Well 14 Costs 307 3,741 11 1989 35 2.9% 2,770 74.0% 971 11,651 3,024Well 14 Costs 307 4,208 11 1989 35 2.9% 3,116 74.0% 1,092 13,107 3,402Well 14 Costs 307 1,241 11 1989 35 2.9% 919 74.0% 322 3,867 1,003Well 14 Costs 307 634 11 1989 35 2.9% 470 74.0% 165 1,976 513Well 14 Costs 307 11,697 11 1989 35 2.9% 8,661 74.0% 3,036 36,432 9,455Well 14 Costs 307 4,976 12 1989 35 2.9% 3,696 74.3% 1,280 15,528 3,993Customer Service Installation 334 5,064 12 1989 15 6.7% 5,064 100.0% 0 15,802 0
1990 AdditionsWell 14 Costs 307 $6,580 1 1990 35 2.9% $4,700 71.4% $1,880 $20,533 $5,866Well 14 Costs 307 4,011 2 1990 35 2.9% 2,855 71.2% 1,156 12,511 3,604Well 14 Costs 307 3,342 4 1990 35 2.9% 2,363 70.7% 979 10,457 3,062Replace Pump Well 13 311 3,425 6 1990 20 5.0% 3,425 100.0% 0 10,530 0Motor Saver Well 13 311 1,235 6 1990 20 5.0% 1,235 100.0% 0 3,796 0Well 14 Costs 307 419 8 1990 35 2.9% 292 69.8% 127 1,291 390Customer Service Installation 334 5,944 12 1990 15 6.7% 5,944 100.0% 0 18,458 0
1991 AdditionsMetal Detector 343 $1,790 2 1991 20 5.0% $1,790 100.0% $0 $5,527 $0Hydra Pipe Cutter 343 867 8 1991 20 5.0% 867 100.0% 0 2,609 0Customer Service Installation 334 20,205 12 1991 15 6.7% 20,205 100.0% 0 61,190 0
1992 AdditionsTools And Equipment 331 $3,175 11 1992 20 100.0% $3,175 100.0% $0 $9,370 $0Transmission Line 331 4,283 11 1992 60 1.7% 1,582 36.9% 2,701 12,638 7,969Engineering Road Crossing 331 340 11 1992 60 1.7% 126 36.9% 214 1,003 633Motor Saver Well 4 311 976 11 1992 20 5.0% 976 100.0% 0 2,880 0Hydrant Overhauls 335 5,961 11 1992 50 2.0% 2,643 44.3% 3,318 17,590 9,792Dunsmuir Transmission Lines 331 52,683 11 1992 60 1.7% 19,464 36.9% 33,220 155,462 98,027Creekside Water Line 331 1,750 12 1992 60 1.7% 644 36.8% 1,106 5,166 3,265Site 26 Extension 331 2,112 12 1992 60 1.7% 777 36.8% 1,334 6,234 3,940Customer Service Installation 334 19,484 12 1992 15 6.7% 19,484 100.0% 0 57,522 0
1993 AdditionsHazardous Air Monitor 343 $2,461 5 1993 15 6.7% $2,461 100.0% $0 $7,041 $0Repaint Water Tank 330 12,149 7 1993 8 12.5% 12,149 100.0% 0 35,446 0Admir 1 Distribution Mains 331 10,398 9 1993 60 1.7% 3,697 35.6% 6,701 29,693 19,135Security Gate 320 1,833 10 1993 20 5.0% 1,833 100.0% 0 5,246 0Hydrants 335 3,255 12 1993 50 2.0% 1,372 42.2% 1,882 9,259 5,355Hydrants 335 954 12 1993 50 2.0% 402 42.2% 552 2,714 1,570Well 14 311 2,250 5 1993 20 5.0% 2,250 100.0% 0 6,437 0Well 14 304 2,250 5 1993 40 2.5% 1,208 53.7% 1,043 6,437 2,982Well 14 304 18,001 5 1993 40 2.5% 9,545 53.0% 8,456 51,493 24,189Teal Lake Reservoir 304 2,045 5 1993 40 2.5% 1,106 54.1% 938 5,849 2,684Teal Lake Reservoir 330 13,282 5 1993 50 2.0% 5,605 42.2% 7,678 37,996 21,962Teal Lake Reservoir 330 1,798 5 1993 50 2.0% 965 53.7% 833 5,143 2,382Teal Lake Trans. Lines 331 6,472 5 1993 60 1.7% 2,394 37.0% 4,078 18,515 11,665Teal Lake Reservoir 330 95 5 1993 50 2.0% 64 67.2% 31 271 89Well 14 311 341 5 1993 20 5.0% 341 100.0% 0 974 0Well 14 304 95 5 1993 40 2.5% 51 54.0% 44 271 125Well 14 304 511 5 1993 40 2.5% 273 53.5% 238 1,461 680Customer Service Installation 334 16,918 12 1993 15 6.7% 16,918 100.0% 0 48,129 0
06/05/2015 5 of 8
Jefferson Count PUD Page 4 of 6OWSI Water System ValuationReplacement Cost New Less DepreciationExhibit 3
Asset Asset # Original Cost Month YearUseful
LifeDepreciation
Rate Accum. Dep.
(12.31.14) Depreciated
Value Book ValueReplacement Cost (2015) RCNLD Notes
Acquisition Date
1994 AdditionsWell 14 311 $3,462 1 1994 20 5.0% $3,462 100.0% $0 $9,848 $0Well 14 304 3,462 1 1994 40 2.5% 1,817 52.5% 1,644 9,848 4,678Well 14 304 27,694 1 1994 40 2.5% 14,539 52.5% 13,155 78,784 37,422Teal Lake Reservoir 304 3,146 1 1994 40 2.5% 1,651 52.5% 1,494 8,949 4,251Teal Lake Reservoir 330 20,435 1 1994 50 2.0% 8,583 42.0% 11,852 58,133 33,717Teal Lake Reservoir 330 2,766 1 1994 50 2.0% 1,162 42.0% 1,604 7,869 4,564Teal Lake Trans. Lines 331 9,958 1 1994 60 1.7% 3,485 35.0% 6,472 28,327 18,413Teal Lake Reservoir 330 146 1 1994 50 2.0% 61 42.0% 84 414 240Well 14 311 524 1 1994 20 5.0% 524 100.0% 0 1,491 0Well 14 304 14,936 1 1994 40 2.5% 7,842 52.5% 7,095 42,491 20,183Well 14 304 786 1 1994 40 2.5% 413 52.5% 373 2,236 1,062Mars Analyzer 343 736 2 1994 20 5.0% 736 100.0% 0 2,094 0Well 3 Pump 311 5,279 12 1994 20 5.0% 5,279 100.0% 0 14,703 0Well 13 Pump 311 10,000 12 1994 20 5.0% 10,000 100.0% 0 27,851 0Pressure Sensor Line 311 3,153 12 1994 20 5.0% 3,153 100.0% 0 8,782 0Customer Service Installation 334 28,022 12 1994 15 6.7% 28,022 100.0% 0 78,046 0
1995 AdditionsWell 14 311 $3,462 1 1995 20 5.0% $3,462 100.0% $0 $9,653 $0Well 14 304 3,462 1 1995 40 2.5% 1,731 50.0% 1,731 9,653 4,826Well 14 304 27,694 1 1995 40 2.5% 13,847 50.0% 13,847 77,224 38,612Teal Lake Reservoir 304 3,146 1 1995 40 2.5% 1,573 50.0% 1,573 8,772 4,386Teal Lake Reservoir 330 20,435 1 1995 50 2.0% 8,174 40.0% 12,261 56,981 34,189Teal Lake Reservoir 330 2,766 1 1995 50 2.0% 1,106 40.0% 1,660 7,713 4,628Teal Lake Trans. Lines 331 9,958 1 1995 60 1.7% 3,319 33.3% 6,638 27,766 18,511Teal Lake Reservoir 330 146 1 1995 50 2.0% 58 40.0% 87 406 244Well 14 311 524 1 1995 20 5.0% 524 100.0% 0 1,461 0Well 14 304 14,936 1 1995 40 2.5% 7,468 50.0% 7,468 41,650 20,825Well 14 304 786 1 1995 40 2.5% 393 50.0% 393 2,192 1,096PRV Remodel, Springwood 304 14,437 1 1995 40 2.5% 7,219 50.0% 7,219 40,257 20,129Rewire Well #3 311 711 2 1995 20 5.0% 708 99.6% 3 1,984 8Rewire Well #2 311 5,833 2 1995 20 5.0% 5,809 99.6% 24 16,280 68Repipe PRV, Ludlow Bay Rd 304 5,000 3 1995 35 2.9% 2,833 56.7% 2,167 13,963 6,051PRV Vault, Ludlow Bay Rd 304 12,767 3 1995 40 2.5% 6,330 49.6% 6,437 35,654 17,976Metal Doors, Well 2 304 507 9 1995 35 2.9% 280 55.2% 227 1,399 626Metal Doors, Well 3 304 507 9 1995 35 2.9% 280 55.2% 227 1,399 626Wellhouse #3 Fence 304 3,575 9 1995 35 2.9% 1,975 55.2% 1,600 9,867 4,417Customer Service Installation 334 20,168 12 1995 15 6.7% 20,168 100.0% 0 55,545 0
1996 AdditionsWell 14 311 $3,462 1 1996 20 5.0% $3,289 95.0% $173 $9,534 $477Well 14 304 3,462 1 1996 40 2.5% 1,644 47.5% 1,817 9,534 5,005Well 14 304 27,694 1 1996 40 2.5% 13,155 47.5% 14,539 76,272 40,043Teal Lake Reservoir 304 3,146 1 1996 40 2.5% 1,494 47.5% 1,651 8,664 4,548Teal Lake Reservoir 330 20,435 1 1996 50 2.0% 7,765 38.0% 12,669 56,279 34,893Teal Lake Reservoir 330 2,766 1 1996 50 2.0% 1,051 38.0% 1,715 7,618 4,723Teal Lake Trans. Lines 331 9,958 1 1996 60 1.7% 3,153 31.7% 6,804 27,424 18,740Teal Lake Reservoir 330 146 1 1996 50 2.0% 55 38.0% 90 401 249Well 14 311 524 1 1996 20 5.0% 498 95.0% 26 1,443 72Well 14 304 14,936 1 1996 40 2.5% 7,095 47.5% 7,842 41,136 21,597Well 14 304 786 1 1996 40 2.5% 373 47.5% 413 2,165 1,136Paving at Adm I (Dist Mains) 304 1,407 4 1996 50 2.0% 528 37.5% 879 3,883 2,427Customer Service Installation 334 25,449 12 1996 15 6.7% 25,449 100.0% 0 68,877 0
06/05/2015 6 of 8
Jefferson Count PUD Page 5 of 6OWSI Water System ValuationReplacement Cost New Less DepreciationExhibit 3
Asset Asset # Original Cost Month YearUseful
LifeDepreciation
Rate Accum. Dep.
(12.31.14) Depreciated
Value Book ValueReplacement Cost (2015) RCNLD Notes
Acquisition Date
1997 AdditionsWell 14 311 $3,462 1 1997 20 5.0% $3,116 90.0% $346 $9,325 $932Well 14 304 3,462 1 1997 40 2.5% 1,558 45.0% 1,904 9,325 5,129Well 14 304 27,694 1 1997 40 2.5% 12,462 45.0% 15,232 74,598 41,029Teal Lake Reservoir 304 3,146 1 1997 40 2.5% 1,416 45.0% 1,730 8,473 4,660Teal Lake Reservoir 330 20,435 1 1997 50 2.0% 7,356 36.0% 13,078 55,043 35,228Teal Lake Reservoir 330 2,766 1 1997 50 2.0% 996 36.0% 1,770 7,451 4,768Teal Lake Trans. Lines 331 9,958 1 1997 60 1.7% 2,987 30.0% 6,970 26,822 18,775Teal Lake Reservoir 330 146 1 1997 50 2.0% 52 36.0% 93 392 251Well 14 311 524 1 1997 20 5.0% 472 90.0% 52 1,411 141Well 14 304 14,936 1 1997 40 2.5% 6,721 45.0% 8,215 40,233 22,128Well 14 304 786 1 1997 40 2.5% 354 45.0% 432 2,117 1,164Maintenance Shop Improvement 304 3,806 1 1997 40 2.5% 1,713 45.0% 2,093 10,252 5,639Loomis Water Extentions 304 11,632 1 1997 40 2.5% 5,089 43.8% 6,543 31,332 17,624Vault Lids Pressure 304 11,688 1 1997 40 2.5% 5,113 43.8% 6,574 31,482 17,709Water Mains 331 2,494 2 1997 60 1.7% 717 28.8% 1,777 6,714 4,783Hewlit Rand P5 Computer 340 3,961 5 1997 20 5.0% 3,416 86.3% 545 10,323 1,419Tank Cleaning 320 10,099 1 1997 20 5.0% 9,089 90.0% 1,010 27,204 2,720Customer Service Installation 334 37,890 12 1997 15 6.7% 37,890 100.0% 0 97,162 0
1998 AdditionsWell 14 311 $1,212 1 1998 20 5.0% $1,030 85.0% $182 $3,107 $466Well 14 304 1,212 1 1998 40 2.5% 515 42.5% 697 3,107 1,786Well 14 304 9,693 1 1998 40 2.5% 4,119 42.5% 5,573 24,856 14,292Teal Lake Reservoir 304 1,101 1 1998 40 2.5% 468 42.5% 633 2,823 1,623Teal Lake Reservoir 330 7,152 1 1998 50 2.0% 2,432 34.0% 4,720 18,340 12,105Teal Lake Reservoir 330 968 1 1998 50 2.0% 329 34.0% 639 2,482 1,638Teal Lake Trans. Lines 331 3,485 1 1998 60 1.7% 987 28.3% 2,498 8,937 6,405Teal Lake Reservoir 330 51 1 1998 50 2.0% 17 34.0% 34 131 86Well 14 311 183 1 1998 20 5.0% 156 85.0% 28 470 71Well 14 304 5,228 1 1998 40 2.5% 2,222 42.5% 3,006 13,405 7,708Well 14 304 275 1 1998 40 2.5% 117 42.5% 158 705 406New Roofs, Wells 2 & 3 304 3,232 6 1998 40 2.5% 1,340 41.5% 1,892 8,211 4,807Wells 4a & 9 Pilot Treatment 320 2,932 11 1998 20 5.0% 2,370 80.8% 562 7,306 1,400Telemetry Equipment 346 22,266 12 1998 10 10.0% 22,266 100.0% 0 55,504 0
1999 AdditionsTelemetry Installation Cost 346 $7,201 5 1999 10 10.0% $7,201 100.0% $0 $17,985 $0Paint Resevoirs A & C 304 57,074 9 1999 10 10.0% 57,074 100.0% 0 142,557 0Replace Waterline at Baldwin Ave 331 836 10 1999 60 1.7% 212 25.4% 624 2,085 1,555Generator 343 2,150 12 1999 10 10.0% 2,150 100.0% 0 5,279 0Pilot Treatment - 4a,9,13,14 320 6,854 12 1999 20 5.0% 5,169 75.4% 1,685 16,829 4,1371998 Customer Service Installation 334 19,986 12 1999 15 6.7% 19,986 100.0% 0 49,072 01999 Customer Service Installation 334 15,048 12 1999 15 6.7% 15,048 100.0% 0 36,948 0
2000 AdditionsReplace 6" AC Waterline 331 $1,861 2 2000 60 1.7% $463 24.9% $1,398 $4,564 $3,429Repipe Water Main MP 19 Ludlow 331 13,624 6 2000 60 1.7% 3,311 24.3% 10,313 33,413 25,292AC Pipe Abatement 331 1,916 7 2000 60 1.7% 463 24.2% 1,453 4,698 3,562Reservior B Interior Painting 304 37,800 12 2000 10 10.0% 37,800 100.0% 0 91,086 0Well 14 Generator Roof 304 1,122 12 2000 40 2.5% 395 35.2% 727 2,704 1,752Well 4N Roof 304 754 12 2000 40 2.5% 265 35.2% 489 1,817 1,177Shop Improvement 304 1,102 12 2000 20 5.0% 776 70.4% 326 2,655 786PRV Access Road Rock 331 5,545 7 2000 5 20.0% 5,545 100.0% 0 13,595 03 W Locker Gray 340 1,023 8 2000 5 20.0% 1,023 100.0% 0 2,509 02000 Customer Service Installation 334 28,547 12 2000 15 6.7% 28,547 100.0% 0 68,789 0
06/05/2015 7 of 8
Jefferson Count PUD Page 6 of 6OWSI Water System ValuationReplacement Cost New Less DepreciationExhibit 3
Asset Asset # Original Cost Month YearUseful
LifeDepreciation
Rate Accum. Dep.
(12.31.14) Depreciated
Value Book ValueReplacement Cost (2015) RCNLD Notes
Acquisition Date
2001 Additions1999 FORD SC SUP CAB 4X4 341 $14,798 8 2001 8 12.5% $14,798 100.0% $0 $35,633 $0SOFTWARE, BILLING, INHANCE 5000 340 1,606 10 2001 7 14.3% 1,606 100.0% 0 3,878 0Customer Service Installation 334 12,269 12 2001 15 6.7% 11,451 93.3% 818 29,643 1,976
2002 AdditionsWalden Lane Gate 304 $1,627 7 2002 20 5.0% $1,017 62.5% $610 $3,864 $1,449Adjustment to match GL 304 9,046 1 2002 5 20.0% 9,046 100.0% 0 21,474 0Customer Service Installation 334 6,217 12 2002 15 6.7% 5,388 86.7% 829 14,756 1,967
2003 AdditionsReplace water main w/ductile, Rainier Lane Lot 24 331 $3,288 9 2003 60 1.7% $621 18.9% $2,667 $7,644 $6,200Customer Service Installation 334 14,522 12 2003 15 6.7% 11,618 80.0% 2,904 33,697 6,739
2004 AdditionsCustomer Service Installation 334 $16,916 12 2004 15 6.7% $12,405 73.3% $4,511 $38,435 $10,249
2005 AdditionsCustomer Service Installation 334 $12,243 12 2005 15 6.7% $8,162 66.7% $4,081 $27,277 $9,092
2006 AdditionsCustomer Service Installation 334 $20,428 12 2006 15 6.7% $20,428
2007 AdditionsWater System Plan 348 $58,597 11 2007 6 16.7% $58,597 100.0% $0 $129,236 $0Well 16 304 474,223 12 2007 40 2.5% 94,845 20.0% 379,379 1,045,748 836,598Customer Service Installation 334 39,050 12 2007 15 6.7% 20,826 53.3% 18,223 86,111 40,185
2008 AdditionsCustomer Service Installation 334 $679 12 2008 15 6.7% $317 46.7% $362 $1,486 $792
2009 AdditionsBaldwin Lane Vault 331 $24,972 9 2009 60 1.7% $2,497 10.0% $22,474 $54,951 $49,456Well 16 Booster 311 8,725 5 2009 20 5.0% 2,618 30.0% 6,108 19,164 13,415Customer Service Installation 334 3,972 12 2009 15 6.7% 1,589 40.0% 2,383 8,744 5,246Customer Service Installation (true up to G/L) 334 1,317 12 2009 15 6.7% 351 26.7% 966 2,899 2,126
2011 AdditionsNorth Bay Booster 311 $43,616 11 2011 20 5.0% $6,724 15.4% $36,892 $93,638 $79,202Customer Service Installation 334 1,425 11 2011 15 6.7% 293 20.6% 1,132 3,059 2,430
2012 AdditionsCustomer Service Installation (Church) 334 $7,784 7 2012 15 6.7% $1,254 16.1% $6,530 $16,696 $14,006Reroof Well 13 304 972 7 2012 15 6.7% 157 16.1% 815 2,085 1,749Wren Ct Gate Valve Replace 331 1,224 8 2012 40 2.5% 71 5.8% 1,153 2,627 2,474Puget Loop AC Pipe Replacement 331 3,419 11 2012 60 1.7% 119 3.5% 3,300 7,187 6,938
2013 AdditionsWren Ct. Gate valve install 331 $2,337 3 2013 40 2.5% $102 4.4% $2,235 $4,912 $4,697Customer Service Installation (2-2-054 & 1-2-022334 139 10 2013 15 6.7% 12 8.9% 126 281 256Distribution Extension (Lot 11/12 Bluebird) 331 3,977 12 2013 60 1.7% 72 1.8% 3,905 8,049 7,904Water System Plan (partial, not yet complete) WSP 6 16.7%Land, from Trial Balance 1700.5 303 13,953 $13,953
2014 AdditionsLean-to on shop 304 $1,123 12 2014 35 2.9% $3 0.2% $1,120 $2,246 $2,241Soft-start Well #14 311 7,862 9 2014 20 5.0% 98 1.3% 7,763 15,745 15,548Service Connection Fees - Lot 26 Condon 334 255 1 2014 15 6.7% 17 6.7% 238 516 482Service Connection Fees - Lot 11 Bluebird 334 101 3 2014 15 6.7% 5 5.0% 95 204 193Service Connection Fees - LC 2 Irrigation 334 174 8 2014 15 6.7% 4 2.2% 170 351 344Service Connection Fees - LC 2-001 334 199 8 2014 15 6.7% 4 2.2% 195 403 394Service Connection Fees - LC 2-002 334 213 10 2014 15 6.7% 2 1.1% 211 427 4222012 Chevrolet Silverado 1500 341 14,016 1 2014 7 14.3% 2,002 14.3% 12,013 28,372 24,319
-------------- -------------- -------------- -------------- --------------Total Plant $3,407,288 $2,323,409 $1,083,879 $12,174,137 $2,707,432
Less: Contributed Capital [1] $0 $0 $0 $0
Less: Functional DepreciationWell 18 Design and Construction $250,000 $250,000 $250,000 $250,000Improvements near Reservoir A 200,000 200,000 200,000 200,000
Total Net Plant $2,957,288 $2,323,409 $633,879 $11,724,137 $2,257,432
Notes:[1] - Contributed capital was funded by connection fees (rate payers)
06/05/2015 8 of 8


