180
Oxfordshire in Detail Full Report Updated September 2005 Oxford Consultants for Social Inclusion
Oxfordshire in Detail
Full Report
Updated September 2005
Oxford Consultants for Social Inclusion

Oxfordshire in Detail Report, Updated September 2005 Oxford Consultants for Social Inclusion, www.ocsi.co.uk, [email protected], 0870 240 1474.
2
What Oxfordshire County Council means by Social Inclusion Social inclusion is the process by which efforts are made to ensure that everyone, regardless of their experiences and circumstances, can achieve their potential in life. To achieve inclusion income and employment are necessary but not sufficient. An inclusive society is also characterised by a striving for reduced inequality, a balance between individuals' rights and duties and increased social cohesion. (Oxfordshire County Council Social Inclusion Strategy, October 2004)
Further information may be obtained as follows The Oxfordshire in Detail full report and Social Inclusion initiatives at the corporate level
Adrian Harper-Smith Corporate Strategies Manager Chief Executive’s Office Oxfordshire County Council County Hall Oxford OX1 1ND [email protected] www.oxfordshire.gov.uk/socialinclusion
Analysis of the census and other data
Margaret Melling Demographic and Social Statistics AdviserEnvironment & Economy Directorate Oxfordshire County Council Speedwell House Oxford OX1 1NE [email protected]
About Oxford Consultants for Social Inclusion Oxford Consultants for Social Inclusion (OCSI), Oxford University’s first spin-out company from the Social Sciences, was launched in October 2003 to help local government and other public sector organisations identify deprived neighbourhoods, target resources, evaluate programme effectiveness and strengthen regeneration bids.
OCSI’s consultancy is based on nearly two decades of ground-breaking research at the Social Disadvantage Research Centre (SDRC) in the University’s Department of Social Policy and Social Work. The SDRC is a world leader in area-based deprivation research, developing the National Indices of Deprivation for England, Wales, Northern Ireland, and Scotland.
OCSI produces reports specifically designed to give up to date and detailed information about your area, providing you with a comprehensive analysis of deprivation and social exclusion. OCSI reports allow you to compare within your local area on a number of essential indicators, and to make wider comparisons between your area and other similar areas, your Government Office Region and England as a whole.
Oxford Consultants for Social Inclusion Ltd Oxford: 52 New Inn Hall Street, Oxford OX1 2QD Brighton: Suite 6, 68 Middle St, Brighton BN1 1AL Web: www.ocsi.co.uk Tel: 0870 240 1474 Email: [email protected]

Oxfordshire in Detail Report, Updated September 2005 Oxford Consultants for Social Inclusion, www.ocsi.co.uk, [email protected], 0870 240 1474.
3
Contents
Section 1 Introduction........................................................................................11 1.1 Poverty and social exclusion – what do we mean? ................................................... 11
Section 2 People in Oxfordshire ........................................................................15
Section 3 Looking at Oxfordshire: The county, districts and wards.................19 3.1 Who serves the people in Oxfordshire?..................................................................... 22 3.2 Presenting information across Oxfordshire ............................................................... 22 3.3 Comparing Oxfordshire with other areas .................................................................. 25
Section 4 Who lives in Oxfordshire? Population size and structure ................26 4.1 Population counts across Oxfordshire........................................................................ 28 4.2 Population density ...................................................................................................... 29 4.3 ‘At-risk’ groups: Young children, elderly people, and people from ethnic minority groups ................................................................................................................................ 35 4.4 Section summary ......................................................................................................... 37
Section 5 People out of work: Who is affected? ..............................................38 5.1 People out of work across Oxfordshire...................................................................... 40 5.2 People out of work through unemployment ............................................................ 47 5.3 People out of work through sickness......................................................................... 51 5.4 Section summary ......................................................................................................... 53
Section 6 Living on a low income ......................................................................54 6.1 People living on a low income across Oxfordshire.................................................... 56 6.2 Young people (aged under 20) living on a low income ........................................... 64 6.3 Older people (aged 60 and over) living on a low income ........................................ 66 6.4 Section summary ......................................................................................................... 69
Section 7 Children living in low income households ........................................70 7.1 Children living in low income households across Oxfordshire ................................. 71 7.2 Children aged under 5 living in low income households.......................................... 72 7.3 Children aged 5-15 living in low income households ............................................... 80 7.4 Indices of Deprivation 2004, Income Deprivation affecting Children Index............ 82 7.5 Section summary ......................................................................................................... 83
Section 8 Health, sickness and disability ...........................................................84 8.1 Health, sickness and disability across Oxfordshire..................................................... 85 8.2 People in receipt of health benefits........................................................................... 92 8.3 Census indicators of health......................................................................................... 94
Oxfordshire in Detail Report, Updated September 2005 Oxford Consultants for Social Inclusion, www.ocsi.co.uk, [email protected], 0870 240 1474.
4
8.4 Section summary ......................................................................................................... 96
Section 9 Education and skills............................................................................97 9.1 Educational disadvantage........................................................................................... 98 9.2 Pupil exam performance........................................................................................... 100 9.3 Pupils staying on at school after 16 ......................................................................... 106 9.4 Full-time students...................................................................................................... 108 9.5 Adults with no qualifications ................................................................................... 109 9.6 Section summary ....................................................................................................... 112
Section 10 Housing and households..................................................................113 10.1 Housing type and condition ................................................................................... 113 10.2 Housing tenure and vacancy................................................................................... 119 10.3 Household composition .......................................................................................... 120 10.4 Section summary ..................................................................................................... 125
Section 11 Crime.................................................................................................126 11.1 Crime counts across Oxfordshire ............................................................................ 128 11.2 Geographical distribution of crime across Oxfordshire ........................................ 132 11.3 Section summary ..................................................................................................... 136
Section 12 Indices of Deprivation 2004 .............................................................137 12.1 Multiple derivation across Oxfordshire.................................................................. 138 12.2 Employment Deprivation........................................................................................ 147 12.3 Income Deprivation................................................................................................. 148 12.4 Health Deprivation and Disability .......................................................................... 149 12.5 Education, Skills and Training Deprivation............................................................ 150 12.6 Crime Deprivation ................................................................................................... 151 12.7 Living Environment Deprivation ............................................................................ 151 12.8 Barriers to Housing and Services ............................................................................ 152 12.9 Income Deprivation Affecting Children................................................................. 153 12.10 Income Deprivation Affecting Older People ....................................................... 153 12.11 Section summary ................................................................................................... 154
Section 13 Other information: The living environment ...................................155 13.1 The ID 2004 Living Environment domain............................................................... 155 13.2 Air pollution concentrations................................................................................... 157
Appendix A Data sources and descriptions......................................................163
Appendix B Estimating population denominators at small area level...........171
Oxfordshire in Detail Report, Updated September 2005 Oxford Consultants for Social Inclusion, www.ocsi.co.uk, [email protected], 0870 240 1474.
5
Appendix C Data Tools for Social Inclusion .....................................................173
Appendix D Indicator Definitions.....................................................................174
Oxfordshire in Detail Report, Updated September 2005 Oxford Consultants for Social Inclusion, www.ocsi.co.uk, [email protected], 0870 240 1474.
6
Summary
This Oxfordshire profile report uses key social exclusion information to investigate patterns of deprivation across the county, and how Oxfordshire compares with the broader context across the South-East region and England as a whole.
In addition, a more detailed People Centred Impact Assessment toolkit is also available, looking at the experiences of social inclusion from the perspective of 10 fictional households.
The report is based on the most recent information available, including data from the Indices of Deprivation 2004, 2001 Census, Department for Work and Pensions benefits from 2002-3, and DfES Pupil Level Annual School Census from 2004.
Our key findings are:
1. Oxfordshire shows low levels of social exclusion compared with England as a whole
2. However, there are areas with levels of social exclusion that are significantly higher than both the county and England as a whole
We show the main findings on pages 7 and 8, and the key indicators for Oxfordshire compared with England are shown on pages 9 and 10.

Oxfordshire in Detail Report, Updated September 2005 Oxford Consultants for Social Inclusion, www.ocsi.co.uk, [email protected], 0870 240 1474.
7
Main Findings 1
Oxfordshire shows low levels of social exclusion compared with England as a whole:
• The proportion of workless people is less than 50% of the England average1
• The proportion of people living on low incomes is roughly 50% of the England average2
• The proportion of children living in low income households is just over 50% of the England average3
• The proportion of people with health-related problems is typically just over two thirds of the England average4
• Adult education levels across the county are significantly higher than the England averages, with lower proportions of adults with no qualifications and higher proportions of full-time students5
• School examination results and staying on rates are slightly below the England average6
• The proportions of socially-rented and overcrowded households are well below the England average7
• The crime rate across the county is well below the England average for all major crime types8
• Only one of 404 Census Super Output Areas across the county (in Northfield Brook ward in Oxford) is in the most deprived 10% of all areas in England9
Oxfordshire in Detail Report, Updated September 2005 Oxford Consultants for Social Inclusion, www.ocsi.co.uk, [email protected], 0870 240 1474.
8
Main Findings 2
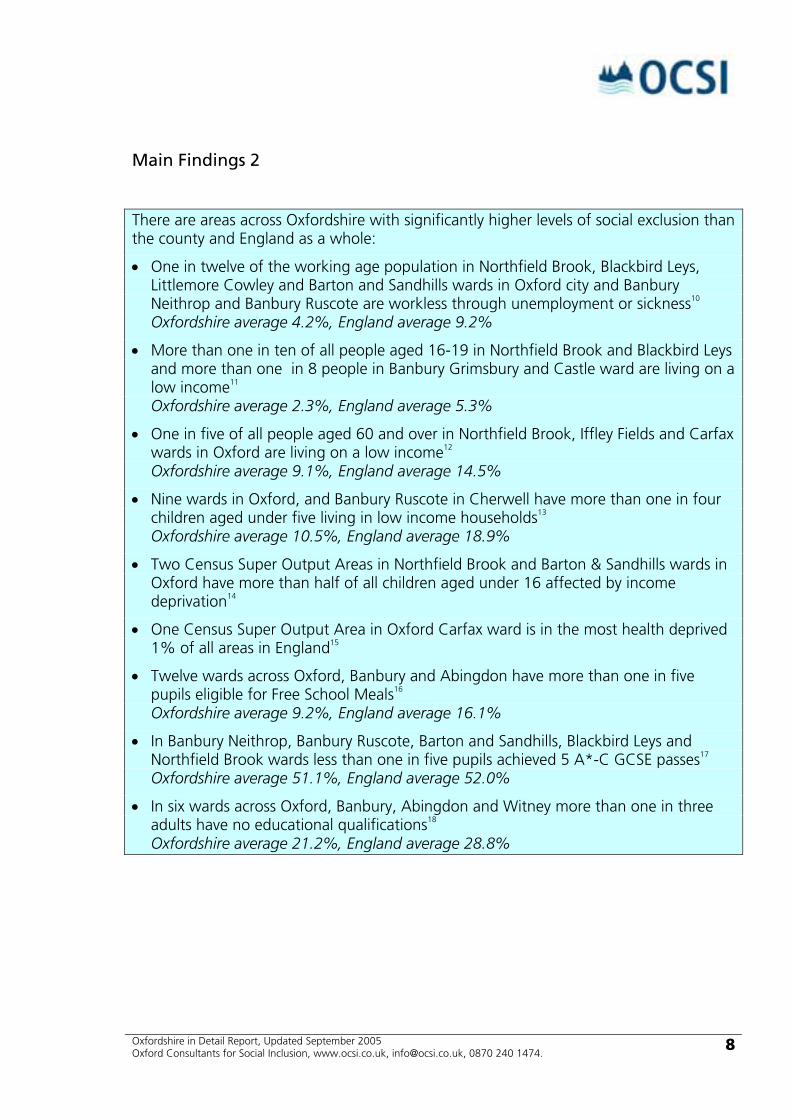
There are areas across Oxfordshire with significantly higher levels of social exclusion than the county and England as a whole:
• One in twelve of the working age population in Northfield Brook, Blackbird Leys, Littlemore Cowley and Barton and Sandhills wards in Oxford city and Banbury Neithrop and Banbury Ruscote are workless through unemployment or sickness10 Oxfordshire average 4.2%, England average 9.2%
• More than one in ten of all people aged 16-19 in Northfield Brook and Blackbird Leys and more than one in 8 people in Banbury Grimsbury and Castle ward are living on a low income11 Oxfordshire average 2.3%, England average 5.3%
• One in five of all people aged 60 and over in Northfield Brook, Iffley Fields and Carfax wards in Oxford are living on a low income12 Oxfordshire average 9.1%, England average 14.5%
• Nine wards in Oxford, and Banbury Ruscote in Cherwell have more than one in four children aged under five living in low income households13 Oxfordshire average 10.5%, England average 18.9%
• Two Census Super Output Areas in Northfield Brook and Barton & Sandhills wards in Oxford have more than half of all children aged under 16 affected by income deprivation14
• One Census Super Output Area in Oxford Carfax ward is in the most health deprived 1% of all areas in England15
• Twelve wards across Oxford, Banbury and Abingdon have more than one in five pupils eligible for Free School Meals16 Oxfordshire average 9.2%, England average 16.1%
• In Banbury Neithrop, Banbury Ruscote, Barton and Sandhills, Blackbird Leys and Northfield Brook wards less than one in five pupils achieved 5 A*-C GCSE passes17 Oxfordshire average 51.1%, England average 52.0%
• In six wards across Oxford, Banbury, Abingdon and Witney more than one in three adults have no educational qualifications18 Oxfordshire average 21.2%, England average 28.8%

Oxfordshire in Detail Report, Updated September 2005 Oxford Consultants for Social Inclusion, www.ocsi.co.uk, [email protected], 0870 240 1474.
9
Key Indicators across Oxfordshire (1)
Oxfordshire England
All people19 605,488 49,138,831 People aged 15 and under20 118,291 (19.5%) 9,901,581 (20.2%) People aged 65 and over21 87,900 (14.5%) 7,808,000 (15.9%) People in non-white ethnic groups22 29,444 (4.9%) 4,459,470 (9.1%)
Working age people workless23 17,195 (4.2%) 2,939,416 (9.2%) Working age people workless through unemployment24 3,625 (0.9%) 730,464 (2.3%) Working age people workless through sickness25 13,570 (3.3%) 2,208,952 (6.9%) People under 50 workless through sickness26 7,500 (2.5%) 1,136,272 (4.9%)
People over 50 workless through sickness27 6,065 (5.8%) 1,072,680 (12.3%) ID 2004 Employment Rank28 79 (of 149 areas, with 1 the most deprived)
All people living on a low income29 24,565 (4.9%) 3,872,353 (9.7%) Young people (aged under 20) living on a low income30 755 (2.3%) 134,329 (5.3%) People under 50 living on a low income31 11,550 (3.8%) 1,949,173 (8.3%) Older people (aged 60 and over) living on a low income32 10,765 (9.1%) 1,501,612 (14.5%) ID 2004 Income Rank33 73 (of 149 areas, with 1 the most deprived)
All children living in low income households34
12,115 (10.3%) 1,900,982 (19.3%) Children under 5 living in low income households35 3,695 (10.5%) 541,518 (18.9%) Children aged 5-15 living in low income households36 8,420 (10.2%) 1,359,464 (19.5%)
Oxfordshire in Detail Report, Updated September 2005 Oxford Consultants for Social Inclusion, www.ocsi.co.uk, [email protected], 0870 240 1474.
10
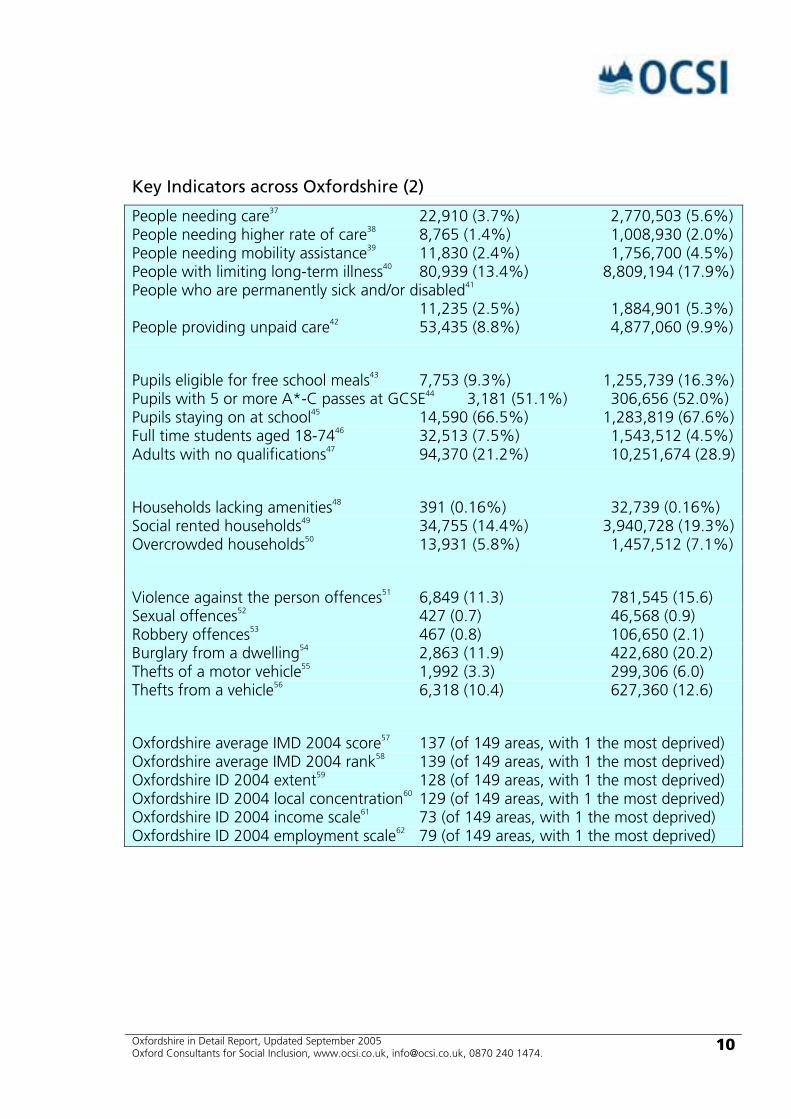
Key Indicators across Oxfordshire (2)
People needing care37 22,910 (3.7%) 2,770,503 (5.6%) People needing higher rate of care38 8,765 (1.4%) 1,008,930 (2.0%) People needing mobility assistance39 11,830 (2.4%) 1,756,700 (4.5%) People with limiting long-term illness40 80,939 (13.4%) 8,809,194 (17.9%) People who are permanently sick and/or disabled41 11,235 (2.5%) 1,884,901 (5.3%) People providing unpaid care42 53,435 (8.8%) 4,877,060 (9.9%)
Pupils eligible for free school meals43 7,753 (9.3%) 1,255,739 (16.3%) Pupils with 5 or more A*-C passes at GCSE44 3,181 (51.1%) 306,656 (52.0%) Pupils staying on at school45 14,590 (66.5%) 1,283,819 (67.6%) Full time students aged 18-7446 32,513 (7.5%) 1,543,512 (4.5%) Adults with no qualifications47 94,370 (21.2%) 10,251,674 (28.9)
Households lacking amenities48 391 (0.16%) 32,739 (0.16%) Social rented households49 34,755 (14.4%) 3,940,728 (19.3%) Overcrowded households50 13,931 (5.8%) 1,457,512 (7.1%)
Violence against the person offences51 6,849 (11.3) 781,545 (15.6) Sexual offences52 427 (0.7) 46,568 (0.9) Robbery offences53 467 (0.8) 106,650 (2.1) Burglary from a dwelling54 2,863 (11.9) 422,680 (20.2) Thefts of a motor vehicle55 1,992 (3.3) 299,306 (6.0) Thefts from a vehicle56 6,318 (10.4) 627,360 (12.6)
Oxfordshire average IMD 2004 score57 137 (of 149 areas, with 1 the most deprived) Oxfordshire average IMD 2004 rank58 139 (of 149 areas, with 1 the most deprived) Oxfordshire ID 2004 extent59 128 (of 149 areas, with 1 the most deprived) Oxfordshire ID 2004 local concentration60 129 (of 149 areas, with 1 the most deprived) Oxfordshire ID 2004 income scale61 73 (of 149 areas, with 1 the most deprived) Oxfordshire ID 2004 employment scale62 79 (of 149 areas, with 1 the most deprived)
Oxfordshire in Detail Report, Updated September 2005 Oxford Consultants for Social Inclusion, www.ocsi.co.uk, [email protected], 0870 240 1474.
11
Section 1 Introduction
This area profile report was commissioned by the Oxfordshire County Council Social Inclusion Group. The report draws together information from a number of key social inclusion sources to give a detailed picture of the social exclusion across the county.
1.1 Poverty and social exclusion – what do we mean? Poverty is usually described in relative terms – not having enough money or resources to afford the same food, housing, or have the same ability to participate, as other people in society. This definition of poverty ties in with the idea of social exclusion - "…a shorthand label for what can happen when individuals or areas suffer from a combination of linked problems such as unemployment, poor skills, low incomes, poor housing, high crime environments, bad health and family breakdown” (Tony Blair, 1999).
We use this definition of social exclusion in this report, giving detailed information across ten key themes:
• Population structure • People out of work • Living on a low income • Children living in low income households • Health, sickness and disability • Education and skills • Housing and households • Crime • Indices of Deprivation 2004 • Other information
Within each key theme we summarise the information available by geographical area in a series of tables, charts and maps. Breaking the data down in this way allows us to identify the different issues faced across the different areas.
The summary draws together the key findings and indicators from across the ten themes, and the additional “People in Oxfordshire” (Section 2) shows the different experiences of ten fictional individuals from across the county.
Oxfordshire in Detail Report, Updated September 2005 Oxford Consultants for Social Inclusion, www.ocsi.co.uk, [email protected], 0870 240 1474.
12
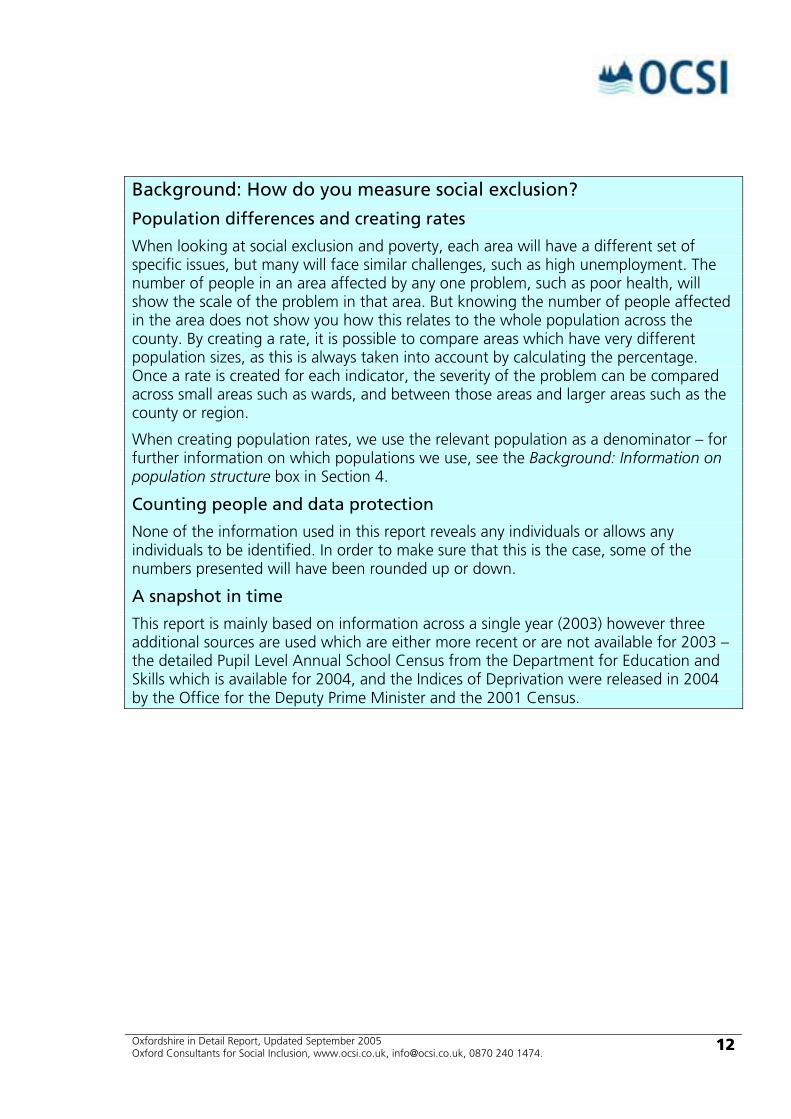
Background: How do you measure social exclusion?
Population differences and creating rates
When looking at social exclusion and poverty, each area will have a different set of specific issues, but many will face similar challenges, such as high unemployment. The number of people in an area affected by any one problem, such as poor health, will show the scale of the problem in that area. But knowing the number of people affected in the area does not show you how this relates to the whole population across the county. By creating a rate, it is possible to compare areas which have very different population sizes, as this is always taken into account by calculating the percentage. Once a rate is created for each indicator, the severity of the problem can be compared across small areas such as wards, and between those areas and larger areas such as the county or region.
When creating population rates, we use the relevant population as a denominator – for further information on which populations we use, see the Background: Information on population structure box in Section 4.
Counting people and data protection
None of the information used in this report reveals any individuals or allows any individuals to be identified. In order to make sure that this is the case, some of the numbers presented will have been rounded up or down.
A snapshot in time
This report is mainly based on information across a single year (2003) however three additional sources are used which are either more recent or are not available for 2003 – the detailed Pupil Level Annual School Census from the Department for Education and Skills which is available for 2004, and the Indices of Deprivation were released in 2004 by the Office for the Deputy Prime Minister and the 2001 Census.

Oxfordshire in Detail Report, Updated September 2005 Oxford Consultants for Social Inclusion, www.ocsi.co.uk, [email protected], 0870 240 1474.
13
Background: How to use this report
Report sections
This report is split into ten sections – Population structure, people out of work, living on a low income, children living in low income households, health, sickness and disability, education and skills, housing and households, crime, Indices of Deprivation 2004 and other information. Each section is designed to be self-contained, presenting all the key information. For this reason, some data may be in more than one section, for example the child deprivation index is discussed in the children living in low income households section, and in the section on multiple deprivation.
Re-using the data, tables, charts, and maps from this report
We want you to re-use any and all parts of the report that you find useful in your own documents – for that reason we have provided all of the data, tables, charts and maps used in the report in an accompanying Excel document – the Data Tools for Social Inclusion. The Data Tools also provide a comprehensive set of additional data, charts and maps not shown in this report, in a number of different formats including Excel, SPSS and MapInfo.. For more information on the Data Tools, see Appendix C.
Background information
Boxes like this one contain key background information to the report. For example, telling you how to read the maps in the report, who is eligible for which kinds of benefit, what sources of data we have used, and so on.
How to read the maps and charts in this report
A separate Background: About the maps in this report in Section 3 explains how we have mapped the information in this report.
The charts in this report show information across Oxfordshire, with figures for the South-East and England as a whole shown for comparison where relevant. Because it is not easy to understand charts showing information for every one of the 137 wards across the county, some charts show figures at district level, while other charts show the 20 areas with the highest rates across the county. In both cases the comparison values for Oxfordshire, the South-East and England are also shown. Additional charts show information across the county and selected comparison areas. In all charts, the district and smaller area values are shown in dark blue, while the Oxfordshire, South-East and England values are shown in light blue.
The information used in this report
The Government have recently developed and released a wealth of small area statistics made available through the Office for National Statistics. Government sources releasing data through the Office for National Statistics Neighbourhood Statistics website (http://neighbourhood.statistics.gov.uk/) include Department for Work and Pensions, Home Office, Department of Health, Department of Transport, Local Government and Regions, Countryside Agency, National Assembly for Wales, Office for National Statistics, Census 2001, Valuation Office Agency, and the Land Registry. The Office for National Statistics Neighbourhood Statistics website also releases some information

Oxfordshire in Detail Report, Updated September 2005 Oxford Consultants for Social Inclusion, www.ocsi.co.uk, [email protected], 0870 240 1474.
14
provided by the Social Disadvantage Research Centre at the University of Oxford, and the University Central Admissions Service. In addition, OCSI obtains data directly from a number of sources, including the Department of Health, Department for Education and Skills, and the Department for Work and Pensions.
For more information on the data sources and data descriptions in this report, see Appendix A.
Oxfordshire in Detail Report, Updated September 2005 Oxford Consultants for Social Inclusion, www.ocsi.co.uk, [email protected], 0870 240 1474.
15
Section 2 People in Oxfordshire
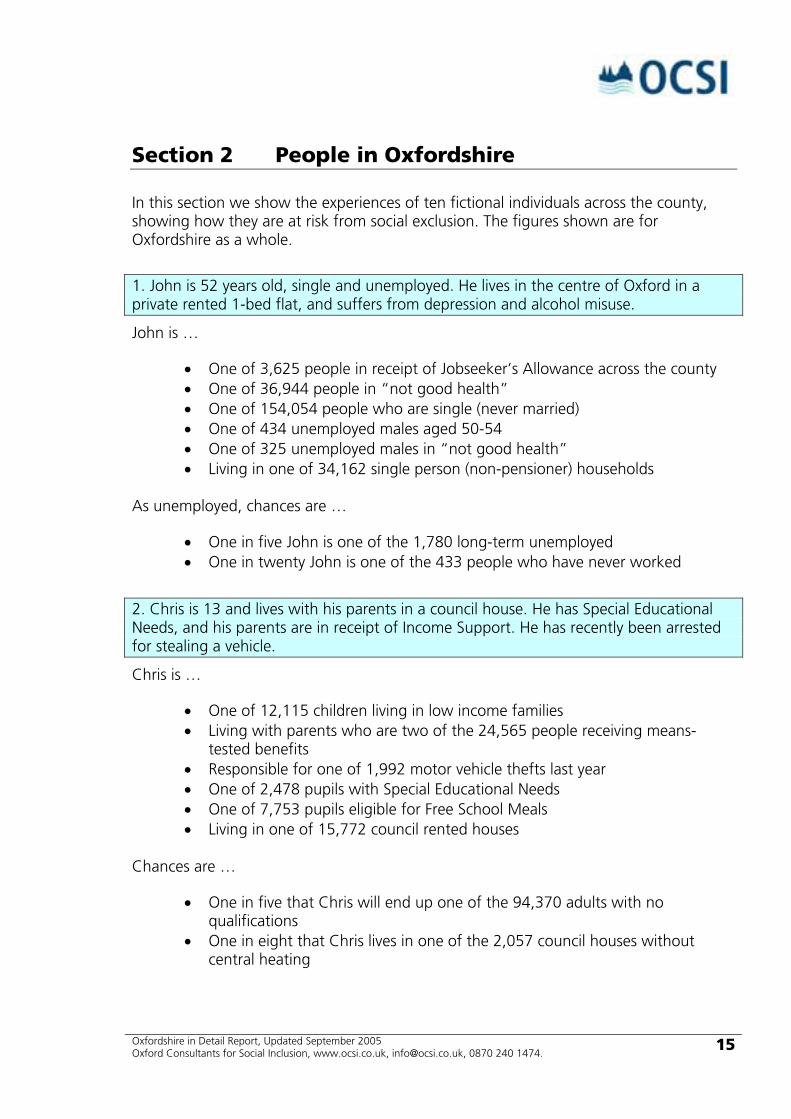
In this section we show the experiences of ten fictional individuals across the county, showing how they are at risk from social exclusion. The figures shown are for Oxfordshire as a whole.
1. John is 52 years old, single and unemployed. He lives in the centre of Oxford in a private rented 1-bed flat, and suffers from depression and alcohol misuse.
John is …
• One of 3,625 people in receipt of Jobseeker’s Allowance across the county • One of 36,944 people in “not good health” • One of 154,054 people who are single (never married) • One of 434 unemployed males aged 50-54 • One of 325 unemployed males in “not good health” • Living in one of 34,162 single person (non-pensioner) households
As unemployed, chances are …
• One in five John is one of the 1,780 long-term unemployed • One in twenty John is one of the 433 people who have never worked
2. Chris is 13 and lives with his parents in a council house. He has Special Educational Needs, and his parents are in receipt of Income Support. He has recently been arrested for stealing a vehicle.
Chris is …
• One of 12,115 children living in low income families • Living with parents who are two of the 24,565 people receiving means-
tested benefits • Responsible for one of 1,992 motor vehicle thefts last year • One of 2,478 pupils with Special Educational Needs • One of 7,753 pupils eligible for Free School Meals • Living in one of 15,772 council rented houses
Chances are …
• One in five that Chris will end up one of the 94,370 adults with no qualifications
• One in eight that Chris lives in one of the 2,057 council houses without central heating
Oxfordshire in Detail Report, Updated September 2005 Oxford Consultants for Social Inclusion, www.ocsi.co.uk, [email protected], 0870 240 1474.
16
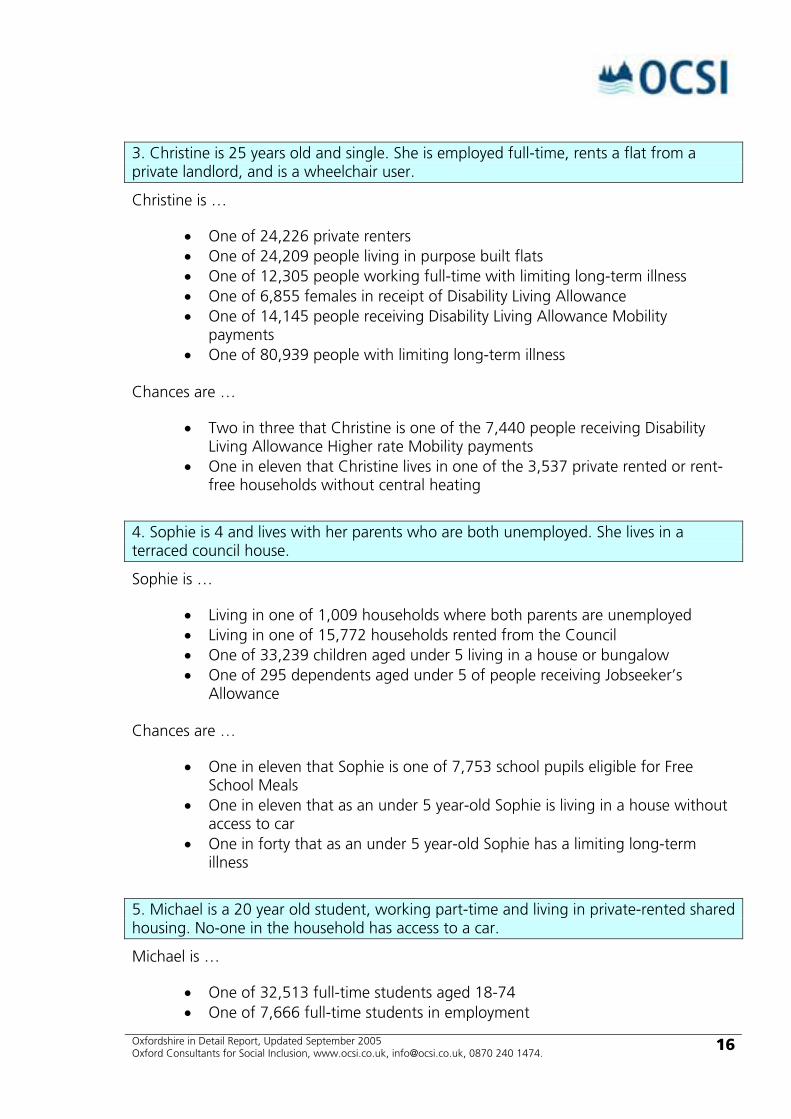
3. Christine is 25 years old and single. She is employed full-time, rents a flat from a private landlord, and is a wheelchair user.
Christine is …
• One of 24,226 private renters • One of 24,209 people living in purpose built flats • One of 12,305 people working full-time with limiting long-term illness • One of 6,855 females in receipt of Disability Living Allowance • One of 14,145 people receiving Disability Living Allowance Mobility
payments • One of 80,939 people with limiting long-term illness
Chances are …
• Two in three that Christine is one of the 7,440 people receiving Disability Living Allowance Higher rate Mobility payments
• One in eleven that Christine lives in one of the 3,537 private rented or rent-free households without central heating
4. Sophie is 4 and lives with her parents who are both unemployed. She lives in a terraced council house.
Sophie is …
• Living in one of 1,009 households where both parents are unemployed • Living in one of 15,772 households rented from the Council • One of 33,239 children aged under 5 living in a house or bungalow • One of 295 dependents aged under 5 of people receiving Jobseeker’s
Allowance Chances are …
• One in eleven that Sophie is one of 7,753 school pupils eligible for Free School Meals
• One in eleven that as an under 5 year-old Sophie is living in a house without access to car
• One in forty that as an under 5 year-old Sophie has a limiting long-term illness
5. Michael is a 20 year old student, working part-time and living in private-rented shared housing. No-one in the household has access to a car.
Michael is …
• One of 32,513 full-time students aged 18-74 • One of 7,666 full-time students in employment

Oxfordshire in Detail Report, Updated September 2005 Oxford Consultants for Social Inclusion, www.ocsi.co.uk, [email protected], 0870 240 1474.
17
• Living in one of 1,980 all-student households • Living in one of 43,849 households with no access to a car
Chances are that living as student in central Oxford (Carfax ward) …
• 1 in 3 that Michael lives in one of 351 overcrowded households • 1 in 25 that Michael lives in one of 43 households lacking basic amenities • 1 in 11 that Michael lives in one of 93 households without central heating
6. Denise (29) and Ian (35) are cohabiting with 2 dependent children. Denise works full-time, while Ian works part-time. They rent their house from a local Housing Association.
They are …
• One of 6,732 cohabiting couples with dependent children • Living in one of 18,983 socially rented households (i.e. rented from a
registered social landlord or housing association) • Two of 78,556 parents with dependent children where both parents work
Chances are ..
• 1 in 16 they live in one of the 1,196 social rented households without central heating
7. Dawn is a 27 year old lone parent, with 3 dependent children. Her 3-bed house is rented from a local Housing Association.
Dawn is …
• One of 4,905 people receiving Income Support Lone Parent payments • One of 10,151 female lone parents • Living in one of 18,983 socially rented households • Living in one of 13,931 overcrowded households
Chances are …
• One in three that Dawn lives in one of the 3,815 lone parent households with dependent children that have no car
8. Lara is 42, Bangladeshi and married with dependent children. She and her husband own their home.
Lara is …
• One of 29,444 people from non-white ethnic groups

Oxfordshire in Detail Report, Updated September 2005 Oxford Consultants for Social Inclusion, www.ocsi.co.uk, [email protected], 0870 240 1474.
18
• Living in one of 71,780 households owned outright by the occupants • Living as one of 48,029 married couples with dependent children
Chances are …
• 1 in 8 that Lara is one of the 81 Bangladeshis aged 16 to 49 with limiting long-term illness
• 1 in 20 that Lara is one of the 24 unemployed Bangladeshis aged 25 and over
9. Married couple Gary (67) and Gill (62) are both retired, receive state pension, and own their Bungalow. They provide unpaid care for Gill’s mother.
They are …
• Two of the 97,340 state pension claimants • Two of the 53,435 unpaid carers • Living in one of the 9,528 households with two or more pensioners under 75
and owned outright Chances are …
• 1 in 7 that they are one of the 8,355 people providing more than 50 hours unpaid care per week
10. Lily is a 75 year old widow, suffering from mild dementia. She owns her 3-bed house, but has no access to a car.
Lily is …
• Living in one of 31,140 households of 1 pensioner • One of 30,932 people aged 75 to 84 • One of 33,783 widows • Living in one of 43,849 households with no access to a car • One of 10,765 people aged 60 and over receiving Income Support Minimum
Income Guarantee payments
Chances are …
• One in two that Lily is one of the 8,546 women aged 75 to 84 with limiting long-term illness
Oxfordshire in Detail Report, Updated September 2005 Oxford Consultants for Social Inclusion, www.ocsi.co.uk, [email protected], 0870 240 1474.
19
Section 3 Looking at Oxfordshire: The county, districts and wards
The county of Oxfordshire is made up of five districts: Cherwell, Oxford, South Oxfordshire, Vale of White Horse, and West Oxfordshire. The major urban centre is the city of Oxford, and there are also significant centres at Bicester, Banbury and Chipping Norton to the north of Oxford; Witney to the west; Thame and Chinnor to the east; and Abingdon, Wantage, Didcot, and Henley to the South.
Cherwell, to the north of the county, is largely rural, but with a number of towns and villages. Cherwell’s administrative centre is the town of Banbury, the largest urban area after Oxford in the county. Other towns in Cherwell include Bicester and Kidlington.
Oxford is the smallest of Oxfordshire’s five districts in terms of geographical size. Oxford lies centrally within the county, completely surrounded by the other four districts, and is the most urbanised of the five Oxfordshire districts.
South Oxfordshire, running south between Oxford and Reading, is largely rural but with a number of towns, including Wallingford, the administrative centre. Other towns in South Oxfordshire include Thame, Didcot, Chinnor and Henley.
Vale of White Horse, stretching south-west to the district of Swindon in Wiltshire, is also mainly rural. The town of Abingdon is the administrative centre. Other towns in Vale include Faringdon and Wantage.
West Oxfordshire, lying to the west of the county and bordering the Cotswolds, is also predominantly rural. The administrative centre for West Oxfordshire is the town of Witney. Other towns in West Oxfordshire include Carterton, Charlbury, Chipping Norton and Woodstock.
Oxfordshire in Detail Report, Updated September 2005 Oxford Consultants for Social Inclusion, www.ocsi.co.uk, [email protected], 0870 240 1474.
20
Background: About the maps in this report
Areas and boundaries
The maps in this report are based on the 2003 ward definitions - these are the same ward definitions on which the 2001 Census data is released. Older ward boundaries may not be the same, although the districts have not changed since 1998. This means that the wards shown in the maps in this report may not be the same as the wards in other reports, such as those used in the 1991 Census or the Indices of Deprivation 2000. Even where a ward has the same name it may not have the same boundaries – sometimes the shape of the ward has changed, but the name stays the same. Because they are not the same size, wards that have changed are hard to compare between different points in time.
In addition, some maps show information by Census Output Areas or Census Super Output Areas, which are smaller than wards. These areas are typically smaller than 2003 wards, but only some information is available for these areas, for example 2001 Census data and the Indices of Deprivation 2004. For more information on these types of area see the Background: Knowing the Geographies box below.
Area size and area information
The maps show the areas as they are geographically, so some areas are much larger than others. But this does not show how many people live there, and it does not reflect any figures. For example, one very small ward could contain a large number of residents, by contrast a much larger ward may have only a small number of residents. Area information such as proportion of older people, or the rate of child living in low income households, is represented by the colour that the area is shaded on the map, but not by the size of the area.
Colour Coding
The maps throughout the report are colour coded, that is, each area is shaded with a different colour which represents the information being presented. At the edge of each map is a ‘key’ which tells you what sort of information is being shown, which might be a rate, a number, a ‘decile’, or some other figure. In every case the areas will be grouped, and this will be shown by the range next to each coloured box in the key.
The map colours range from dark blue, for areas which have the highest rate for the information being shown, to light yellow for areas with the lowest rates (grey is used to represent areas with zero counts for the information shown).
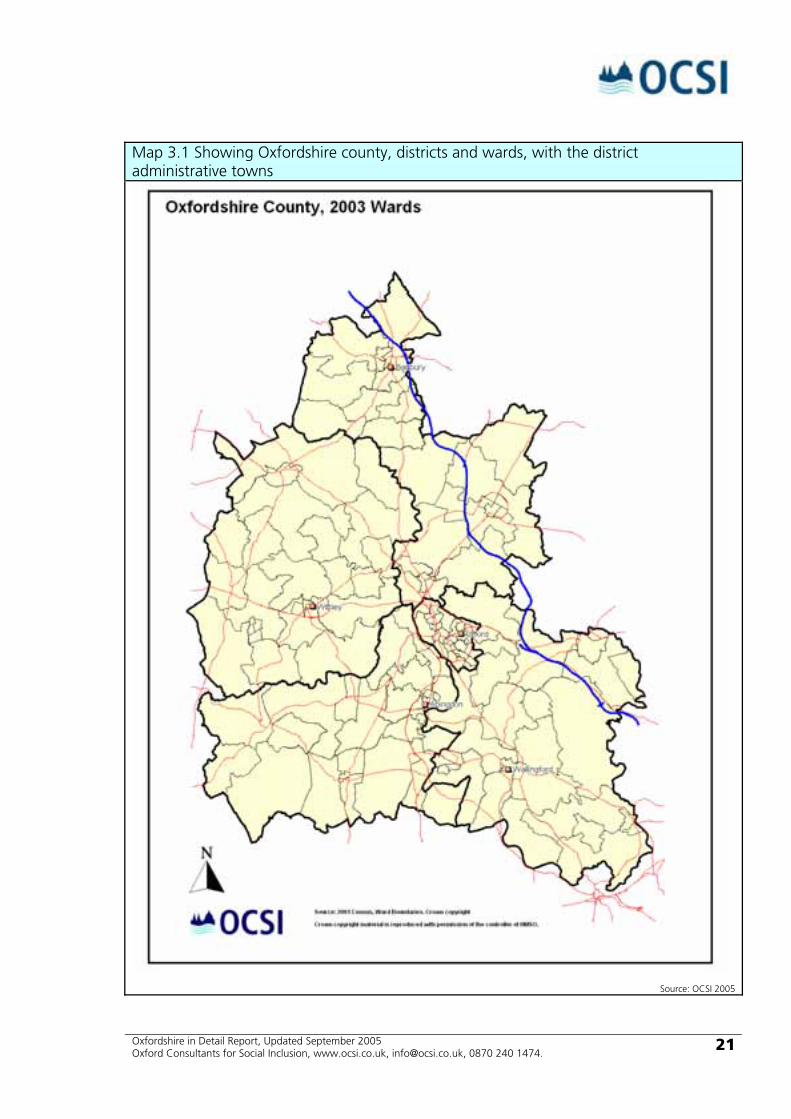
Map 3.1 shows the current geography of Oxfordshire, showing the district and ward boundaries (see the Background: Knowing the Geographies for explanation of these areas). Each district has its own local authority administration with the towns that host these administrative centres shown on the map.
Oxfordshire in Detail Report, Updated September 2005 Oxford Consultants for Social Inclusion, www.ocsi.co.uk, [email protected], 0870 240 1474.
21
Map 3.1 Showing Oxfordshire county, districts and wards, with the district administrative towns
Source: OCSI 2005
Oxfordshire in Detail Report, Updated September 2005 Oxford Consultants for Social Inclusion, www.ocsi.co.uk, [email protected], 0870 240 1474.
22
3.1 Who serves the people in Oxfordshire? People living, working and studying in Oxfordshire are served by two main tiers of local government. The upper tier is Oxfordshire County Council, while the lower tier is made up of the five District Councils.
Oxfordshire County Council has responsibility for many key local services. These include schools; social services; the fire service; roads; libraries and the museums service; trading standards; land use and transport planning; and waste management. Each year Oxfordshire County Council manages £500 million of public money in the provision of these services on behalf of Oxfordshire’s population.
The main services provided by the five Oxfordshire District Councils include environmental health; housing; leisure and recreation; planning applications; and waste collection.
In addition to the two main tiers of government in Oxfordshire, all districts except Oxford are divided into towns or parishes. Town and Parish Councils represent smaller geographical areas such as Banbury, Chinnor, Woodstock or Buckland. They have responsibilities for various local amenities, which may include bus shelters; public benches; footpaths; allotments; playing fields; and parish funds. In Oxford, all these services are provided by the District Council.
Not all areas of the UK are served by both a County and a District Council; in some areas, especially the major metropolitan centres, all public services are provided by a Unitary Authority or Metropolitan Borough Council.
3.2 Presenting information across Oxfordshire Although counties and districts (and to a lesser extent, towns and parishes) are key administrative geographies, they are not well suited to the task of presenting information on social exclusion. The county and districts may contain a heterogeneous mix of social conditions – with some neighbourhoods having very low levels of deprivation and others having very high levels. Presenting information at county and district level tends to average out these extremes, and information may be lost.
Identifying pockets of deprivation within the county and districts enables resources to be targeted effectively and efficiently at the areas of greatest need. It is also then possible to assess the impact of these resources on the targeted communities.
A number of different sub-district geographies exist in England, with the most familiar being ‘wards’. Wards are more suited to presenting social exclusion related information than counties and districts as their smaller size enables pockets of disadvantage to be identified that might otherwise be missed. Even smaller than wards are the new statistical geographies created for the purpose of presenting 2001 Census results - Super Output Areas (SOAs) and Output Areas (OAs). The 2001 Census also standardised the definitions of wards for presenting statistical information, defining the 2003 wards
Oxfordshire in Detail Report, Updated September 2005 Oxford Consultants for Social Inclusion, www.ocsi.co.uk, [email protected], 0870 240 1474.
23
used in this report. All these geographies are discussed in more detail in the Background: Knowing the geographies box below.
In this report, information is presented using these statistical geographies, at 2003 ward and Census Super Output Area level, as well as at district, county, regional and England level.
Background: Knowing the geographies
Regions
There are nine regions in England: North East, North West, Yorkshire and the Humber, East Midlands, West Midlands, East, London, South-East, and South West. Each region has its own Government Office which represents central government in the region. The geographical boundaries of the regions have remained stable since 1998. The county of Oxfordshire lies within the South-East region.
Counties
There are 35 Shire counties in England, as well as 6 metropolitan counties (Greater London is an ‘administrative area’, and is now a region in its own right). The geographical boundaries of the counties in England have remained stable since 1998, and counties nest within regions.
Districts
There are 354 districts in England (including Unitary Authorities, Metropolitan and London Boroughs), of which 67 lie within the South-East region. Of these, five districts make up the county of Oxfordshire: Cherwell, Oxford, South Oxfordshire, Vale of White Horse, and West Oxfordshire. The geographical boundaries of the districts in England have remained stable since 1998. Districts nest within regions and counties.
Wards
Wards are essentially units of electoral administration and their boundaries therefore change relatively frequently (compared to higher level geographies such as districts). This makes the ward geography difficult to use when attempting to monitor social change over time.
To reduce this problem of ward boundary changes, the 2001 Census defined two sets of ward boundaries, constructed from smaller Census Output Areas (discussed below): ‘Census Area Statistics’ (CAS) wards; and ‘Standard Table’ (ST) wards. All ward level data presented within this report are based on ‘Census Area Statistics’ (CAS) ward boundaries. The 2001 Census website contains a wealth of useful explanation regarding the differences between the two sets of Census wards - http://www.statistics.gov.uk/geography/default.asp.
CAS wards represent the electoral ward boundaries as at the beginning of 2003 (with a small number of wards merged together in order not to disclose information that might be used to identify individuals). For this reason, they are often referred to as ‘2003 wards’. As this report uses only 2003 wards (i.e. CAS wards), the ward boundaries shown in the maps in this report may not be the same as those used in other reports,

Oxfordshire in Detail Report, Updated September 2005 Oxford Consultants for Social Inclusion, www.ocsi.co.uk, [email protected], 0870 240 1474.
24
such as those used in the 1991 Census and the Indices of Deprivation 2000. Even where a ward has the same name, it may not have the same boundaries – sometimes the shape of a ward will change whilst the name stays the same.
The average population size of 2003 wards in England is just under 6,000 people, with a minimum population of just over 100 people and a maximum of over 35,000 people.
The number of 2003 wards across England is 7,969. Of these, 137 wards lie within Oxfordshire. The district of Cherwell contains 28 wards, Oxford contains 24 wards, South Oxfordshire contains 29 wards, Vale of White Horse contains 29 wards, and West Oxfordshire contains 27 wards. Wards nest within regions, counties and districts.
Census Super Output Areas
Census Super Output Areas (SOAs) are a new statistical geography created for the purpose of presenting the 2001 Census, the Indices of Deprivation 2004, and other neighbourhood statistics. There are three layers to the SOA geography: ‘lower layer’; ‘middle layer’; and ‘upper layer’. All SOA level data presented within this report are based on ‘lower layer’ SOA boundaries, which is the only layer that has been released to date. See the 2001 Census website referenced above for further details of the different SOA layers.
Unlike wards, SOAs are designed to produce areas of approximately equal population size, with the mean population of lower layer SOAs being approximately 1500 people. Although there remains a degree of variation around this mean of 1500 persons (the smallest lower layer SOA population in England is just under 1000 whilst the highest population is over 6000), the large majority of lower layer SOAs have populations close to 1500. This standardised population size makes the lower layer SOA geography well suited to identifying smaller pockets of deprivation that may be averaged out over large wards.
There are 32,482 lower layer SOAs in England, of which 404 lie within Oxfordshire. The district of Cherwell contains 91 lower layer SOAs; Oxford contains 85 lower layer SOAs; South Oxfordshire contains 89 lower layer SOAs; Vale of White Horse contains 75 lower layer SOAs; and West Oxfordshire contains 64 lower layer SOAs. Lower layer SOAs nest within regions, counties and districts. Lower layer SOAs also nest perfectly within the Census Standard Table wards. Although the majority of lower layer SOAs do nest within the CAS wards used in this report, this is not true in every case. For more information on how lower layer SOAs relate to Census wards, please refer to the 2001 Census website referenced above.
Census Output Areas
2001 Census Output Areas (OAs) are the primary new geography created for the purpose of presenting 2001 Census results. OAs are built from clusters of adjacent unit postcodes and therefore represent the smallest Census geography; they are essentially the building block at which all Census data are collected. Census statistics for higher level geographies, such as SOAs, 2003 wards, districts and regions and so on, are created by aggregating the constituent OAs.
OAs are designed to have similar population sizes and be as socially homogenous as possible (based on tenure of household and dwelling type). Wherever possible,

Oxfordshire in Detail Report, Updated September 2005 Oxford Consultants for Social Inclusion, www.ocsi.co.uk, [email protected], 0870 240 1474.
25
urban/rural mixes are avoided (i.e. postcodes in an OA should be either all urban or all rural). OAs usually have approximately regular shapes and they are usually constrained by boundaries such as major roads. In order to ensure the confidentiality of data, OAs are required to have a specified minimum population size. The Office for National Statistics set the minimum OA size at 40 resident households and 100 resident persons but the recommended size is actually rather larger at 125 households. These size thresholds mean that unusually small wards and parishes are incorporated into larger OAs.
In total there are 165,665 OAs in England. Of these, 1,977 lie within Oxfordshire. The district of Cherwell contains 431 OAs; Oxford contains 414 OAs; South Oxfordshire contains 430 OAs; Vale of White Horse contains 382 OAs; and West Oxfordshire contains 320 OAs. As noted above, OAs nest within SOAs, 2003 wards, districts, counties and regions.
3.3 Comparing Oxfordshire with other areas Throughout this report, a number of comparison areas are used to provide context for Oxfordshire information. These comparison areas have been selected as the shire counties of Buckinghamshire, Cambridgeshire, Devon, Dorset, Gloucestershire, Hampshire, Northamptonshire, North Yorkshire, Somerset, Suffolk, Warwickshire, and Wiltshire, as well as the districts of Swindon, West Berkshire, Reading, Milton Keynes, and Cambridge.
Information is also presented at South-East regional level, and for England as a whole.
Oxfordshire in Detail Report, Updated September 2005 Oxford Consultants for Social Inclusion, www.ocsi.co.uk, [email protected], 0870 240 1474.
26
Section 4 Who lives in Oxfordshire? Population size and structure
Oxfordshire England
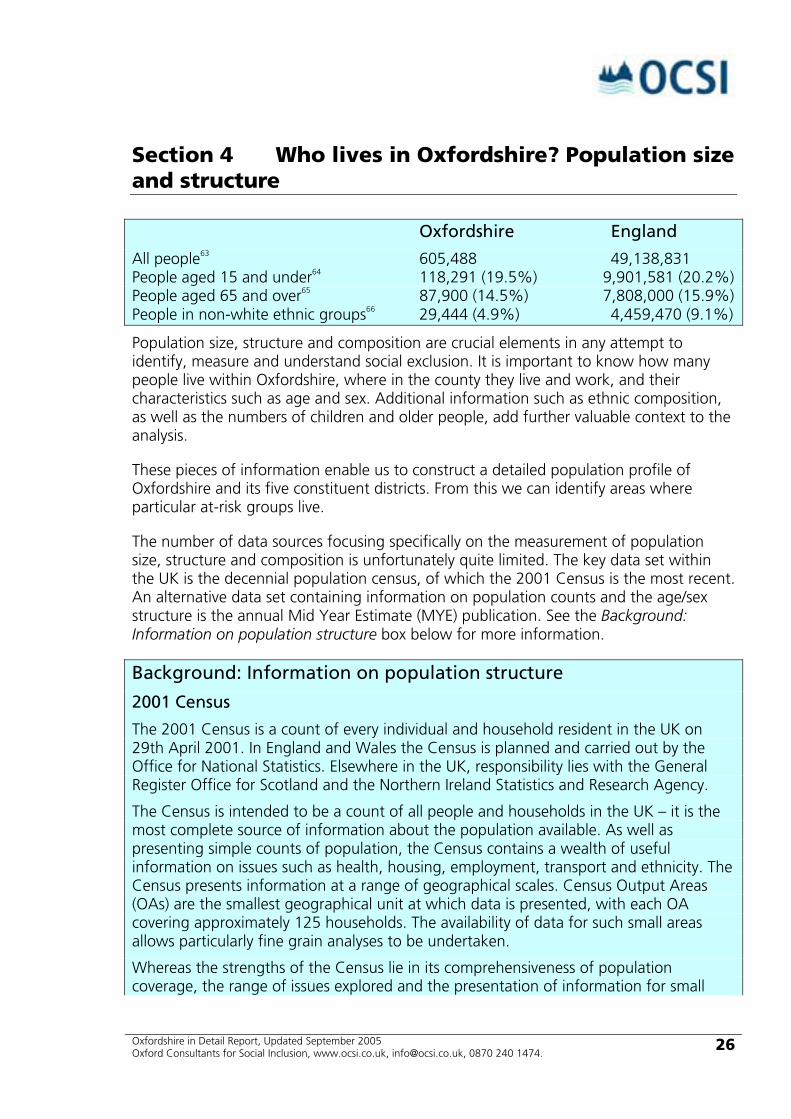
All people63 605,488 49,138,831 People aged 15 and under64 118,291 (19.5%) 9,901,581 (20.2%) People aged 65 and over65 87,900 (14.5%) 7,808,000 (15.9%) People in non-white ethnic groups66 29,444 (4.9%) 4,459,470 (9.1%)
Population size, structure and composition are crucial elements in any attempt to identify, measure and understand social exclusion. It is important to know how many people live within Oxfordshire, where in the county they live and work, and their characteristics such as age and sex. Additional information such as ethnic composition, as well as the numbers of children and older people, add further valuable context to the analysis.
These pieces of information enable us to construct a detailed population profile of Oxfordshire and its five constituent districts. From this we can identify areas where particular at-risk groups live.
The number of data sources focusing specifically on the measurement of population size, structure and composition is unfortunately quite limited. The key data set within the UK is the decennial population census, of which the 2001 Census is the most recent. An alternative data set containing information on population counts and the age/sex structure is the annual Mid Year Estimate (MYE) publication. See the Background: Information on population structure box below for more information.
Background: Information on population structure
2001 Census
The 2001 Census is a count of every individual and household resident in the UK on 29th April 2001. In England and Wales the Census is planned and carried out by the Office for National Statistics. Elsewhere in the UK, responsibility lies with the General Register Office for Scotland and the Northern Ireland Statistics and Research Agency.
The Census is intended to be a count of all people and households in the UK – it is the most complete source of information about the population available. As well as presenting simple counts of population, the Census contains a wealth of useful information on issues such as health, housing, employment, transport and ethnicity. The Census presents information at a range of geographical scales. Census Output Areas (OAs) are the smallest geographical unit at which data is presented, with each OA covering approximately 125 households. The availability of data for such small areas allows particularly fine grain analyses to be undertaken.
Whereas the strengths of the Census lie in its comprehensiveness of population coverage, the range of issues explored and the presentation of information for small

Oxfordshire in Detail Report, Updated September 2005 Oxford Consultants for Social Inclusion, www.ocsi.co.uk, [email protected], 0870 240 1474.
27
geographical areas, its major weakness is that it only occurs once every ten years. Census information therefore quickly becomes out of date.
A second weakness of the Census is that there is a degree of underenumeration i.e. not everybody returns their census form and, not all who do, complete it accurately or truthfully. This underenumeration applies to certain population groups more than others, with young adult males being particularly affected. The 2001 Census also suffers from particular underenumeration problems in certain local authorities. See the 2001 Census website for more details: http://www.statistics.gov.uk/census2001/default.asp
Mid Year Estimates (MYEs)
The Mid Year Estimates are an annual publication, providing counts of population broken down by age and sex for each district in the UK. Population counts are also provided for a number of higher level geographies. In England and Wales, the MYEs are planned and carried out by the Office for National Statistics. Elsewhere in the UK, responsibility lies with the General Register Office for Scotland and the Northern Ireland Statistics and Research Agency.
Whereas the Census is released only once every ten years, the MYEs are released each year. The MYEs are calculated by taking the Census population for each district, adding in the births since the Census, subtracting the deaths since the Census, and estimating net migration since the Census.
The major strength of the MYEs is that they are updated annually, so (unlike the Census) they do not quickly become out of date. The MYEs also contain a useful breakdown by 5 year age band and sex. The weaknesses of the MYEs compared to the Census, however, are that the MYEs are only released at district level and above (i.e. not down to OA, SOA or ward level) and they do not contain any information on population characteristics other than age and sex.
Estimating small area populations using the 2001 Census and MYEs
In order to investigate the patterns of deprivation at small area level, we often want to look at the rate of deprivation across the area. Therefore we need to know both the number of people in the area experiencing that form of deprivation, and the total number of people in the area.
If we want to estimate the populations of small areas for years other than the Census year, or be able to compare the populations (and hence the rates of deprivation) with years other than the census year, we use a technique based on the Mid Year Estimate for the district, and the 2001 Census data. This technique enables us to calculate the populations living in any small area, and to use these populations to calculate the proportion of population experiencing different forms of deprivation.
We use the Census 2001 information to calculate the proportion of the district population living in each of the smaller areas. We then assign this proportion of the Mid Year Estimate district population to each of the smaller areas, giving us an estimate of the numbers of people living in each area, broken down by gender and five-year age bands.
Oxfordshire in Detail Report, Updated September 2005 Oxford Consultants for Social Inclusion, www.ocsi.co.uk, [email protected], 0870 240 1474.
28
The technique is based on the assumption that the proportion of the district population living in each smaller area does not vary over the years. This will not be true over long periods of time - some smaller areas may see large building projects or much bigger inward or outward migration than other areas - but for years close to the Census it is likely to be reasonably accurate. Having information on change in available housing and amount of inward and outward migration for the smaller areas can improve this population estimate, however this information is difficult to obtain.
For further information on this technique, see Appendix B.
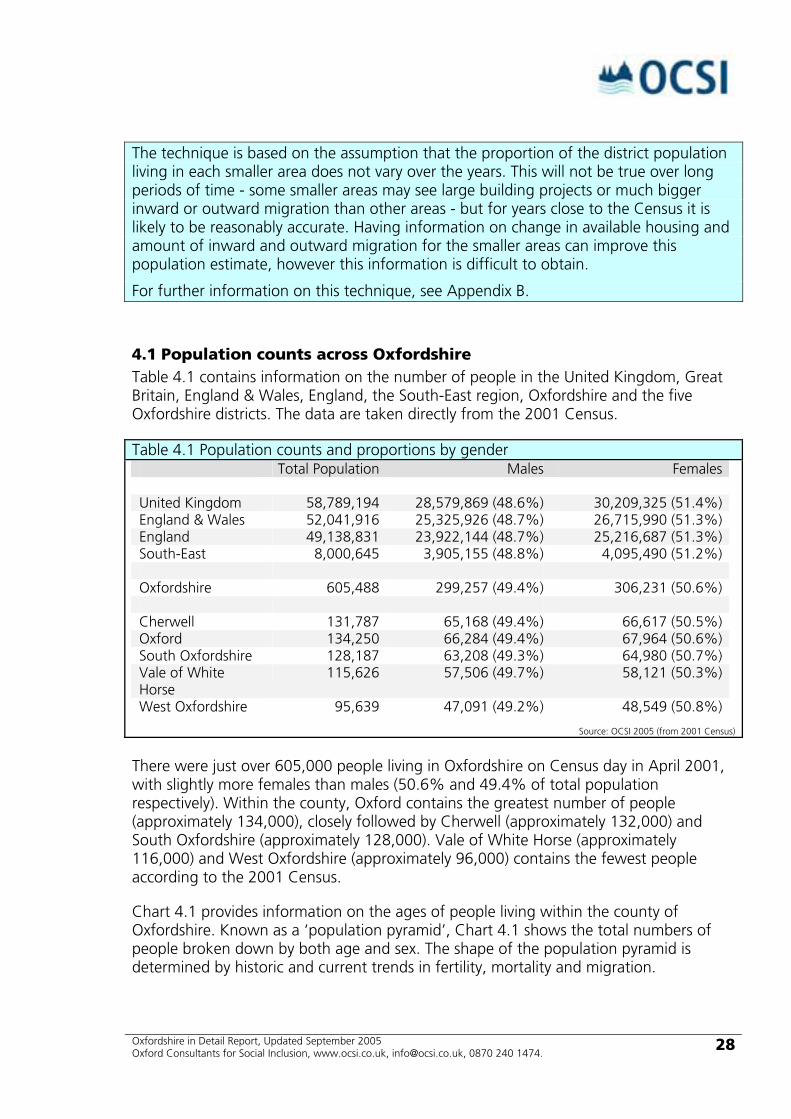
4.1 Population counts across Oxfordshire Table 4.1 contains information on the number of people in the United Kingdom, Great Britain, England & Wales, England, the South-East region, Oxfordshire and the five Oxfordshire districts. The data are taken directly from the 2001 Census.
Table 4.1 Population counts and proportions by gender Total Population Males Females United Kingdom 58,789,194 28,579,869 (48.6%) 30,209,325 (51.4%)England & Wales 52,041,916 25,325,926 (48.7%) 26,715,990 (51.3%)England 49,138,831 23,922,144 (48.7%) 25,216,687 (51.3%)South-East 8,000,645 3,905,155 (48.8%) 4,095,490 (51.2%) Oxfordshire 605,488 299,257 (49.4%) 306,231 (50.6%) Cherwell 131,787 65,168 (49.4%) 66,617 (50.5%)Oxford 134,250 66,284 (49.4%) 67,964 (50.6%)South Oxfordshire 128,187 63,208 (49.3%) 64,980 (50.7%)Vale of White Horse
115,626 57,506 (49.7%) 58,121 (50.3%)
West Oxfordshire 95,639 47,091 (49.2%) 48,549 (50.8%)
Source: OCSI 2005 (from 2001 Census)
There were just over 605,000 people living in Oxfordshire on Census day in April 2001, with slightly more females than males (50.6% and 49.4% of total population respectively). Within the county, Oxford contains the greatest number of people (approximately 134,000), closely followed by Cherwell (approximately 132,000) and South Oxfordshire (approximately 128,000). Vale of White Horse (approximately 116,000) and West Oxfordshire (approximately 96,000) contains the fewest people according to the 2001 Census.
Chart 4.1 provides information on the ages of people living within the county of Oxfordshire. Known as a ‘population pyramid’, Chart 4.1 shows the total numbers of people broken down by both age and sex. The shape of the population pyramid is determined by historic and current trends in fertility, mortality and migration.

Oxfordshire in Detail Report, Updated September 2005 Oxford Consultants for Social Inclusion, www.ocsi.co.uk, [email protected], 0870 240 1474.
29
Chart 4.1 Oxfordshire population by age and gender
6,000 4,000 2,000 0 2,000 4,000 6,000Age 0
Age 10
Age 20
Age 30
Age 40
Age 50
Age 60
Age 70
Age 80
Age 90
Population
Male Female
Source: 2001 Census
Oxfordshire’s population pyramid is fairly typical of most counties and districts in the United Kingdom. The ratios of males to females are approximately equal during the child, working age and early pensionable years. In the more elderly age groups, the proportion of females increases due to their greater life expectancy. Dips and peaks in the age distribution are the result of particular trends in fertility, mortality or migration, and the shape of the pyramid is determined by the interaction of these three factors over time.
The population counts in the age groups up to the late teens are fairly stable. A steep increase is seen in the late teens and early twenties – most likely due to the large number of students migrating into Oxfordshire. This is then followed by a drop in the mid twenties and then a subsequent steep increase in the late twenties, continuing through the thirties, until falling away again in the forties. Another peak is seen in the mid fifties (caused by the post World War II baby boom), followed by a gradual decrease in population through the older age groups.
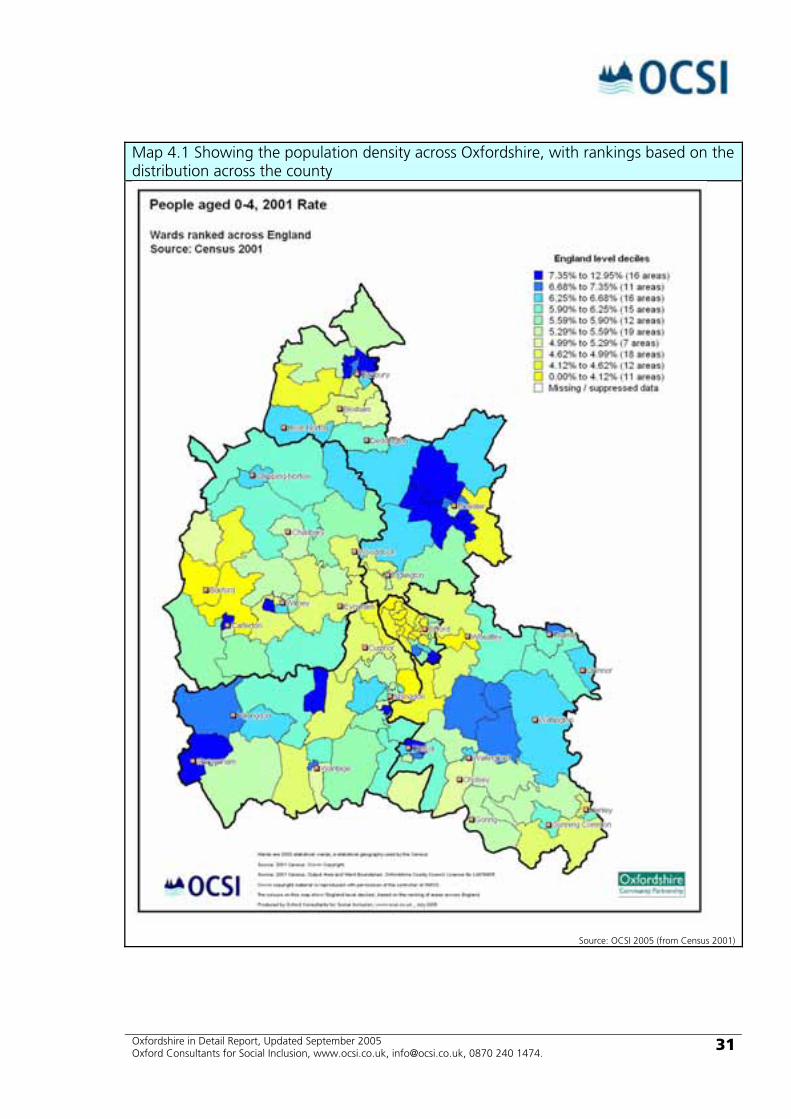
4.2 Population density In addition to understanding how many people live within Oxfordshire, in which districts they live, and their age and sex characteristics, it is useful to know how these people are distributed across the county. For example, where are the concentrations of people at sub-district level? Map 4.1 shows the population density for each ward in Oxfordshire, the average number of people living per hectare across each ward.
Map 4.1 highlights the urban areas across Oxfordshire. The ten colour coded intervals represent deciles and are based on the distribution across Oxfordshire. Wards in Map 4.1 that are coloured the darkest shade of blue are in the ‘top’ 10% of wards across the county in terms of population density, with wards coloured the lightest shade of yellow in the ‘bottom’ 10% of wards across the county in terms of population density. As expected, Oxford has the highest concentration of areas with high population density,
Oxfordshire in Detail Report, Updated September 2005 Oxford Consultants for Social Inclusion, www.ocsi.co.uk, [email protected], 0870 240 1474.
30
but other areas are also highlighted – Banbury, Bicester, Witney, Abingdon and Didcot. The map also shows up the large rural areas across the county, in the four districts outside Oxford.
Oxfordshire in Detail Report, Updated September 2005 Oxford Consultants for Social Inclusion, www.ocsi.co.uk, [email protected], 0870 240 1474.
31
Map 4.1 Showing the population density across Oxfordshire, with rankings based on the distribution across the county
Source: OCSI 2005 (from Census 2001)

Oxfordshire in Detail Report, Updated September 2005 Oxford Consultants for Social Inclusion, www.ocsi.co.uk, [email protected], 0870 240 1474.
32
Map 4.2 Showing the proportions of children aged 0-4 across Oxfordshire, with rankings based on the distribution across England.
Source: OCSI 2005 (from Census 2001)
Oxfordshire in Detail Report, Updated September 2005 Oxford Consultants for Social Inclusion, www.ocsi.co.uk, [email protected], 0870 240 1474.
33
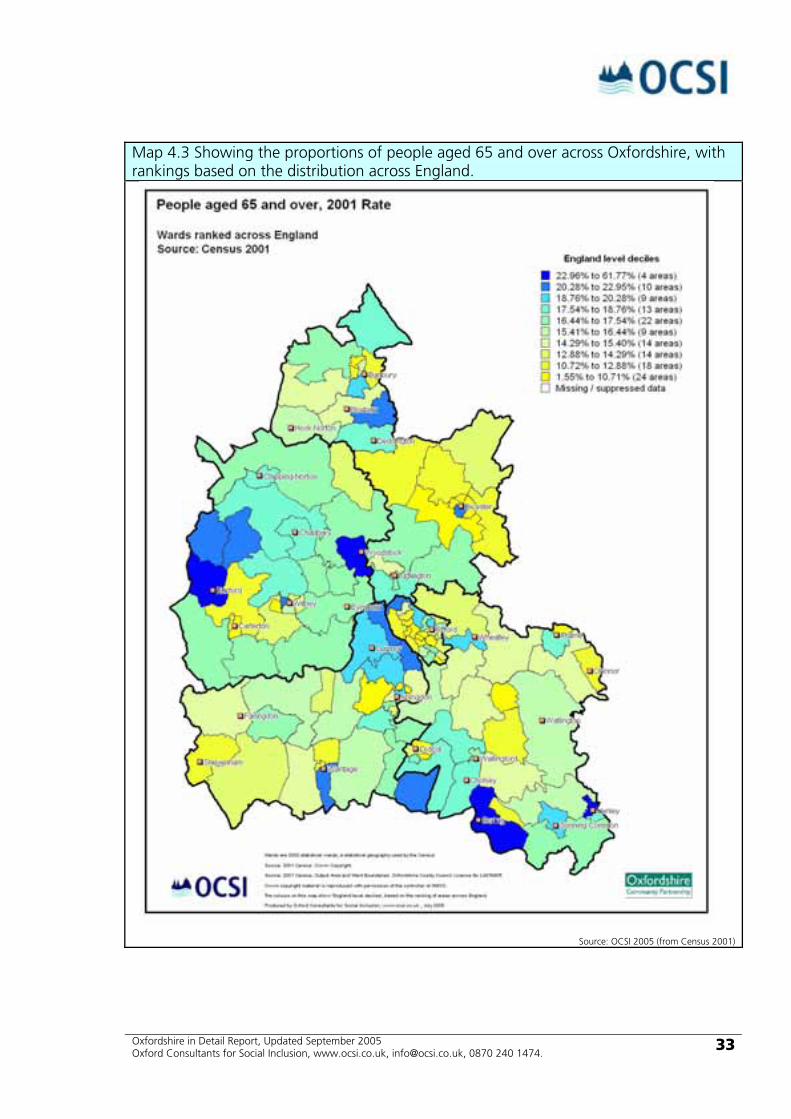
Map 4.3 Showing the proportions of people aged 65 and over across Oxfordshire, with rankings based on the distribution across England.
Source: OCSI 2005 (from Census 2001)
Oxfordshire in Detail Report, Updated September 2005 Oxford Consultants for Social Inclusion, www.ocsi.co.uk, [email protected], 0870 240 1474.
34
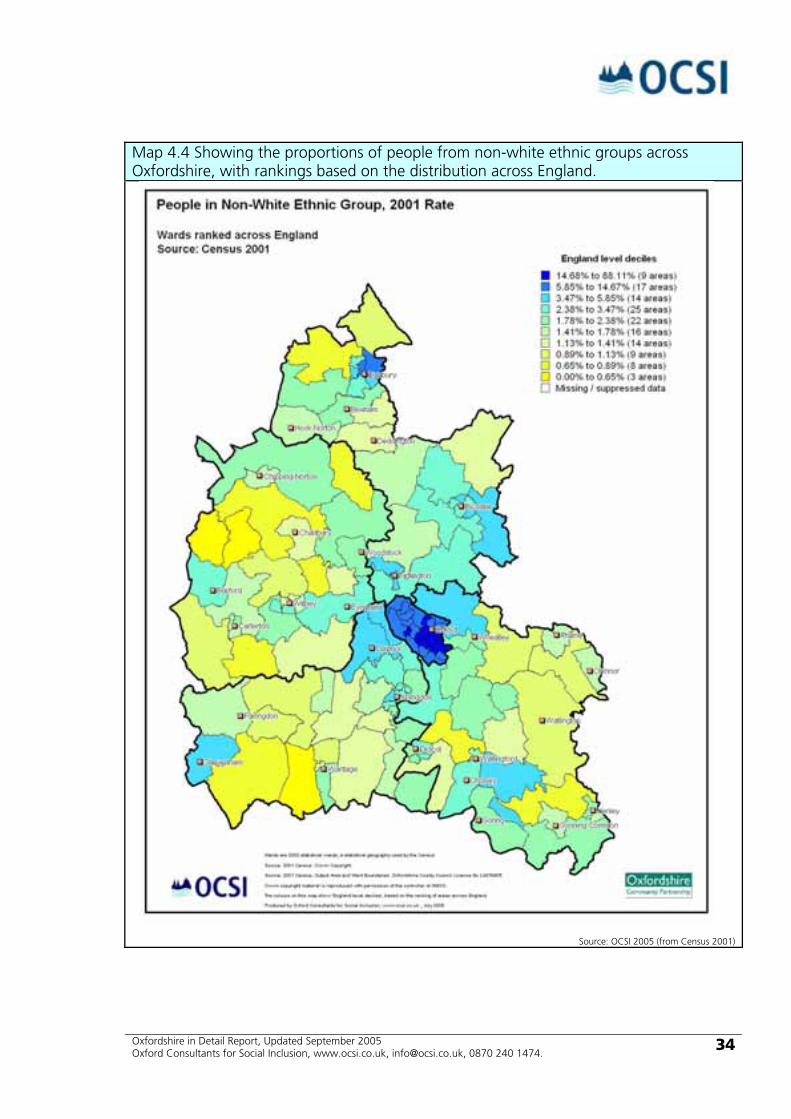
Map 4.4 Showing the proportions of people from non-white ethnic groups across Oxfordshire, with rankings based on the distribution across England.
Source: OCSI 2005 (from Census 2001)

Oxfordshire in Detail Report, Updated September 2005 Oxford Consultants for Social Inclusion, www.ocsi.co.uk, [email protected], 0870 240 1474.
35
4.3 ‘At-risk’ groups: Young children, elderly people, and people from ethnic minority groups Although it is not possible to deduce anything about actual levels of social exclusion from straight population counts, such data do enable the identification of concentrations of people who may be particularly ‘at-risk’ of social exclusion. Three key population subgroups that are known to be particularly vulnerable to social exclusion are young children, the elderly and people from minority ethnic groups.
Maps 4.2 and 4.3 show the proportions of people in each ward in Oxfordshire that are aged 0-4 and 65 and over, respectively. Map 4.4 shows the proportion of people in each of the five districts in Oxfordshire that are from non-white ethnic groups. As noted above, these maps do not provide any information about actual levels of social exclusion; they simply enable the identification of areas with relatively high proportions of potentially ‘at-risk’ individuals and/or families. The maps do, therefore, provide valuable contextual information for the following sections.
Map 4.2 shows the proportion of total ward population aged 0-4. The ten colour coded intervals represent deciles and are based on the distribution across England as a whole (this is different from the population density Map 4.1, which was based on the distribution across the county. The different types of map help us to look at patterns across the county, and to compare Oxfordshire with information across England). Therefore, those wards in Map 4.2 that are coloured the darkest shade of blue are in the ‘top’ 10% of wards across the country in terms of proportions of people aged 0-4 (i.e. with the highest proportions of people aged 0-4). Areas in and around Banbury and Bicester have particularly high proportions of people aged 0-4. By contrast Oxford has only two such wards – Northfield Brook and Blackbird Leys. Carterton and Didcot also show up as having areas with high proportions of people aged 0-4.
Chart 4.2 Proportions of people aged 0-4, wards with the highest proportions across the county
0.0%
2.0%
4.0%
6.0%
8.0%
10.0%
12.0%
14.0%
Englan
d
South
East
Oxfords
hire
Carterto
n North
East (W
O)
Biceste
r Nort
h (C)
Northfie
ld Brook (O
)
Didcot L
adyg
rove (S
O)
Biceste
r South
(C)
Caversf
ield (
C)
Shrive
nham (V
WH)
Witney
Wes
t (WO)
Banbu
ry Rus
cote
(C)
Abingd
on C
aldeco
tt (VW
H)
Blackb
ird Le
ys (O
)
Ambrosd
en an
d Che
sterto
n (C)
Banbu
ry Hard
wick (C
)
Banbu
ry Grim
sbury
and C
astle (
C)
Carterto
n North
Wes
t (WO)
Kingsto
n Bagpu
ize w
ith S
outhm
oor (
VWH)
Biceste
r East
(C)
Benso
n (SO)
Chalgrove
(SO)
Banbu
ry Neit
hrop (C
)
2001
Pop
ulat
ion
Rat
e
Source: 2001 Census

Oxfordshire in Detail Report, Updated September 2005 Oxford Consultants for Social Inclusion, www.ocsi.co.uk, [email protected], 0870 240 1474.
36
To support this, Chart 4.2 shows the wards across Oxfordshire with the highest proportions of people aged 0-4, compared with the county, region and England averages. Again we see wards in Carterton, Bicester, Banbury and Didcot have proportions of people aged 0-4 far above the regional and England average.
Map 4.3 shows the proportion of total ward population aged 65 and over. Similarly to Map 4.2 showing the proportion of people aged 0-4, the ten colour coded intervals represent deciles and are based on the distribution for England as a whole, with dark blue areas having the highest proportion of people aged 65 and over and light yellow areas having the lowest proportion.
Map 4.3 shows no clear pattern of distribution of people aged 65 and over across the county; each district contains dark blue coloured wards in the top deciles of the England distribution (i.e. wards with the highest proportions of people aged 65 and over), also each district contains light yellow coloured wards in the bottom deciles of the distribution across England (i.e. wards with the lowest proportions of people aged 65 and over).
Map 4.4 shows the distribution of people from non-white ethnic groups by ward across Oxfordshire. As in Maps 4.2 and 4.3, the ten colour coded intervals represent deciles and are based on the distribution for England as a whole, with dark blue areas having the highest proportion of people from non-white ethnic groups, and light yellow areas having the lowest proportion.
It is clear from Map 4.4 that the wards across Oxford have very high proportions of people from non-white ethnic groups, both in relation to the county and to England as a whole. However, a number of wards in other districts across the county also show relatively high proportions of people from non-white ethnic groups, for example around Banbury.
Oxfordshire in Detail Report, Updated September 2005 Oxford Consultants for Social Inclusion, www.ocsi.co.uk, [email protected], 0870 240 1474.
37
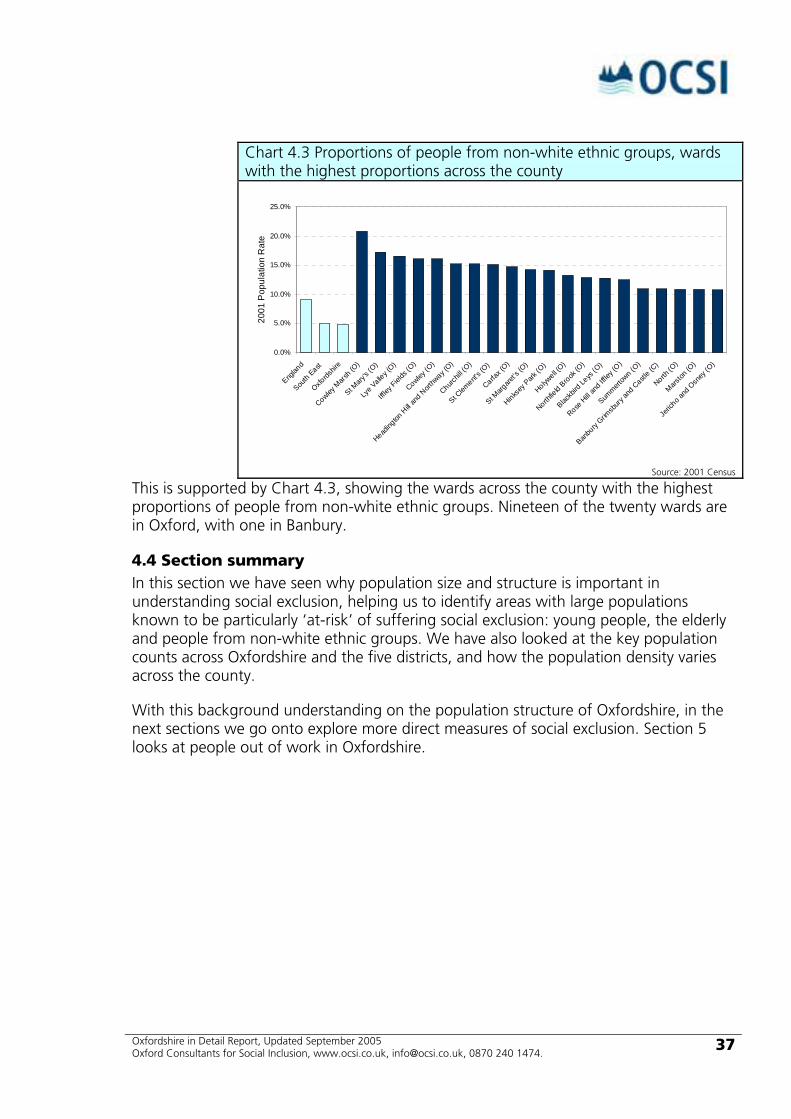
Chart 4.3 Proportions of people from non-white ethnic groups, wards with the highest proportions across the county
0.0%
5.0%
10.0%
15.0%
20.0%
25.0%
Englan
d
South
East
Oxfords
hire
Cowley M
arsh (
O)
St Mary
's (O)
Lye V
alley (
O)
Iffley
Fields
(O)
Cowley (O
)
Heading
ton H
ill and
Nort
hway (
O)
Churchil
l (O)
St Clem
ent's (
O)
Carfax (
O)
St Marg
aret's
(O)
Hinksey
Park
(O)
Holywell (
O)
Northfie
ld Brook
(O)
Blackb
ird Le
ys (O
)
Rose H
ill an
d Iffle
y (O)
Summert
own (O
)
Banbu
ry Grim
sbury
and C
astle (
C)
North (O
)
Marston
(O)
Jeric
ho and
Osn
ey (O
)
2001
Pop
ulat
ion
Rat
e
Source: 2001 Census
This is supported by Chart 4.3, showing the wards across the county with the highest proportions of people from non-white ethnic groups. Nineteen of the twenty wards are in Oxford, with one in Banbury.
4.4 Section summary In this section we have seen why population size and structure is important in understanding social exclusion, helping us to identify areas with large populations known to be particularly ‘at-risk’ of suffering social exclusion: young people, the elderly and people from non-white ethnic groups. We have also looked at the key population counts across Oxfordshire and the five districts, and how the population density varies across the county.
With this background understanding on the population structure of Oxfordshire, in the next sections we go onto explore more direct measures of social exclusion. Section 5 looks at people out of work in Oxfordshire.
Oxfordshire in Detail Report, Updated September 2005 Oxford Consultants for Social Inclusion, www.ocsi.co.uk, [email protected], 0870 240 1474.
38
Section 5 People out of work: Who is affected?
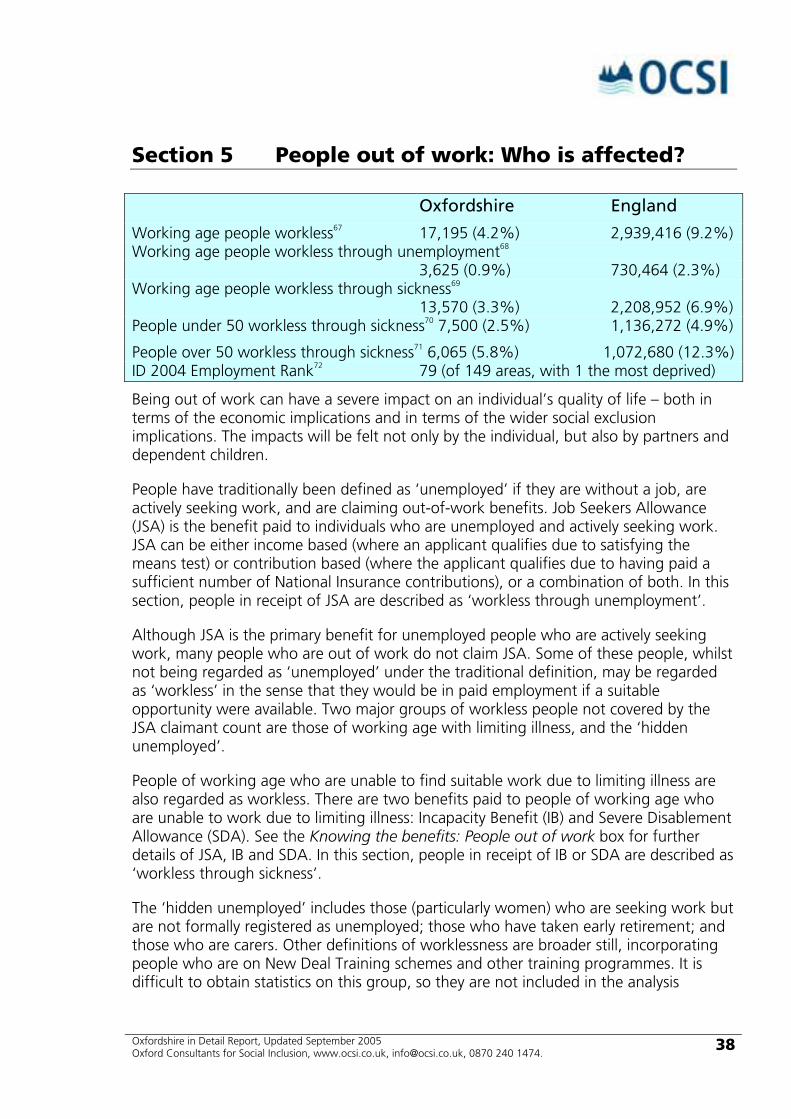
Oxfordshire England
Working age people workless67 17,195 (4.2%) 2,939,416 (9.2%) Working age people workless through unemployment68 3,625 (0.9%) 730,464 (2.3%) Working age people workless through sickness69 13,570 (3.3%) 2,208,952 (6.9%) People under 50 workless through sickness70 7,500 (2.5%) 1,136,272 (4.9%)
People over 50 workless through sickness71 6,065 (5.8%) 1,072,680 (12.3%) ID 2004 Employment Rank72 79 (of 149 areas, with 1 the most deprived)
Being out of work can have a severe impact on an individual’s quality of life – both in terms of the economic implications and in terms of the wider social exclusion implications. The impacts will be felt not only by the individual, but also by partners and dependent children.
People have traditionally been defined as ‘unemployed’ if they are without a job, are actively seeking work, and are claiming out-of-work benefits. Job Seekers Allowance (JSA) is the benefit paid to individuals who are unemployed and actively seeking work. JSA can be either income based (where an applicant qualifies due to satisfying the means test) or contribution based (where the applicant qualifies due to having paid a sufficient number of National Insurance contributions), or a combination of both. In this section, people in receipt of JSA are described as ‘workless through unemployment’.
Although JSA is the primary benefit for unemployed people who are actively seeking work, many people who are out of work do not claim JSA. Some of these people, whilst not being regarded as ‘unemployed’ under the traditional definition, may be regarded as ‘workless’ in the sense that they would be in paid employment if a suitable opportunity were available. Two major groups of workless people not covered by the JSA claimant count are those of working age with limiting illness, and the ‘hidden unemployed’.
People of working age who are unable to find suitable work due to limiting illness are also regarded as workless. There are two benefits paid to people of working age who are unable to work due to limiting illness: Incapacity Benefit (IB) and Severe Disablement Allowance (SDA). See the Knowing the benefits: People out of work box for further details of JSA, IB and SDA. In this section, people in receipt of IB or SDA are described as ‘workless through sickness’.
The ‘hidden unemployed’ includes those (particularly women) who are seeking work but are not formally registered as unemployed; those who have taken early retirement; and those who are carers. Other definitions of worklessness are broader still, incorporating people who are on New Deal Training schemes and other training programmes. It is difficult to obtain statistics on this group, so they are not included in the analysis
Oxfordshire in Detail Report, Updated September 2005 Oxford Consultants for Social Inclusion, www.ocsi.co.uk, [email protected], 0870 240 1474.
39
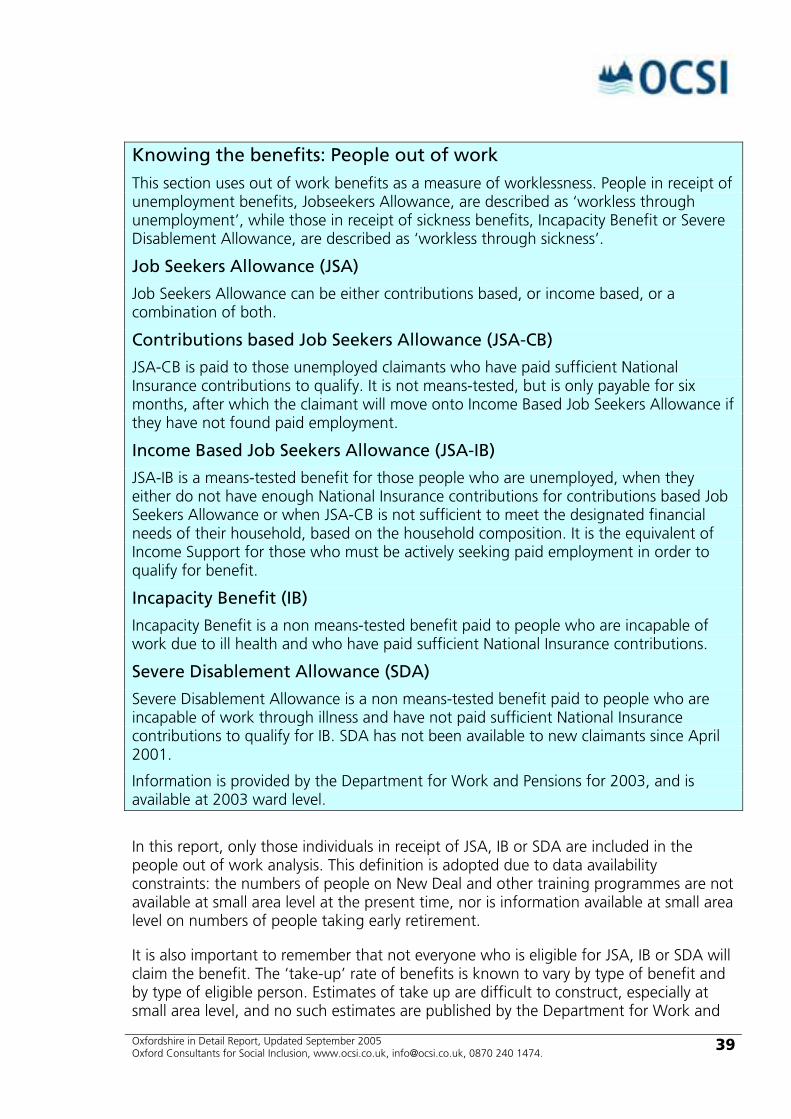
Knowing the benefits: People out of work This section uses out of work benefits as a measure of worklessness. People in receipt of unemployment benefits, Jobseekers Allowance, are described as ‘workless through unemployment’, while those in receipt of sickness benefits, Incapacity Benefit or Severe Disablement Allowance, are described as ‘workless through sickness’.
Job Seekers Allowance (JSA)
Job Seekers Allowance can be either contributions based, or income based, or a combination of both.
Contributions based Job Seekers Allowance (JSA-CB)
JSA-CB is paid to those unemployed claimants who have paid sufficient National Insurance contributions to qualify. It is not means-tested, but is only payable for six months, after which the claimant will move onto Income Based Job Seekers Allowance if they have not found paid employment.
Income Based Job Seekers Allowance (JSA-IB)
JSA-IB is a means-tested benefit for those people who are unemployed, when they either do not have enough National Insurance contributions for contributions based Job Seekers Allowance or when JSA-CB is not sufficient to meet the designated financial needs of their household, based on the household composition. It is the equivalent of Income Support for those who must be actively seeking paid employment in order to qualify for benefit.
Incapacity Benefit (IB)
Incapacity Benefit is a non means-tested benefit paid to people who are incapable of work due to ill health and who have paid sufficient National Insurance contributions.
Severe Disablement Allowance (SDA)
Severe Disablement Allowance is a non means-tested benefit paid to people who are incapable of work through illness and have not paid sufficient National Insurance contributions to qualify for IB. SDA has not been available to new claimants since April 2001.
Information is provided by the Department for Work and Pensions for 2003, and is available at 2003 ward level.
In this report, only those individuals in receipt of JSA, IB or SDA are included in the people out of work analysis. This definition is adopted due to data availability constraints: the numbers of people on New Deal and other training programmes are not available at small area level at the present time, nor is information available at small area level on numbers of people taking early retirement.
It is also important to remember that not everyone who is eligible for JSA, IB or SDA will claim the benefit. The ‘take-up’ rate of benefits is known to vary by type of benefit and by type of eligible person. Estimates of take up are difficult to construct, especially at small area level, and no such estimates are published by the Department for Work and
Oxfordshire in Detail Report, Updated September 2005 Oxford Consultants for Social Inclusion, www.ocsi.co.uk, [email protected], 0870 240 1474.
40
Pensions. It is therefore extremely difficult to predict what the true level of worklessness would be if every eligible person claimed JSA, IB or SDA.
When interpreting the workless data presented here, it is therefore important to bear in mind that not everyone who is actually workless will be captured by the benefits data utilised in this report.
5.1 People out of work across Oxfordshire This section contains a series of charts and maps describing people out of work across Oxfordshire for the year 2003. Claim rates are presented showing how Oxfordshire and its constituent areas compare to the England average and other comparison areas in terms of worklessness. Data are presented down to ward level, enabling pockets of employment deprivation to be identified within the county. All data contained within this section are for the year 2003.
The section also differentiates between the unemployed element of the workless population (i.e. those people claiming JSA, or ‘workless through unemployment’) and those with limiting illness (i.e. those people claiming IB or SDA, or ‘workless through sickness’). Overall worklessness is also presented.
Claim rates are calculated by dividing the number of claimants in an area by the number of ‘at-risk’ (i.e. potentially eligible) people in the area. For example, the working age workless rate represents the total number of JSA, IB and SDA claimants divided by the total population aged 16 to 64. The populations used to calculate these rates are estimated from the Census 2001 and Mid Year Estimate data, using the techniques described in Section 4.
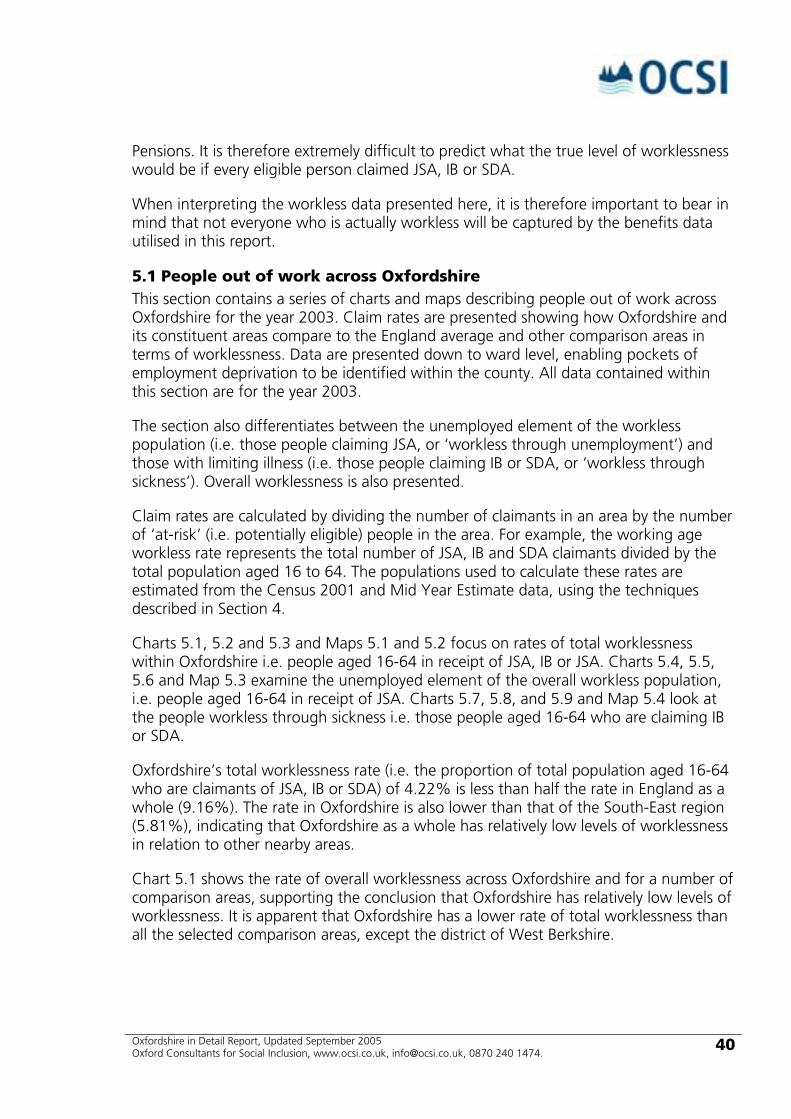
Charts 5.1, 5.2 and 5.3 and Maps 5.1 and 5.2 focus on rates of total worklessness within Oxfordshire i.e. people aged 16-64 in receipt of JSA, IB or JSA. Charts 5.4, 5.5, 5.6 and Map 5.3 examine the unemployed element of the overall workless population, i.e. people aged 16-64 in receipt of JSA. Charts 5.7, 5.8, and 5.9 and Map 5.4 look at the people workless through sickness i.e. those people aged 16-64 who are claiming IB or SDA.
Oxfordshire’s total worklessness rate (i.e. the proportion of total population aged 16-64 who are claimants of JSA, IB or SDA) of 4.22% is less than half the rate in England as a whole (9.16%). The rate in Oxfordshire is also lower than that of the South-East region (5.81%), indicating that Oxfordshire as a whole has relatively low levels of worklessness in relation to other nearby areas.
Chart 5.1 shows the rate of overall worklessness across Oxfordshire and for a number of comparison areas, supporting the conclusion that Oxfordshire has relatively low levels of worklessness. It is apparent that Oxfordshire has a lower rate of total worklessness than all the selected comparison areas, except the district of West Berkshire.
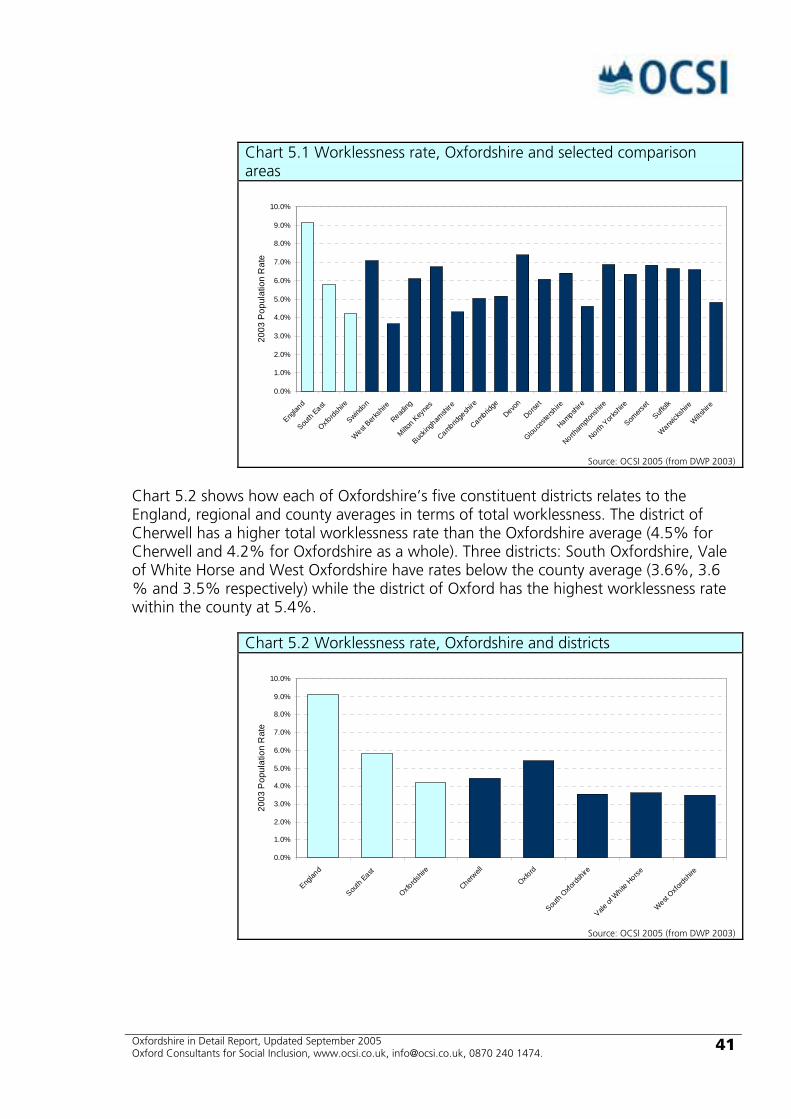
Oxfordshire in Detail Report, Updated September 2005 Oxford Consultants for Social Inclusion, www.ocsi.co.uk, [email protected], 0870 240 1474.
41
Chart 5.1 Worklessness rate, Oxfordshire and selected comparison areas
0.0%
1.0%
2.0%
3.0%
4.0%
5.0%
6.0%
7.0%
8.0%
9.0%
10.0%
Englan
d
South
East
Oxfords
hire
Swindon
West Berk
shire
Reading
Milton Key
nes
Buckin
gham
shire
Cambridge
shire
Cambridge
Devon
Dorset
Glouce
stersh
ire
Hampshire
Northam
ptons
hire
North York
shire
Somers
et
Suffolk
Warwick
shire
Wiltshir
e
2003
Pop
ulat
ion
Rat
e
Source: OCSI 2005 (from DWP 2003)
Chart 5.2 shows how each of Oxfordshire’s five constituent districts relates to the England, regional and county averages in terms of total worklessness. The district of Cherwell has a higher total worklessness rate than the Oxfordshire average (4.5% for Cherwell and 4.2% for Oxfordshire as a whole). Three districts: South Oxfordshire, Vale of White Horse and West Oxfordshire have rates below the county average (3.6%, 3.6 % and 3.5% respectively) while the district of Oxford has the highest worklessness rate within the county at 5.4%.
Chart 5.2 Worklessness rate, Oxfordshire and districts
0.0%
1.0%
2.0%
3.0%
4.0%
5.0%
6.0%
7.0%
8.0%
9.0%
10.0%
Englan
d
South
East
Oxfords
hire
Cherwell
Oxford
South
Oxfords
hire
Vale of
White
Horse
West Oxfo
rdshir
e
2003
Pop
ulat
ion
Rat
e
Source: OCSI 2005 (from DWP 2003)

Oxfordshire in Detail Report, Updated September 2005 Oxford Consultants for Social Inclusion, www.ocsi.co.uk, [email protected], 0870 240 1474.
42
Chart 5.3 Worklessness rate, wards with the highest rates across the county
0.0%
2.0%
4.0%
6.0%
8.0%
10.0%
12.0%
Englan
d
South
East
Oxfords
hire
Blackb
ird Le
ys (O
)
Northfie
ld Brook (O
)
Little
more (O
)
Banbu
ry Rus
cote
(C)
Barton
and S
andh
ills (O
)
Cowley (O
)
Banbu
ry Neit
hrop (C
)
Rose H
ill an
d Iffle
y (O)
Banbu
ry Grim
sbury
and C
astle (
C)
Abingd
on C
aldeco
tt (VW
H)
Hinksey
Park
(O)
Cowley M
arsh (
O)
Carfax (
O)
St Mary
's (O)
Iffley
Fields
(O)
Wallingford
North (S
O)
Abingd
on Abbe
y and
Barton (
VWH)
Chipping
Norto
n (WO)
Biceste
r Tow
n (C)
Didcot N
orthb
ourne (
SO)
2003
Pop
ulat
ion
Rat
e
Source: OCSI 2005 (from DWP 2003)
Although Oxfordshire has relatively low levels of people out of work compared to nearby areas, there are areas with significantly higher levels of worklessness. Chart 5.3 shows the twenty wards in Oxfordshire with the highest total worklessness rate. As in the other charts, comparison data for England, the South-East region, and Oxfordshire as a whole add valuable context to the ward level claim rates. Chart 5.3 demonstrates that some wards in Oxfordshire have claim rates substantially higher than the county average, and the South-East and England rates. Four wards in the county have worklessness rates over 9% - roughly one in eleven of the working age population in these wards are workless through unemployment or sickness.
With rates of 9.9%, Blackbird Leys and Northfield Brook in Oxford has the highest worklessness rate of any wards in Oxfordshire. With a rates of almost 10%, these wards have a worklessness rate that is over twice as high as the Oxfordshire average; significantly higher than the South-East region average; and slightly higher than the England average.
Six of the ten wards with the highest worklessness rates in Oxfordshire are in the district of Oxford, with three in Cherwell and the remaining ward in the Vale of the Whitehorse district. These data indicate that, although Oxfordshire as a whole has relatively low levels of worklessness (as demonstrated by comparing the county average with the England, regional and other comparison area averages), there are pockets of considerable employment deprivation where a large proportion of people are claiming Jobseekers Allowance, Incapacity Benefit, or Severe Disablement Allowance.
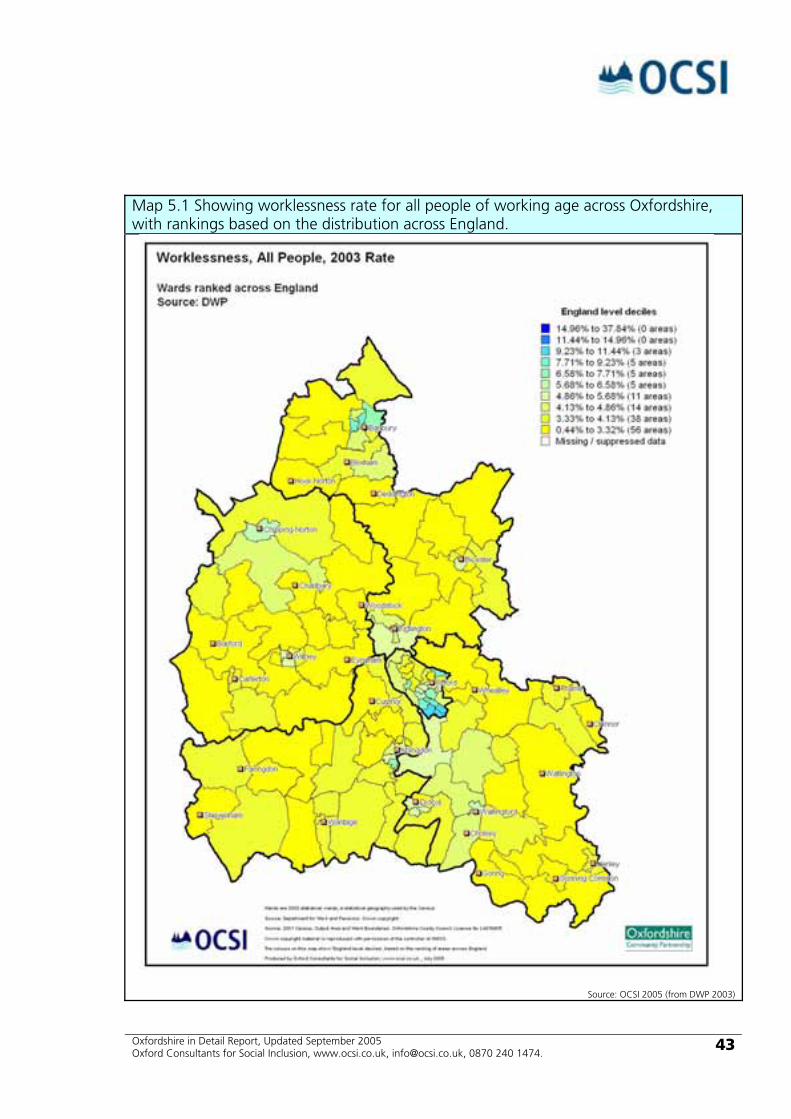
Oxfordshire in Detail Report, Updated September 2005 Oxford Consultants for Social Inclusion, www.ocsi.co.uk, [email protected], 0870 240 1474.
43
Map 5.1 Showing worklessness rate for all people of working age across Oxfordshire, with rankings based on the distribution across England.
Source: OCSI 2005 (from DWP 2003)
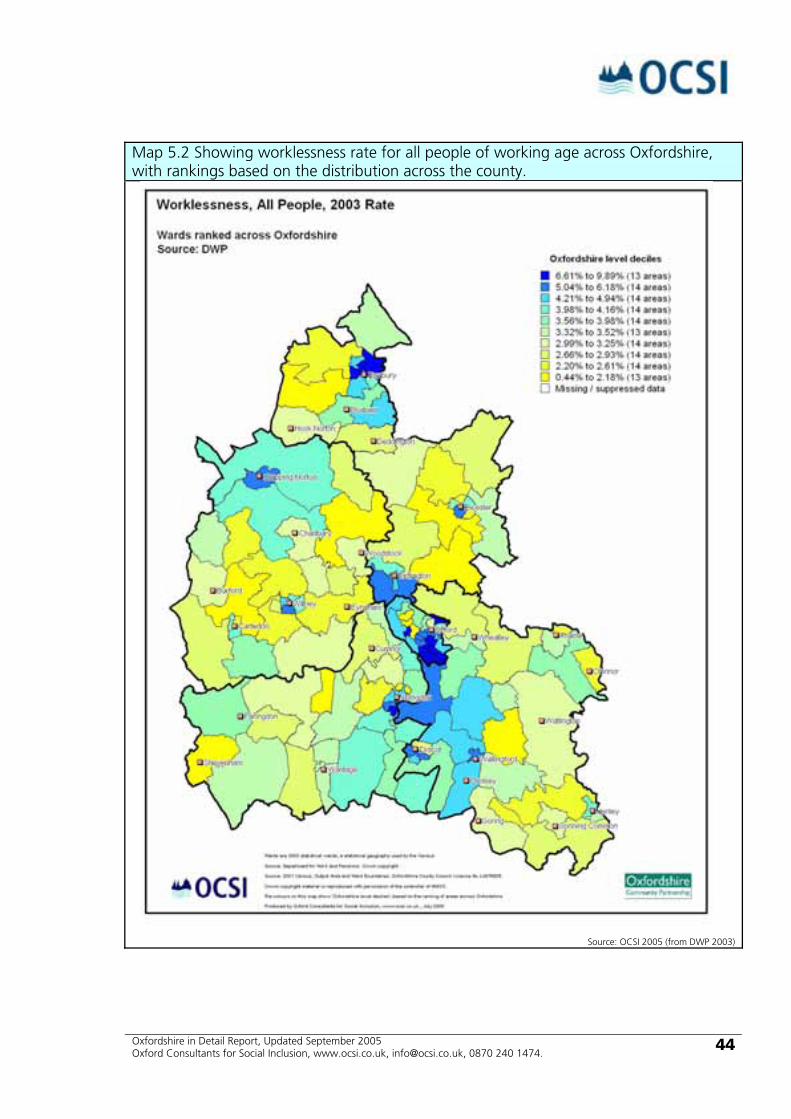
Oxfordshire in Detail Report, Updated September 2005 Oxford Consultants for Social Inclusion, www.ocsi.co.uk, [email protected], 0870 240 1474.
44
Map 5.2 Showing worklessness rate for all people of working age across Oxfordshire, with rankings based on the distribution across the county.
Source: OCSI 2005 (from DWP 2003)
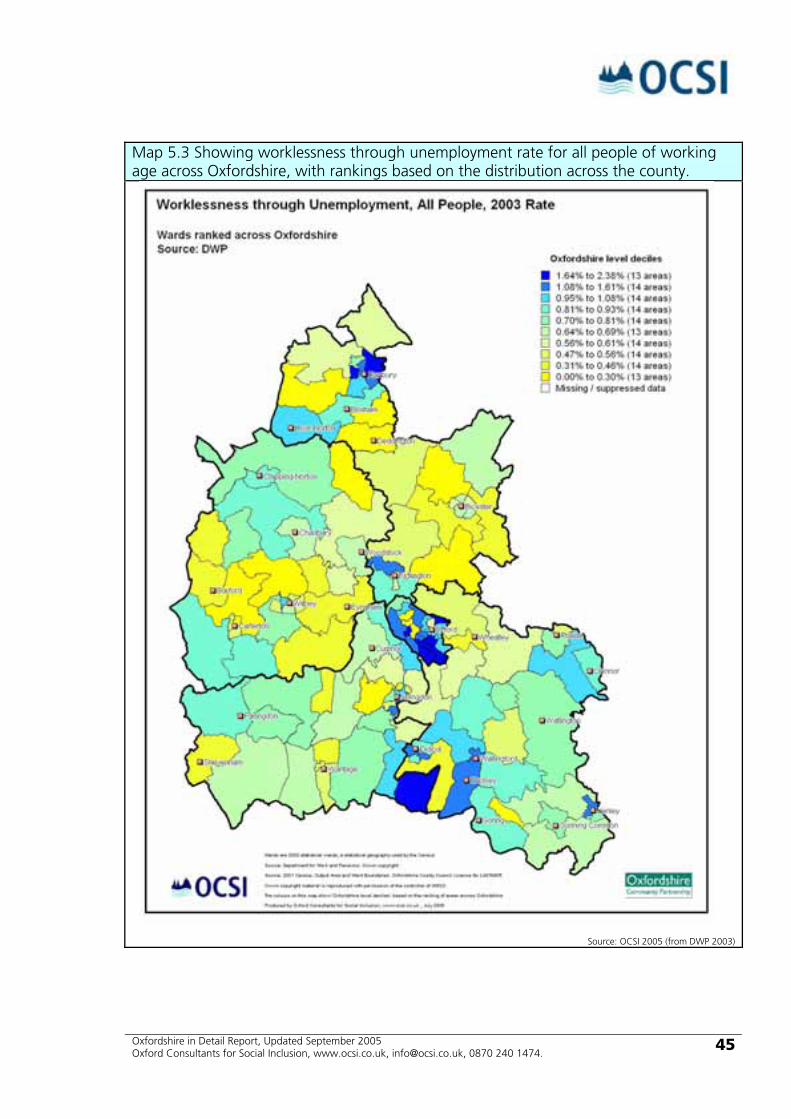
Oxfordshire in Detail Report, Updated September 2005 Oxford Consultants for Social Inclusion, www.ocsi.co.uk, [email protected], 0870 240 1474.
45
Map 5.3 Showing worklessness through unemployment rate for all people of working age across Oxfordshire, with rankings based on the distribution across the county.
Source: OCSI 2005 (from DWP 2003)

Oxfordshire in Detail Report, Updated September 2005 Oxford Consultants for Social Inclusion, www.ocsi.co.uk, [email protected], 0870 240 1474.
46
Map 5.4 Showing worklessness through sickness rate for all people of working age across Oxfordshire, with rankings based on the distribution across the county.
Source: OCSI 2005 (from DWP 2003)
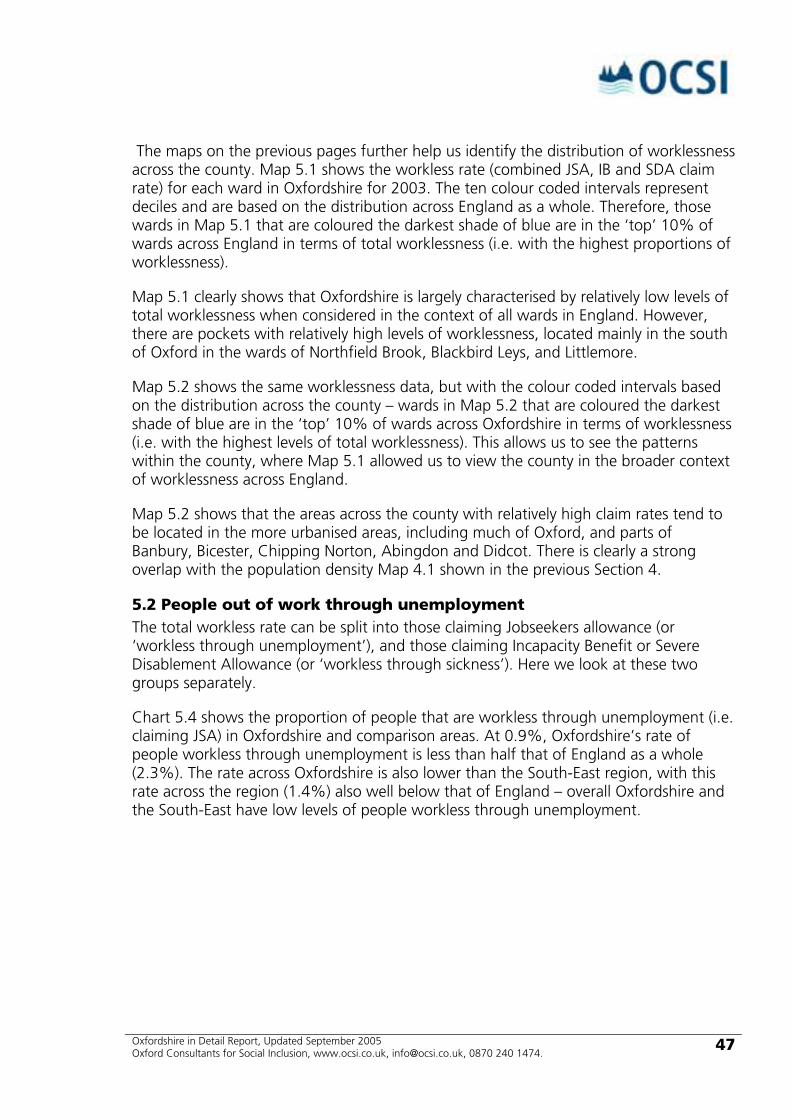
Oxfordshire in Detail Report, Updated September 2005 Oxford Consultants for Social Inclusion, www.ocsi.co.uk, [email protected], 0870 240 1474.
47
The maps on the previous pages further help us identify the distribution of worklessness across the county. Map 5.1 shows the workless rate (combined JSA, IB and SDA claim rate) for each ward in Oxfordshire for 2003. The ten colour coded intervals represent deciles and are based on the distribution across England as a whole. Therefore, those wards in Map 5.1 that are coloured the darkest shade of blue are in the ‘top’ 10% of wards across England in terms of total worklessness (i.e. with the highest proportions of worklessness).
Map 5.1 clearly shows that Oxfordshire is largely characterised by relatively low levels of total worklessness when considered in the context of all wards in England. However, there are pockets with relatively high levels of worklessness, located mainly in the south of Oxford in the wards of Northfield Brook, Blackbird Leys, and Littlemore.
Map 5.2 shows the same worklessness data, but with the colour coded intervals based on the distribution across the county – wards in Map 5.2 that are coloured the darkest shade of blue are in the ‘top’ 10% of wards across Oxfordshire in terms of worklessness (i.e. with the highest levels of total worklessness). This allows us to see the patterns within the county, where Map 5.1 allowed us to view the county in the broader context of worklessness across England.
Map 5.2 shows that the areas across the county with relatively high claim rates tend to be located in the more urbanised areas, including much of Oxford, and parts of Banbury, Bicester, Chipping Norton, Abingdon and Didcot. There is clearly a strong overlap with the population density Map 4.1 shown in the previous Section 4.
5.2 People out of work through unemployment The total workless rate can be split into those claiming Jobseekers allowance (or ‘workless through unemployment’), and those claiming Incapacity Benefit or Severe Disablement Allowance (or ‘workless through sickness’). Here we look at these two groups separately.
Chart 5.4 shows the proportion of people that are workless through unemployment (i.e. claiming JSA) in Oxfordshire and comparison areas. At 0.9%, Oxfordshire’s rate of people workless through unemployment is less than half that of England as a whole (2.3%). The rate across Oxfordshire is also lower than the South-East region, with this rate across the region (1.4%) also well below that of England – overall Oxfordshire and the South-East have low levels of people workless through unemployment.
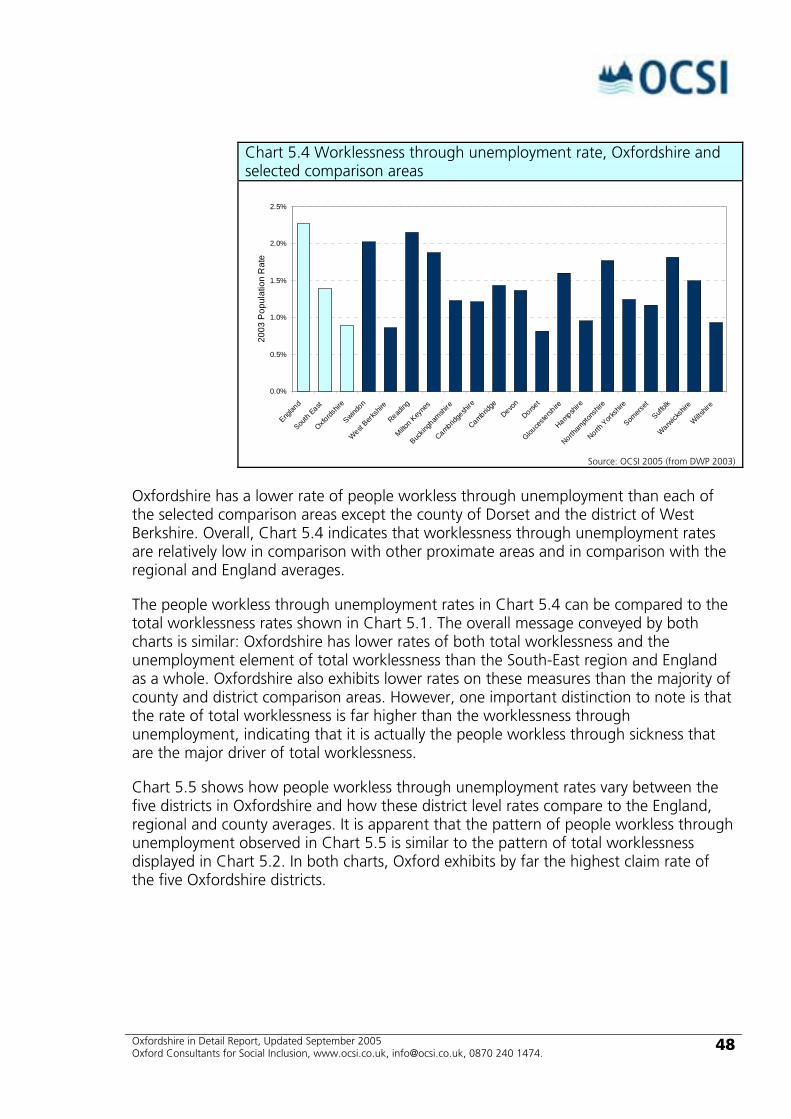
Oxfordshire in Detail Report, Updated September 2005 Oxford Consultants for Social Inclusion, www.ocsi.co.uk, [email protected], 0870 240 1474.
48
Chart 5.4 Worklessness through unemployment rate, Oxfordshire and selected comparison areas
0.0%
0.5%
1.0%
1.5%
2.0%
2.5%
Englan
d
South
East
Oxfords
hire
Swindon
West Berk
shire
Reading
Milton Key
nes
Buckin
gham
shire
Cambridge
shire
Cambridge
Devon
Dorset
Glouce
stersh
ire
Hampshire
Northam
ptons
hire
North York
shire
Somers
et
Suffolk
Warwick
shire
Wiltshir
e
2003
Pop
ulat
ion
Rat
e
Source: OCSI 2005 (from DWP 2003)
Oxfordshire has a lower rate of people workless through unemployment than each of the selected comparison areas except the county of Dorset and the district of West Berkshire. Overall, Chart 5.4 indicates that worklessness through unemployment rates are relatively low in comparison with other proximate areas and in comparison with the regional and England averages.
The people workless through unemployment rates in Chart 5.4 can be compared to the total worklessness rates shown in Chart 5.1. The overall message conveyed by both charts is similar: Oxfordshire has lower rates of both total worklessness and the unemployment element of total worklessness than the South-East region and England as a whole. Oxfordshire also exhibits lower rates on these measures than the majority of county and district comparison areas. However, one important distinction to note is that the rate of total worklessness is far higher than the worklessness through unemployment, indicating that it is actually the people workless through sickness that are the major driver of total worklessness.
Chart 5.5 shows how people workless through unemployment rates vary between the five districts in Oxfordshire and how these district level rates compare to the England, regional and county averages. It is apparent that the pattern of people workless through unemployment observed in Chart 5.5 is similar to the pattern of total worklessness displayed in Chart 5.2. In both charts, Oxford exhibits by far the highest claim rate of the five Oxfordshire districts.

Oxfordshire in Detail Report, Updated September 2005 Oxford Consultants for Social Inclusion, www.ocsi.co.uk, [email protected], 0870 240 1474.
49
Chart 5.5 Worklessness through unemployment rate, Oxfordshire and districts
0.0%
0.5%
1.0%
1.5%
2.0%
2.5%
Englan
d
South
East
Oxfords
hire
Cherwell
Oxford
South
Oxfords
hire
Vale of
White
Horse
West Oxfo
rdshir
e
2003
Pop
ulat
ion
Rat
e
Source: OCSI 2005 (from DWP 2003)
In Chart 5.2, the three districts of South Oxfordshire, Vale of White Horse and West Oxfordshire have approximately equal rates of total worklessness (3.5%-3.6%). In Chart 5.5, however, West Oxfordshire clearly registers the lowest rate of people workless through unemployment of the five districts in the county (0.5%). This distinction, whilst being clearly evident from the chart, does not translate into huge differences in absolute terms, as each of the districts has relatively low claim rates in relation to the regional and England averages.
Oxford is the only district in Oxfordshire to register proportions of people workless through unemployment above the county averages (1.3% in Oxford compared to the Oxfordshire average of 0.9%). Indeed, Oxford’s people workless through unemployment rate is over two and a half times greater than the rate in West Oxfordshire. This indicates that while rates of people workless through unemployment in each of the five Oxfordshire districts are relatively low compared to the England average, a considerable degree of variation and inequality is present with the county.
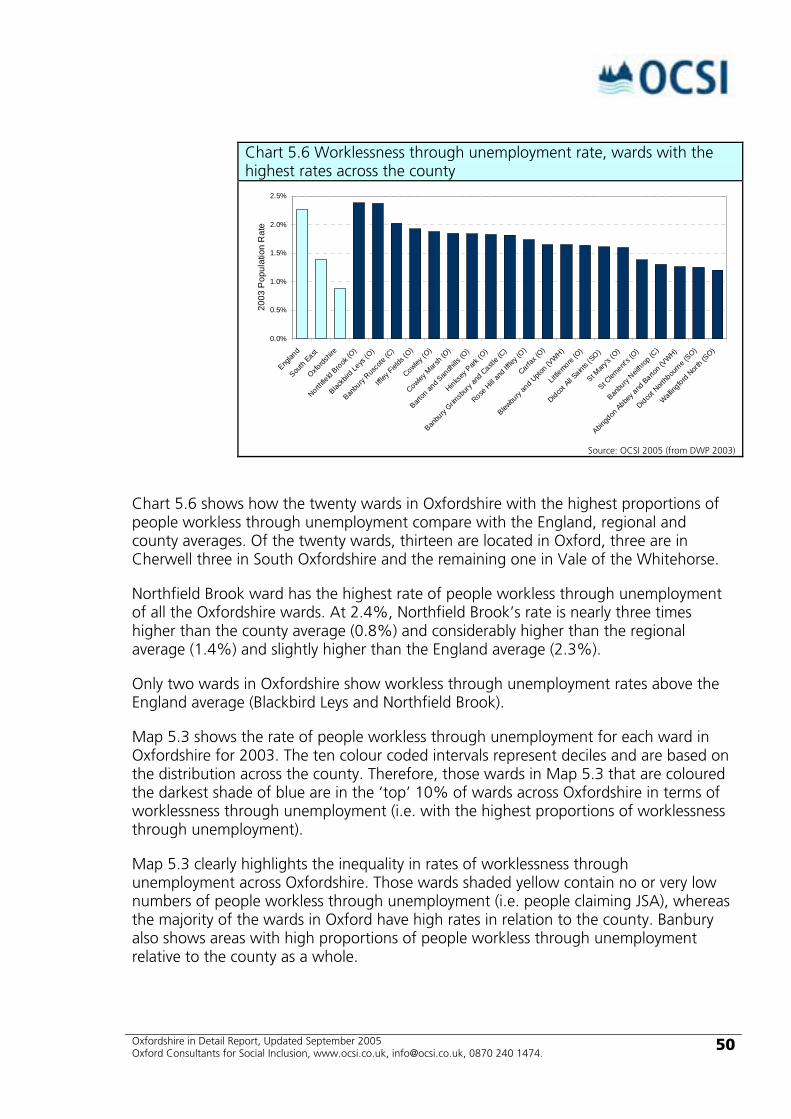
Oxfordshire in Detail Report, Updated September 2005 Oxford Consultants for Social Inclusion, www.ocsi.co.uk, [email protected], 0870 240 1474.
50
Chart 5.6 Worklessness through unemployment rate, wards with the highest rates across the county
0.0%
0.5%
1.0%
1.5%
2.0%
2.5%
Englan
d
South
East
Oxfords
hire
Northfie
ld Brook (O
)
Blackb
ird Le
ys (O
)
Banbu
ry Rus
cote
(C)
Iffley
Fields
(O)
Cowley (O
)
Cowley M
arsh (
O)
Barton
and S
andh
ills (O
)
Hinksey
Park
(O)
Banbu
ry Grim
sbury
and C
astle (
C)
Rose H
ill an
d Iffle
y (O)
Carfax (
O)
Blewbu
ry an
d Upto
n (VWH)
Little
more (O
)
Didcot A
ll Saints
(SO)
St Mary
's (O)
St Clem
ent's (
O)
Banbu
ry Neit
hrop (C
)
Abingd
on Abbe
y and
Barton (
VWH)
Didcot N
orthb
ourne (
SO)
Wallingford
North (S
O)
2003
Pop
ulat
ion
Rat
e
Source: OCSI 2005 (from DWP 2003)
Chart 5.6 shows how the twenty wards in Oxfordshire with the highest proportions of people workless through unemployment compare with the England, regional and county averages. Of the twenty wards, thirteen are located in Oxford, three are in Cherwell three in South Oxfordshire and the remaining one in Vale of the Whitehorse.
Northfield Brook ward has the highest rate of people workless through unemployment of all the Oxfordshire wards. At 2.4%, Northfield Brook’s rate is nearly three times higher than the county average (0.8%) and considerably higher than the regional average (1.4%) and slightly higher than the England average (2.3%).
Only two wards in Oxfordshire show workless through unemployment rates above the England average (Blackbird Leys and Northfield Brook).
Map 5.3 shows the rate of people workless through unemployment for each ward in Oxfordshire for 2003. The ten colour coded intervals represent deciles and are based on the distribution across the county. Therefore, those wards in Map 5.3 that are coloured the darkest shade of blue are in the ‘top’ 10% of wards across Oxfordshire in terms of worklessness through unemployment (i.e. with the highest proportions of worklessness through unemployment).
Map 5.3 clearly highlights the inequality in rates of worklessness through unemployment across Oxfordshire. Those wards shaded yellow contain no or very low numbers of people workless through unemployment (i.e. people claiming JSA), whereas the majority of the wards in Oxford have high rates in relation to the county. Banbury also shows areas with high proportions of people workless through unemployment relative to the county as a whole.

Oxfordshire in Detail Report, Updated September 2005 Oxford Consultants for Social Inclusion, www.ocsi.co.uk, [email protected], 0870 240 1474.
51
5.3 People out of work through sickness The second group making up the total workless count is people who are ‘workless through sickness’, claiming Incapacity Benefit (IB) or Severe Disablement Allowance (SDA).
Chart 5.7 Worklessness through sickness rate, Oxfordshire and selected comparison areas
0.0%
1.0%
2.0%
3.0%
4.0%
5.0%
6.0%
7.0%
8.0%
Englan
d
South
East
Oxfords
hire
Swindon
West Berk
shire
Reading
Milton Key
nes
Buckin
gham
shire
Cambridge
shire
Cambridge
Devon
Dorset
Glouce
stersh
ire
Hampshire
Northam
ptons
hire
North York
shire
Somers
et
Suffolk
Warwick
shire
Wiltshir
e
2003
Pop
ulat
ion
Rat
e
Source: OCSI 2005 (from DWP 2003)
Chart 5.7 focuses on the rate of people workless through sickness. As described above, these rates are based on the proportion of people aged 16-64 who are in receipt of IB or SDA benefits. Chart 5.7 shows rates of people workless through sickness for the county of Oxfordshire and the chosen comparison areas. Once again, it is clear that the county has a lower rate than both the South-East region and England as a whole. Indeed, Oxfordshire’s rate of 3.3% is less than half the England average of 6.9%. The workless through sickness information in Chart 5.7 can be compared with the people workless through unemployment information in Chart 5.4. It is immediately apparent that sickness accounts for a far greater proportion of the total workless population than unemployment.
In terms of the county and district comparison areas in Chart 5.7, Oxfordshire has one of the lowest proportions of people workless through sickness, with only the county of Buckinghamshire and the district of West Berkshire having lower claim rates.
Chart 5.8 shows the rate for people workless through sickness for the five Oxfordshire districts that together make up Oxfordshire. The England, regional and county averages again provide a useful context in which to consider the district level rates. A very similar picture is seen in Chart 5.8 as in the total worklessness data presented in Chart 5.2. This is not surprising, considering that people workless through sickness account for a far greater share of total worklessness than people workless through unemployment.

Oxfordshire in Detail Report, Updated September 2005 Oxford Consultants for Social Inclusion, www.ocsi.co.uk, [email protected], 0870 240 1474.
52
At 4.1%, Oxford has the highest proportions of people workless through sickness in Oxfordshire. Oxford’s rate is slightly lower than that of the South-East region (4.4%), and considerably below the England average.
Cherwell’s rate of people workless through sickness (3.6%) is slightly higher than the county average (3.3%) but still well below the regional and England averages. The three districts of South Oxfordshire, Vale of White Horse and West Oxfordshire all have approximately equal proportions of people workless through sickness (2.8-9%), which is lower than the county, regional and England averages.
Chart 5.8 Worklessness through sickness rate, Oxfordshire and districts
0.0%
1.0%
2.0%
3.0%
4.0%
5.0%
6.0%
7.0%
8.0%
Englan
d
South
East
Oxfords
hire
Cherwell
Oxford
South
Oxfords
hire
Vale of
White
Horse
West Oxfo
rdshir
e
2003
Pop
ulat
ion
Rat
e
Source: OCSI 2005 (from DWP 2003)
Chart 5.9 focuses on the twenty wards within Oxfordshire with the highest rates of people workless through sickness amongst the population aged 16-64. The ward of Littlemore in Oxford has the highest proportions of such people of any ward in the county. At 7.9%, Littlemore’s rate of people workless through sickness is well over twice the Oxfordshire average (3.3%) and almost twice as high as the regional average (4.4%). Seven wards in Oxfordshire have rates above the England average (five in Oxford two in Banbury) whilst all the other Oxfordshire wards have rates below the England average.
Of the twenty wards with the highest rates of people workless through sickness, four are in Cherwell, ten in Oxford, one in South Oxfordshire, three in of Vale of White Horse and two in West Oxfordshire. The distribution of wards with high rates of people workless through sickness is clearly more dispersed across the county than for the unemployed element of worklessness. However, if we look just at the ten wards with the highest rates of people workless through sickness, six are in Oxford, indicating that this district does tend to contain the wards with the very highest rates of people workless through sickness.
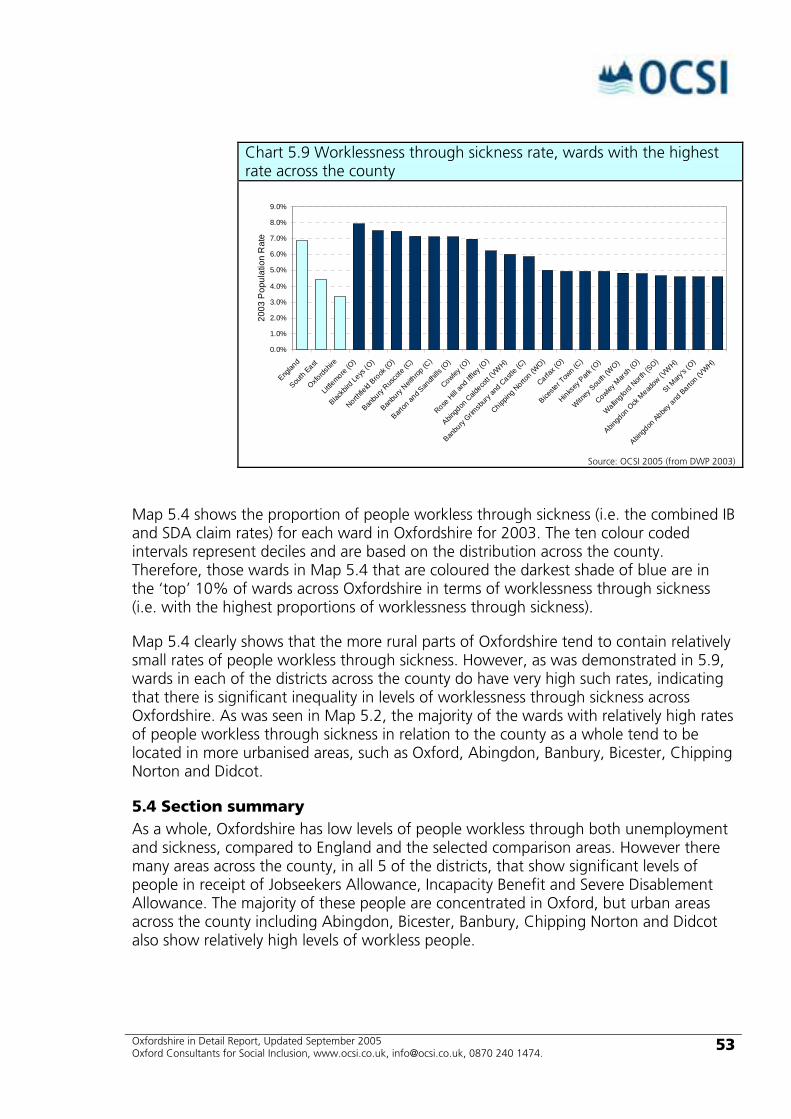
Oxfordshire in Detail Report, Updated September 2005 Oxford Consultants for Social Inclusion, www.ocsi.co.uk, [email protected], 0870 240 1474.
53
Chart 5.9 Worklessness through sickness rate, wards with the highest rate across the county
0.0%
1.0%
2.0%
3.0%
4.0%
5.0%
6.0%
7.0%
8.0%
9.0%
Englan
d
South
East
Oxfords
hire
Little
more (O
)
Blackb
ird Le
ys (O
)
Northfie
ld Brook (O
)
Banbu
ry Rus
cote
(C)
Banbu
ry Neit
hrop (C
)
Barton
and S
andh
ills (O
)
Cowley (O
)
Rose H
ill an
d Iffle
y (O)
Abingd
on C
aldeco
tt (VW
H)
Banbu
ry Grim
sbury
and C
astle (
C)
Chipping
Norto
n (WO)
Carfax (
O)
Biceste
r Tow
n (C)
Hinksey
Park
(O)
Witney
South
(WO)
Cowley M
arsh (
O)
Wallingford
North (S
O)
Abingd
on O
ck M
eadow
(VW
H)
St Mary
's (O)
Abingd
on Abbe
y and
Barton (
VWH)
2003
Pop
ulat
ion
Rat
e
Source: OCSI 2005 (from DWP 2003)
Map 5.4 shows the proportion of people workless through sickness (i.e. the combined IB and SDA claim rates) for each ward in Oxfordshire for 2003. The ten colour coded intervals represent deciles and are based on the distribution across the county. Therefore, those wards in Map 5.4 that are coloured the darkest shade of blue are in the ‘top’ 10% of wards across Oxfordshire in terms of worklessness through sickness (i.e. with the highest proportions of worklessness through sickness).
Map 5.4 clearly shows that the more rural parts of Oxfordshire tend to contain relatively small rates of people workless through sickness. However, as was demonstrated in 5.9, wards in each of the districts across the county do have very high such rates, indicating that there is significant inequality in levels of worklessness through sickness across Oxfordshire. As was seen in Map 5.2, the majority of the wards with relatively high rates of people workless through sickness in relation to the county as a whole tend to be located in more urbanised areas, such as Oxford, Abingdon, Banbury, Bicester, Chipping Norton and Didcot.
5.4 Section summary As a whole, Oxfordshire has low levels of people workless through both unemployment and sickness, compared to England and the selected comparison areas. However there many areas across the county, in all 5 of the districts, that show significant levels of people in receipt of Jobseekers Allowance, Incapacity Benefit and Severe Disablement Allowance. The majority of these people are concentrated in Oxford, but urban areas across the county including Abingdon, Bicester, Banbury, Chipping Norton and Didcot also show relatively high levels of workless people.

Oxfordshire in Detail Report, Updated September 2005 Oxford Consultants for Social Inclusion, www.ocsi.co.uk, [email protected], 0870 240 1474.
54
Section 6 Living on a low income
Oxfordshire England
All people living on a low income73 24,565 (4.9%) 3,872,353 (9.7%) Young people (aged under 20) living on a low income74 755 (2.3%) 134,329 (5.3%) People under 50 living on a low income75 11,550 (3.8%) 1,949,173 (8.3%) Older people (aged 60 and over) living on a low income76 10,765 (9.1%) 1,501,612 (14.5%) ID 2004 Income Rank77 73 (of 149 areas, with 1 the most deprived)
People living on a low income are among the most deprived groups in society. A person or household living on a low income may be out of work, or in work but on low pay.
There are a number of ways in which low income can be measured. At the country level it is possible to establish what percentage of all people live in households with an income below 60% of the median income. This threshold has been chosen by the Government to represent the ‘poverty line’, and is based on data from the Family Resources Survey.
Although this trend data is important, it is not possible to obtain at the local level. This is because information about incomes is kept secure by Inland Revenue. The Family Resources Survey, which provides information for the national figure, is not reliable enough to give results below regional level.
However, other information is available regarding people who are living on low incomes. Many of the benefits that are paid to people on low incomes are means-tested, or relate to their income in some way.
This section conceptualises living on low income as being in receipt of means-tested out of work benefits. The two benefits used here to define low income are Income Support (IS) and income based Job Seekers Allowance (JSA-IB). See the Knowing the benefits: Living on a low income box for more details.
People who are out of work and in receipt of means-tested benefits may or may not be required to actively seek work. Groups not expected to be actively looking for work include older people, lone parents, and the sick and disabled. Income Support is paid to people on low incomes who are not expected to look for work. Adults of working age, who are capable of working, are required to register as an active job seeker in order to qualify for means-tested benefits. Income based Job Seekers Allowance is paid to people on low income who are out of work and who are required to look for work.
The number of people who actually rely on the income provided by IS and JSA-IB is far greater than the number of claimants alone. Often a claimant will have one or more dependents, such as a partner and/or dependent children. The data presented in this

Oxfordshire in Detail Report, Updated September 2005 Oxford Consultants for Social Inclusion, www.ocsi.co.uk, [email protected], 0870 240 1474.
55
section, however, refer only to the number of actual claimants and do not include dependents.
It is important to underline that this section is restricted to an analysis of people claiming IS or JSA-IB, and does not include incidence of income deprivation, unemployment or other circumstances among groups not claiming these particular means-tested benefits. However, the sheer number of people on these benefits – nearly four million claimants in England in 2003 (not counting any partners or dependent children) – means that a large proportion of those who might be defined as ‘poor’ by most other criteria will be included in this measure. People not covered by this definition will be those on ‘in-work’ benefits, such as Working Tax Credit, also those people who are eligible for IS or JSA-IB but who are not claiming, and those who are not entitled to IS or JSA-IB. Thus people claiming non-means-tested benefits such as Severe Disablement Allowance or Incapacity Benefit would only be included in the low income data if their overall income falls below Income Support thresholds.
Knowing the benefits: Living on a low income This section uses means-tested out of work benefits as a measure of low income – people in receipt of these benefits are described as being ‘income deprived’ or ‘living on a low income’.
Income Support (IS)
Income Support is a subsistence means-tested benefit for those people who do not have other sources of income, or whose income is below a certain level. From October 1996, Jobseeker's Allowance replaced IS for unemployed people – IS is paid only for people not required to be available for work. These groups include pensioners, lone parents, sick and disabled people.
Income Based Job Seekers Allowance (JSA-IB)
Income Based Job Seekers Allowance (JSA-IB) is a means-tested benefit for those people who are unemployed, when they either have not built up enough National Insurance contributions to be able to claim ‘contributions based Job Seekers Allowance’ (JSA-CB) or when JSA-CB is not sufficient to meet the designated financial needs of their household, based on the household composition. It is the equivalent of Income Support for those people who must be actively seeking paid employment in order to qualify for benefit.
Minimum Income Guarantee (MIG)
The Minimum Income Guarantee was introduced to ensure that all people over 60 had an acceptable minimum level of income, through an enhanced level of IS. From October 2003, the MIG was replaced by Pension Credit. Pension Credit is a new entitlement for people aged 60 and over. No data has yet been released on Pension Credit claimants.
Information is provided by the Department for Work and Pensions for 2003, and is available at 2003 ward level.

Oxfordshire in Detail Report, Updated September 2005 Oxford Consultants for Social Inclusion, www.ocsi.co.uk, [email protected], 0870 240 1474.
56
6.1 People living on a low income across Oxfordshire This section contains a series of charts and maps depicting low income across Oxfordshire. Claim rates are presented showing how Oxfordshire and its constituent areas compare to the England average and other comparison areas in terms of low income. Data are presented down to ward level, enabling pockets of income deprivation to be identified within the county. All data contained within this section are for the year 2003.
Claim rates are calculated by dividing the number of claimants in an area by the number of ‘at-risk’ (i.e. potentially eligible) people in the area. For example, the “All people living on a low income” rate represents the total number of IS / JSA-IB claimants divided by the total population aged 16 and over. The populations used to calculate these rates are estimated from the Census 2001 and Mid Year Estimate data, using the techniques described in section 4.
Chart 6.1 Proportion of people living on a low income, Oxfordshire and comparison areas
0.0%
2.0%
4.0%
6.0%
8.0%
10.0%
12.0%
Englan
d
South
East
Oxfords
hire
Swindon
West Berk
shire
Reading
Milton Key
nes
Buckin
gham
shire
Cambridge
shire
Cambridge
Devon
Dorset
Glouce
stersh
ire
Hampshire
Northam
ptons
hire
North York
shire
Somers
et
Suffolk
Warwick
shire
Wiltshir
e
2003
Pop
ulat
ion
Rat
e
Source: OCSI 2005 (from DWP 2003)
Charts 6.1 to 6.3 and Maps 6.1 and 6.2 focus on rates of total income deprivation within Oxfordshire, amongst all people aged 16 and over. Charts 6.4 to 6.7 and Map 6.3 examine income deprivation amongst young people aged under 20. Charts 6.8 to 6.11 and Map 6.4 look at income deprivation amongst older people aged 60 and over. The age bands used in this section are restricted to those which are published by the Department for Work and Pensions.
Chart 6.1 shows the proportion of people living on a low income (i.e. proportion of total population aged 16+ who are claimants of IS / JSA-IB) for the county of Oxfordshire and selected comparison areas in 2003. The rate across Oxfordshire of 4.9% is just over half the rate in England as a whole (9.7%), also considerably lower than that of the South-East region (6.4%). The chart supports this by comparing Oxfordshire to a number of comparison counties and districts across England. Oxfordshire has a lower proportion of
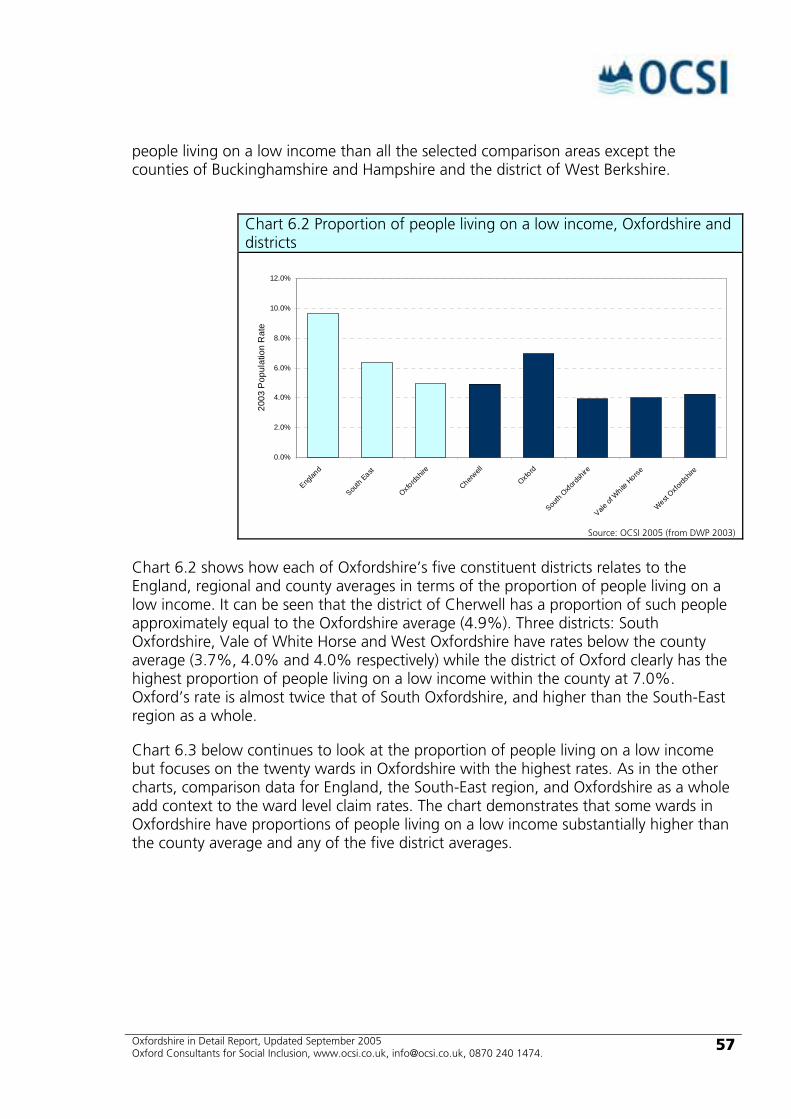
Oxfordshire in Detail Report, Updated September 2005 Oxford Consultants for Social Inclusion, www.ocsi.co.uk, [email protected], 0870 240 1474.
57
people living on a low income than all the selected comparison areas except the counties of Buckinghamshire and Hampshire and the district of West Berkshire.
Chart 6.2 Proportion of people living on a low income, Oxfordshire and districts
0.0%
2.0%
4.0%
6.0%
8.0%
10.0%
12.0%
Englan
d
South
East
Oxfords
hire
Cherwell
Oxford
South
Oxfords
hire
Vale of
White
Horse
West Oxfo
rdshir
e
2003
Pop
ulat
ion
Rat
e
Source: OCSI 2005 (from DWP 2003)
Chart 6.2 shows how each of Oxfordshire’s five constituent districts relates to the England, regional and county averages in terms of the proportion of people living on a low income. It can be seen that the district of Cherwell has a proportion of such people approximately equal to the Oxfordshire average (4.9%). Three districts: South Oxfordshire, Vale of White Horse and West Oxfordshire have rates below the county average (3.7%, 4.0% and 4.0% respectively) while the district of Oxford clearly has the highest proportion of people living on a low income within the county at 7.0%. Oxford’s rate is almost twice that of South Oxfordshire, and higher than the South-East region as a whole.
Chart 6.3 below continues to look at the proportion of people living on a low income but focuses on the twenty wards in Oxfordshire with the highest rates. As in the other charts, comparison data for England, the South-East region, and Oxfordshire as a whole add context to the ward level claim rates. The chart demonstrates that some wards in Oxfordshire have proportions of people living on a low income substantially higher than the county average and any of the five district averages.

Oxfordshire in Detail Report, Updated September 2005 Oxford Consultants for Social Inclusion, www.ocsi.co.uk, [email protected], 0870 240 1474.
58
Chart 6.3 Proportion of people living on a low income, wards with the highest proportions across the county
0.0%
2.0%
4.0%
6.0%
8.0%
10.0%
12.0%
14.0%
16.0%
18.0%
Englan
d
South
East
Oxfords
hire
Northfie
ld Brook (O
)
Blackb
ird Le
ys (O
)
Banbu
ry Rus
cote
(C)
Barton
and S
andh
ills (O
)
Rose H
ill an
d Iffle
y (O)
Banbu
ry Neit
hrop (C
)
Little
more (O
)
Banbu
ry Grim
sbury
and C
astle (
C)
Abingd
on C
aldeco
tt (VW
H)
Cowley (O
)
Cowley M
arsh (
O)
Iffley
Fields
(O)
Churchil
l (O)
Hinksey
Park
(O)
Chipping
Norto
n (WO)
St Mary
's (O)
St Clem
ent's (
O)
Wallingford
North (S
O)
Witney
South
(WO)
Didcot P
ark (S
O)
2003
Pop
ulat
ion
Rat
e
Source: OCSI 2005 (from DWP 2003)
Northfield Brook (Oxford) has the highest proportion of people living on a low income of any ward in Oxfordshire. At almost 16%, this ward’s rate is over three times higher than the Oxfordshire average; almost three times as high as the South-East region average; and significantly greater than the England average.
Six of the ten wards with the highest proportion of people living on a low income in Oxfordshire are in the district of Oxford. Three of the four non-Oxford wards are from Cherwell whilst one is from Vale of White Horse. These data indicate that, although Oxfordshire as a whole has relatively low levels of people living on a low income (demonstrated by comparing the county average with the England, regional and other comparison area averages), there are pockets of considerable income deprivation where large proportions of people are in receipt of out of work means-tested benefits.
Map 6.1 helps further the identification of pockets of income deprivation across the county. Map 6.1 shows the proportion of people living on low income (i.e. IS / JSA-IB claim rates) for each ward in Oxfordshire for 2003. The ten colour coded intervals represent deciles and are based on the distribution across England as a whole. Therefore, those wards in Map 6.1 that are coloured the darkest shade of blue are in the ‘top’ 10% of wards across England in terms of income deprivation (i.e. with the highest proportions of people living on a low income).
Map 6.2 shows the same proportion of people living on a low income data, but with the colour coded intervals based on the distribution across the county – wards in Map 6.2 that are coloured the darkest shade of blue are in the ‘top’ 10% of wards across Oxfordshire in terms of income deprivation (i.e. with the highest proportions of people living on a low income). This allows us to see the patterns within the county, where Map 6.1 allowed us to view the county in the broader context of income deprivation across England.
Oxfordshire in Detail Report, Updated September 2005 Oxford Consultants for Social Inclusion, www.ocsi.co.uk, [email protected], 0870 240 1474.
59
As is evident from Map 6.1, Oxfordshire is largely characterised by relatively low levels of income deprivation amongst people aged 16 and over compared to England as a whole. However, there are pockets of severe income disadvantage identifiable, especially in the south of Oxford where the wards of Northfield Brook and Blackbird Leys are located.
Map 6.2 shows that when ward level income deprivation is considered in the context of the distribution across the county rather than the distribution across England, it is possible to identify additional areas that have relatively high proportions of people living on a low income in comparison with the other wards in the county. As we saw with in the section on worklessness, the areas with relatively high proportions of such people tend to be located in the more urbanised areas, including much of Oxford, and parts of Banbury, Bicester, Chipping Norton, Abingdon and Didcot.
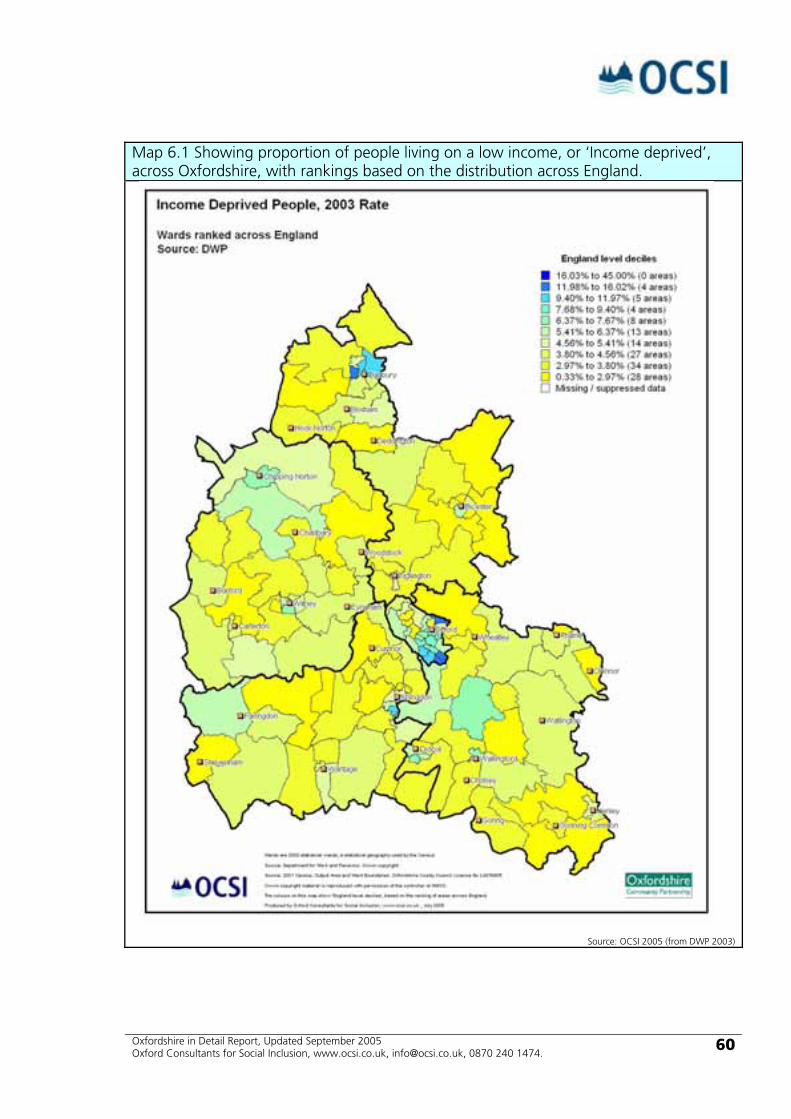
Oxfordshire in Detail Report, Updated September 2005 Oxford Consultants for Social Inclusion, www.ocsi.co.uk, [email protected], 0870 240 1474.
60
Map 6.1 Showing proportion of people living on a low income, or ‘Income deprived’, across Oxfordshire, with rankings based on the distribution across England.
Source: OCSI 2005 (from DWP 2003)
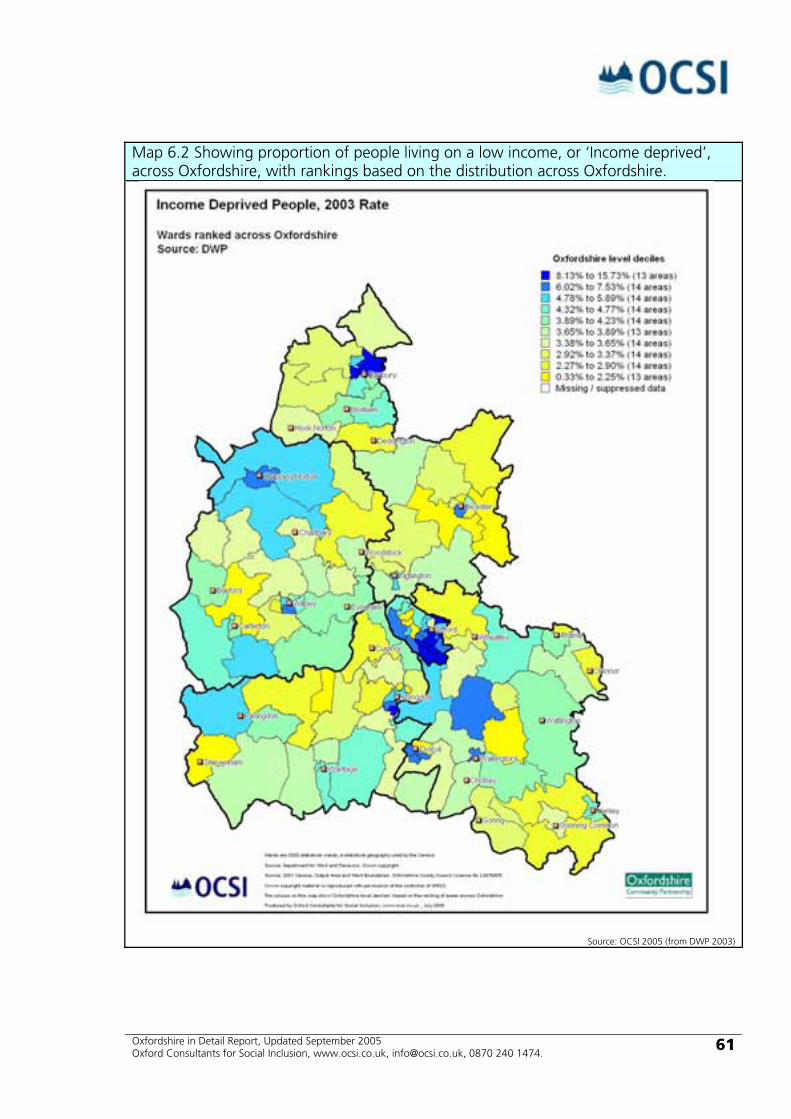
Oxfordshire in Detail Report, Updated September 2005 Oxford Consultants for Social Inclusion, www.ocsi.co.uk, [email protected], 0870 240 1474.
61
Map 6.2 Showing proportion of people living on a low income, or ‘Income deprived’, across Oxfordshire, with rankings based on the distribution across Oxfordshire.
Source: OCSI 2005 (from DWP 2003)

Oxfordshire in Detail Report, Updated September 2005 Oxford Consultants for Social Inclusion, www.ocsi.co.uk, [email protected], 0870 240 1474.
62
Map 6.3 Showing proportion of people under 20 (i.e. people aged 16-19) living on a low income, or ‘Income deprived’, across Oxfordshire, with rankings based on the distribution across the county.
Source: OCSI 2005 (from DWP 2003)
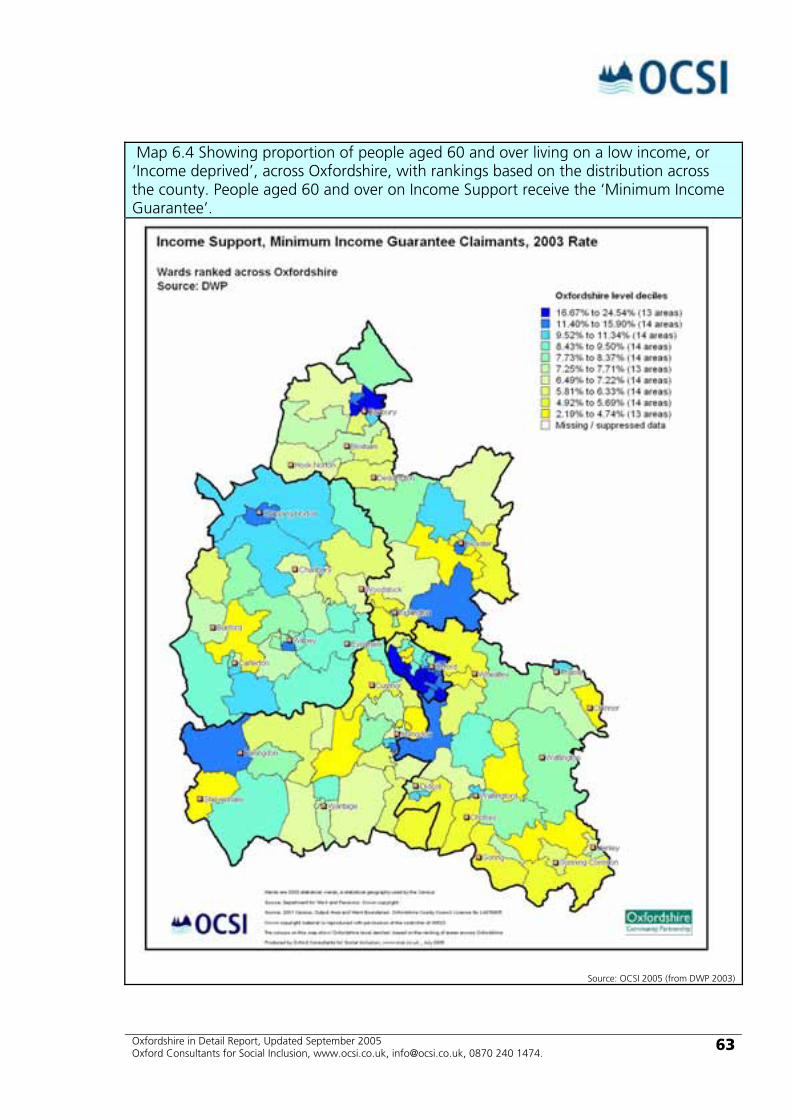
Oxfordshire in Detail Report, Updated September 2005 Oxford Consultants for Social Inclusion, www.ocsi.co.uk, [email protected], 0870 240 1474.
63
Map 6.4 Showing proportion of people aged 60 and over living on a low income, or ‘Income deprived’, across Oxfordshire, with rankings based on the distribution across the county. People aged 60 and over on Income Support receive the ‘Minimum Income Guarantee’.
Source: OCSI 2005 (from DWP 2003)
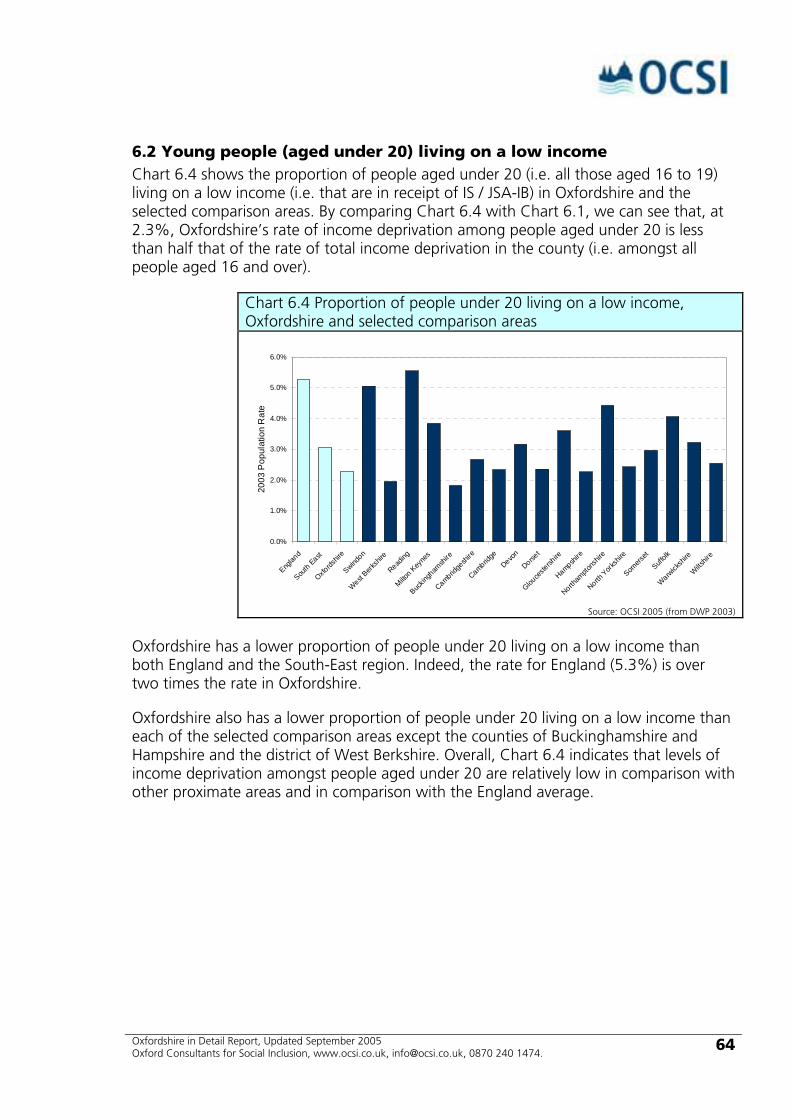
Oxfordshire in Detail Report, Updated September 2005 Oxford Consultants for Social Inclusion, www.ocsi.co.uk, [email protected], 0870 240 1474.
64
6.2 Young people (aged under 20) living on a low income Chart 6.4 shows the proportion of people aged under 20 (i.e. all those aged 16 to 19) living on a low income (i.e. that are in receipt of IS / JSA-IB) in Oxfordshire and the selected comparison areas. By comparing Chart 6.4 with Chart 6.1, we can see that, at 2.3%, Oxfordshire’s rate of income deprivation among people aged under 20 is less than half that of the rate of total income deprivation in the county (i.e. amongst all people aged 16 and over).
Chart 6.4 Proportion of people under 20 living on a low income, Oxfordshire and selected comparison areas
0.0%
1.0%
2.0%
3.0%
4.0%
5.0%
6.0%
Englan
d
South
East
Oxfords
hire
Swindon
West Berk
shire
Reading
Milton Key
nes
Buckin
gham
shire
Cambridge
shire
Cambridge
Devon
Dorset
Glouce
stersh
ire
Hampshire
Northam
ptons
hire
North York
shire
Somers
et
Suffolk
Warwick
shire
Wiltshir
e
2003
Pop
ulat
ion
Rat
e
Source: OCSI 2005 (from DWP 2003)
Oxfordshire has a lower proportion of people under 20 living on a low income than both England and the South-East region. Indeed, the rate for England (5.3%) is over two times the rate in Oxfordshire.
Oxfordshire also has a lower proportion of people under 20 living on a low income than each of the selected comparison areas except the counties of Buckinghamshire and Hampshire and the district of West Berkshire. Overall, Chart 6.4 indicates that levels of income deprivation amongst people aged under 20 are relatively low in comparison with other proximate areas and in comparison with the England average.
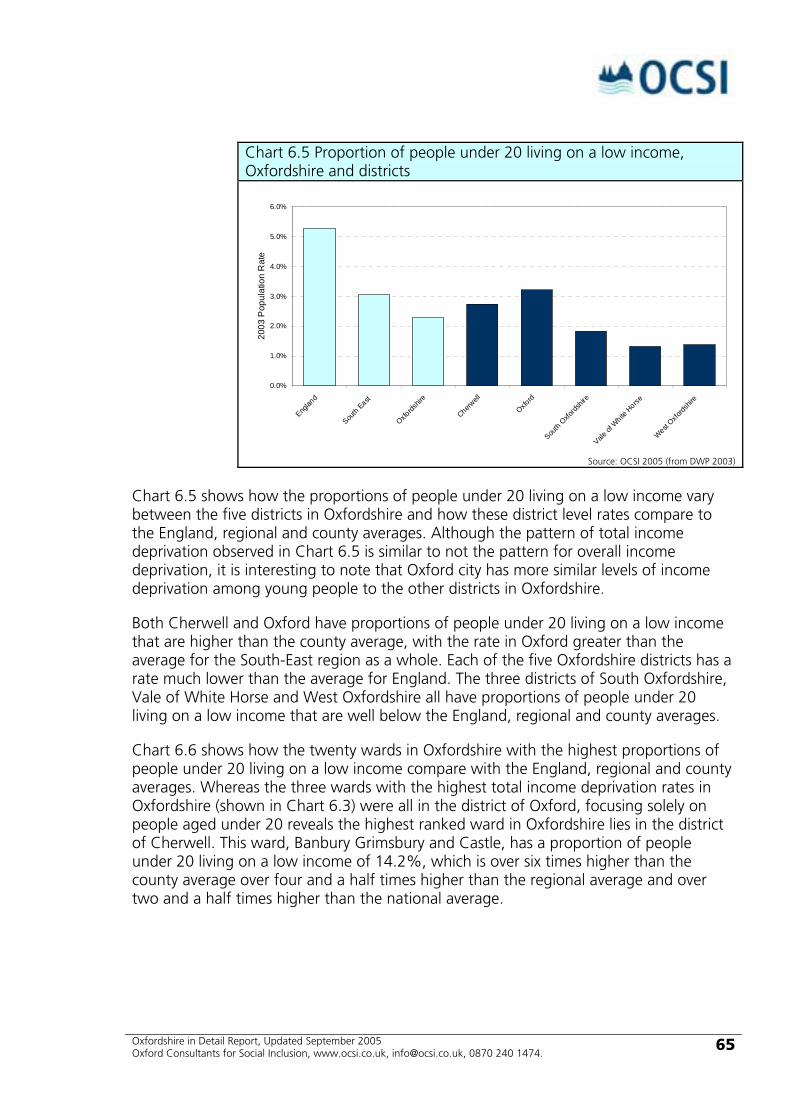
Oxfordshire in Detail Report, Updated September 2005 Oxford Consultants for Social Inclusion, www.ocsi.co.uk, [email protected], 0870 240 1474.
65
Chart 6.5 Proportion of people under 20 living on a low income, Oxfordshire and districts
0.0%
1.0%
2.0%
3.0%
4.0%
5.0%
6.0%
Englan
d
South
East
Oxfords
hire
Cherwell
Oxford
South
Oxfords
hire
Vale of
White
Horse
West Oxfo
rdshir
e
2003
Pop
ulat
ion
Rat
e
Source: OCSI 2005 (from DWP 2003)
Chart 6.5 shows how the proportions of people under 20 living on a low income vary between the five districts in Oxfordshire and how these district level rates compare to the England, regional and county averages. Although the pattern of total income deprivation observed in Chart 6.5 is similar to not the pattern for overall income deprivation, it is interesting to note that Oxford city has more similar levels of income deprivation among young people to the other districts in Oxfordshire.
Both Cherwell and Oxford have proportions of people under 20 living on a low income that are higher than the county average, with the rate in Oxford greater than the average for the South-East region as a whole. Each of the five Oxfordshire districts has a rate much lower than the average for England. The three districts of South Oxfordshire, Vale of White Horse and West Oxfordshire all have proportions of people under 20 living on a low income that are well below the England, regional and county averages.
Chart 6.6 shows how the twenty wards in Oxfordshire with the highest proportions of people under 20 living on a low income compare with the England, regional and county averages. Whereas the three wards with the highest total income deprivation rates in Oxfordshire (shown in Chart 6.3) were all in the district of Oxford, focusing solely on people aged under 20 reveals the highest ranked ward in Oxfordshire lies in the district of Cherwell. This ward, Banbury Grimsbury and Castle, has a proportion of people under 20 living on a low income of 14.2%, which is over six times higher than the county average over four and a half times higher than the regional average and over two and a half times higher than the national average.
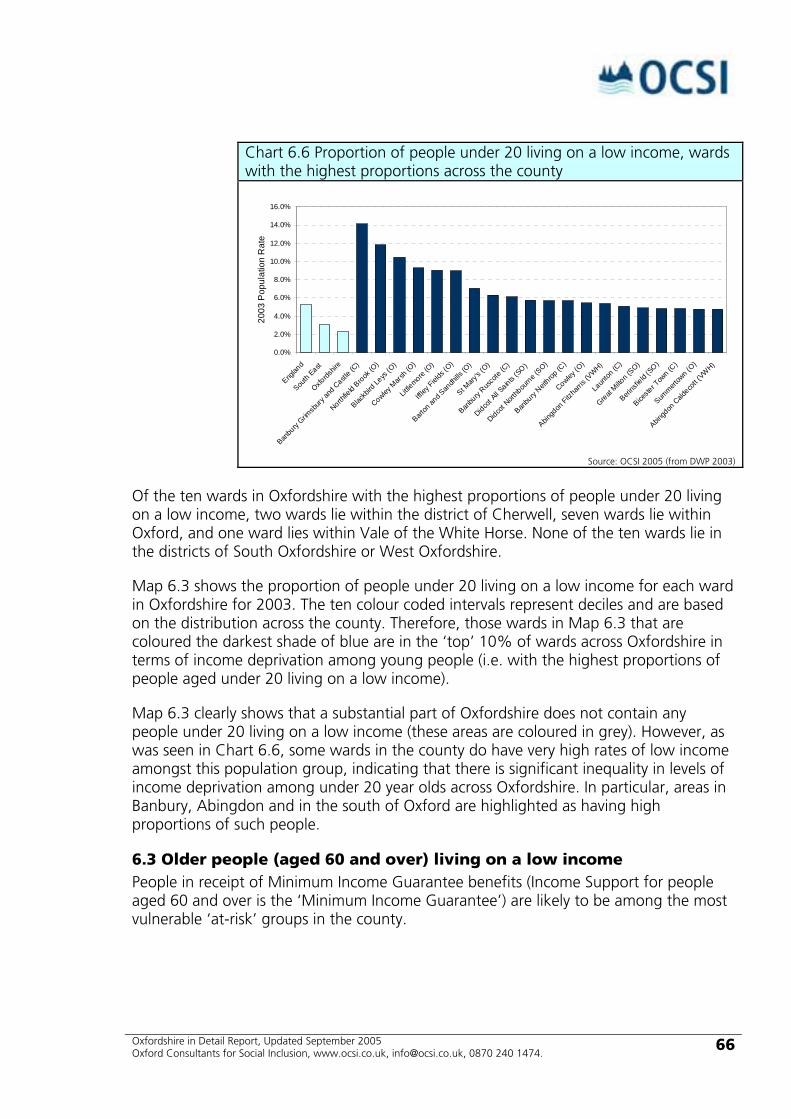
Oxfordshire in Detail Report, Updated September 2005 Oxford Consultants for Social Inclusion, www.ocsi.co.uk, [email protected], 0870 240 1474.
66
Chart 6.6 Proportion of people under 20 living on a low income, wards with the highest proportions across the county
0.0%
2.0%
4.0%
6.0%
8.0%
10.0%
12.0%
14.0%
16.0%
Englan
d
South
East
Oxfords
hire
Banbu
ry Grim
sbury
and C
astle (
C)
Northfie
ld Brook (O
)
Blackb
ird Le
ys (O
)
Cowley M
arsh (
O)
Little
more (O
)
Iffley
Fields
(O)
Barton
and S
andh
ills (O
)
St Mary
's (O)
Banbu
ry Rus
cote
(C)
Didcot A
ll Saints
(SO)
Didcot N
orthb
ourne (
SO)
Banbu
ry Neit
hrop (C
)
Cowley (O
)
Abingd
on Fitz
harris
(VWH)
Laun
ton (C
)
Great Milto
n (SO)
Berins
field
(SO)
Biceste
r Tow
n (C)
Summert
own (O
)
Abingd
on C
aldeco
tt (VW
H)
2003
Pop
ulat
ion
Rat
e
Source: OCSI 2005 (from DWP 2003)
Of the ten wards in Oxfordshire with the highest proportions of people under 20 living on a low income, two wards lie within the district of Cherwell, seven wards lie within Oxford, and one ward lies within Vale of the White Horse. None of the ten wards lie in the districts of South Oxfordshire or West Oxfordshire.
Map 6.3 shows the proportion of people under 20 living on a low income for each ward in Oxfordshire for 2003. The ten colour coded intervals represent deciles and are based on the distribution across the county. Therefore, those wards in Map 6.3 that are coloured the darkest shade of blue are in the ‘top’ 10% of wards across Oxfordshire in terms of income deprivation among young people (i.e. with the highest proportions of people aged under 20 living on a low income).
Map 6.3 clearly shows that a substantial part of Oxfordshire does not contain any people under 20 living on a low income (these areas are coloured in grey). However, as was seen in Chart 6.6, some wards in the county do have very high rates of low income amongst this population group, indicating that there is significant inequality in levels of income deprivation among under 20 year olds across Oxfordshire. In particular, areas in Banbury, Abingdon and in the south of Oxford are highlighted as having high proportions of such people.
6.3 Older people (aged 60 and over) living on a low income People in receipt of Minimum Income Guarantee benefits (Income Support for people aged 60 and over is the ‘Minimum Income Guarantee’) are likely to be among the most vulnerable ‘at-risk’ groups in the county.
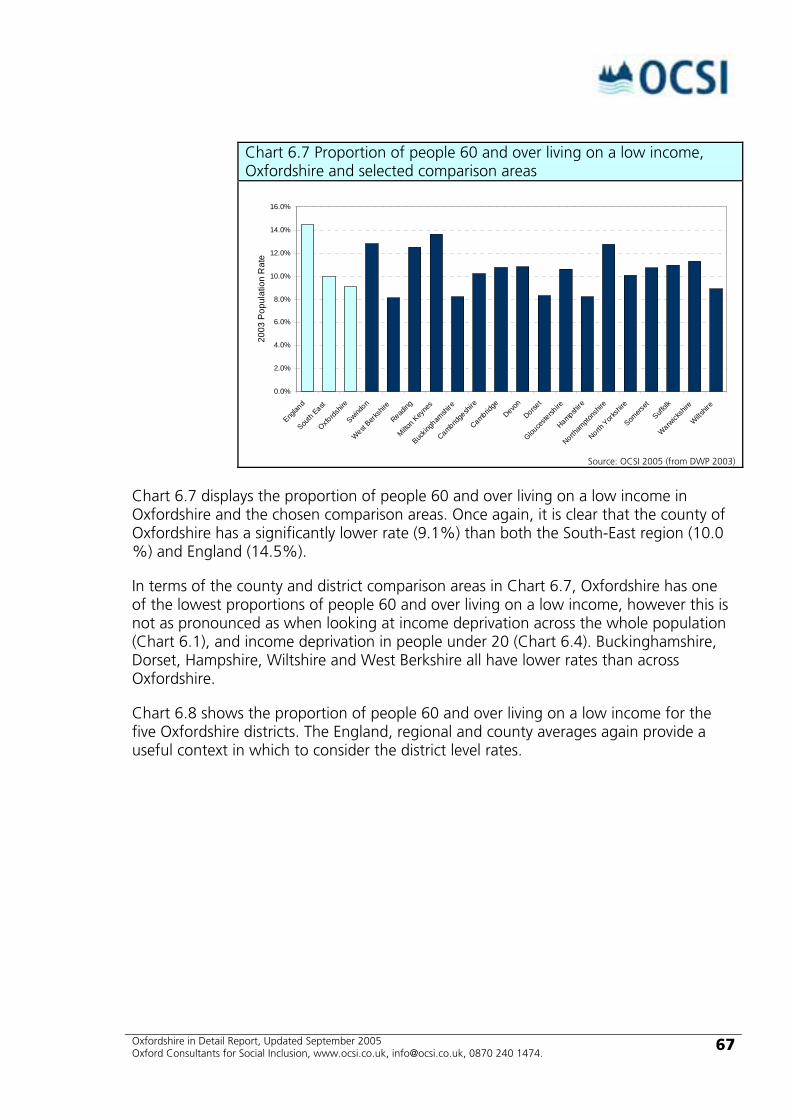
Oxfordshire in Detail Report, Updated September 2005 Oxford Consultants for Social Inclusion, www.ocsi.co.uk, [email protected], 0870 240 1474.
67
Chart 6.7 Proportion of people 60 and over living on a low income, Oxfordshire and selected comparison areas
0.0%
2.0%
4.0%
6.0%
8.0%
10.0%
12.0%
14.0%
16.0%
Englan
d
South
East
Oxfords
hire
Swindon
West Berk
shire
Reading
Milton Key
nes
Buckin
gham
shire
Cambridge
shire
Cambridge
Devon
Dorset
Glouce
stersh
ire
Hampshire
Northam
ptons
hire
North York
shire
Somers
et
Suffolk
Warwick
shire
Wiltshir
e
2003
Pop
ulat
ion
Rat
e
Source: OCSI 2005 (from DWP 2003)
Chart 6.7 displays the proportion of people 60 and over living on a low income in Oxfordshire and the chosen comparison areas. Once again, it is clear that the county of Oxfordshire has a significantly lower rate (9.1%) than both the South-East region (10.0 %) and England (14.5%).
In terms of the county and district comparison areas in Chart 6.7, Oxfordshire has one of the lowest proportions of people 60 and over living on a low income, however this is not as pronounced as when looking at income deprivation across the whole population (Chart 6.1), and income deprivation in people under 20 (Chart 6.4). Buckinghamshire, Dorset, Hampshire, Wiltshire and West Berkshire all have lower rates than across Oxfordshire.
Chart 6.8 shows the proportion of people 60 and over living on a low income for the five Oxfordshire districts. The England, regional and county averages again provide a useful context in which to consider the district level rates.
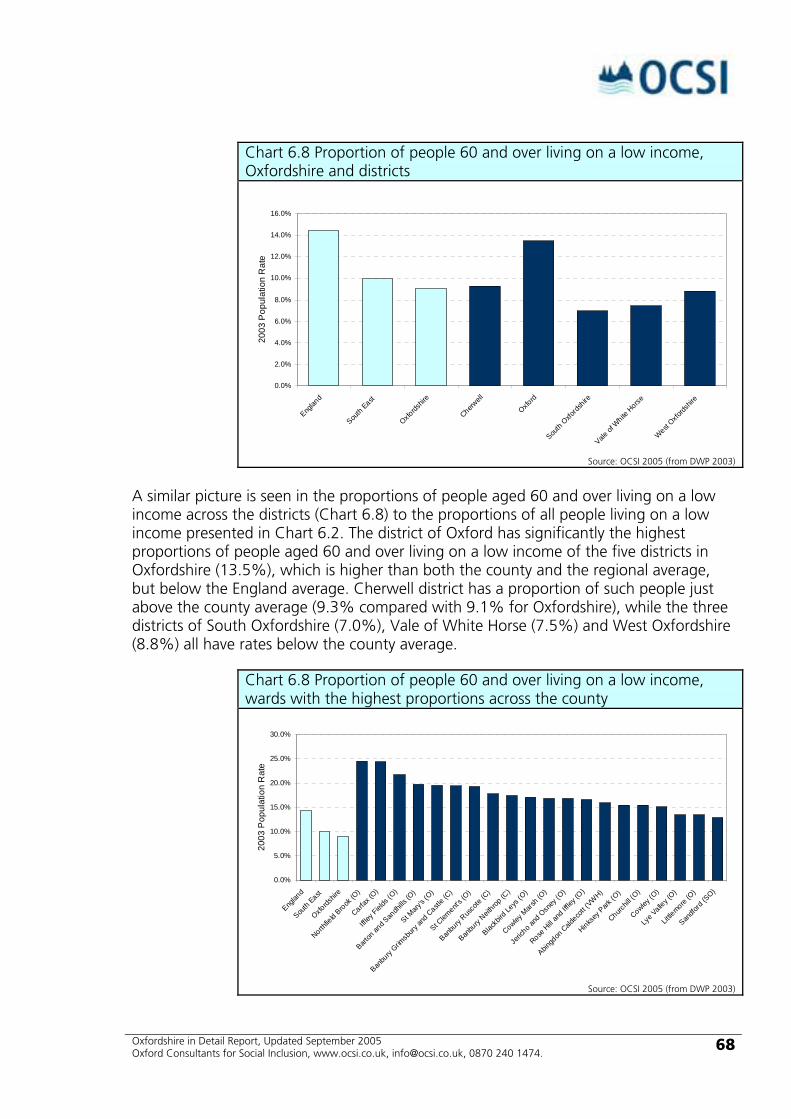
Oxfordshire in Detail Report, Updated September 2005 Oxford Consultants for Social Inclusion, www.ocsi.co.uk, [email protected], 0870 240 1474.
68
Chart 6.8 Proportion of people 60 and over living on a low income, Oxfordshire and districts
0.0%
2.0%
4.0%
6.0%
8.0%
10.0%
12.0%
14.0%
16.0%
Englan
d
South
East
Oxfords
hire
Cherwell
Oxford
South
Oxfords
hire
Vale of
White
Horse
West Oxfo
rdshir
e
2003
Pop
ulat
ion
Rat
e
Source: OCSI 2005 (from DWP 2003)
A similar picture is seen in the proportions of people aged 60 and over living on a low income across the districts (Chart 6.8) to the proportions of all people living on a low income presented in Chart 6.2. The district of Oxford has significantly the highest proportions of people aged 60 and over living on a low income of the five districts in Oxfordshire (13.5%), which is higher than both the county and the regional average, but below the England average. Cherwell district has a proportion of such people just above the county average (9.3% compared with 9.1% for Oxfordshire), while the three districts of South Oxfordshire (7.0%), Vale of White Horse (7.5%) and West Oxfordshire (8.8%) all have rates below the county average.
Chart 6.8 Proportion of people 60 and over living on a low income, wards with the highest proportions across the county
0.0%
5.0%
10.0%
15.0%
20.0%
25.0%
30.0%
Englan
d
South
East
Oxfords
hire
Northfie
ld Brook (O
)
Carfax (
O)
Iffley
Fields
(O)
Barton
and S
andh
ills (O
)
St Mary
's (O)
Banbu
ry Grim
sbury
and C
astle (
C)
St Clem
ent's (
O)
Banbu
ry Rus
cote
(C)
Banbu
ry Neit
hrop (C
)
Blackb
ird Le
ys (O
)
Cowley M
arsh (
O)
Jeric
ho and
Osn
ey (O
)
Rose H
ill an
d Iffle
y (O)
Abingd
on C
aldeco
tt (VW
H)
Hinksey
Park
(O)
Churchil
l (O)
Cowley (O
)
Lye V
alley (
O)
Little
more (O
)
Sandfo
rd (S
O)
2003
Pop
ulat
ion
Rat
e
Source: OCSI 2005 (from DWP 2003)

Oxfordshire in Detail Report, Updated September 2005 Oxford Consultants for Social Inclusion, www.ocsi.co.uk, [email protected], 0870 240 1474.
69
Chart 6.9 focuses on the twenty wards within Oxfordshire with the highest proportions of people aged 60 and over living on a low income. The top three wards have rates above 20% - more than one in five of all people aged 60 and over in Northfield Brook, Carfax and Iffley Fields are income deprived. Sixteen of the most deprived twenty wards are in Oxford with two in Cherwell and one each in Vale of the White Horse and West Oxfordshire.
Map 6.4 above shows the proportions of people aged 60 and over living on a low income for each ward in Oxfordshire for 2001. The ten colour coded intervals represent deciles and are based on the distribution across the county. Therefore, those wards in Map 6.4 that are coloured the darkest shade of blue are in the ‘top’ 10% of wards across Oxfordshire in terms of income deprivation among older people (i.e. with the highest proportions of people aged 60 and over living on a low income).
Map 6.4 shows that distribution of people aged 60 and over living on a low income is similar to the distribution of all people living on low incomes (Map 6.2) – wards with relatively high proportions of people aged 60 and over living on a low income in relation to the county as a whole tend to be located in more urbanised areas. These include wards in south of Oxford district, along with wards in Banbury.
6.4 Section summary Compared with England and the South-East region, Oxfordshire has relatively small proportions of people living on low incomes (or ‘income deprived’) , i.e. those in receipt of low income benefits such as Income Support (IS) and Income Based Jobseekers Allowance (JSA-IB). However, within the county there are significant pockets with high rates of income deprivation – more than one in five of all people aged 60 and over in the Oxford wards of Northfield Brook, St Mary’s and Carfax are income deprived, while in six wards across the county more than one in ten of all people aged 16 and over are income deprived.
The distribution of people living on low income across Oxfordshire shows that the majority of wards showing high proportions of income deprived people are concentrated in urban areas such as Oxford, Banbury and Abingdon. Also, areas across all five districts have significant numbers of people of all ages living on a low income.

Oxfordshire in Detail Report, Updated September 2005 Oxford Consultants for Social Inclusion, www.ocsi.co.uk, [email protected], 0870 240 1474.
70
Section 7 Children living in low income households
Oxfordshire England
All children living in low income households78
12,115 (10.3%) 1,900,982 (19.3%) Children under 5 living in low income households79 3,695 (10.5%) 541,518 (18.9%) Children aged 5-15 living in low income households80 8,420 (10.2%) 1,359,464 (19.5%)
Children are particularly vulnerable to deprivation and social exclusion. They are not eligible for social security in their own right but are reliant on the financial support of their parent(s) and/or carer(s).
A considerable body of research shows that children are one of the most vulnerable population groups in terms of income deprivation and social exclusion. This vulnerability has been recognised by the government, which has made reducing child poverty one of its key priorities. Indeed, the government’s current target is to cut the number of children growing up in low income poverty by one-quarter by 2004, compared with 1999.
The official definition of child poverty recently adopted by the Department for Work and Pensions incorporates a measure of absolute low income (number of children living in families with incomes below a particular threshold); relative low income (number of children living in families with income below 60% of median income); and material and low income deprivation combined (number of children living in households that are both materially deprived and have an income below 70% of median income). The data upon which the official definition is based are drawn from the Family Resources Survey. Unfortunately, however, the official measure is not statistically reliable below regional level. See the 2003 report ‘Measuring Child Poverty’ by the Department for Work and Pensions, for further details.
In order to estimate and monitor the numbers of children living in poverty at small area level (e.g. ward level), we use information on families receiving means-tested out of work benefits, namely Income Support (IS) and income based Job Seekers Allowance (JSA-IB). Although children under the age of 16 are ineligible for such benefits, parents claim these benefits for themselves and their dependent children. It is therefore possible to calculate the number of dependent children living in households on low income at small area level across the whole of the UK. See the Knowing the benefits: Children in low income households box for more details.
Although this measure will not capture every child that would be classified as living in income deprived poverty under the official definition, the majority of children will be included.
Oxfordshire in Detail Report, Updated September 2005 Oxford Consultants for Social Inclusion, www.ocsi.co.uk, [email protected], 0870 240 1474.
71
As in any analysis of low income based on benefits data, it is important to note that variations in take up of benefits can lead to under estimations of people living on low income. It is also important to remember that not every family living on low income in the UK will be eligible for IS or JSA-IB (e.g. refugees and asylum seekers are not eligible) and therefore this measure will exclude these families.
Knowing the benefits: Children in low income households In this section we describe dependents of people in receipt of Income Support and Income Based Job Seekers Allowance as ‘children living in low income households’.
Income Support (IS)
Income Support is a subsistence means-tested benefit for those people who do not have other sources of income, or whose income is below a certain level. From October 1996, Jobseeker's Allowance replaced IS for unemployed people – IS is paid only for people not required to be available for work. These groups include pensioners, lone parents, sick and disabled people.
Income Based Job Seekers Allowance (JSA-IB)
Income Based Job Seekers Allowance (JSA-IB) is a means-tested benefit for those people who are unemployed, when they either have not built up enough National Insurance contributions to be able to claim ‘contributions based Job Seekers Allowance’ (JSA-CB) or when JSA-CB is not sufficient to meet the designated financial needs of their household, based on the household composition. It is the equivalent of Income Support for those people who must be actively seeking paid employment in order to qualify for benefit.
The information currently released by the Department for Work and Pensions for 2002 does not give the numbers of dependents of people in receipt of Income Based Job Seekers Allowance, therefore in this section we look only at dependents of people in receipt of Income Support.
7.1 Children living in low income households across Oxfordshire This section contains a series of tables, charts and maps depicting the distribution of children living in low income households as defined by receipt of out of work means-tested benefits. Data are available for three age ranges: under 5, 5-15, and 0-15 and relate to the year 2002.
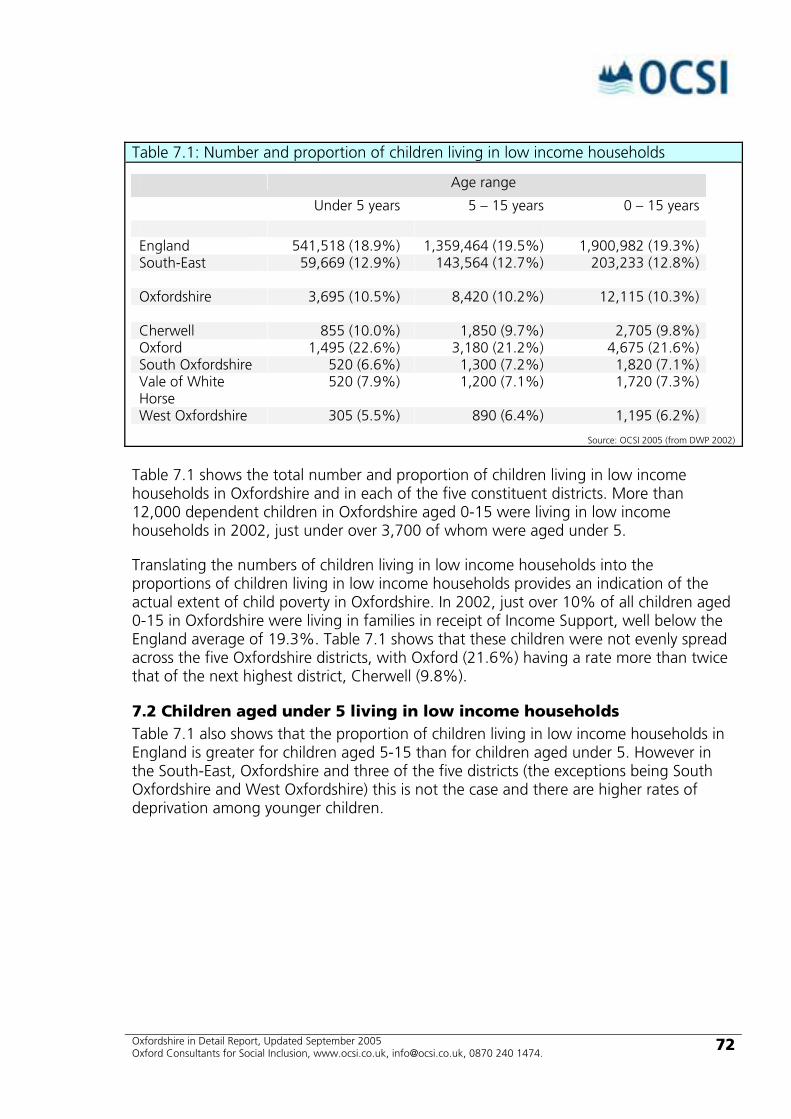
Oxfordshire in Detail Report, Updated September 2005 Oxford Consultants for Social Inclusion, www.ocsi.co.uk, [email protected], 0870 240 1474.
72
Table 7.1: Number and proportion of children living in low income households
Age range
Under 5 years 5 – 15 years 0 – 15 years
England 541,518 (18.9%) 1,359,464 (19.5%) 1,900,982 (19.3%)South-East 59,669 (12.9%) 143,564 (12.7%) 203,233 (12.8%) Oxfordshire 3,695 (10.5%) 8,420 (10.2%) 12,115 (10.3%) Cherwell 855 (10.0%) 1,850 (9.7%) 2,705 (9.8%)Oxford 1,495 (22.6%) 3,180 (21.2%) 4,675 (21.6%)South Oxfordshire 520 (6.6%) 1,300 (7.2%) 1,820 (7.1%)Vale of White Horse
520 (7.9%) 1,200 (7.1%) 1,720 (7.3%)
West Oxfordshire 305 (5.5%) 890 (6.4%) 1,195 (6.2%)
Source: OCSI 2005 (from DWP 2002)
Table 7.1 shows the total number and proportion of children living in low income households in Oxfordshire and in each of the five constituent districts. More than 12,000 dependent children in Oxfordshire aged 0-15 were living in low income households in 2002, just under over 3,700 of whom were aged under 5.
Translating the numbers of children living in low income households into the proportions of children living in low income households provides an indication of the actual extent of child poverty in Oxfordshire. In 2002, just over 10% of all children aged 0-15 in Oxfordshire were living in families in receipt of Income Support, well below the England average of 19.3%. Table 7.1 shows that these children were not evenly spread across the five Oxfordshire districts, with Oxford (21.6%) having a rate more than twice that of the next highest district, Cherwell (9.8%).
7.2 Children aged under 5 living in low income households Table 7.1 also shows that the proportion of children living in low income households in England is greater for children aged 5-15 than for children aged under 5. However in the South-East, Oxfordshire and three of the five districts (the exceptions being South Oxfordshire and West Oxfordshire) this is not the case and there are higher rates of deprivation among younger children.
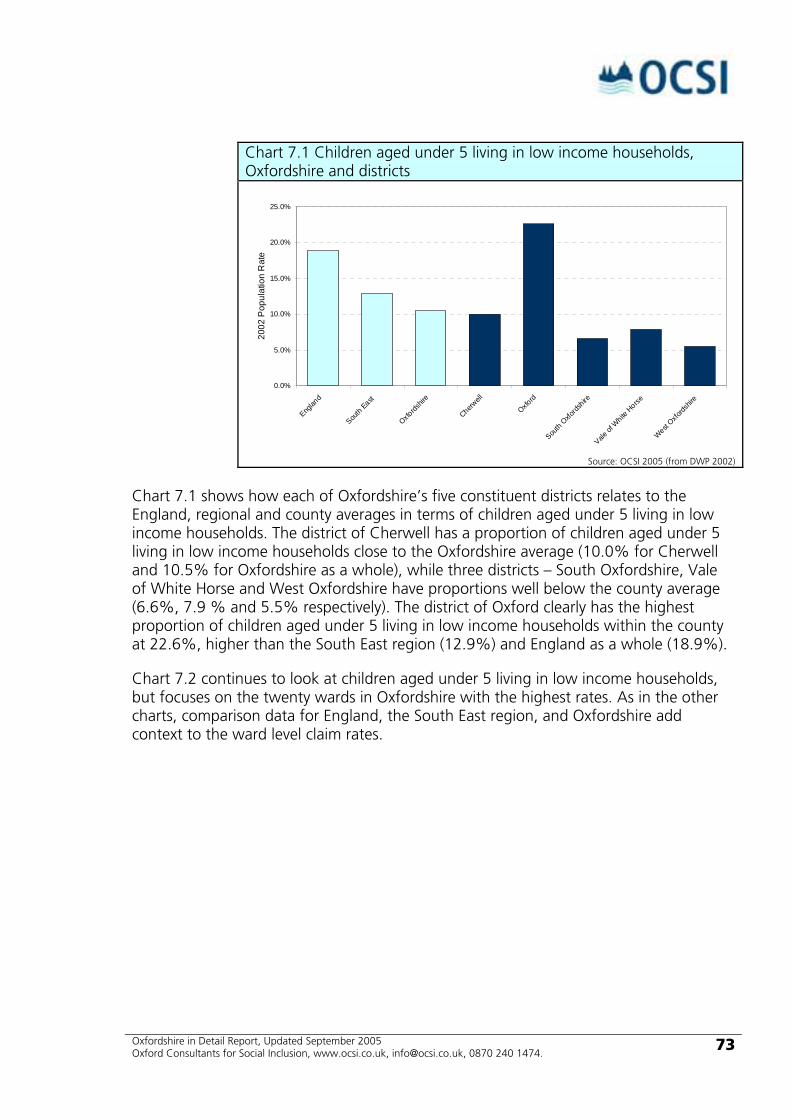
Oxfordshire in Detail Report, Updated September 2005 Oxford Consultants for Social Inclusion, www.ocsi.co.uk, [email protected], 0870 240 1474.
73
Chart 7.1 Children aged under 5 living in low income households, Oxfordshire and districts
0.0%
5.0%
10.0%
15.0%
20.0%
25.0%
Englan
d
South
East
Oxfords
hire
Cherwell
Oxford
South
Oxfords
hire
Vale of
White
Horse
West Oxfo
rdshir
e
2002
Pop
ulat
ion
Rat
e
Source: OCSI 2005 (from DWP 2002)
Chart 7.1 shows how each of Oxfordshire’s five constituent districts relates to the England, regional and county averages in terms of children aged under 5 living in low income households. The district of Cherwell has a proportion of children aged under 5 living in low income households close to the Oxfordshire average (10.0% for Cherwell and 10.5% for Oxfordshire as a whole), while three districts – South Oxfordshire, Vale of White Horse and West Oxfordshire have proportions well below the county average (6.6%, 7.9 % and 5.5% respectively). The district of Oxford clearly has the highest proportion of children aged under 5 living in low income households within the county at 22.6%, higher than the South East region (12.9%) and England as a whole (18.9%).
Chart 7.2 continues to look at children aged under 5 living in low income households, but focuses on the twenty wards in Oxfordshire with the highest rates. As in the other charts, comparison data for England, the South East region, and Oxfordshire add context to the ward level claim rates.
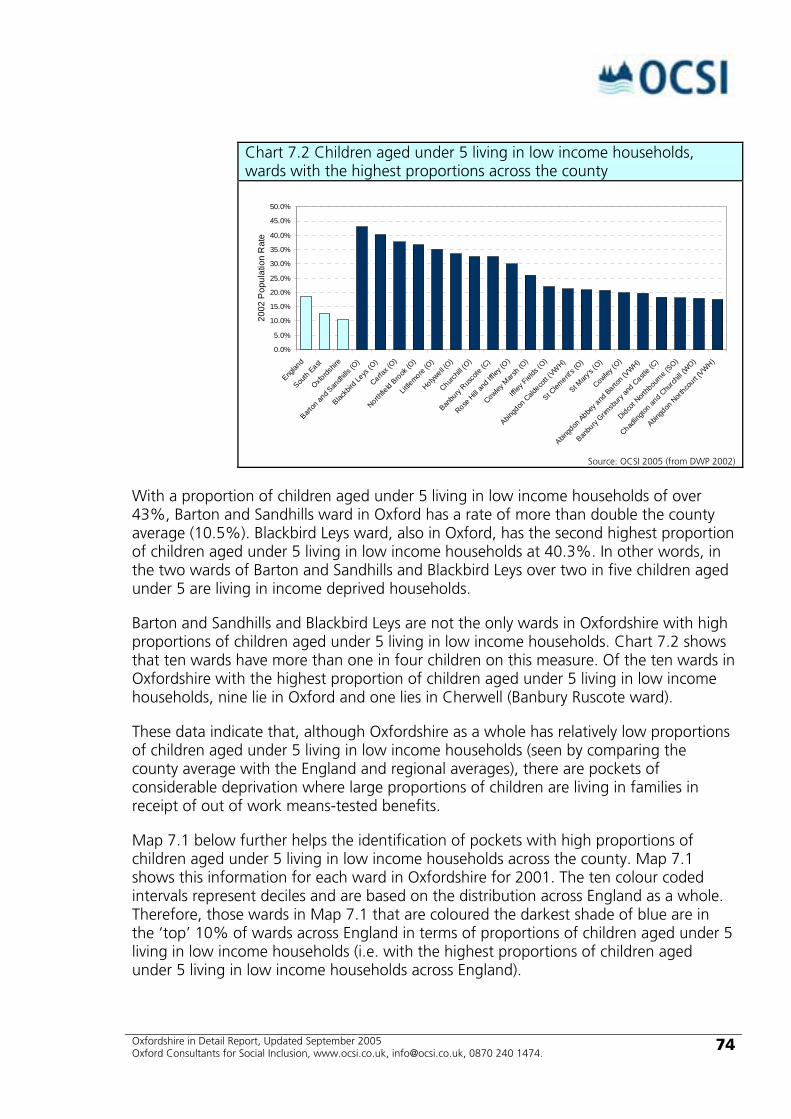
Oxfordshire in Detail Report, Updated September 2005 Oxford Consultants for Social Inclusion, www.ocsi.co.uk, [email protected], 0870 240 1474.
74
Chart 7.2 Children aged under 5 living in low income households, wards with the highest proportions across the county
0.0%
5.0%
10.0%
15.0%
20.0%
25.0%
30.0%
35.0%
40.0%
45.0%
50.0%
Englan
d
South
East
Oxfords
hire
Barton
and S
andh
ills (O
)
Blackb
ird Le
ys (O
)
Carfax (
O)
Northfie
ld Brook (O
)
Little
more (O
)
Holywell (
O)
Churchil
l (O)
Banbu
ry Rus
cote
(C)
Rose H
ill an
d Iffle
y (O)
Cowley M
arsh (
O)
Iffley
Fields
(O)
Abingd
on C
aldeco
tt (VW
H)
St Clem
ent's (
O)
St Mary
's (O)
Cowley (O
)
Abingd
on Abbe
y and
Barton (
VWH)
Banbu
ry Grim
sbury
and C
astle (
C)
Didcot N
orthb
ourne (
SO)
Chadlin
gton an
d Chu
rchill
(WO)
Abingd
on N
orthco
urt (VWH)
2002
Pop
ulat
ion
Rat
e
Source: OCSI 2005 (from DWP 2002)
With a proportion of children aged under 5 living in low income households of over 43%, Barton and Sandhills ward in Oxford has a rate of more than double the county average (10.5%). Blackbird Leys ward, also in Oxford, has the second highest proportion of children aged under 5 living in low income households at 40.3%. In other words, in the two wards of Barton and Sandhills and Blackbird Leys over two in five children aged under 5 are living in income deprived households.
Barton and Sandhills and Blackbird Leys are not the only wards in Oxfordshire with high proportions of children aged under 5 living in low income households. Chart 7.2 shows that ten wards have more than one in four children on this measure. Of the ten wards in Oxfordshire with the highest proportion of children aged under 5 living in low income households, nine lie in Oxford and one lies in Cherwell (Banbury Ruscote ward).
These data indicate that, although Oxfordshire as a whole has relatively low proportions of children aged under 5 living in low income households (seen by comparing the county average with the England and regional averages), there are pockets of considerable deprivation where large proportions of children are living in families in receipt of out of work means-tested benefits.
Map 7.1 below further helps the identification of pockets with high proportions of children aged under 5 living in low income households across the county. Map 7.1 shows this information for each ward in Oxfordshire for 2001. The ten colour coded intervals represent deciles and are based on the distribution across England as a whole. Therefore, those wards in Map 7.1 that are coloured the darkest shade of blue are in the ‘top’ 10% of wards across England in terms of proportions of children aged under 5 living in low income households (i.e. with the highest proportions of children aged under 5 living in low income households across England).

Oxfordshire in Detail Report, Updated September 2005 Oxford Consultants for Social Inclusion, www.ocsi.co.uk, [email protected], 0870 240 1474.
75
Map 7.1 clearly shows that Oxfordshire is largely characterised by relatively low proportions of children aged under 5 living in low income households when considered in the context of all the wards in England. However, there are areas showing extremely high proportions of such children; particularly in the south and east of Oxford where the wards of Barton and Sandhills, Churchill, Blackbird Leys, Littlemore and Northfield Brook are located, but also in the wards of Banbury Ruscote (Cherwell) and Abingdon Caldecott (Vale of White Horse).
Map 7.2 below shows the same data on proportions of children aged under 5 living in low income households, but with the colour coded intervals based on the distribution across the county – wards in Map 7.2 that are coloured the darkest shade of blue are in the ‘top’ 10% of wards across Oxfordshire in terms of proportions of children aged under 5 living in low income households (i.e. with the highest proportions of children aged under 5 living in low income households across the county). This allows us to see the patterns within the county, where Map 7.1 allowed us to view the county in the broader context of the distribution across England.
Map 7.2 shows that when the ward-level proportions of children aged under 5 living in low income households are considered in the context of the county distribution, rather than the national distribution, it is possible to identify additional areas that have relatively high proportions in comparison with the other wards in the county. The areas with relatively high proportions of such children tend to be located in the more urbanised areas, including much of Oxford, and parts of Banbury, Abingdon, Didcot, and Witney. Additionally a small number of wards contain no children aged under 5 living in low income households.
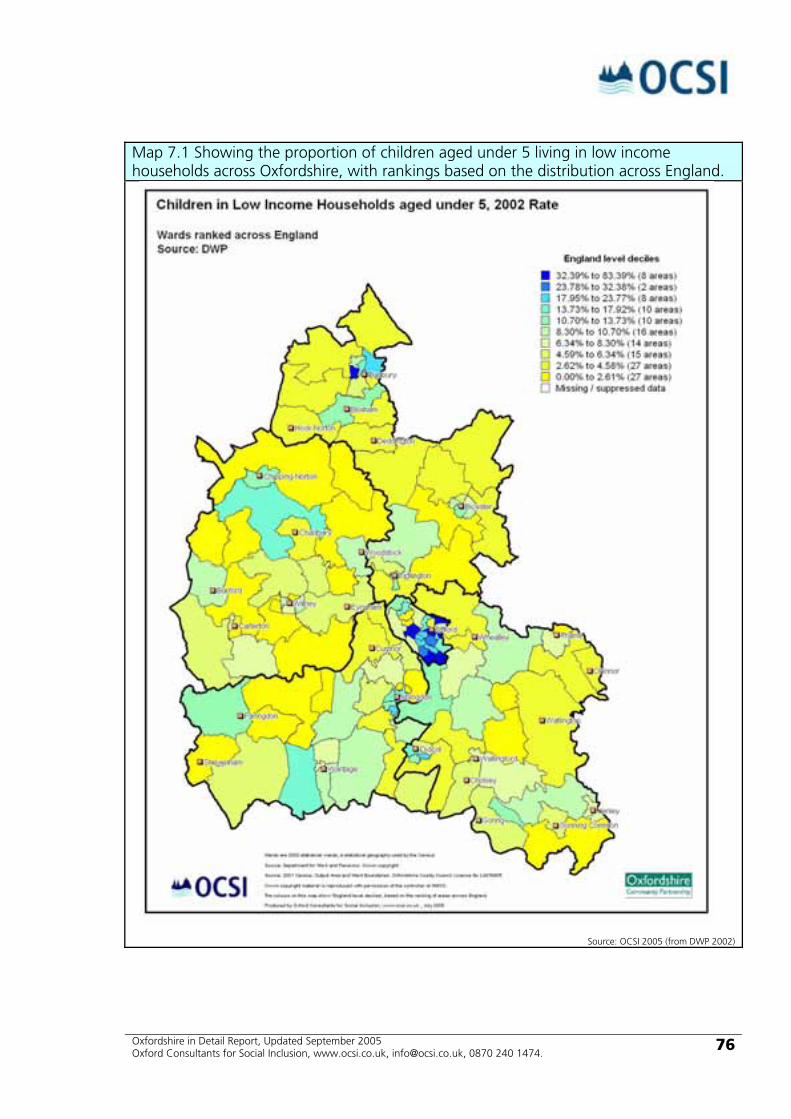
Oxfordshire in Detail Report, Updated September 2005 Oxford Consultants for Social Inclusion, www.ocsi.co.uk, [email protected], 0870 240 1474.
76
Map 7.1 Showing the proportion of children aged under 5 living in low income households across Oxfordshire, with rankings based on the distribution across England.
Source: OCSI 2005 (from DWP 2002)
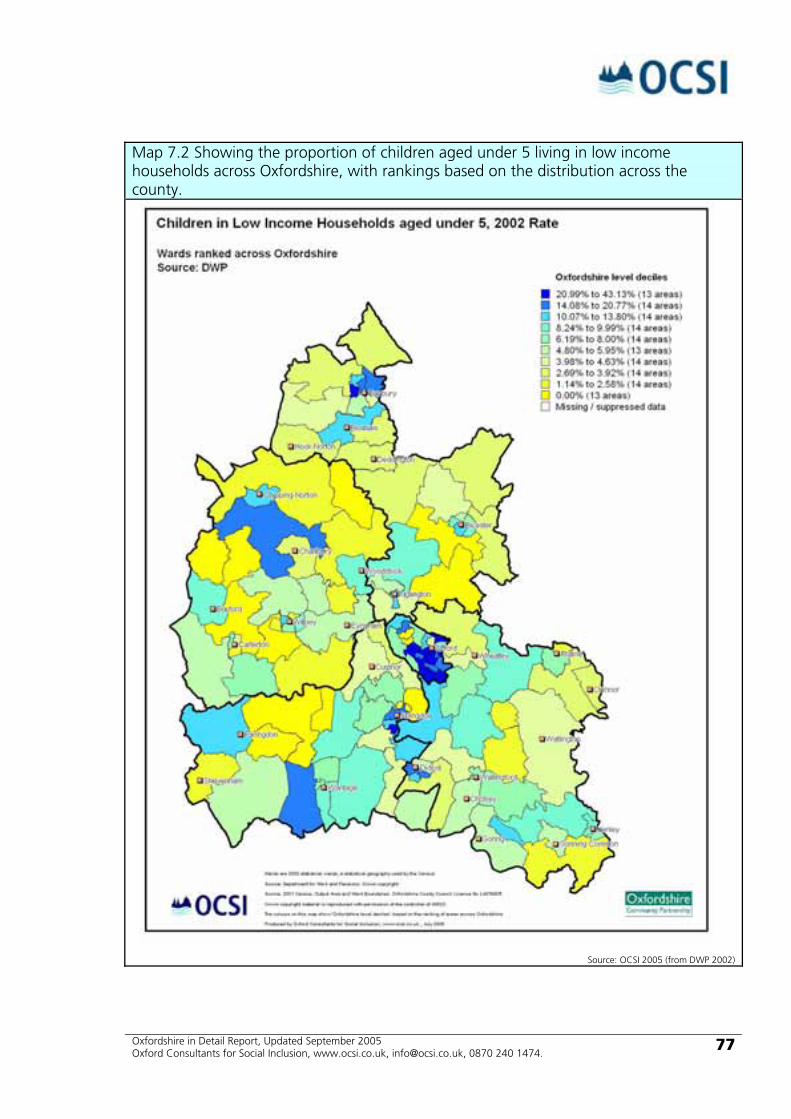
Oxfordshire in Detail Report, Updated September 2005 Oxford Consultants for Social Inclusion, www.ocsi.co.uk, [email protected], 0870 240 1474.
77
Map 7.2 Showing the proportion of children aged under 5 living in low income households across Oxfordshire, with rankings based on the distribution across the county.
Source: OCSI 2005 (from DWP 2002)
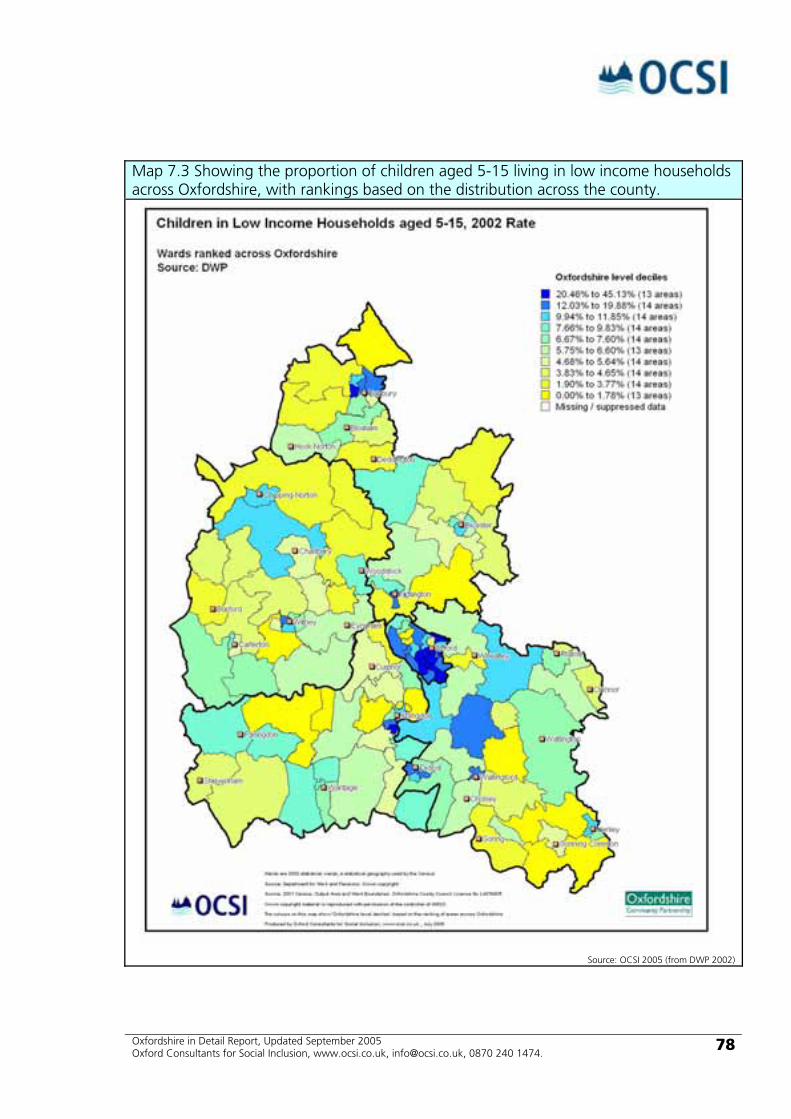
Oxfordshire in Detail Report, Updated September 2005 Oxford Consultants for Social Inclusion, www.ocsi.co.uk, [email protected], 0870 240 1474.
78
Map 7.3 Showing the proportion of children aged 5-15 living in low income households across Oxfordshire, with rankings based on the distribution across the county.
Source: OCSI 2005 (from DWP 2002)

Oxfordshire in Detail Report, Updated September 2005 Oxford Consultants for Social Inclusion, www.ocsi.co.uk, [email protected], 0870 240 1474.
79
Map 7.4 Showing the Indices of Deprivation 2004, Income Deprivation affecting Children Index, with rankings based on the distribution across the county.
Source: OCSI 2005 (from ODPM 2004)
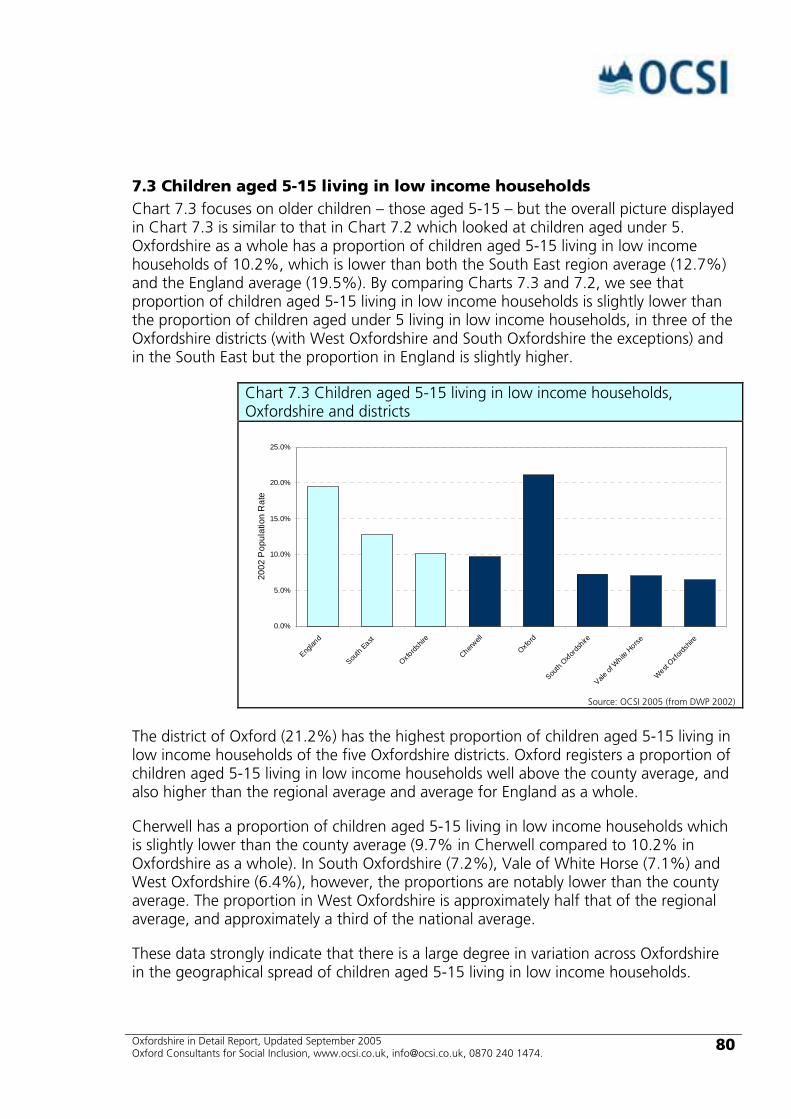
Oxfordshire in Detail Report, Updated September 2005 Oxford Consultants for Social Inclusion, www.ocsi.co.uk, [email protected], 0870 240 1474.
80
7.3 Children aged 5-15 living in low income households Chart 7.3 focuses on older children – those aged 5-15 – but the overall picture displayed in Chart 7.3 is similar to that in Chart 7.2 which looked at children aged under 5. Oxfordshire as a whole has a proportion of children aged 5-15 living in low income households of 10.2%, which is lower than both the South East region average (12.7%) and the England average (19.5%). By comparing Charts 7.3 and 7.2, we see that proportion of children aged 5-15 living in low income households is slightly lower than the proportion of children aged under 5 living in low income households, in three of the Oxfordshire districts (with West Oxfordshire and South Oxfordshire the exceptions) and in the South East but the proportion in England is slightly higher.
Chart 7.3 Children aged 5-15 living in low income households, Oxfordshire and districts
0.0%
5.0%
10.0%
15.0%
20.0%
25.0%
Englan
d
South
East
Oxfords
hire
Cherwell
Oxford
South
Oxfords
hire
Vale of
White
Horse
West Oxfo
rdshir
e
2002
Pop
ulat
ion
Rat
e
Source: OCSI 2005 (from DWP 2002)
The district of Oxford (21.2%) has the highest proportion of children aged 5-15 living in low income households of the five Oxfordshire districts. Oxford registers a proportion of children aged 5-15 living in low income households well above the county average, and also higher than the regional average and average for England as a whole.
Cherwell has a proportion of children aged 5-15 living in low income households which is slightly lower than the county average (9.7% in Cherwell compared to 10.2% in Oxfordshire as a whole). In South Oxfordshire (7.2%), Vale of White Horse (7.1%) and West Oxfordshire (6.4%), however, the proportions are notably lower than the county average. The proportion in West Oxfordshire is approximately half that of the regional average, and approximately a third of the national average.
These data strongly indicate that there is a large degree in variation across Oxfordshire in the geographical spread of children aged 5-15 living in low income households.
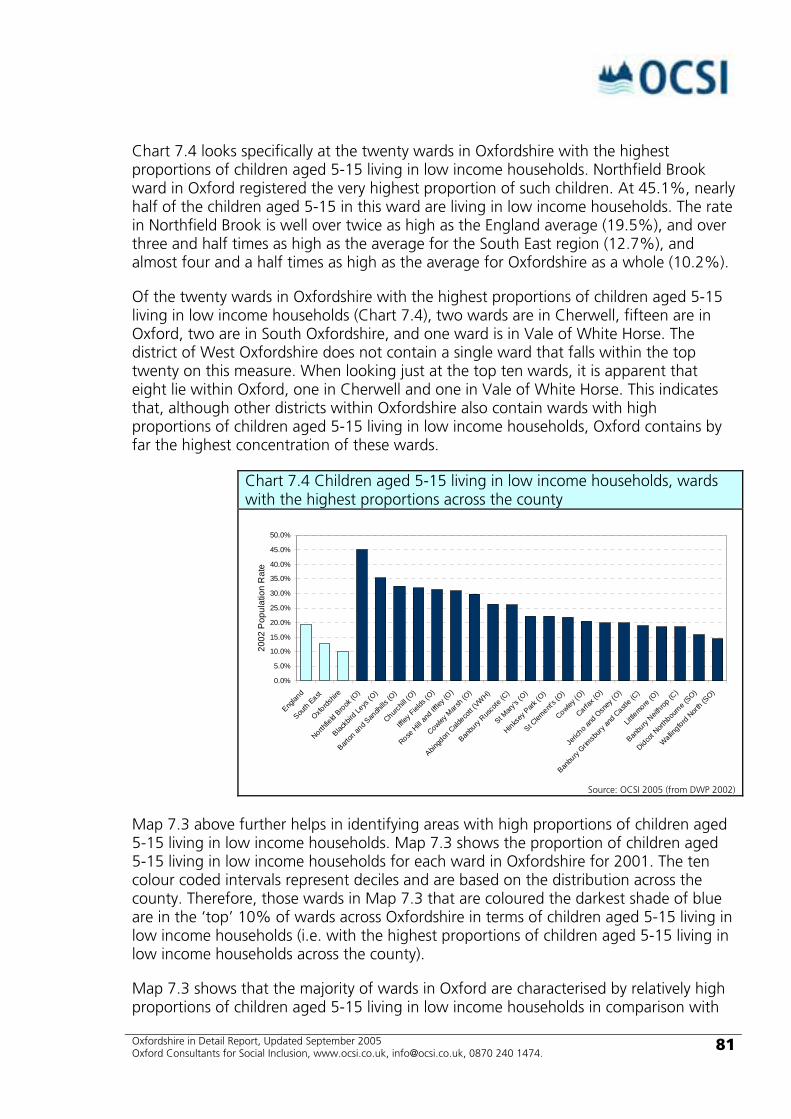
Oxfordshire in Detail Report, Updated September 2005 Oxford Consultants for Social Inclusion, www.ocsi.co.uk, [email protected], 0870 240 1474.
81
Chart 7.4 looks specifically at the twenty wards in Oxfordshire with the highest proportions of children aged 5-15 living in low income households. Northfield Brook ward in Oxford registered the very highest proportion of such children. At 45.1%, nearly half of the children aged 5-15 in this ward are living in low income households. The rate in Northfield Brook is well over twice as high as the England average (19.5%), and over three and half times as high as the average for the South East region (12.7%), and almost four and a half times as high as the average for Oxfordshire as a whole (10.2%).
Of the twenty wards in Oxfordshire with the highest proportions of children aged 5-15 living in low income households (Chart 7.4), two wards are in Cherwell, fifteen are in Oxford, two are in South Oxfordshire, and one ward is in Vale of White Horse. The district of West Oxfordshire does not contain a single ward that falls within the top twenty on this measure. When looking just at the top ten wards, it is apparent that eight lie within Oxford, one in Cherwell and one in Vale of White Horse. This indicates that, although other districts within Oxfordshire also contain wards with high proportions of children aged 5-15 living in low income households, Oxford contains by far the highest concentration of these wards.
Chart 7.4 Children aged 5-15 living in low income households, wards with the highest proportions across the county
0.0%
5.0%
10.0%
15.0%
20.0%
25.0%
30.0%
35.0%
40.0%
45.0%
50.0%
Englan
d
South
East
Oxfords
hire
Northfie
ld Brook (O
)
Blackb
ird Le
ys (O
)
Barton
and S
andh
ills (O
)
Churchil
l (O)
Iffley
Fields
(O)
Rose H
ill an
d Iffle
y (O)
Cowley M
arsh (
O)
Abingd
on C
aldeco
tt (VW
H)
Banbu
ry Rus
cote
(C)
St Mary
's (O)
Hinksey
Park
(O)
St Clem
ent's (
O)
Cowley (O
)
Carfax (
O)
Jeric
ho and
Osn
ey (O
)
Banbu
ry Grim
sbury
and C
astle (
C)
Little
more (O
)
Banbu
ry Neit
hrop (C
)
Didcot N
orthb
ourne (
SO)
Wallingford
North (S
O)
2002
Pop
ulat
ion
Rat
e
Source: OCSI 2005 (from DWP 2002)
Map 7.3 above further helps in identifying areas with high proportions of children aged 5-15 living in low income households. Map 7.3 shows the proportion of children aged 5-15 living in low income households for each ward in Oxfordshire for 2001. The ten colour coded intervals represent deciles and are based on the distribution across the county. Therefore, those wards in Map 7.3 that are coloured the darkest shade of blue are in the ‘top’ 10% of wards across Oxfordshire in terms of children aged 5-15 living in low income households (i.e. with the highest proportions of children aged 5-15 living in low income households across the county).
Map 7.3 shows that the majority of wards in Oxford are characterised by relatively high proportions of children aged 5-15 living in low income households in comparison with
Oxfordshire in Detail Report, Updated September 2005 Oxford Consultants for Social Inclusion, www.ocsi.co.uk, [email protected], 0870 240 1474.
82
the other wards in Oxfordshire. However, a number of wards in other districts also register relatively high proportions of such children, with each of the five districts containing at least one ward in the upper deciles of the distribution. These are located in Banbury, Abingdon, Didcot, and Witney.
7.4 Indices of Deprivation 2004, Income Deprivation affecting Children Index The Indices of Deprivation 2004 recently released by the Office of the Deputy Prime Minister, provide information at a finer level of detail, Census Super Output Areas, than the ward-level information released by the Department for Work and Pensions used in this section (for further detail on Census Super Output Areas and other geographies, see the Background: Knowing the geographies box in Section 3).
Along with the main Index of Multiple Deprivation, the information released contains seven domain level indices each focusing on a key deprivation theme (see Section 12. Indices of Deprivation 2004 for further information), as well as additional ‘Income Deprivation affecting Older People’ and ‘Income Deprivation affecting Children’ indices.
The Income Deprivation affecting Children index (IDAC) measures the proportion of children aged under 16 who are living in families that are income deprived. The definition of income deprivation used in the index includes the IS and JSA-IB claimants used previously in this section, but also includes those families receiving Working Families Tax Credits or Disabled Persons Tax Credits and whose income is below 60% of the median income across England. This is a broader measure than the proportions of dependent children living in households in receipt of Income Support, including additional groups on low income.
Map 7.4 above shows the Income Deprivation affecting Children index across the county at Census Super Output Area (SOA) level. The ten colour coded intervals represent deciles and are based on the distribution across the county. Therefore, those SOAs in Map 7.4 that are coloured the darkest shade of blue are in the ‘top’ 10% of SOAs across Oxfordshire in terms of the Income Deprivation affecting Children index (i.e. with the highest Income Deprivation affecting Children scores across the county).
The distribution of children living in low income households across Oxfordshire shown in Map 7.4 clearly follows the information presented in Maps 7.1 – 7.3. However the more detailed picture provided by the SOA level information enables us to get a clear view of how the areas of children living in low income households are distributed in the urban areas. In particular we clearly see how the pockets of deprivation in Abingdon, Banbury, Bicester and Didcot are located – within the wards identified in parts 7.1 to 7.3 of this section, there are smaller areas of extremely high deprivation.
Chart 7.5 shows the most deprived SOAs in the county on the Income Deprivation affecting Children index (the names are created from the ward followed by the SOA code) – in areas of Northfield Brook and Barton & Sandhills wards, more than half of the children under 16 are living in low income households.

Oxfordshire in Detail Report, Updated September 2005 Oxford Consultants for Social Inclusion, www.ocsi.co.uk, [email protected], 0870 240 1474.
83
Chart 7.5 Income Deprivation affecting Children index scores, SOAs with the highest scores across the county
0.00
0.10
0.20
0.30
0.40
0.50
0.60
Northfie
ld Brook E
0102
8569
(O)
Barton
and S
andh
ills E
0102
8513
(O)
Northfie
ld Brook E
0102
8568
(O)
Banbu
ry Rus
cote
E0102
8450
(C)
Blackb
ird Le
ys E01
02851
8 (O)
Rose H
ill an
d Iffle
y E01
02857
7 (O)
Churchil
l E01
02852
5 (O)
Rose H
ill an
d Iffle
y E01
02857
6 (O)
Blackb
ird Le
ys E01
02851
7 (O)
St Clem
ent's E
0102
8582
(O)
Banbu
ry Grim
sbury
and C
astle E
01028
436 (
C)
Jeric
ho and
Osn
ey E01
02855
0 (O)
Blackb
ird Le
ys E01
02852
0 (O)
Abingd
on C
aldeco
tt E01
0286
92 (V
WH)
St Clem
ent's E
0102
8579
(O)
Blackb
ird Le
ys E01
02851
9 (O)
Banbu
ry Rus
cote
E0102
8449
(C)
Iffley
Fields
E0102
8546
(O)
Iffley
Fields
E0102
8547
(O)
Barton
and S
andh
ills E
0102
8516
(O)
2004
Inde
x S
core
Source: ODPM 2004
7.5 Section summary Overall, Oxfordshire has low levels of children living in low income households compared to the average levels across the region and England. But this average view hides smaller areas of deprivation within the county – one of the five districts (Oxford) has proportions of children living in low income households above the regional and England averages.
At a more detailed level, there are small pockets of extreme deprivation – Barton and Sandhills and Blackbird Leys wards have two in five children aged under 5 living in low income households whilst Northfield Brook ward has over 45% of children aged 5-15 living in income deprived households. Two areas in Northfield Brook and Barton & Sandhills have more than half of all children aged under 16 affected by income deprivation.
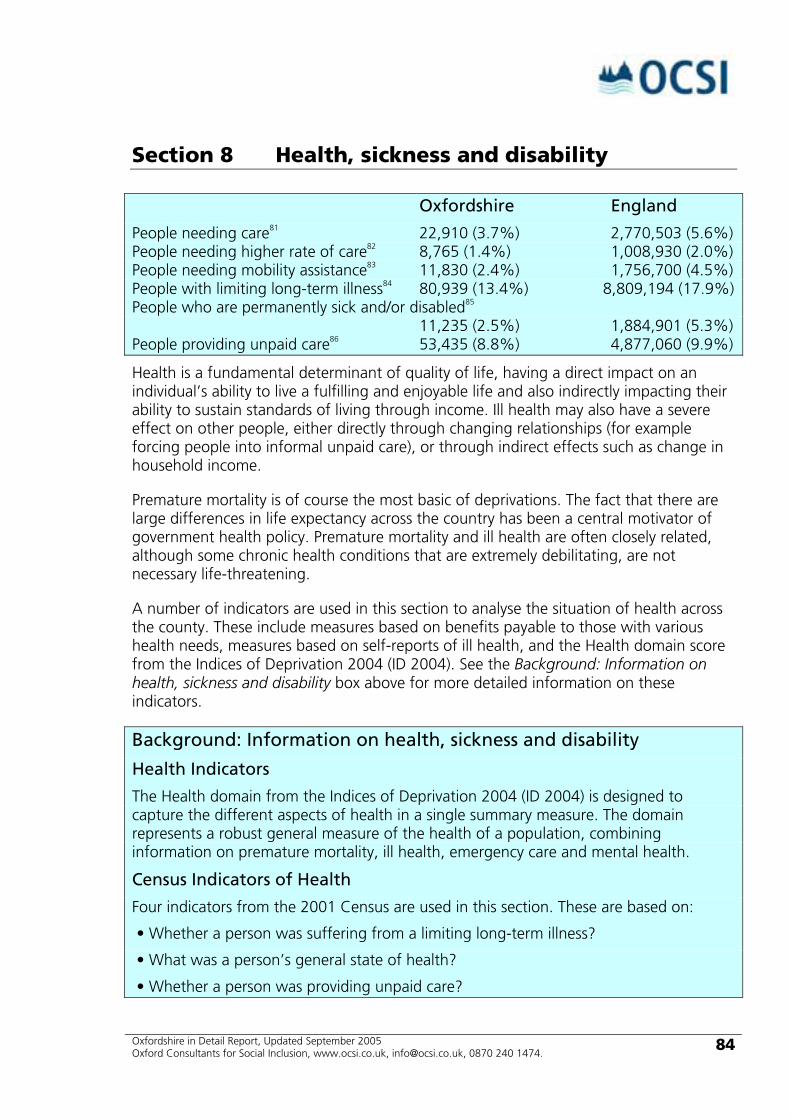
Oxfordshire in Detail Report, Updated September 2005 Oxford Consultants for Social Inclusion, www.ocsi.co.uk, [email protected], 0870 240 1474.
84
Section 8 Health, sickness and disability
Oxfordshire England
People needing care81 22,910 (3.7%) 2,770,503 (5.6%) People needing higher rate of care82 8,765 (1.4%) 1,008,930 (2.0%) People needing mobility assistance83 11,830 (2.4%) 1,756,700 (4.5%) People with limiting long-term illness84 80,939 (13.4%) 8,809,194 (17.9%) People who are permanently sick and/or disabled85 11,235 (2.5%) 1,884,901 (5.3%) People providing unpaid care86 53,435 (8.8%) 4,877,060 (9.9%)
Health is a fundamental determinant of quality of life, having a direct impact on an individual’s ability to live a fulfilling and enjoyable life and also indirectly impacting their ability to sustain standards of living through income. Ill health may also have a severe effect on other people, either directly through changing relationships (for example forcing people into informal unpaid care), or through indirect effects such as change in household income.
Premature mortality is of course the most basic of deprivations. The fact that there are large differences in life expectancy across the country has been a central motivator of government health policy. Premature mortality and ill health are often closely related, although some chronic health conditions that are extremely debilitating, are not necessary life-threatening.
A number of indicators are used in this section to analyse the situation of health across the county. These include measures based on benefits payable to those with various health needs, measures based on self-reports of ill health, and the Health domain score from the Indices of Deprivation 2004 (ID 2004). See the Background: Information on health, sickness and disability box above for more detailed information on these indicators.
Background: Information on health, sickness and disability
Health Indicators
The Health domain from the Indices of Deprivation 2004 (ID 2004) is designed to capture the different aspects of health in a single summary measure. The domain represents a robust general measure of the health of a population, combining information on premature mortality, ill health, emergency care and mental health.
Census Indicators of Health
Four indicators from the 2001 Census are used in this section. These are based on:
• Whether a person was suffering from a limiting long-term illness?
• What was a person’s general state of health?
• Whether a person was providing unpaid care?
Oxfordshire in Detail Report, Updated September 2005 Oxford Consultants for Social Inclusion, www.ocsi.co.uk, [email protected], 0870 240 1474.
85
• Whether a person was permanently sick or disabled?
The limiting long-term illness question captures limitations on ability to function that the person experiences due to illness, possibly impacting their ability to work. The general state of health question obtains a broader sense that the person has of their own well-being. The unpaid care question enables the important issue of informal care to be looked at. The permanently sick or disabled question is asked in the census as part of an account a person is asked to give of their daily activity. This means that unlike the limiting long-term illness question, someone who is disabled but working may not categorize themselves as ‘permanently sick or disabled’.
Health Benefit Datasets
Indicators developed from Department for Work and Pensions Health benefits are integrated into the Health domain from the Indices of Deprivation 2004, but in this section we also look at measures based directly on the numbers and proportions of people in receipt of such health benefits. These particularly focus on care for people in a chronic state of ill health or disability and who have a need for extra help with mobility or more general care.
The extent of the care required is recognised in lower or higher payment levels. For example, in order to qualify for Attendance Allowance (AA), one or more care conditions must be true for at least 6 months. To qualify for the higher level of AA payment, this care condition must be true both day and night. Whether a person is receiving higher or lower level AA can therefore be used to estimate their level of ill-health or disability.
8.1 Health, sickness and disability across Oxfordshire Overall, people in Oxfordshire are in relatively good health compared to other areas of England. The key indicators from the beginning of this section show that the health benefit rates across the county – people needing care, people needing higher rate of care, and people needing mobility assistance – are significantly below the averages across England. A similar picture is seen for the self-report 2001 Census questions on limiting long-term illness, general health and whether people were permanently sick and/or disabled, with rates across Oxfordshire well below the England averages. By contrast, the proportion of people providing unpaid care across Oxfordshire is just below the average across England – 8.8% in the county compared with 9.9% for England as a whole.
This pattern of Oxfordshire people being in good health is supported by the ID 2004 Health domain score (see the Background: Information on health, sickness and disability box above for description of this domain).
Map 8.1 below shows the ID 2004 Health domain scores across the county at Census Super Output Area (SOA) level. The ten colour coded intervals represent deciles and are based on the distribution across England. Therefore, those SOAs in Map 8.1 that are coloured the darkest shade of blue are in the ‘top’ 10% of SOAs across England in terms of the ID 2004 Health domain (i.e. with the poorest Health domain scores across England), while the SOAs that are coloured in the lightest yellow are in the ‘bottom’
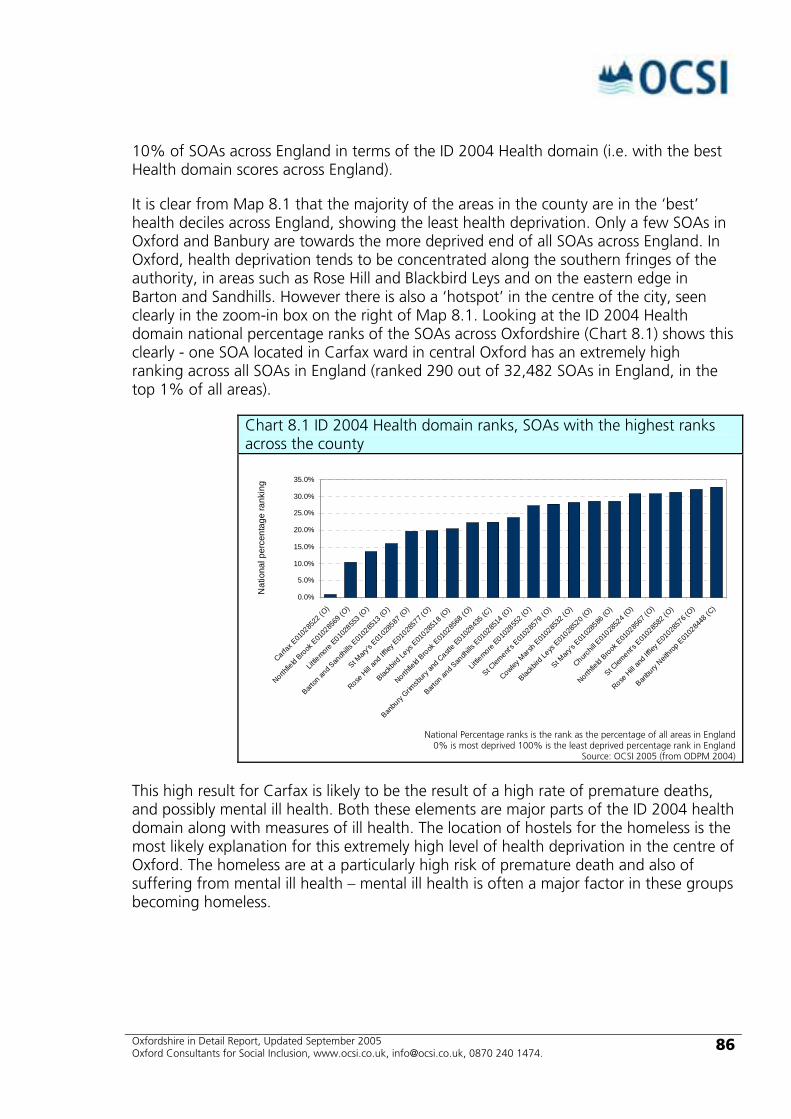
Oxfordshire in Detail Report, Updated September 2005 Oxford Consultants for Social Inclusion, www.ocsi.co.uk, [email protected], 0870 240 1474.
86
10% of SOAs across England in terms of the ID 2004 Health domain (i.e. with the best Health domain scores across England).
It is clear from Map 8.1 that the majority of the areas in the county are in the ‘best’ health deciles across England, showing the least health deprivation. Only a few SOAs in Oxford and Banbury are towards the more deprived end of all SOAs across England. In Oxford, health deprivation tends to be concentrated along the southern fringes of the authority, in areas such as Rose Hill and Blackbird Leys and on the eastern edge in Barton and Sandhills. However there is also a ‘hotspot’ in the centre of the city, seen clearly in the zoom-in box on the right of Map 8.1. Looking at the ID 2004 Health domain national percentage ranks of the SOAs across Oxfordshire (Chart 8.1) shows this clearly - one SOA located in Carfax ward in central Oxford has an extremely high ranking across all SOAs in England (ranked 290 out of 32,482 SOAs in England, in the top 1% of all areas).
Chart 8.1 ID 2004 Health domain ranks, SOAs with the highest ranks across the county
0.0%
5.0%
10.0%
15.0%
20.0%
25.0%
30.0%
35.0%
Carfax E
0102
8522
(O)
Northfie
ld Brook E
0102
8569
(O)
Little
more E010
2855
3 (O)
Barton
and S
andh
ills E
0102
8513
(O)
St Mary
's E01
0285
87 (O
)
Rose H
ill an
d Iffle
y E01
02857
7 (O)
Blackb
ird Le
ys E01
02851
8 (O)
Northfie
ld Brook E
0102
8568
(O)
Banbu
ry Grim
sbury
and C
astle E
01028
435 (
C)
Barton
and S
andh
ills E
0102
8514
(O)
Little
more E010
2855
2 (O)
St Clem
ent's E
0102
8579
(O)
Cowley M
arsh E
0102
8532
(O)
Blackb
ird Le
ys E01
02852
0 (O)
St Mary
's E01
0285
86 (O
)
Churchil
l E01
02852
4 (O)
Northfie
ld Brook E
0102
8567
(O)
St Clem
ent's E
0102
8582
(O)
Rose H
ill an
d Iffle
y E01
02857
6 (O)
Banbu
ry Neit
hrop E
0102
8448
(C)
Nat
iona
l per
cent
age
rank
ing
National Percentage ranks is the rank as the percentage of all areas in England
0% is most deprived 100% is the least deprived percentage rank in England Source: OCSI 2005 (from ODPM 2004)
This high result for Carfax is likely to be the result of a high rate of premature deaths, and possibly mental ill health. Both these elements are major parts of the ID 2004 health domain along with measures of ill health. The location of hostels for the homeless is the most likely explanation for this extremely high level of health deprivation in the centre of Oxford. The homeless are at a particularly high risk of premature death and also of suffering from mental ill health – mental ill health is often a major factor in these groups becoming homeless.

Oxfordshire in Detail Report, Updated September 2005 Oxford Consultants for Social Inclusion, www.ocsi.co.uk, [email protected], 0870 240 1474.
87
Map 8.1 Showing the Indices of Deprivation 2004 Health domain scores across the county, with rankings based on the distribution across England.
Source: OCSI 2005 (from ODPM 2004)

Oxfordshire in Detail Report, Updated September 2005 Oxford Consultants for Social Inclusion, www.ocsi.co.uk, [email protected], 0870 240 1474.
88
Map 8.2 Showing the Indices of Deprivation 2004 Health domain scores across the county, with rankings based on the distribution across the county.
Source: OCSI 2005 (from ODPM 2004)
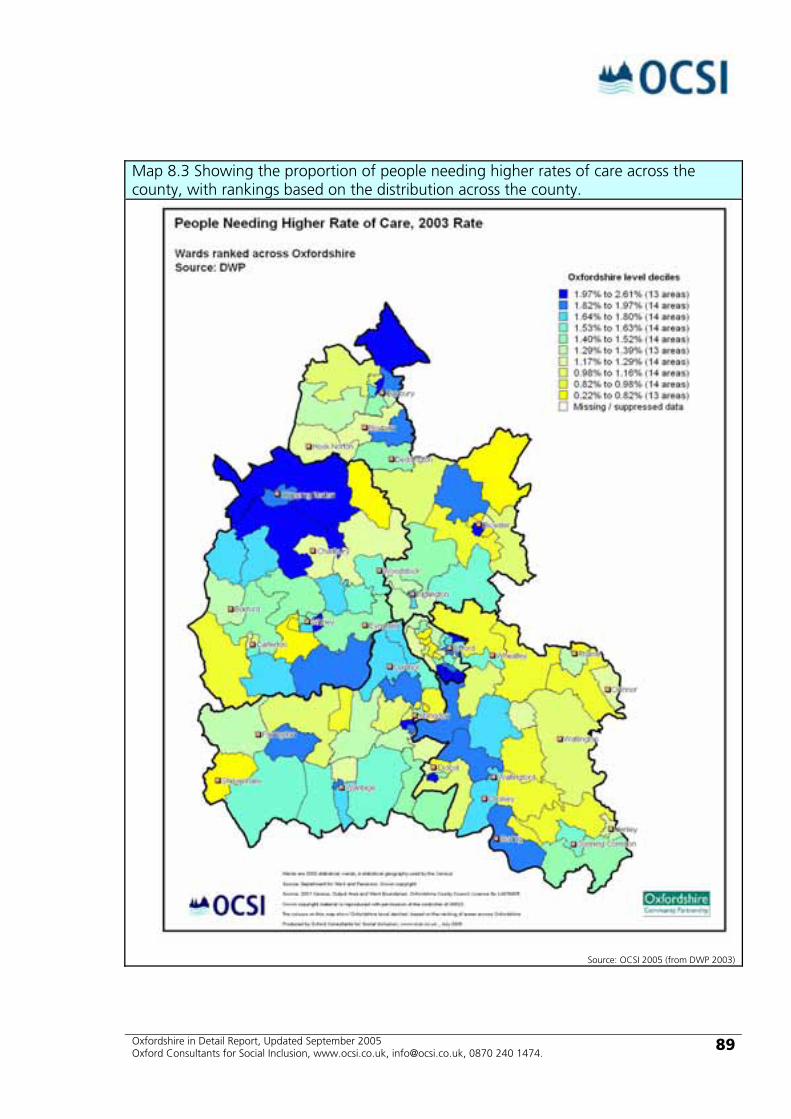
Oxfordshire in Detail Report, Updated September 2005 Oxford Consultants for Social Inclusion, www.ocsi.co.uk, [email protected], 0870 240 1474.
89
Map 8.3 Showing the proportion of people needing higher rates of care across the county, with rankings based on the distribution across the county.
Source: OCSI 2005 (from DWP 2003)

Oxfordshire in Detail Report, Updated September 2005 Oxford Consultants for Social Inclusion, www.ocsi.co.uk, [email protected], 0870 240 1474.
90
Map 8.4 Showing the proportion of people with limiting long-term illness across the county, with rankings based on the distribution across England.
Source: OCSI 2005 (from Census 2001)
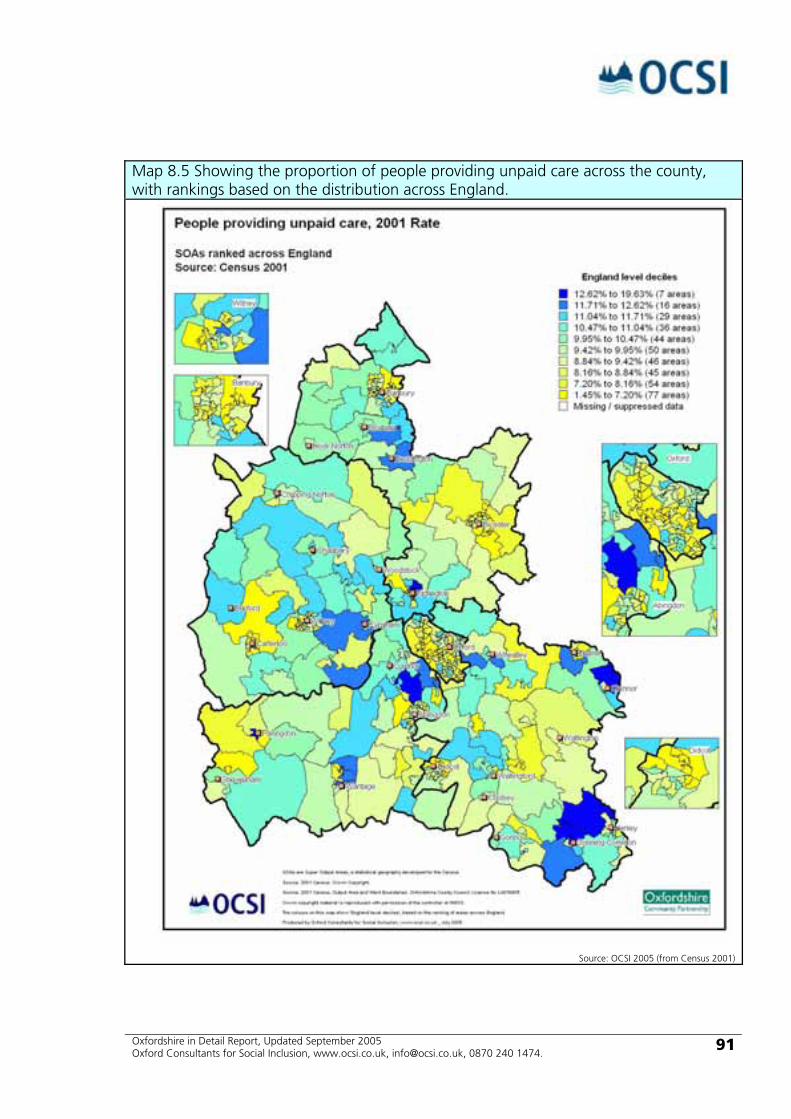
Oxfordshire in Detail Report, Updated September 2005 Oxford Consultants for Social Inclusion, www.ocsi.co.uk, [email protected], 0870 240 1474.
91
Map 8.5 Showing the proportion of people providing unpaid care across the county, with rankings based on the distribution across England.
Source: OCSI 2005 (from Census 2001)

Oxfordshire in Detail Report, Updated September 2005 Oxford Consultants for Social Inclusion, www.ocsi.co.uk, [email protected], 0870 240 1474.
92
Map 8.2 above shows the ID 2004 Health domain scores across the county at Census Super Output Area (SOA) level. By contrast with Map 8.1, the ten colour coded intervals represent deciles and are based on the distribution across the county. Therefore, those SOAs in Map 8.2 that are coloured the darkest shade of blue are in the ‘top’ 10% of SOAs across Oxfordshire in terms of the ID 2004 Health domain (i.e. with the poorest Health domain scores across the county), while the SOAs that are coloured in the lightest yellow are in the ‘bottom’ 10% of SOAs across Oxfordshire in terms of the ID 2004 Health domain (i.e. with the best Health domain scores across the county).
This allows us to analyse the pattern of health deprivation across Oxfordshire, where Map 8.1 allowed us to look at the county in the broader context of health deprivation across England. From Map 8.2 it is clear that large parts of the districts of Vale of White Horse, South Oxfordshire and West Oxfordshire have very healthy populations. Oxford has the greatest concentration of SOAs in the least healthy deciles (areas coloured dark blue), while towns across Cherwell – Bicester, Banbury and Kidlington - all have significant number of SOAs in the least healthy decile across Oxfordshire.
8.2 People in receipt of health benefits The number and proportion of people receiving either Attendance Allowance or Disability Living Allowance allows us to look at people in need of substantial levels of care. ‘People needing care’ are all those in receipt of Attendance Allowance or the Disability Living Allowance Care component, ‘people needing higher rate of care’ are all those in receipt of the Attendance Allowance Higher Rate or the Disability Living Allowance Higher Rate Care component, while ‘people needing mobility assistance’ are all those in receipt of the Disability Living Allowance Mobility component. For further details of these benefits, see Appendix A on data sources and descriptions.
Chart 8.2 Proportion of people needing care, Oxfordshire and districts
0.0%
1.0%
2.0%
3.0%
4.0%
5.0%
6.0%
Englan
d
South
East
Oxfords
hire
Cherwell
Oxford
South
Oxfords
hire
Vale of
White
Horse
West Oxfo
rdshir
e
2003
Pop
ulat
ion
Rat
e
Source: OCSI 2005 (from DWP 2003)
Chart 8.2 shows the proportion of people needing care across Oxfordshire and the districts, with the South-East and England values shown for comparison. It is clear that the county and the South-East are well below the England average. Out of the five

Oxfordshire in Detail Report, Updated September 2005 Oxford Consultants for Social Inclusion, www.ocsi.co.uk, [email protected], 0870 240 1474.
93
county districts, only Oxford has a higher proportion of people needing care than the South-East, but still significantly below the proportion across England as a whole.
Chart 8.3 shows the wards across Oxfordshire with the highest proportions of people needing care. Only ten of the 137 wards in the county have proportions higher than the England average, with five of these ten wards in Oxford, three in Cherwell (Bicester and Banbury), one in South Oxfordshire (Didcot) and one in Vale of the Whitehorse (Abingdon). The most deprived wards are more evenly distributed across the county’s district compared with other datasets with all districts containing a ward within the most deprived 20 in Oxfordshire.
Chart 8.3 Proportion of people needing care, wards with the highest proportions across the county
0.0%
1.0%
2.0%
3.0%
4.0%
5.0%
6.0%
7.0%
Englan
d
South
East
Oxfords
hire
Biceste
r Tow
n (C)
Little
more (O
)
Barton
and S
andh
ills (O
)
Blackb
ird Le
ys (O
)
Northfie
ld Brook (O
)
Didcot P
ark (S
O)
Abingd
on C
aldeco
tt (VW
H)
Rose H
ill an
d Iffle
y (O)
Banbu
ry Neit
hrop (C
)
Banbu
ry Rus
cote
(C)
Banbu
ry Grim
sbury
and C
astle (
C)
Witney
South
(WO)
Cowley (O
)
Chadlin
gton an
d Chu
rchill
(WO)
Churchil
l (O)
Sandfo
rd (S
O)
Wallingford
North (S
O)
Chipping
Norto
n (WO)
Bampto
n and
Clanfi
eld (W
O)
Abingd
on O
ck M
eadow
(VW
H)
2003
Pop
ulat
ion
Rat
e
Source: OCSI 2005 (from DWP 2003)
Chart 8.4 shows the proportion of people needing higher rate of care, i.e. people in receipt of Attendance Allowance Higher Rate or Disability Living Allowance Higher Rate Care component. This is a measure of severe health need. The overall proportion of people across Oxfordshire is 1.4%, below both the South-East (1.5%) and English (2.0%) averages. Eleven wards have proportions of people needing higher rate of care above the England average, with the wards that are highlighted similar to the wards with the highest proportions of people needing care (Chart 8.3 above). However Didcot Park (South Oxfordshire) has the highest proportion – 2.6% of people across Didcot Park require high levels of care.
Map 8.3 above shows the proportion of people needing higher rates of care across the county at ward level. The ten colour coded intervals represent deciles and are based on the distribution across the county. Therefore, those wards in Map 8.3 that are coloured the darkest shade of blue are in the ‘top’ 10% of wards across Oxfordshire in terms of the proportion of people needing higher rates of care (i.e. with the highest proportions of people needing higher rates of care across the county).

Oxfordshire in Detail Report, Updated September 2005 Oxford Consultants for Social Inclusion, www.ocsi.co.uk, [email protected], 0870 240 1474.
94
Map 8.3 shows the same features as Chart 8.3, with the majority of wards with the highest proportions of people needing higher rates of care based in Cherwell (Banbury and Bicester), Oxford (the south and east of the city wards such as Littlemore, Northfield Brook, Rosehill and Iffley and Barton and Sandhills), and South Oxfordshire (Sandford, and Didcot). There are additionally areas showing high proportions of people needing higher rates of care in Vale of White Horse (Abingdon) and West Oxfordshire (Kingham, Rollright and Enstone, Chadlington and Churchill and Witney).
8.3 Census indicators of health Map 8.4 above shows the distribution of people with limiting long-term illness across the county at Census Super Output Area (SOA) level. The ten colour coded intervals represent deciles and are based on the distribution across England. Therefore, those SOAs in Map 8.4 that are coloured the darkest shade of blue are in the ‘top’ 10% of SOAs across England in terms of the proportions of people with limiting long-term illness (i.e. with the highest proportions of people with limiting long-term illness across England).
It is clear that the proportion of people across the county with limiting long-term illness is very low compared to England as a whole – the majority of areas across Oxfordshire are in the most healthy deciles across England (coloured yellow on the map). Comparing Map 8.4 with Map 8.1 (the ID 2004 Health domain) shows a marked similarity – although based on different information sources , the measures are picking up on the common set of underlying health deprivation.
The major differences between the proportions of people with limiting long-term illness and the ID 2004 Health domain are seen in Oxford, with the rate of limiting long-term illness across Oxford low when contrasted with the ID 2004 Health domain (Map 8.1). A similar pattern is seen in both maps for the southern and eastern fringes of the city, where populations are at relatively greater risk. However, the main difference is in the centre of the city where all SOAs are in the least deprived deciles across England for the proportions of people with limiting long-term illness. This supports the conclusions above, that the high rates in Carfax for the ID 2004 Health domain discussed above are not due to general ill health, but due to the number of homeless hostels in the area.
A second difference between the proportions of people with limiting long-term illness and the ID 2004 Health domain is seen across the county, with many of the smaller towns such as Banbury, Bicester, Didcot and Witney having SOAs with relatively high proportions of people with limiting long-term illness, relative to the rest of the county. This is likely due to disabling ill health, for example through work practices. Such disabling ill health will not picked up by the ID 2004 Health domain as it is unlikely to increase the risk of premature death, but is picked up by the self-report Census 2001 questions such as limiting long-term illness.
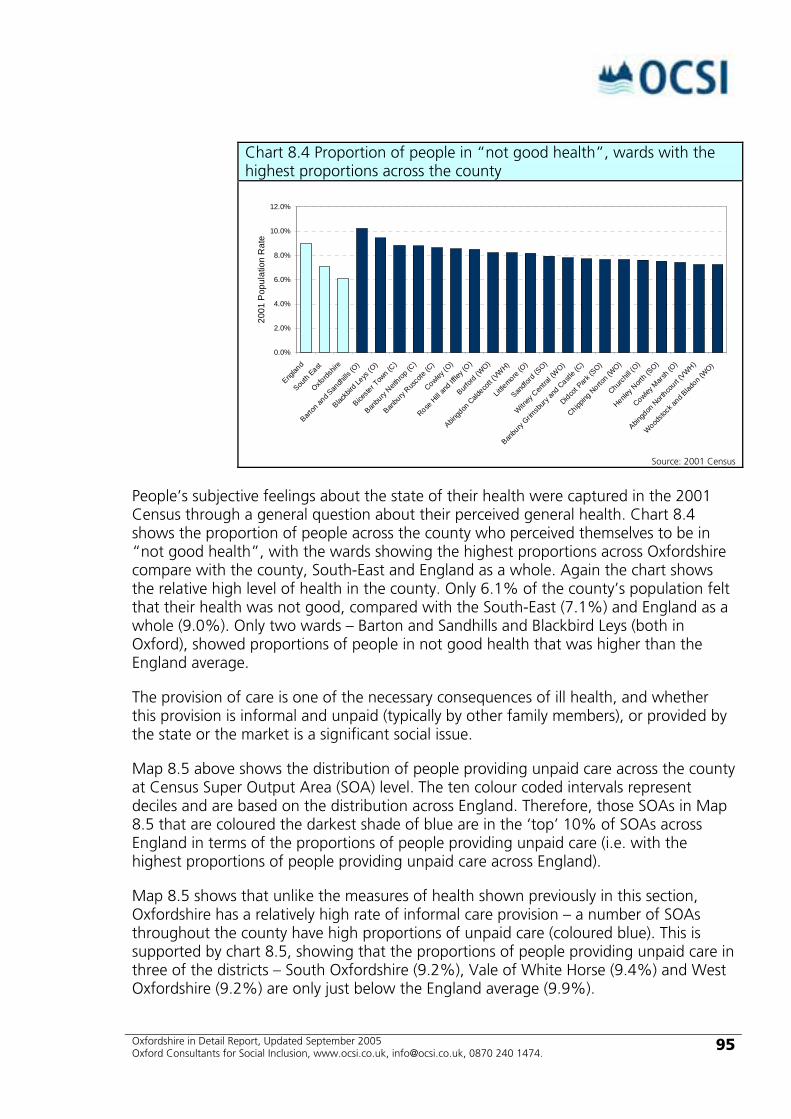
Oxfordshire in Detail Report, Updated September 2005 Oxford Consultants for Social Inclusion, www.ocsi.co.uk, [email protected], 0870 240 1474.
95
Chart 8.4 Proportion of people in “not good health”, wards with the highest proportions across the county
0.0%
2.0%
4.0%
6.0%
8.0%
10.0%
12.0%
Englan
d
South
East
Oxfords
hire
Barton
and S
andh
ills (O
)
Blackb
ird Le
ys (O
)
Biceste
r Tow
n (C)
Banbu
ry Neit
hrop (C
)
Banbu
ry Rus
cote
(C)
Cowley (O
)
Rose H
ill an
d Iffle
y (O)
Burford
(WO)
Abingd
on C
aldeco
tt (VW
H)
Little
more (O
)
Sandfo
rd (S
O)
Witney
Cen
tral (W
O)
Banbu
ry Grim
sbury
and C
astle (
C)
Didcot P
ark (S
O)
Chipping
Norto
n (WO)
Churchil
l (O)
Henley N
orth (
SO)
Cowley M
arsh (
O)
Abingd
on N
orthco
urt (VWH)
Woodsto
ck an
d Blad
on (WO)
2001
Pop
ulat
ion
Rat
e
Source: 2001 Census
People’s subjective feelings about the state of their health were captured in the 2001 Census through a general question about their perceived general health. Chart 8.4 shows the proportion of people across the county who perceived themselves to be in “not good health”, with the wards showing the highest proportions across Oxfordshire compare with the county, South-East and England as a whole. Again the chart shows the relative high level of health in the county. Only 6.1% of the county’s population felt that their health was not good, compared with the South-East (7.1%) and England as a whole (9.0%). Only two wards – Barton and Sandhills and Blackbird Leys (both in Oxford), showed proportions of people in not good health that was higher than the England average.
The provision of care is one of the necessary consequences of ill health, and whether this provision is informal and unpaid (typically by other family members), or provided by the state or the market is a significant social issue.
Map 8.5 above shows the distribution of people providing unpaid care across the county at Census Super Output Area (SOA) level. The ten colour coded intervals represent deciles and are based on the distribution across England. Therefore, those SOAs in Map 8.5 that are coloured the darkest shade of blue are in the ‘top’ 10% of SOAs across England in terms of the proportions of people providing unpaid care (i.e. with the highest proportions of people providing unpaid care across England).
Map 8.5 shows that unlike the measures of health shown previously in this section, Oxfordshire has a relatively high rate of informal care provision – a number of SOAs throughout the county have high proportions of unpaid care (coloured blue). This is supported by chart 8.5, showing that the proportions of people providing unpaid care in three of the districts – South Oxfordshire (9.2%), Vale of White Horse (9.4%) and West Oxfordshire (9.2%) are only just below the England average (9.9%).

Oxfordshire in Detail Report, Updated September 2005 Oxford Consultants for Social Inclusion, www.ocsi.co.uk, [email protected], 0870 240 1474.
96
Chart 8.5 Proportion of people providing unpaid care, Oxfordshire and districts
0.0%
2.0%
4.0%
6.0%
8.0%
10.0%
12.0%
14.0%
Englan
d
South
East
Oxfords
hire
Adderb
ury (C
)
Chiltern
Woo
ds (S
O)
Sonnin
g Com
mon (S
O)
Burford
(WO)
Hanney
s (VWH)
Sunnin
gwell
and W
ootton
(VW
H)
Wheatle
y (SO)
Eynsh
am an
d Cas
singto
n (W
O)
Chadlin
gton an
d Chu
rchill
(WO)
Kennin
gton a
nd S
outh
Hinkse
y (VWH)
Milton-un
der-W
ychw
ood (
WO)
Yarnton
, Gos
ford an
d Water E
aton (C
)
Garsing
ton (S
O)
North Leig
h (W
O)
Dedding
ton (C
)
Chinnor
(SO)
Shiplak
e (SO)
Cropred
y (C)
Craven (
VWH)
Applet
on an
d Cum
nor (
VWH)
2001
Pop
ulat
ion
Rat
e
Source: 2001 Census
The more urban areas of the county have the lowest proportions of unpaid care (Oxford has a rate of 7.8%, below the county average of 8.8%), despite them having the higher rate of ill health. This suggests a different attitude towards care between different communities across Oxfordshire. It may be that easier access to market and state provided care services in more urban areas encourages a greater reliance on them than in the more rural areas. Finally, because older people are typically in greater need of care, and it is often the case that a partner will provide a proportion of that care, the patterns seen in Map 8.5 may reflect a concentration of older people in the population.
8.4 Section summary Overall health in Oxfordshire is good compared to other areas of England. There are ‘hotspots’ of extreme health deprivation but these are relatively few compared to the majority of areas across the county. However most of the main urban conurbations across Oxfordshire have some areas of poor health associated with them.
The pattern of informal care has a quite different pattern. Oxfordshire, despite being a healthy county, has a relatively high proportion of its population providing informal care to family or neighbours.
Oxfordshire in Detail Report, Updated September 2005 Oxford Consultants for Social Inclusion, www.ocsi.co.uk, [email protected], 0870 240 1474.
97
Section 9 Education and skills
Oxfordshire England
Pupils eligible for free school meals87 7,753 (9.3%) 1,255,739 (16.3%) Pupils with 5 or more A*-C passes at GCSE88 3,181 (51.1%) 306,656 (52.0%) Pupils staying on at school89 14,590 (66.5%) 1,283,819 (67.6%) Full time students aged 18-7490 32,513 (7.5%) 1,543,512 (4.5%) Adults with no qualifications91 94,370 (21.2%) 10,251,674 (28.9)
Improving the level of education and skills present within a local population remains an important policy objective for both local and central government. The task of implementing initiatives to improve life-long learning and enhance individual development (and employability) represents a significant and essential challenge for local authorities.
Although there is no way to directly assess the diverse set of skills, knowledge and personal qualities possessed by the local population, several social and educational indicators provide insight into key educational characteristics. Educational measures have traditionally focused on school level data, and in particular the performance of young people on designated examinations, an emphasis reflecting the priority given to school results by policymakers, employers and society in general.
A fuller picture of education and skills within a local area, however, requires an analysis that takes into account social background, levels of attainment among young people as well as the qualifications held by the adult population. Such an analysis has become progressively easier for government analysts, researchers and educationalists through larger and improved data collection procedures. School level information, along with individual level data from the 2001 UK Population Census and the newly developed Pupil Level Annual Schools Census (see the Background: Pupil Level Annual Schools Census (PLASC) box), provides a variety of educational indicators that are available at the small area level.
Background: Pupil Level Annual Schools Census (PLASC) The recently developed Pupil Level Annual School Census (PLASC), first taken by the DfES in 2002, collects individual level information for all pupils in maintained schools on an annual census date in January. PLASC replaces the Annual Schools Census, which collected school level aggregate data, with individual level data that can be aggregated to a variety of different area levels such as wards. This means that pupil characteristics can be attributed to pupils’ residential areas and not merely to the schools they attend. The DfES are in the process of releasing information such as the number and proportion of pupils eligible for Free School Meals (FSM), and Key Stage attainment information. This information has been aggregated from PLASC and presented at the ward level.
The PLASC data presented in this section is provided by the Department for Education and Skills, from the January 2004 School Census.
Oxfordshire in Detail Report, Updated September 2005 Oxford Consultants for Social Inclusion, www.ocsi.co.uk, [email protected], 0870 240 1474.
98
9.1 Educational disadvantage The role of social background in education constitutes a longstanding concern in both policy and research, and there is strong evidence to suggest that at every stage of the educational process, social disadvantage (and the associated availability of resources) influences a child’s success in school and future life chances. Educational disadvantage may broadly be defined to include any aspect of the social, family or educational environment that limits the educational opportunities of children and reduces the likelihood that they will benefit from the education they receive. This includes both those children from disadvantaged backgrounds who may face many ‘barriers to learning’ as a result of living on low incomes, as well as those with learning disorders or other special educational needs.
Background: Pupils Eligible for Free School Meals The most commonly used indicator of pupil disadvantage is his or her eligibility for Free School Meals (FSM). Eligibility for FSM serves as a useful measure of disadvantage because its eligibility reflects Income Support directly, and it is collected annually as part of the statutory reporting process for maintained schools. While the FSM indicator is the most straightforward (and in some cases only) available measure of pupil socio-economic status, it identifies only a small sector of the population (approximately 16% of the maintained school pupils across England are eligible for FSM) and therefore provides limited insight into the social backgrounds of the majority of pupils. Nevertheless, eligibility for FSM is a significant predictor of educational attainment and figures highly in funding allocation formulas.
Because the eligibility rates take into account only pupils in maintained schools, the pupil FSM rates across an area may overestimate pupil disadvantage, particularly in areas that have significant numbers of children attending independent schools.
The proportion of pupils eligible for free school meals in maintained primary, middle and secondary schools broadly reflects other area-based measures of children living in low income households. See the Background: Pupils Eligible for Free School Meals box above for details.
Although Oxfordshire as a whole has well below the England average of FSM pupils (9.2% compared with 16.2%), there are significant differences between the districts.
Chart 9.1 shows the proportion of pupils eligible for FSM, across the county and five districts, with the South-East and England averages for comparison. It is clear that Oxfordshire county, and four of the five districts have proportions well below the England and South-East averages. By contrast, Oxford has a much higher rate (19.4%) than other districts in the county, the South-East and England as a whole, with nearly one in five pupils across Oxford eligible for Free School Meals. This shows similarities with the children living in low income households results from Section 7, with Oxford again having much higher proportions that the other Oxfordshire districts, and the South-East and England.

Oxfordshire in Detail Report, Updated September 2005 Oxford Consultants for Social Inclusion, www.ocsi.co.uk, [email protected], 0870 240 1474.
99
Chart 9.1 Proportion of pupils eligible for Free School Meals, Oxfordshire and districts
0.0%
5.0%
10.0%
15.0%
20.0%
25.0%
Englan
d
South
East
Oxfords
hire
Cherwell
Oxford
South
Oxfords
hire
Vale of
White
Horse
West Oxfo
rdshir
e
2004
Pop
ulat
ion
Rat
e
Source: OCSI 2005 (from DfES PLASC 2004)
Chart 9.2 shows the wards across Oxfordshire with the highest proportions of pupils eligible for FSM. In six of the wards, all in Oxford, more than one in four pupils are eligible for FSM. A further six wards have rates higher than one in five pupils eligible for FSM. Of the twenty wards across Oxfordshire, 15 are in Oxford, with two in Banbury (Cherwell), one in Bicester (Cherwell) and one in Abingdon (Vale of White Horse) and one in Didcot (South Oxfordshire). However, as discussed in the Background: Pupils Eligible for Free School Meals box above, the proportions of disadvantaged pupils may be overestimated in areas where high proportions of pupils attend independent schools, for example Summertown ward may be affected by this.
Chart 9.2 Proportion of pupils eligible for Free School Meals, wards with highest proportions across the county
0.0%
5.0%
10.0%
15.0%
20.0%
25.0%
30.0%
35.0%
Englan
d
South
East
Oxfords
hire
Carfax (
O)
Northfie
ld Brook (O
)
Blackb
ird Le
ys (O
)
Rose H
ill an
d Iffle
y (O)
Barton
and S
andh
ills (O
)
Iffley
Fields
(O)
Banbu
ry Rus
cote
(C)
Churchil
l (O)
Cowley M
arsh (
O)
Abingd
on C
aldeco
tt (VW
H)
St Mary
's (O)
St Clem
ent's (
O)
Cowley (O
)
Little
more (O
)
Banbu
ry Neit
hrop (C
)
Jeric
ho and
Osn
ey (O
)
Biceste
r Tow
n (C)
Lye V
alley (
O)
Summert
own (O
)
Didcot A
ll Saints
(SO)
2004
Pop
ulat
ion
Rat
e
Source: OCSI 2005 (from DfES PLASC 2004)

Oxfordshire in Detail Report, Updated September 2005 Oxford Consultants for Social Inclusion, www.ocsi.co.uk, [email protected], 0870 240 1474.
100
The overall picture is of Oxfordshire having a low proportion of pupils eligible for FSM, but with a number of (mostly urban) wards with high proportions of schoolchildren from disadvantaged backgrounds.
9.2 Pupil exam performance The most often cited educational indicators refer to the performance of pupils in compulsory education on Key Stage examinations 2, 3, and 4 (Key Stage 4 is GCSE). While overall performance levels at all Key Stages have improved nationally in recent years, there remains a wide gap between the top and bottom performing schools, and particularly between schools in the maintained and independent sectors. Individual Key Stage performance results contained within the National Pupil Database (NPD) may be directly linked to the pupil background data in PLASC, allowing, for the first time, area level performance estimates based upon the areas where pupils live rather than just the schools they attend.
Educational attainment in maintained schools strongly reflects pupil disadvantage, and regional and school level disparities often depend upon the social compositions of different areas or schools. These differences are apparent in the school league tables produced annually, and are also readily discernible in comparisons of pupils’ residential areas when scores are aggregated to ward level in PLASC.
Chart 9.3 Proportion of pupils achieving 5 or more A*-C GCSE passes, Oxfordshire and Districts
0.0%
10.0%
20.0%
30.0%
40.0%
50.0%
60.0%
70.0%
Englan
d
South
East
Oxfords
hire
Cherwell
Oxford
South
Oxfords
hire
Vale of
White
Horse
West Oxfo
rdshir
e
2004
Pop
ulat
ion
Rat
e
Source: OCSI 2005 (from DfES PLASC 2004)
Chart 9.3 shows the proportion of pupils obtaining 5 or more GCSE levels grade A*-C, across Oxfordshire and the five districts with the South-East and England proportion shown for reference. Overall, the pupils living in Oxfordshire and attending maintained schools in 2004 performed slightly worse on average than their counterparts nationwide at GCSE-level and the county was well below the average across the South-East (51.1% achieved 5 or more A*-C GCSE passes in the county, compared with 55.2% across the region), and pupils in some areas (most notably Oxford) attained significantly lower attainment level (39% achieved 5 or more A*-C GCSE passes in Oxford).
Oxfordshire in Detail Report, Updated September 2005 Oxford Consultants for Social Inclusion, www.ocsi.co.uk, [email protected], 0870 240 1474.
101
Chart 9.4 shows the wards across Oxfordshire with the lowest proportions of pupils achieving 5 or more A*-C GCSE passes 1. In the five wards with the lowest proportions – Banbury Neithrop and Banbury Ruscote (Cherwell), Barton and Sandhills, Blackbird Leys and Northfield Brook (Oxford) – less than one in five pupils achieves five or more A*-C GCSE passes. Of the twenty wards shown, ten are in Oxford, four in Banbury, one in Bicester (both towns are in Cherwell district), two in South Oxfordshire district (Berinsfield and Forest Hill and Holton), and three in Vale of White Horse district (Abingdon, Drayton and Sutton Courtney).
It is clear that areas of low educational achievement are distributed throughout the county, tending to be centred on urban areas.
1 Holywell and Carfax wards in Oxford are not shown, as no pupils were registered for Key Stage 4 exams in the PLASC 2003 dataset.
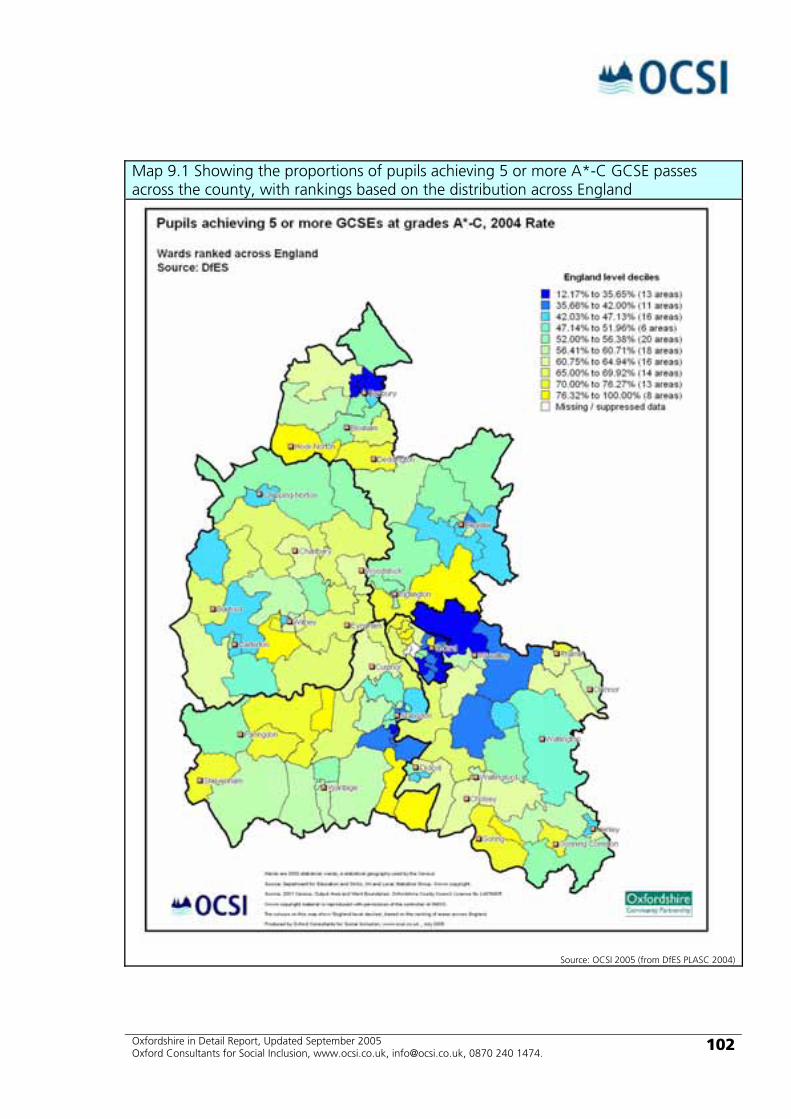
Oxfordshire in Detail Report, Updated September 2005 Oxford Consultants for Social Inclusion, www.ocsi.co.uk, [email protected], 0870 240 1474.
102
Map 9.1 Showing the proportions of pupils achieving 5 or more A*-C GCSE passes across the county, with rankings based on the distribution across England
Source: OCSI 2005 (from DfES PLASC 2004)
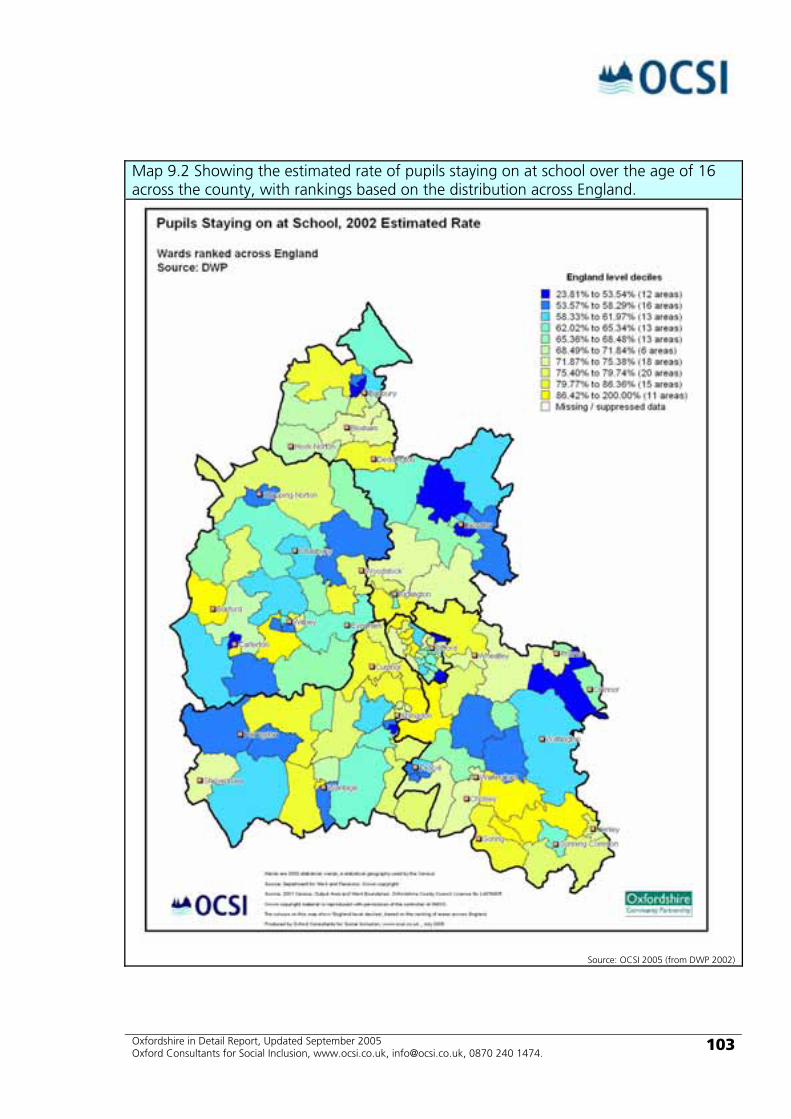
Oxfordshire in Detail Report, Updated September 2005 Oxford Consultants for Social Inclusion, www.ocsi.co.uk, [email protected], 0870 240 1474.
103
Map 9.2 Showing the estimated rate of pupils staying on at school over the age of 16 across the county, with rankings based on the distribution across England.
Source: OCSI 2005 (from DWP 2002)
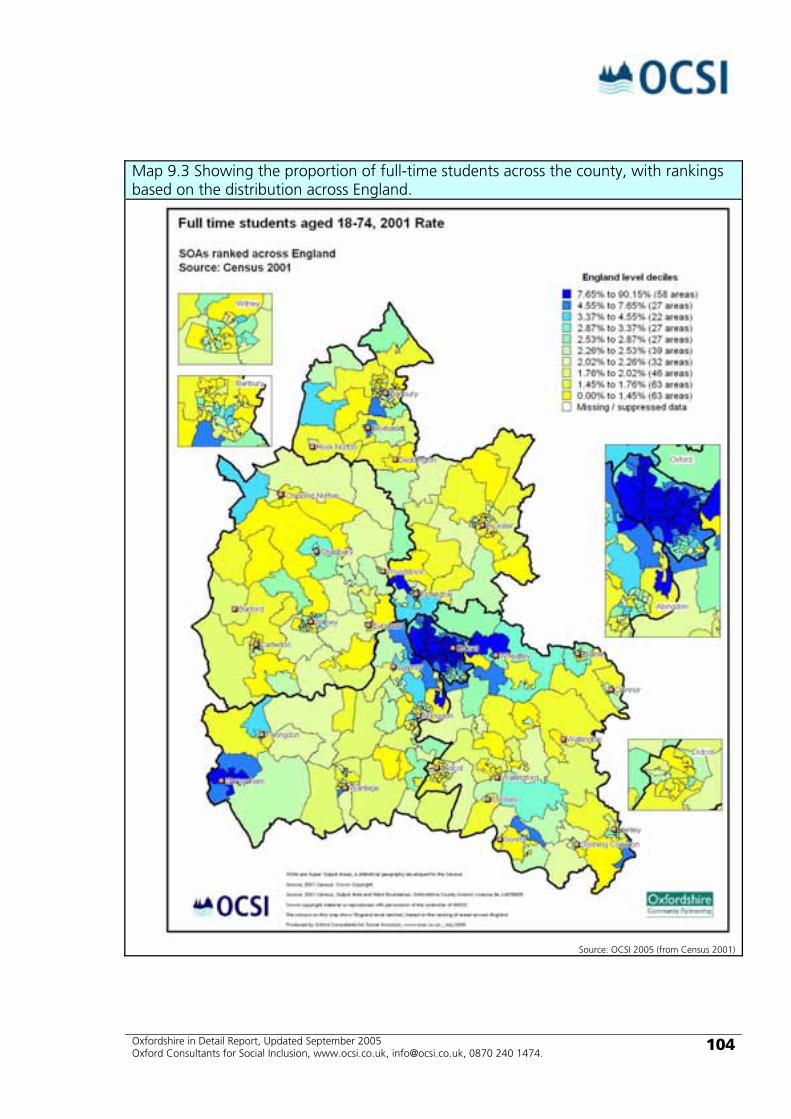
Oxfordshire in Detail Report, Updated September 2005 Oxford Consultants for Social Inclusion, www.ocsi.co.uk, [email protected], 0870 240 1474.
104
Map 9.3 Showing the proportion of full-time students across the county, with rankings based on the distribution across England.
Source: OCSI 2005 (from Census 2001)
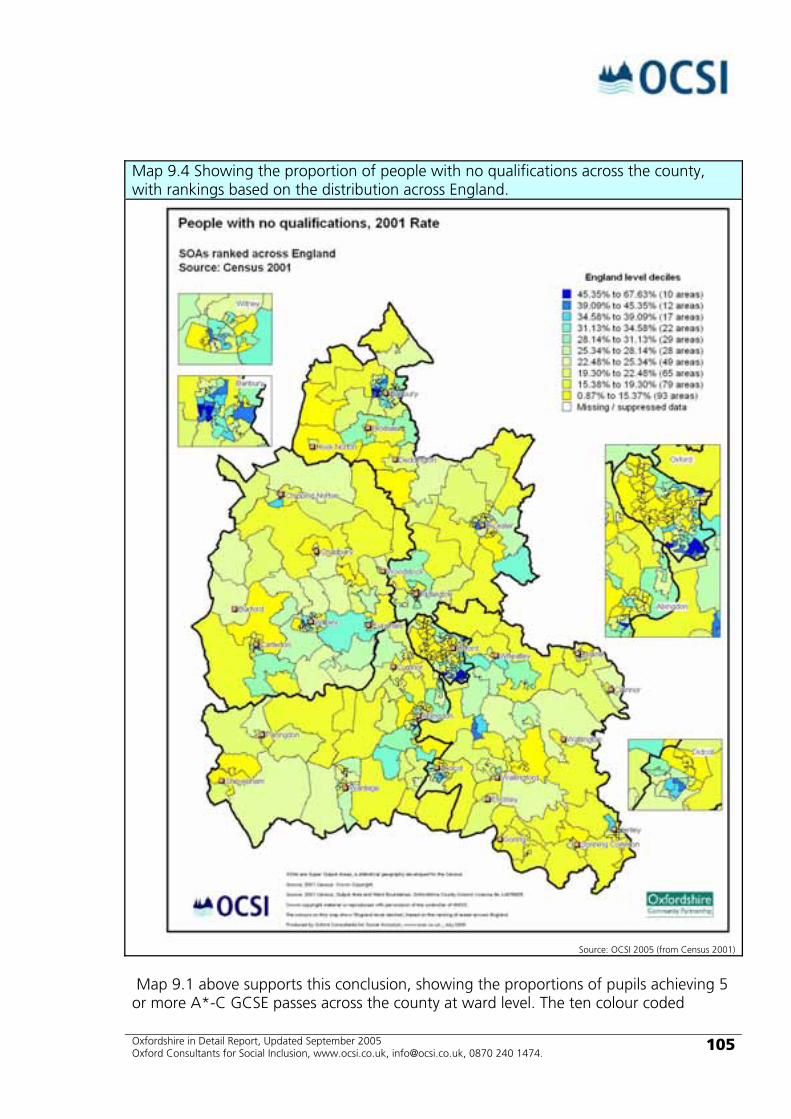
Oxfordshire in Detail Report, Updated September 2005 Oxford Consultants for Social Inclusion, www.ocsi.co.uk, [email protected], 0870 240 1474.
105
Map 9.4 Showing the proportion of people with no qualifications across the county, with rankings based on the distribution across England.
Source: OCSI 2005 (from Census 2001)
Map 9.1 above supports this conclusion, showing the proportions of pupils achieving 5 or more A*-C GCSE passes across the county at ward level. The ten colour coded
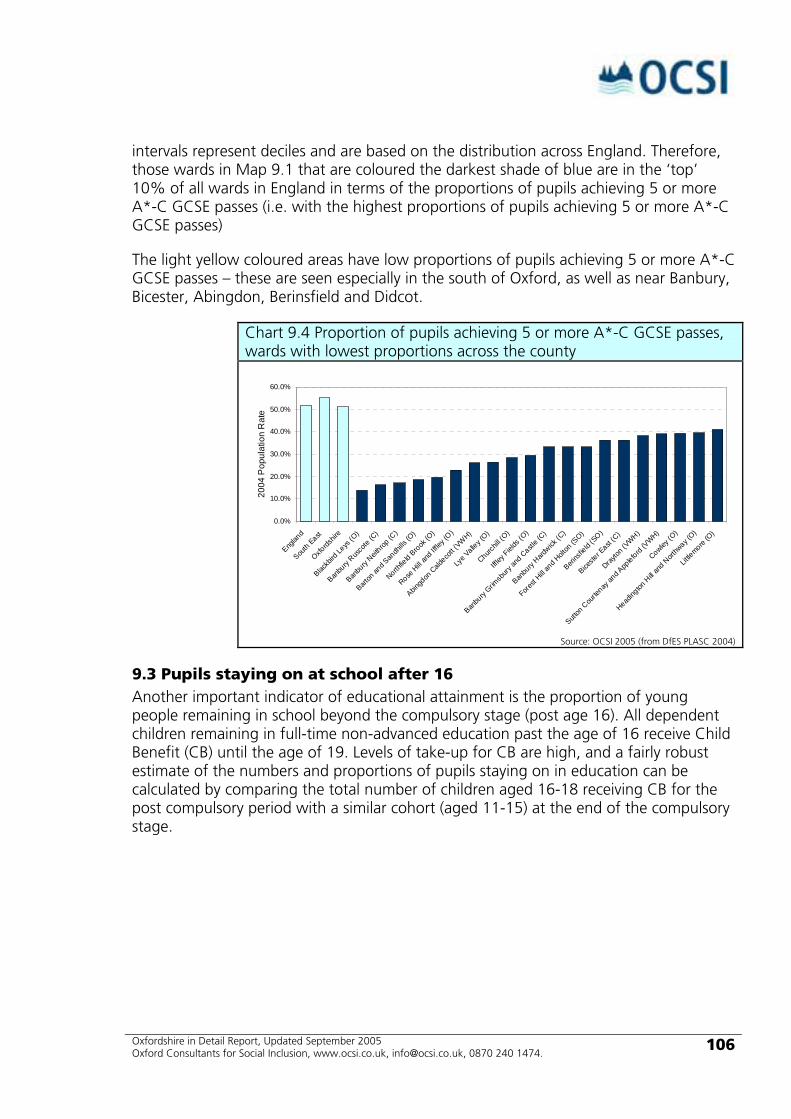
Oxfordshire in Detail Report, Updated September 2005 Oxford Consultants for Social Inclusion, www.ocsi.co.uk, [email protected], 0870 240 1474.
106
intervals represent deciles and are based on the distribution across England. Therefore, those wards in Map 9.1 that are coloured the darkest shade of blue are in the ‘top’ 10% of all wards in England in terms of the proportions of pupils achieving 5 or more A*-C GCSE passes (i.e. with the highest proportions of pupils achieving 5 or more A*-C GCSE passes)
The light yellow coloured areas have low proportions of pupils achieving 5 or more A*-C GCSE passes – these are seen especially in the south of Oxford, as well as near Banbury, Bicester, Abingdon, Berinsfield and Didcot.
Chart 9.4 Proportion of pupils achieving 5 or more A*-C GCSE passes, wards with lowest proportions across the county
0.0%
10.0%
20.0%
30.0%
40.0%
50.0%
60.0%
Englan
d
South
East
Oxfords
hire
Blackb
ird Le
ys (O
)
Banbu
ry Rus
cote
(C)
Banbu
ry Neit
hrop (C
)
Barton
and S
andh
ills (O
)
Northfie
ld Brook (O
)
Rose H
ill an
d Iffle
y (O)
Abingd
on C
aldeco
tt (VW
H)
Lye V
alley (
O)
Churchil
l (O)
Iffley
Fields
(O)
Banbu
ry Grim
sbury
and C
astle (
C)
Banbu
ry Hard
wick (C
)
Forest
Hill and H
olton
(SO)
Berins
field
(SO)
Biceste
r East
(C)
Drayton
(VWH)
Sutton
Cou
rtenay
and A
ppleford
(VWH)
Cowley (O
)
Heading
ton H
ill and
Nort
hway (
O)
Little
more (O
)
2004
Pop
ulat
ion
Rat
e
Source: OCSI 2005 (from DfES PLASC 2004)
9.3 Pupils staying on at school after 16 Another important indicator of educational attainment is the proportion of young people remaining in school beyond the compulsory stage (post age 16). All dependent children remaining in full-time non-advanced education past the age of 16 receive Child Benefit (CB) until the age of 19. Levels of take-up for CB are high, and a fairly robust estimate of the numbers and proportions of pupils staying on in education can be calculated by comparing the total number of children aged 16-18 receiving CB for the post compulsory period with a similar cohort (aged 11-15) at the end of the compulsory stage.
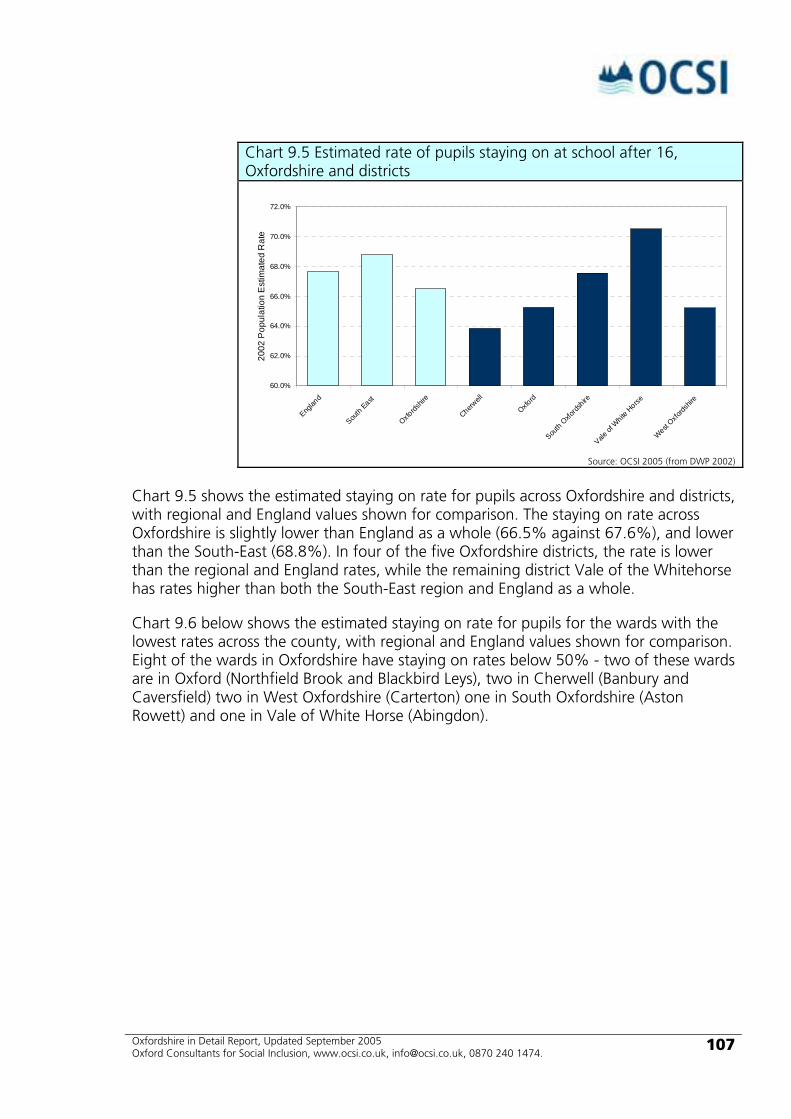
Oxfordshire in Detail Report, Updated September 2005 Oxford Consultants for Social Inclusion, www.ocsi.co.uk, [email protected], 0870 240 1474.
107
Chart 9.5 Estimated rate of pupils staying on at school after 16, Oxfordshire and districts
60.0%
62.0%
64.0%
66.0%
68.0%
70.0%
72.0%
Englan
d
South
East
Oxfords
hire
Cherwell
Oxford
South
Oxfords
hire
Vale of
White
Horse
West Oxfo
rdshir
e
2002
Pop
ulat
ion
Est
imat
ed R
ate
Source: OCSI 2005 (from DWP 2002)
Chart 9.5 shows the estimated staying on rate for pupils across Oxfordshire and districts, with regional and England values shown for comparison. The staying on rate across Oxfordshire is slightly lower than England as a whole (66.5% against 67.6%), and lower than the South-East (68.8%). In four of the five Oxfordshire districts, the rate is lower than the regional and England rates, while the remaining district Vale of the Whitehorse has rates higher than both the South-East region and England as a whole.
Chart 9.6 below shows the estimated staying on rate for pupils for the wards with the lowest rates across the county, with regional and England values shown for comparison. Eight of the wards in Oxfordshire have staying on rates below 50% - two of these wards are in Oxford (Northfield Brook and Blackbird Leys), two in Cherwell (Banbury and Caversfield) two in West Oxfordshire (Carterton) one in South Oxfordshire (Aston Rowett) and one in Vale of White Horse (Abingdon).

Oxfordshire in Detail Report, Updated September 2005 Oxford Consultants for Social Inclusion, www.ocsi.co.uk, [email protected], 0870 240 1474.
108
Chart 9.6 Estimated rate of pupils staying on at school after 16, wards with the lowest proportions across the county
0.0%
10.0%
20.0%
30.0%
40.0%
50.0%
60.0%
70.0%
80.0%
Englan
d
South
East
Oxfords
hire
Northfie
ld Brook (O
)
Banbu
ry Neit
hrop (C
)
Blackb
ird Le
ys (O
)
Abingd
on C
aldeco
tt (VW
H)
Caversf
ield (
C)
Aston R
owant (S
O)
Carterto
n North
Wes
t (WO)
Carterto
n North
East (W
O)
Biceste
r South
(C)
Barton
and S
andh
ills (O
)
Banbu
ry Rus
cote
(C)
Biceste
r Tow
n (C)
Laun
ton (C
)
Didcot N
orthb
ourne (
SO)
Didcot A
ll Saints
(SO)
Witney
Wes
t (WO)
Banbu
ry Hard
wick (C
)
Berins
field
(SO)
Witney
South
(WO)
Didcot P
ark (S
O)
2002
Pop
ulat
ion
Est
imat
ed R
ate
Source: OCSI 2005 (from DWP 2002)
Map 9.2 above shows the estimated staying on rate for pupils across the county at ward level. The ten colour coded intervals represent deciles and are based on the distribution across England. Therefore, those wards in Map 9.2 that are coloured the darkest shade of blue are in the ‘top’ 10% of all wards in England in terms of the staying on rate (i.e. with the highest proportions of pupils staying on after the age of 16).
The light yellow coloured areas have low proportions of pupils staying on at school – these are seen especially in the south of Oxford, as well as near Banbury, Bicester, and Didcot.
9.4 Full-time students Those young people electing to remain in post-compulsory education or adults seeking to obtain qualifications as full-time students can also be identified at the local area level. The decennial snapshot provided by the Census provides additional small area level information on the numbers of people in full time education. Because the Census counts most university students (as well as international students) at term time addresses, the Census does not provide an accurate indicator of rates of entry into further education in different areas. However we can investigate the distribution of full-time students at small area level.
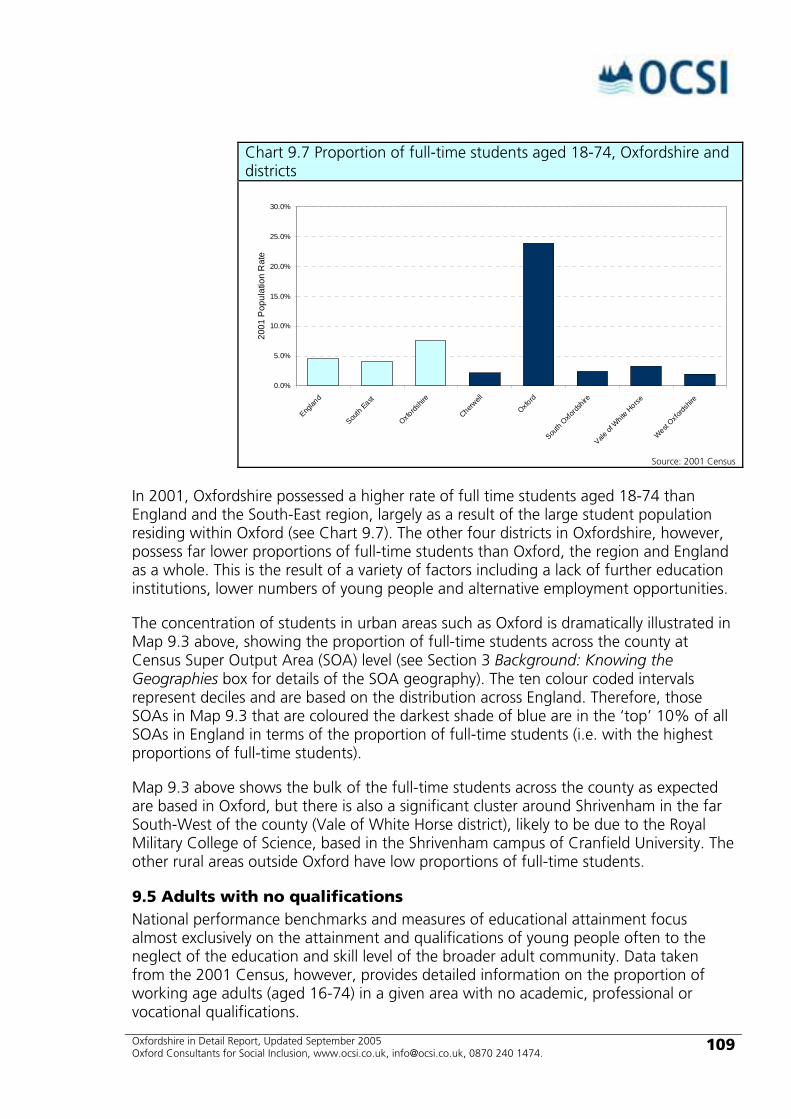
Oxfordshire in Detail Report, Updated September 2005 Oxford Consultants for Social Inclusion, www.ocsi.co.uk, [email protected], 0870 240 1474.
109
Chart 9.7 Proportion of full-time students aged 18-74, Oxfordshire and districts
0.0%
5.0%
10.0%
15.0%
20.0%
25.0%
30.0%
Englan
d
South
East
Oxfords
hire
Cherwell
Oxford
South
Oxfords
hire
Vale of
White
Horse
West Oxfo
rdshir
e
2001
Pop
ulat
ion
Rat
e
Source: 2001 Census
In 2001, Oxfordshire possessed a higher rate of full time students aged 18-74 than England and the South-East region, largely as a result of the large student population residing within Oxford (see Chart 9.7). The other four districts in Oxfordshire, however, possess far lower proportions of full-time students than Oxford, the region and England as a whole. This is the result of a variety of factors including a lack of further education institutions, lower numbers of young people and alternative employment opportunities.
The concentration of students in urban areas such as Oxford is dramatically illustrated in Map 9.3 above, showing the proportion of full-time students across the county at Census Super Output Area (SOA) level (see Section 3 Background: Knowing the Geographies box for details of the SOA geography). The ten colour coded intervals represent deciles and are based on the distribution across England. Therefore, those SOAs in Map 9.3 that are coloured the darkest shade of blue are in the ‘top’ 10% of all SOAs in England in terms of the proportion of full-time students (i.e. with the highest proportions of full-time students).
Map 9.3 above shows the bulk of the full-time students across the county as expected are based in Oxford, but there is also a significant cluster around Shrivenham in the far South-West of the county (Vale of White Horse district), likely to be due to the Royal Military College of Science, based in the Shrivenham campus of Cranfield University. The other rural areas outside Oxford have low proportions of full-time students.
9.5 Adults with no qualifications National performance benchmarks and measures of educational attainment focus almost exclusively on the attainment and qualifications of young people often to the neglect of the education and skill level of the broader adult community. Data taken from the 2001 Census, however, provides detailed information on the proportion of working age adults (aged 16-74) in a given area with no academic, professional or vocational qualifications.

Oxfordshire in Detail Report, Updated September 2005 Oxford Consultants for Social Inclusion, www.ocsi.co.uk, [email protected], 0870 240 1474.
110
Chart 9.8 Proportion of adults with no qualifications, Oxfordshire and districts
0.0%
5.0%
10.0%
15.0%
20.0%
25.0%
30.0%
35.0%
Englan
d
South
East
Oxfords
hire
Cherwell
Oxford
South
Oxfords
hire
Vale of
White
Horse
West Oxfo
rdshir
e
2001
Pop
ulat
ion
Rat
e
Source: 2001 Census
Chart 9.8 shows the proportion of adults with no qualifications across Oxfordshire and the five districts, with the England and South-East values shown for comparison. All five districts have smaller proportions of adults without qualifications than the England average, and only Cherwell has a higher proportion than the South-East region. Oxford has significantly the lowest proportion (18.6%) of the five districts.
Chart 9.9 shows the proportion of adults with no qualifications for Oxfordshire compared with a number of selected areas. Oxfordshire has the lowest proportion of such adults of all the comparison areas, with the exception of the city of Cambridge.

Oxfordshire in Detail Report, Updated September 2005 Oxford Consultants for Social Inclusion, www.ocsi.co.uk, [email protected], 0870 240 1474.
111
Chart 9.9 Proportion of adults with no qualifications, Oxfordshire and selected comparison areas
0.0%
5.0%
10.0%
15.0%
20.0%
25.0%
30.0%
35.0%
Englan
d
South
East
Oxfords
hire
Swindon
West Berk
shire
Reading
Milton Key
nes
Buckin
gham
shire
Cambridge
shire
Cambridge
Devon
Dorset
Glouce
stersh
ire
Hampshire
Northam
ptons
hire
North York
shire
Somers
et
Suffolk
Warwick
shire
Wiltshir
e
2001
Pop
ulat
ion
Rat
e
Source: 2001 Census
Chart 9.10 shows the proportion of adults with no qualifications for the wards with the highest rates across the county. It is clear that although the county as a whole has low levels of adults with no qualifications, at ward level several areas have rates well above the England and South-East averages. In Blackbird Leys and Banbury Ruscote wards more than two in five adults have no qualifications, and in a further four wards (Banbury Neithrop, Abingdon Caldecott, Witney Central and Barton and Sandhills) more than one in three adults similarly have no qualifications. However, only 17 of the 137 wards in the county have proportions of adults with no qualifications above the England average.
Chart 9.10 Proportion of adults with no qualifications, wards with the highest proportions across the county
0.0%
5.0%
10.0%
15.0%
20.0%
25.0%
30.0%
35.0%
40.0%
45.0%
50.0%
Englan
d
South
East
Oxfords
hire
Blackb
ird Le
ys (O
)
Banbu
ry Rus
cote
(C)
Banbu
ry Neit
hrop (C
)
Abingd
on C
aldeco
tt (VW
H)
Witney
Cen
tral (W
O)
Barton
and S
andh
ills (O
)
Biceste
r Tow
n (C)
Rose H
ill an
d Iffle
y (O)
Didcot P
ark (S
O)
Northfie
ld Brook (O
)
Little
more (O
)
Cowley (O
)
Laun
ton (C
)
Berins
field
(SO)
Kidling
ton S
outh
(C)
Banbu
ry Eas
ington (
C)
Drayton
(VWH)
Didcot A
ll Saints
(SO)
Banbu
ry Hard
wick (C
)
Radley (
VWH)
2001
Pop
ulat
ion
Rat
e
Source: 2001 Census
Oxfordshire in Detail Report, Updated September 2005 Oxford Consultants for Social Inclusion, www.ocsi.co.uk, [email protected], 0870 240 1474.
112
Map 9.4 above shows the proportion of adults with no qualifications across the county at SOA level. The ten colour coded intervals represent deciles and are based on the distribution across England. Therefore, those SOAs in Map 9.4 that are coloured the darkest shade of blue are in the ‘top’ 10% of all SOAs in England in terms of the proportion of adults with no qualifications (i.e. with the highest proportion of adults with no qualifications in England). Clearly across the county most areas have relatively low proportions of adults with no qualifications compared to England as a whole (these areas are coloured yellow), although as identified in Chart 9.10, there are some areas with relatively high proportions, concentrated mainly in Banbury, and the south of Oxford. Other small pockets of such areas also show up in Witney, Abingdon, Didcot and Berinsfield.
9.6 Section summary One clear conclusion to be drawn from the above figures for Oxfordshire is that the relatively high rates of full-time students and low numbers of adults with no qualifications (consistently better than England and South-East levels) do not seem to be adequately reflected in the pupil performance levels on Key Stage exams (where the rates of pupils with 5 or more A*-C passes at GCSE level is roughly equal to the England average). Two factors are likely to contribute to this. First, the influx of large numbers of students and highly qualified adults into the county (primarily into Oxford). Second, the exam results for school children across Oxfordshire attending independent schools are not available for analysis in the same way as for the state-maintained primary, middle and secondary schools. The pupil performance figures for Oxfordshire are therefore likely to under-estimate the true figure for all children living in the county.
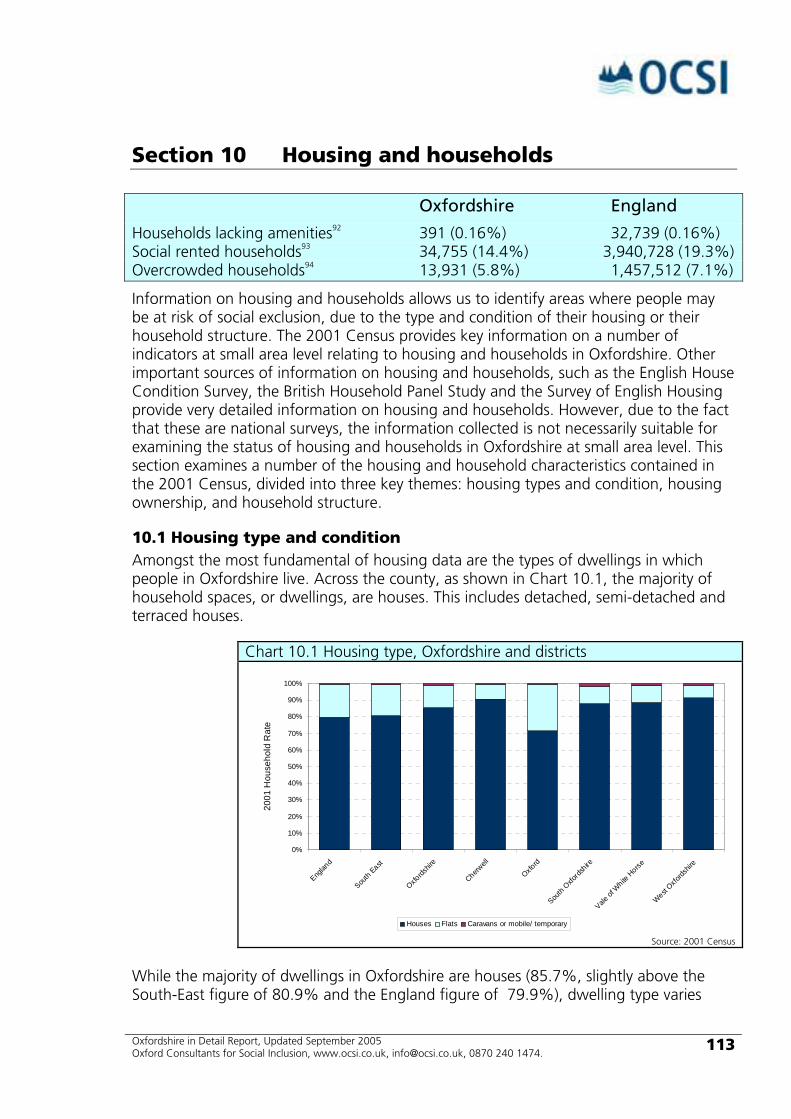
Oxfordshire in Detail Report, Updated September 2005 Oxford Consultants for Social Inclusion, www.ocsi.co.uk, [email protected], 0870 240 1474.
113
Section 10 Housing and households
Oxfordshire England
Households lacking amenities92 391 (0.16%) 32,739 (0.16%) Social rented households93 34,755 (14.4%) 3,940,728 (19.3%) Overcrowded households94 13,931 (5.8%) 1,457,512 (7.1%)
Information on housing and households allows us to identify areas where people may be at risk of social exclusion, due to the type and condition of their housing or their household structure. The 2001 Census provides key information on a number of indicators at small area level relating to housing and households in Oxfordshire. Other important sources of information on housing and households, such as the English House Condition Survey, the British Household Panel Study and the Survey of English Housing provide very detailed information on housing and households. However, due to the fact that these are national surveys, the information collected is not necessarily suitable for examining the status of housing and households in Oxfordshire at small area level. This section examines a number of the housing and household characteristics contained in the 2001 Census, divided into three key themes: housing types and condition, housing ownership, and household structure.
10.1 Housing type and condition Amongst the most fundamental of housing data are the types of dwellings in which people in Oxfordshire live. Across the county, as shown in Chart 10.1, the majority of household spaces, or dwellings, are houses. This includes detached, semi-detached and terraced houses.
Chart 10.1 Housing type, Oxfordshire and districts
0%
10%
20%
30%
40%
50%
60%
70%
80%
90%
100%
Englan
d
South
East
Oxfords
hire
Cherwell
Oxford
South
Oxfords
hire
Vale of
White
Horse
West Oxfo
rdshir
e
2001
Hou
seho
ld R
ate
Houses Flats Caravans or mobile/ temporary
Source: 2001 Census
While the majority of dwellings in Oxfordshire are houses (85.7%, slightly above the South-East figure of 80.9% and the England figure of 79.9%), dwelling type varies
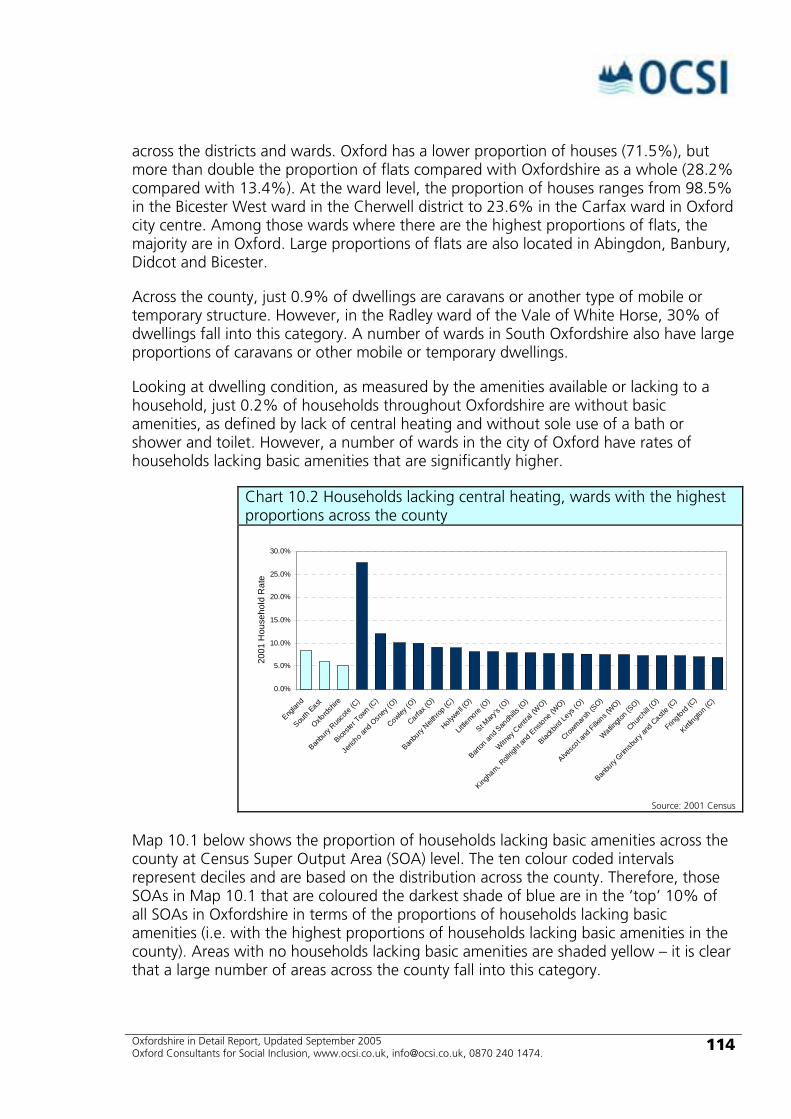
Oxfordshire in Detail Report, Updated September 2005 Oxford Consultants for Social Inclusion, www.ocsi.co.uk, [email protected], 0870 240 1474.
114
across the districts and wards. Oxford has a lower proportion of houses (71.5%), but more than double the proportion of flats compared with Oxfordshire as a whole (28.2% compared with 13.4%). At the ward level, the proportion of houses ranges from 98.5% in the Bicester West ward in the Cherwell district to 23.6% in the Carfax ward in Oxford city centre. Among those wards where there are the highest proportions of flats, the majority are in Oxford. Large proportions of flats are also located in Abingdon, Banbury, Didcot and Bicester.
Across the county, just 0.9% of dwellings are caravans or another type of mobile or temporary structure. However, in the Radley ward of the Vale of White Horse, 30% of dwellings fall into this category. A number of wards in South Oxfordshire also have large proportions of caravans or other mobile or temporary dwellings.
Looking at dwelling condition, as measured by the amenities available or lacking to a household, just 0.2% of households throughout Oxfordshire are without basic amenities, as defined by lack of central heating and without sole use of a bath or shower and toilet. However, a number of wards in the city of Oxford have rates of households lacking basic amenities that are significantly higher.
Chart 10.2 Households lacking central heating, wards with the highest proportions across the county
0.0%
5.0%
10.0%
15.0%
20.0%
25.0%
30.0%
Englan
d
South
East
Oxfords
hire
Banbu
ry Rus
cote
(C)
Biceste
r Tow
n (C)
Jeric
ho and
Osn
ey (O
)
Cowley (O
)
Carfax (
O)
Banbu
ry Neit
hrop (C
)
Holywell (
O)
Little
more (O
)
St Mary
's (O)
Barton
and S
andh
ills (O
)
Witney
Cen
tral (W
O)
Kingha
m, Roll
right a
nd Ens
tone (W
O)
Blackb
ird Le
ys (O
)
Crowmars
h (SO)
Alvesc
ot and
Filkins (
WO)
Watlingto
n (SO)
Churchil
l (O)
Banbu
ry Grim
sbury
and C
astle (
C)
Fringford
(C)
Kirtlingto
n (C)
2001
Hou
seho
ld R
ate
Source: 2001 Census
Map 10.1 below shows the proportion of households lacking basic amenities across the county at Census Super Output Area (SOA) level. The ten colour coded intervals represent deciles and are based on the distribution across the county. Therefore, those SOAs in Map 10.1 that are coloured the darkest shade of blue are in the ‘top’ 10% of all SOAs in Oxfordshire in terms of the proportions of households lacking basic amenities (i.e. with the highest proportions of households lacking basic amenities in the county). Areas with no households lacking basic amenities are shaded yellow – it is clear that a large number of areas across the county fall into this category.

Oxfordshire in Detail Report, Updated September 2005 Oxford Consultants for Social Inclusion, www.ocsi.co.uk, [email protected], 0870 240 1474.
115
Map 10.1 shows that those areas with the highest proportions of households lacking these amenities are concentrated mainly in the city of Oxford. There are also a couple of areas in Banbury with households lacking basic amenities, as well as scattered rural areas throughout the county.
Whilst a lack of sole use of a bath or shower and toilet is indicative of housing deprivation, this situation is not very common in Oxfordshire. The majority of wards in the county (59.1%) have five or fewer dwellings for which this is the situation. Those wards in the county that have the largest numbers of dwellings (more than 100) without sole use of a bath or shower and toilet are Carfax, St Margaret’s and St Mary’s, all in the city of Oxford. These areas have large numbers of students, and households are more likely, by design, not to have access to these amenities. A lack of central heating, however, is a more common problem that often leads to difficulty in heating one’s home and / or a larger level of expenditure on less efficient sources or methods of heat.
Chart 10.2 shows the proportion of households lacking central heating for the twenty wards with the highest rates across the county. Half of the twenty wards are located in Oxford, but the remainder are found throughout the county, with wards in all five of the districts in the county.
In the ward with the highest proportion of households lacking central heating across Oxfordshire – Banbury Ruscote – more than one in every four households is without central heating, more than three times the average across England and five times the average across the county.

Oxfordshire in Detail Report, Updated September 2005 Oxford Consultants for Social Inclusion, www.ocsi.co.uk, [email protected], 0870 240 1474.
116
Map 10.1 Showing the proportion of households lacking basic amenities (lack of central heating and without sole use of bath/shower and toilet) across the county, with rankings based on the distribution across the county.
Source: OCSI 2005 (from Census 2001)
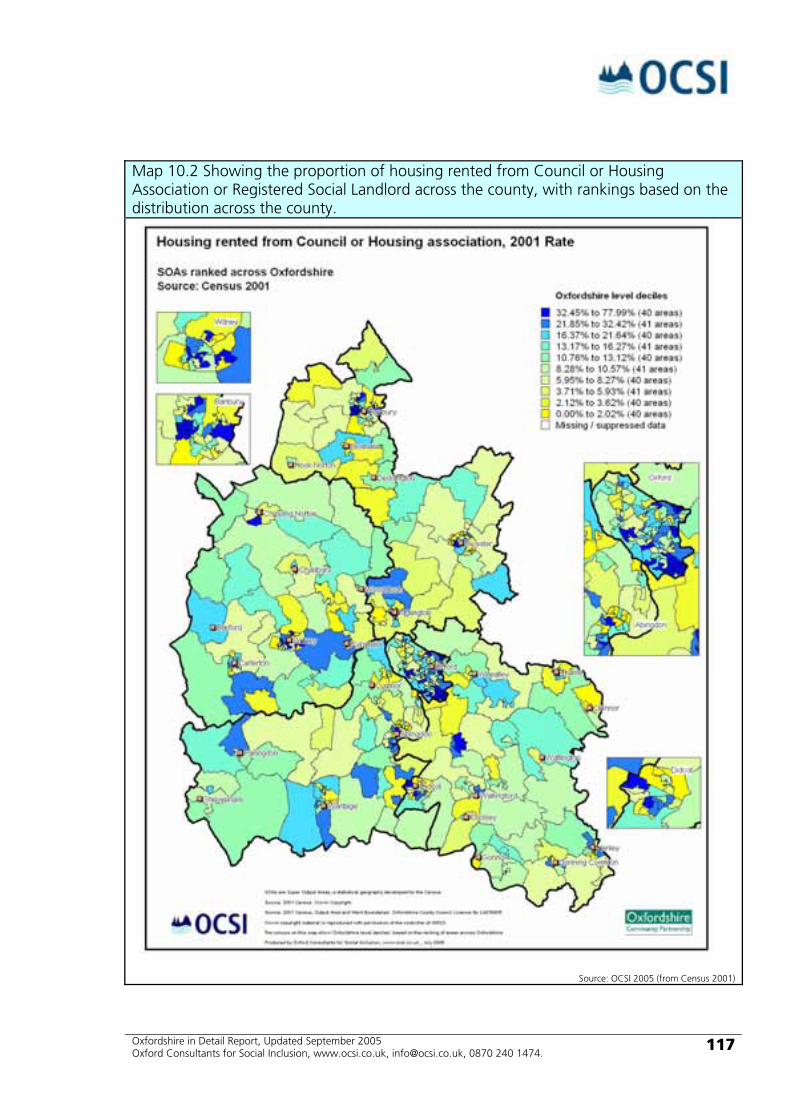
Oxfordshire in Detail Report, Updated September 2005 Oxford Consultants for Social Inclusion, www.ocsi.co.uk, [email protected], 0870 240 1474.
117
Map 10.2 Showing the proportion of housing rented from Council or Housing Association or Registered Social Landlord across the county, with rankings based on the distribution across the county.
Source: OCSI 2005 (from Census 2001)
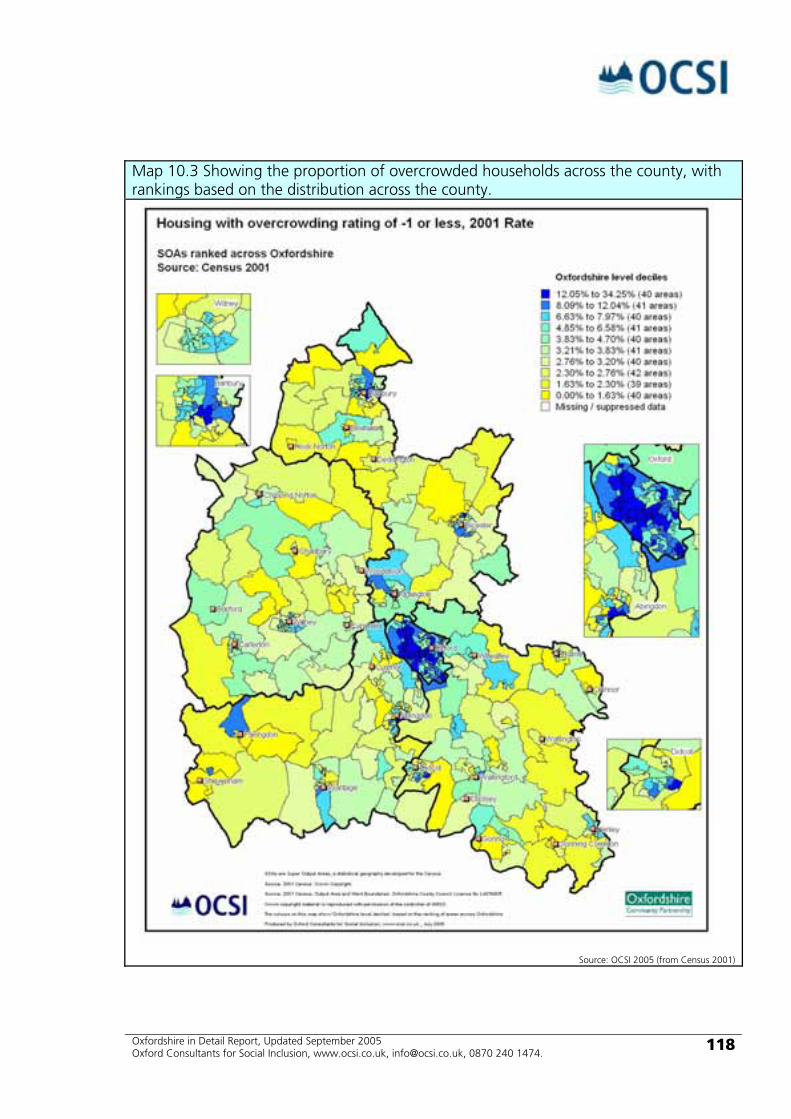
Oxfordshire in Detail Report, Updated September 2005 Oxford Consultants for Social Inclusion, www.ocsi.co.uk, [email protected], 0870 240 1474.
118
Map 10.3 Showing the proportion of overcrowded households across the county, with rankings based on the distribution across the county.
Source: OCSI 2005 (from Census 2001)
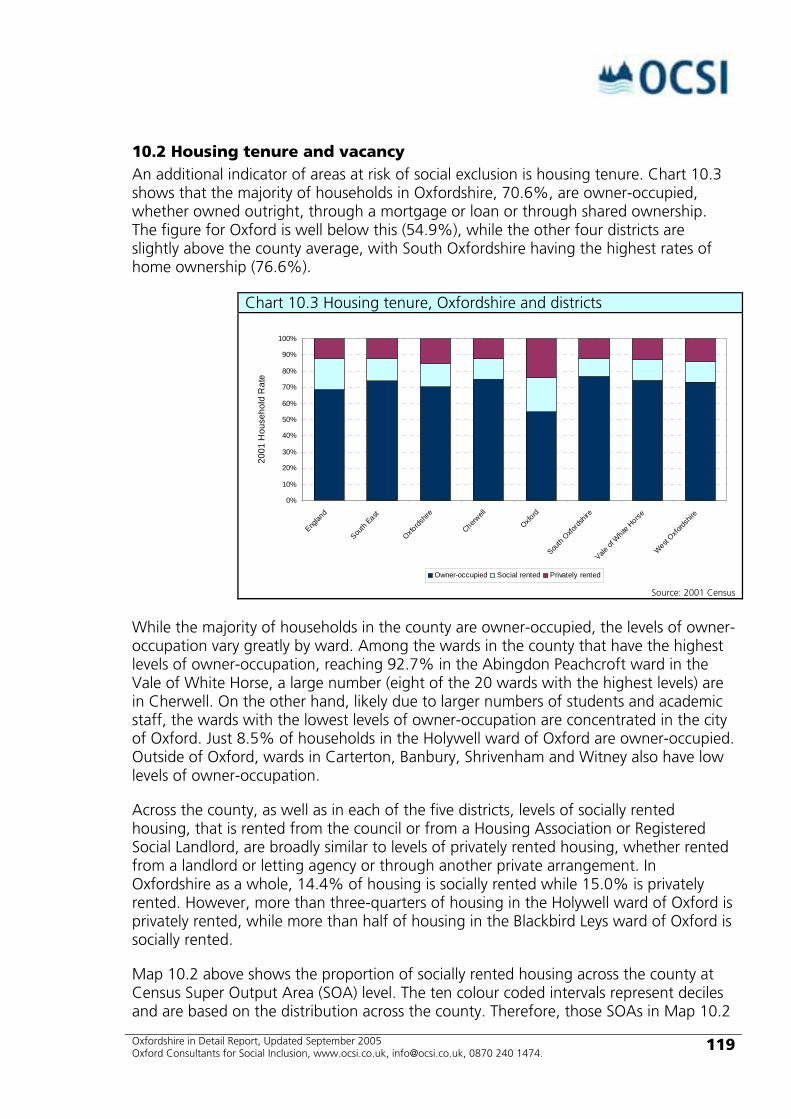
Oxfordshire in Detail Report, Updated September 2005 Oxford Consultants for Social Inclusion, www.ocsi.co.uk, [email protected], 0870 240 1474.
119
10.2 Housing tenure and vacancy An additional indicator of areas at risk of social exclusion is housing tenure. Chart 10.3 shows that the majority of households in Oxfordshire, 70.6%, are owner-occupied, whether owned outright, through a mortgage or loan or through shared ownership. The figure for Oxford is well below this (54.9%), while the other four districts are slightly above the county average, with South Oxfordshire having the highest rates of home ownership (76.6%).
Chart 10.3 Housing tenure, Oxfordshire and districts
0%
10%
20%
30%
40%
50%
60%
70%
80%
90%
100%
Englan
d
South
East
Oxfords
hire
Cherwell
Oxford
South
Oxfords
hire
Vale of
White
Horse
West Oxfo
rdshir
e
2001
Hou
seho
ld R
ate
Owner-occupied Social rented Privately rented
Source: 2001 Census
While the majority of households in the county are owner-occupied, the levels of owner-occupation vary greatly by ward. Among the wards in the county that have the highest levels of owner-occupation, reaching 92.7% in the Abingdon Peachcroft ward in the Vale of White Horse, a large number (eight of the 20 wards with the highest levels) are in Cherwell. On the other hand, likely due to larger numbers of students and academic staff, the wards with the lowest levels of owner-occupation are concentrated in the city of Oxford. Just 8.5% of households in the Holywell ward of Oxford are owner-occupied. Outside of Oxford, wards in Carterton, Banbury, Shrivenham and Witney also have low levels of owner-occupation.
Across the county, as well as in each of the five districts, levels of socially rented housing, that is rented from the council or from a Housing Association or Registered Social Landlord, are broadly similar to levels of privately rented housing, whether rented from a landlord or letting agency or through another private arrangement. In Oxfordshire as a whole, 14.4% of housing is socially rented while 15.0% is privately rented. However, more than three-quarters of housing in the Holywell ward of Oxford is privately rented, while more than half of housing in the Blackbird Leys ward of Oxford is socially rented.
Map 10.2 above shows the proportion of socially rented housing across the county at Census Super Output Area (SOA) level. The ten colour coded intervals represent deciles and are based on the distribution across the county. Therefore, those SOAs in Map 10.2

Oxfordshire in Detail Report, Updated September 2005 Oxford Consultants for Social Inclusion, www.ocsi.co.uk, [email protected], 0870 240 1474.
120
that are coloured the darkest shade of blue are in the ‘top’ 10% of all SOAs in Oxfordshire in terms of the proportions of socially rented housing (i.e. with the highest proportions of socially rented housing in the county).
Map 10.2 shows that high levels of socially rented housing are concentrated in the city of Oxford as well as in many of the county’s larger towns, including Banbury, Witney, Didcot, Abingdon and Bicester.
Looking from tenure patterns across the county to vacancy levels, it is clear that those wards with the highest levels of vacancy are outside the city of Oxford. The 20 wards in Oxfordshire that have the highest levels of vacant properties are shown in Chart 10.4 below (those dwellings that are second residences or holiday homes are not counted as vacant). Only three of the twenty wards are in Oxford, with high proportions of vacant households concentrated in many of the more rural wards. In the ward with the highest proportions of vacancy across the county – Carterton North East – more than one in four of every households is vacant.
Chart 10.2 Proportion of vacant housing (not including second residences or holiday homes), wards with the highest proportions across the county
0%
5%
10%
15%
20%
25%
Englan
d
South
East
Oxfords
hire
Carterto
n North
East
Ambrosd
en an
d Che
sterto
nCarfa
x
Caversf
ield
Chadlin
gton an
d Chu
rchill
Crowmars
h
Kingha
m, Roll
right a
nd Ens
tone
Carterto
n Sou
th
Benso
n
Marcha
m and Ship
pon
Banbu
ry Grim
sbury
and C
astle
Burford
Brize N
orton
and Shil
ton
Sonnin
g Com
mon
Chiltern
Woo
ds
Shiplak
e
Holywell
Goring
The B
arton
sNorth
2001
Hou
seho
ld R
ate
Source: 2001 Census
10.3 Household composition In addition to housing type and tenure, household composition is important in identifying areas with high levels of households that may be at risk of social exclusion, such as single pensioners living alone, lone parent households, or overcrowded households.
The proportion of households in Oxfordshire composed of a single pensioner living alone is 12.9%, compared with 14.4% across both England and the South-East. As shown in Chart 10.5, however, the proportion of households consisting of a pensioner living alone is only just below one in four in the Burford ward of West Oxfordshire and Henley North ward in South Oxfordshire. Those households composed of a single person

Oxfordshire in Detail Report, Updated September 2005 Oxford Consultants for Social Inclusion, www.ocsi.co.uk, [email protected], 0870 240 1474.
121
living alone of any age are most common in the Holywell ward in the city of Oxford, where such households comprise 61.1% of all households.
Chart 10.5 Proportion of single pensioner households, wards with the highest proportions across the county
0%
5%
10%
15%
20%
25%
30%
Englan
d
South
East
Oxfords
hire
Burford
Henley N
orth
Heading
ton
Woodsto
ck an
d Blad
on
Biceste
r Tow
n
Milton-un
der-W
ychw
ood
Ascott
and Ship
ton
Henley S
outh
North H
inkse
y and
Wyth
am
Witney
South
Didcot P
ark
Banbu
ry Eas
ington
Goring
Heading
ton H
ill and
Nort
hway
Quarry
and R
isingh
urst
Wolverco
te
Summert
own
Wantage
Cha
rlton
Chipping
Norto
n
Cowley
2001
Hou
seho
ld R
ate
Source: 2001 Census
Chart 10.6 shows the proportion of all student households, for the wards with the highest proportions across the county. In the two wards with the highest proportion of all student households – St Clements and St Mary’s, both in Oxford – more than one in seven households consists of only students. As might be expected, the majority of wards with high proportions of all student households are in Oxford – 19 out of the top twenty. The only exception is Shrivenham, which contains the Royal Military College of Science, based in the Shrivenham campus of Cranfield University. The proportion of all student households across the county is 0.82%, more than double the proportions across the South-East (0.35%) and England (0.39%) .
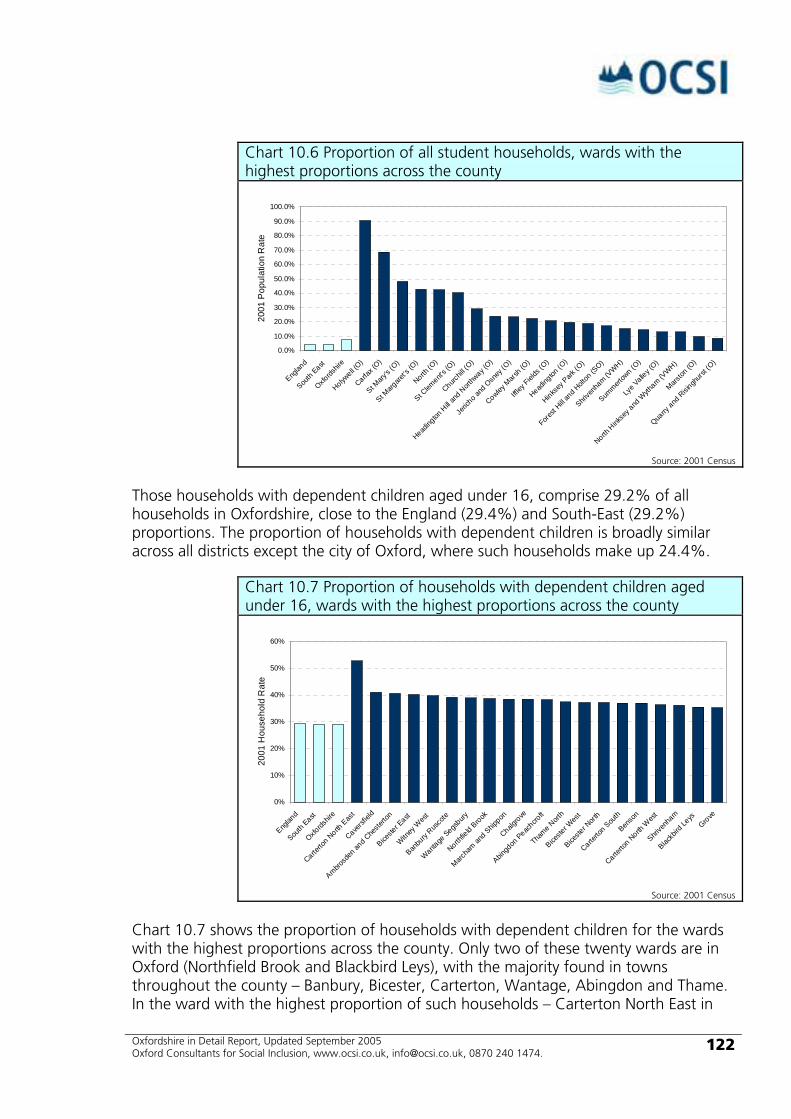
Oxfordshire in Detail Report, Updated September 2005 Oxford Consultants for Social Inclusion, www.ocsi.co.uk, [email protected], 0870 240 1474.
122
Chart 10.6 Proportion of all student households, wards with the highest proportions across the county
0.0%
10.0%
20.0%
30.0%
40.0%
50.0%
60.0%
70.0%
80.0%
90.0%
100.0%
Englan
d
South
East
Oxfords
hire
Holywell (
O)
Carfax (
O)
St Mary
's (O)
St Marg
aret's
(O)
North (O
)
St Clem
ent's (
O)
Churchil
l (O)
Heading
ton H
ill and
Nort
hway (
O)
Jeric
ho and
Osn
ey (O
)
Cowley M
arsh (
O)
Iffley
Fields
(O)
Heading
ton (O
)
Hinksey
Park
(O)
Forest
Hill and H
olton
(SO)
Shrive
nham (V
WH)
Summert
own (O
)
Lye V
alley (
O)
North H
inkse
y and
Wyth
am (VWH)
Marston
(O)
Quarry
and R
isingh
urst (O
)
2001
Pop
ulat
ion
Rat
e
Source: 2001 Census
Those households with dependent children aged under 16, comprise 29.2% of all households in Oxfordshire, close to the England (29.4%) and South-East (29.2%) proportions. The proportion of households with dependent children is broadly similar across all districts except the city of Oxford, where such households make up 24.4%.
Chart 10.7 Proportion of households with dependent children aged under 16, wards with the highest proportions across the county
0%
10%
20%
30%
40%
50%
60%
Englan
d
South
East
Oxfords
hire
Carterto
n North
East
Caversf
ield
Ambrosd
en an
d Che
sterto
n
Biceste
r East
Witney
Wes
t
Banbu
ry Rus
cote
Wantage
Segsbury
Northfie
ld Brook
Marcha
m and Ship
pon
Chalgrove
Abingd
on Peac
hcroft
Thame N
orth
Biceste
r Wes
t
Biceste
r Nort
h
Carterto
n Sou
th
Benso
n
Carterto
n North
Wes
t
Shrive
nham
Blackb
ird Le
ysGrove
2001
Hou
seho
ld R
ate
Source: 2001 Census
Chart 10.7 shows the proportion of households with dependent children for the wards with the highest proportions across the county. Only two of these twenty wards are in Oxford (Northfield Brook and Blackbird Leys), with the majority found in towns throughout the county – Banbury, Bicester, Carterton, Wantage, Abingdon and Thame. In the ward with the highest proportion of such households – Carterton North East in
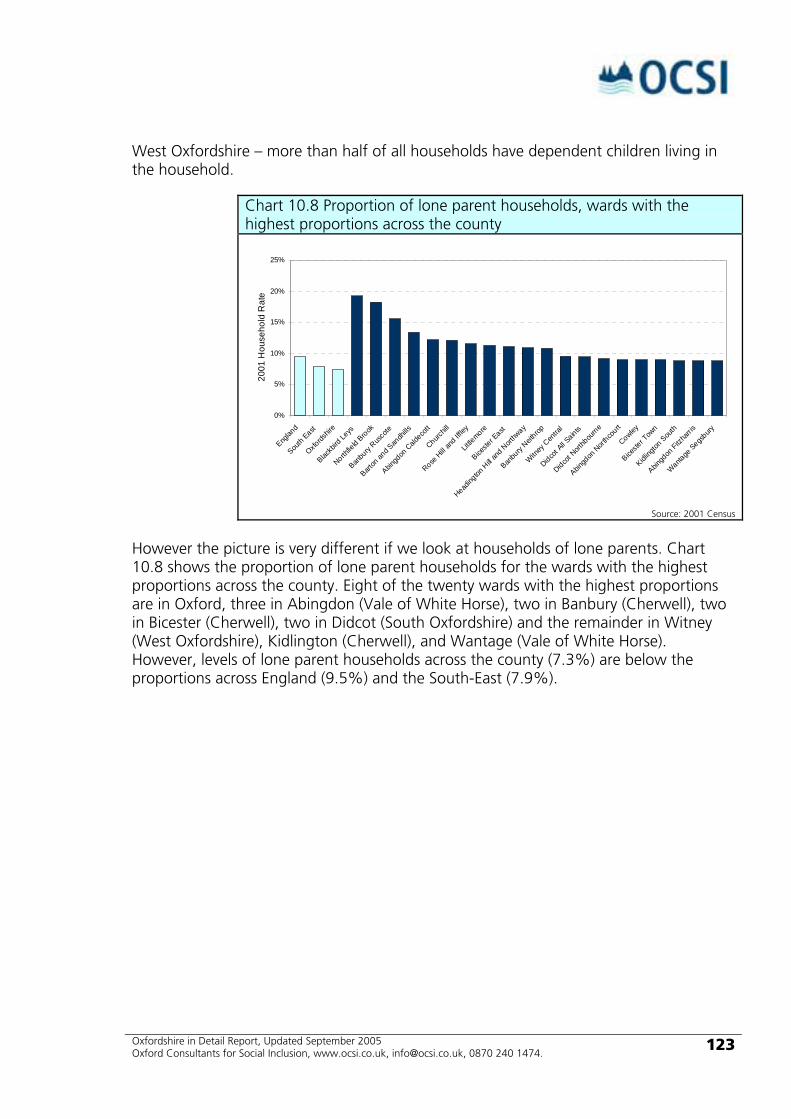
Oxfordshire in Detail Report, Updated September 2005 Oxford Consultants for Social Inclusion, www.ocsi.co.uk, [email protected], 0870 240 1474.
123
West Oxfordshire – more than half of all households have dependent children living in the household.
Chart 10.8 Proportion of lone parent households, wards with the highest proportions across the county
0%
5%
10%
15%
20%
25%
Englan
d
South
East
Oxfords
hire
Blackb
ird Le
ys
Northfie
ld Brook
Banbu
ry Rus
cote
Barton
and S
andh
ills
Abingd
on C
aldeco
tt
Churchil
l
Rose H
ill an
d Iffle
y
Little
more
Biceste
r East
Heading
ton H
ill and
Nort
hway
Banbu
ry Neit
hrop
Witney
Cen
tral
Didcot A
ll Saints
Didcot N
orthb
ourne
Abingd
on N
orthco
urt
Cowley
Biceste
r Tow
n
Kidling
ton S
outh
Abingd
on Fitz
harris
Wantage
Segsbury
2001
Hou
seho
ld R
ate
Source: 2001 Census
However the picture is very different if we look at households of lone parents. Chart 10.8 shows the proportion of lone parent households for the wards with the highest proportions across the county. Eight of the twenty wards with the highest proportions are in Oxford, three in Abingdon (Vale of White Horse), two in Banbury (Cherwell), two in Bicester (Cherwell), two in Didcot (South Oxfordshire) and the remainder in Witney (West Oxfordshire), Kidlington (Cherwell), and Wantage (Vale of White Horse). However, levels of lone parent households across the county (7.3%) are below the proportions across England (9.5%) and the South-East (7.9%).
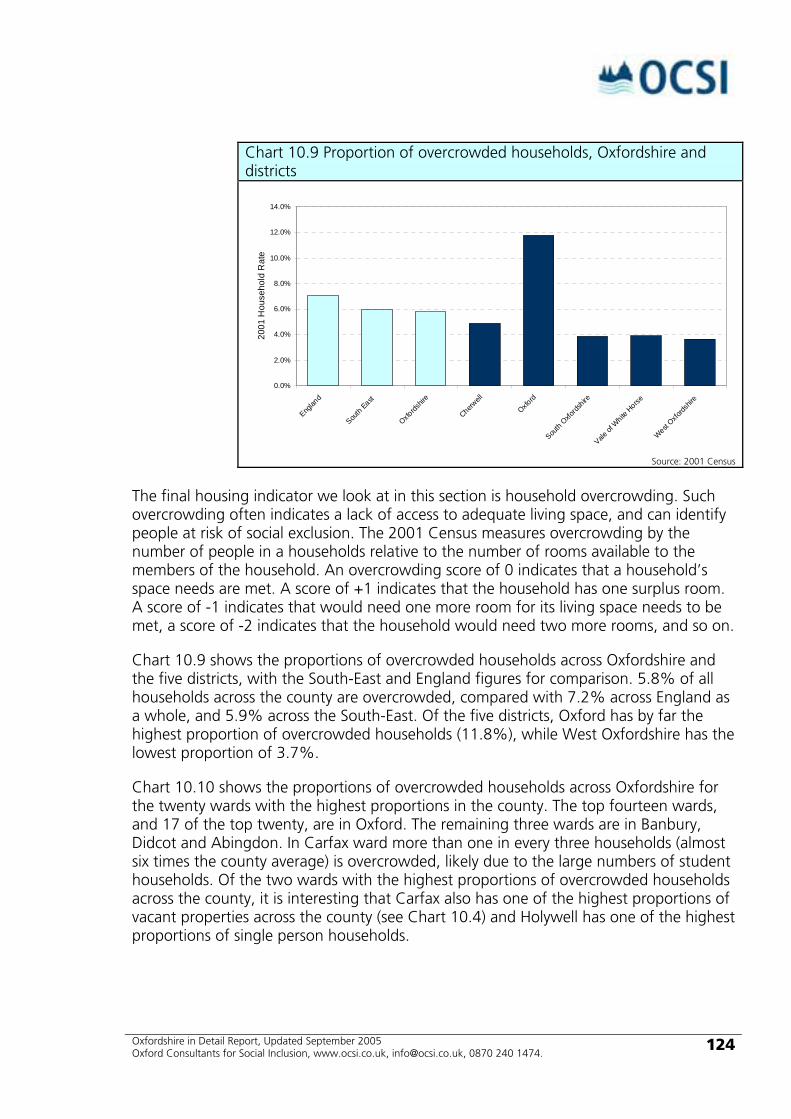
Oxfordshire in Detail Report, Updated September 2005 Oxford Consultants for Social Inclusion, www.ocsi.co.uk, [email protected], 0870 240 1474.
124
Chart 10.9 Proportion of overcrowded households, Oxfordshire and districts
0.0%
2.0%
4.0%
6.0%
8.0%
10.0%
12.0%
14.0%
Englan
d
South
East
Oxfords
hire
Cherwell
Oxford
South
Oxfords
hire
Vale of
White
Horse
West Oxfo
rdshir
e
2001
Hou
seho
ld R
ate
Source: 2001 Census
The final housing indicator we look at in this section is household overcrowding. Such overcrowding often indicates a lack of access to adequate living space, and can identify people at risk of social exclusion. The 2001 Census measures overcrowding by the number of people in a households relative to the number of rooms available to the members of the household. An overcrowding score of 0 indicates that a household’s space needs are met. A score of +1 indicates that the household has one surplus room. A score of -1 indicates that would need one more room for its living space needs to be met, a score of -2 indicates that the household would need two more rooms, and so on.
Chart 10.9 shows the proportions of overcrowded households across Oxfordshire and the five districts, with the South-East and England figures for comparison. 5.8% of all households across the county are overcrowded, compared with 7.2% across England as a whole, and 5.9% across the South-East. Of the five districts, Oxford has by far the highest proportion of overcrowded households (11.8%), while West Oxfordshire has the lowest proportion of 3.7%.
Chart 10.10 shows the proportions of overcrowded households across Oxfordshire for the twenty wards with the highest proportions in the county. The top fourteen wards, and 17 of the top twenty, are in Oxford. The remaining three wards are in Banbury, Didcot and Abingdon. In Carfax ward more than one in every three households (almost six times the county average) is overcrowded, likely due to the large numbers of student households. Of the two wards with the highest proportions of overcrowded households across the county, it is interesting that Carfax also has one of the highest proportions of vacant properties across the county (see Chart 10.4) and Holywell has one of the highest proportions of single person households.
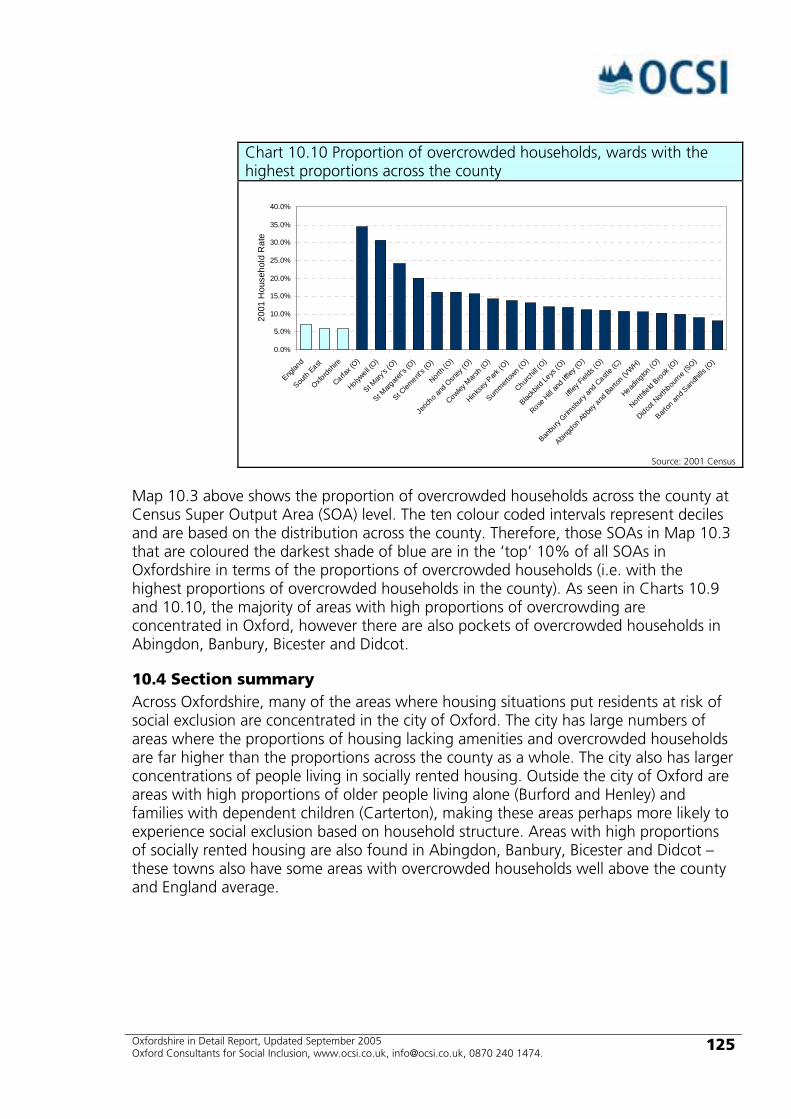
Oxfordshire in Detail Report, Updated September 2005 Oxford Consultants for Social Inclusion, www.ocsi.co.uk, [email protected], 0870 240 1474.
125
Chart 10.10 Proportion of overcrowded households, wards with the highest proportions across the county
0.0%
5.0%
10.0%
15.0%
20.0%
25.0%
30.0%
35.0%
40.0%
Englan
d
South
East
Oxfords
hire
Carfax (
O)
Holywell (
O)
St Mary
's (O)
St Marg
aret's
(O)
St Clem
ent's (
O)
North (O
)
Jeric
ho and
Osn
ey (O
)
Cowley M
arsh (
O)
Hinksey
Park
(O)
Summert
own (O
)
Churchil
l (O)
Blackb
ird Le
ys (O
)
Rose H
ill an
d Iffle
y (O)
Iffley
Fields
(O)
Banbu
ry Grim
sbury
and C
astle (
C)
Abingd
on Abbe
y and
Barton (
VWH)
Heading
ton (O
)
Northfie
ld Brook (O
)
Didcot N
orthb
ourne (
SO)
Barton
and S
andh
ills (O
)
2001
Hou
seho
ld R
ate
Source: 2001 Census
Map 10.3 above shows the proportion of overcrowded households across the county at Census Super Output Area (SOA) level. The ten colour coded intervals represent deciles and are based on the distribution across the county. Therefore, those SOAs in Map 10.3 that are coloured the darkest shade of blue are in the ‘top’ 10% of all SOAs in Oxfordshire in terms of the proportions of overcrowded households (i.e. with the highest proportions of overcrowded households in the county). As seen in Charts 10.9 and 10.10, the majority of areas with high proportions of overcrowding are concentrated in Oxford, however there are also pockets of overcrowded households in Abingdon, Banbury, Bicester and Didcot.
10.4 Section summary Across Oxfordshire, many of the areas where housing situations put residents at risk of social exclusion are concentrated in the city of Oxford. The city has large numbers of areas where the proportions of housing lacking amenities and overcrowded households are far higher than the proportions across the county as a whole. The city also has larger concentrations of people living in socially rented housing. Outside the city of Oxford are areas with high proportions of older people living alone (Burford and Henley) and families with dependent children (Carterton), making these areas perhaps more likely to experience social exclusion based on household structure. Areas with high proportions of socially rented housing are also found in Abingdon, Banbury, Bicester and Didcot – these towns also have some areas with overcrowded households well above the county and England average.

Oxfordshire in Detail Report, Updated September 2005 Oxford Consultants for Social Inclusion, www.ocsi.co.uk, [email protected], 0870 240 1474.
126
Section 11 Crime
Oxfordshire England
Violence against the person offences95 6,849 (11.3) 781,545 (15.6) Sexual offences96 427 (0.7) 46,568 (0.9) Robbery offences97 467 (0.8) 106,650 (2.1) Burglary from a dwelling98 2,863 (11.9) 422,680 (20.2) Thefts of a motor vehicle99 1,992 (3.3) 299,306 (6.0) Thefts from a vehicle100 6,318 (10.4) 627,360 (12.6)
Crime and fear of crime feature regularly as key issues afflicting individuals and communities. Crime can have a detrimental impact upon people’s quality of life in a number of ways: individuals can be physically victimised (e.g. assaulted), materially victimised (e.g. burgled), or psychologically victimised (e.g. afraid to leave the house or walk alone after dark). The negative effects of crime are not just restricted to those individuals who are personally victimised, but also transfer to friends, family, neighbours and colleagues. If left unchecked, these problems may become self-reinforcing, as more and more people in an area experience victimisation, either personally or via someone they know. If such problems persist over time, a neighbourhood may gain a reputation as a dangerous place to live, resulting in population out-migration, which can further reinforce the cycle of decline.
The government have recognised that the Police Service should not be the sole agency with responsibility for reducing crime and its associated negative impacts on people and communities. The Crime and Disorder Act 1998 introduced a statutory requirement for local authorities and the Probation Service to work in partnership with the Police to reduce offending, re-offending and the consequent negative effects. The Act required these agencies to establish a local partnership in each local authority district in England and Wales with the objective of tackling crime and disorder in a coordinated multi-agency way. These local partnerships, termed ‘Crime & Disorder Reduction Partnerships’ (CDRPs) have become a key mechanism in the government’s attempts to reduce crime and disorder and increase people’s perceptions of personal safety. CDRPs map exactly onto the boundaries of local authority districts (with the exception of Heathrow Airport which has its own CDRP). The Act also placed a requirement on all other agencies to consider their actions in terms of their implications for crime reduction. CDRPs therefore often have a broad membership, including representatives from public agencies (e.g. the Fire Service, Health Service, Education Authorities), private organisations (e.g. local businesses), and voluntary and community groups (e.g. victim support and neighbourhood watch).
This broad membership of interested parties is indicative of the wide variety of crime-related issues that require a wide range of coordinated interventions. Imagine, for instance, a girl of 13 years of age who is arrested by the police for assaulting an elderly man. The police may be the first agency to become involved by making a speedy arrest; the health service may also become involved if the elderly victim has to go to hospital for treatment; and a local victim support group may assist by providing after-care in order
Oxfordshire in Detail Report, Updated September 2005 Oxford Consultants for Social Inclusion, www.ocsi.co.uk, [email protected], 0870 240 1474.
127
to reduce the psychological impacts on the victim. Furthermore, there may be a number of personal and family factors that increase the likelihood of this girl committing such a crime. For example, the girl might be playing truant from school or indeed be excluded from school; she may live in a family who are in poor housing accommodation or who have been evicted from their home and therefore have no permanent address; she may be experimenting with drugs and/or alcohol; and she herself might be the victim of physical or verbal abuse. Each of these problems may increase the risk of this particular girl committing a criminal offence and, when considered together, they provide a strong indication that she may re-offend in the future. In the example given here, a multi-agency response involving the local education authority, housing department, Drug Action Team, and social services, in addition to the police and Youth Offending Team, may be necessary.
Each interested party collects and maintains datasets which can be vital in identifying possible reasons why people offend, and therefore for identifying people who are at risk of offending before they actually commit a crime. This enables a CDRP to adopt a proactive approach to crime reduction and community safety.
Unfortunately, however, at the present time very little community safety related information is publicly available at small area level. The Home Office routinely publishes crime statistics for each police force in England and Wales and has recently begun publishing selected crime statistics at CDRP level. Unfortunately, no data are released at sub-district level. The Fire Service collects information on the number of deliberate and malicious fires (another indicator of social disorder) but again these data are not published at small area level. A limited amount of housing, education and health related data is contained within the 2001 Census results, but these data can quickly become out of date and therefore lose some of their value as the time from the Census increases.
This section focuses on crime in its narrowest sense: the incidence of criminal events and the associated risk of victimisation. The section is based entirely on police recorded crime data, in the absence of suitable alternative/complementary sources of relevant information. It is important to remember, however, that a considerable number of indicators presented in other sections of this report can act as predictors of criminal activity at a neighbourhood level. For example, areas that fare poorly on education, employment, housing and health, are more likely to generate and sustain those risk factors associated with offending behaviour. Such indicators are not presented here, however, as this section assumes police recorded crime data is the best available measure of criminal activity. See the Background: Crime data box below for more details of the information available.
Police recorded crime data have both strengths and weaknesses and it is important to bear these in mind when analysing such data. Recorded crime data locate criminal events at their point of occurrence – they therefore act as an indicator of incidence of victimisation at the neighbourhood level. The vast majority of crimes are allocated either a postcode or grid reference thus enabling crimes to be plotted on a map. The Home Office issues guidance to police forces as to what constitutes a crime and to which offence type a criminal act should be classified. The most recent major revision to the
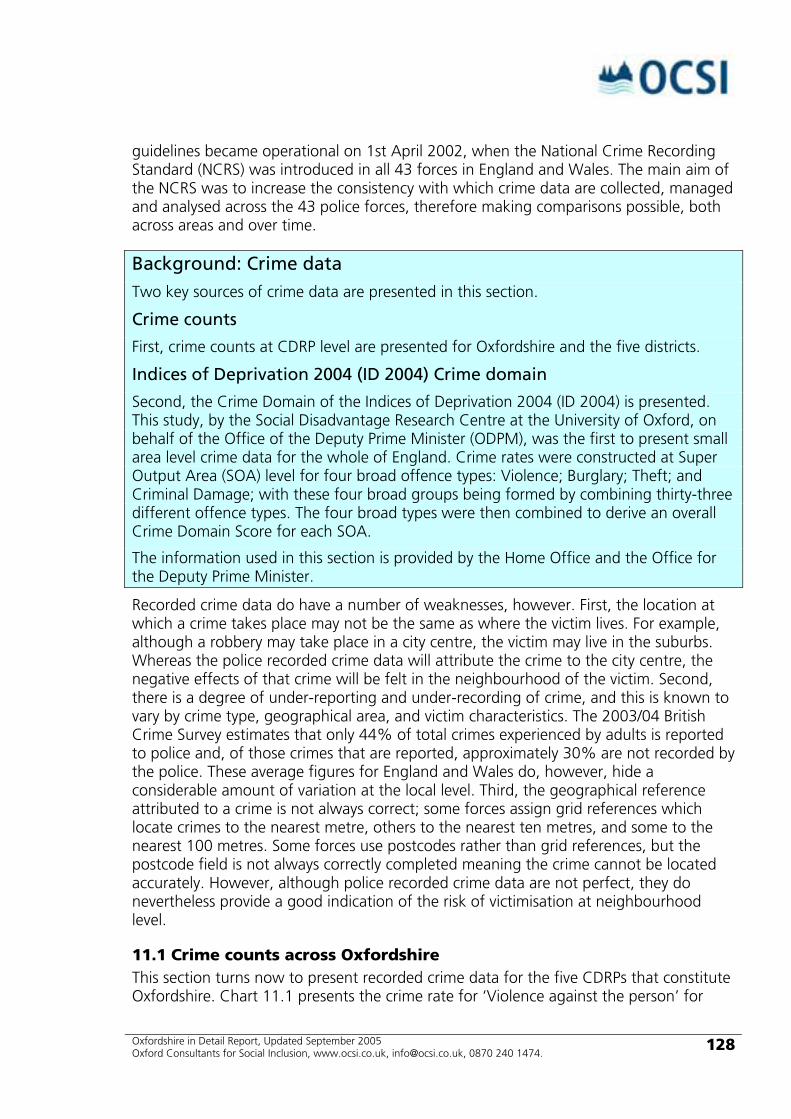
Oxfordshire in Detail Report, Updated September 2005 Oxford Consultants for Social Inclusion, www.ocsi.co.uk, [email protected], 0870 240 1474.
128
guidelines became operational on 1st April 2002, when the National Crime Recording Standard (NCRS) was introduced in all 43 forces in England and Wales. The main aim of the NCRS was to increase the consistency with which crime data are collected, managed and analysed across the 43 police forces, therefore making comparisons possible, both across areas and over time.
Background: Crime data Two key sources of crime data are presented in this section.
Crime counts
First, crime counts at CDRP level are presented for Oxfordshire and the five districts.
Indices of Deprivation 2004 (ID 2004) Crime domain
Second, the Crime Domain of the Indices of Deprivation 2004 (ID 2004) is presented. This study, by the Social Disadvantage Research Centre at the University of Oxford, on behalf of the Office of the Deputy Prime Minister (ODPM), was the first to present small area level crime data for the whole of England. Crime rates were constructed at Super Output Area (SOA) level for four broad offence types: Violence; Burglary; Theft; and Criminal Damage; with these four broad groups being formed by combining thirty-three different offence types. The four broad types were then combined to derive an overall Crime Domain Score for each SOA.
The information used in this section is provided by the Home Office and the Office for the Deputy Prime Minister.
Recorded crime data do have a number of weaknesses, however. First, the location at which a crime takes place may not be the same as where the victim lives. For example, although a robbery may take place in a city centre, the victim may live in the suburbs. Whereas the police recorded crime data will attribute the crime to the city centre, the negative effects of that crime will be felt in the neighbourhood of the victim. Second, there is a degree of under-reporting and under-recording of crime, and this is known to vary by crime type, geographical area, and victim characteristics. The 2003/04 British Crime Survey estimates that only 44% of total crimes experienced by adults is reported to police and, of those crimes that are reported, approximately 30% are not recorded by the police. These average figures for England and Wales do, however, hide a considerable amount of variation at the local level. Third, the geographical reference attributed to a crime is not always correct; some forces assign grid references which locate crimes to the nearest metre, others to the nearest ten metres, and some to the nearest 100 metres. Some forces use postcodes rather than grid references, but the postcode field is not always correctly completed meaning the crime cannot be located accurately. However, although police recorded crime data are not perfect, they do nevertheless provide a good indication of the risk of victimisation at neighbourhood level.
11.1 Crime counts across Oxfordshire This section turns now to present recorded crime data for the five CDRPs that constitute Oxfordshire. Chart 11.1 presents the crime rate for ‘Violence against the person’ for

Oxfordshire in Detail Report, Updated September 2005 Oxford Consultants for Social Inclusion, www.ocsi.co.uk, [email protected], 0870 240 1474.
129
each CDRP (i.e. district) in Oxfordshire and the county, regional and England averages for comparison. Chart 11.2 presents data for ‘Burglary’; Chart 11.3 presents data for ‘Theft of a motor vehicle’; and Chart 11.4 presents data for ‘Theft from a motor vehicle’. The crime rates contained within Charts 11.1, 11.3 and 11.4 are calculated by dividing the number of crimes by the total resident population, while the burglary offences in Chart 11.2 are presented per thousand households. Areas with low resident population but high numbers of workers, shoppers, passers by and so on will therefore appear to have higher risk of victimisation than is actually the case. This, however, is the method chosen by the Home Office for the presentation of their crime rates.
Chart 11.1 Violence against the person offences, rate per thousand people, Oxfordshire and districts
Source: Home Office 2002-2003
Chart 11.1 shows that Oxfordshire as a whole has a lower rate of violence against the person than both the South East region and England averages. Oxfordshire’s rate of violence against the person is 11.3 crimes per 1000 population, compared to the regional average of 11.4 per 1000 population and the England average of 15.6 per 1000 population. It is clear, however, that within Oxfordshire there is considerable inequality in the rates of violence against the person, with the district of Oxford having a rate of 21.0 per 1000 population, which is almost twice as high as the county average. Indeed, the district of West Oxfordshire has a rate of just 6.7 per 1000 population, which is over three times lower than the rate in Oxford.
Chart 11.2 shows the rate of burglary in each of the five districts in Oxfordshire. The number of households in each area is used as the denominator for these rates as this offers a more suitable measure of vulnerability than population counts. It is clear from Chart 11.2 that Oxfordshire (11.9 per 1000 households) has a slightly lower rate of burglary than the South East region (12.0 per 1000 households), and a lower rate than for England as a whole (20.2 per 1000 households). Within Oxfordshire, a considerable degree of variation in crime rates is again visible, with Oxford (24.6 per 1000 households) exhibiting by far the highest burglary rate, followed by South Oxfordshire
0.00
5.00
10.00
15.00
20.00
25.00
Englan
d
South
East
Oxfords
hire
Cherwell
Oxford
South
Oxfords
hire
Vale of
White
Horse
West Oxfo
rdshir
e
2002
-200
3 O
ffenc
e R
ate

Oxfordshire in Detail Report, Updated September 2005 Oxford Consultants for Social Inclusion, www.ocsi.co.uk, [email protected], 0870 240 1474.
130
(10.8 per 1000 households), Cherwell (10.1 per 1000 households), Vale of White Horse (6.1 per 1000 households), and finally West Oxfordshire (5.6 per 1000 households). Oxford has burglary rates above the regional average (12.0 per 1000 households) and the average for England as a whole (20.2 per 1000 households).
Chart 11.2 Burglary offences, rate per thousand households, Oxfordshire and districts
0.00
5.00
10.00
15.00
20.00
25.00
30.00
Englan
d
South
East
Oxfords
hire
Cherwell
Oxford
South
Oxfords
hire
Vale of
White
Horse
West Oxfo
rdshir
e
2002
-200
3 O
ffenc
e R
ate
Source: Home Office 2002-2003
Chart 11.3 shows the rate of theft of motor vehicles for each district in Oxfordshire. A similar pattern is observable to the previous charts with Oxford exhibiting by far the highest vehicle theft rate (5.9 crimes per 1000 population) of the five districts. The Oxfordshire average (3.3 crimes per 1000 population) is lower than the regional average (3.9 crimes per 1000 population), and both of these figures are below the average for England as a whole (6.0 crimes per 1000 population).
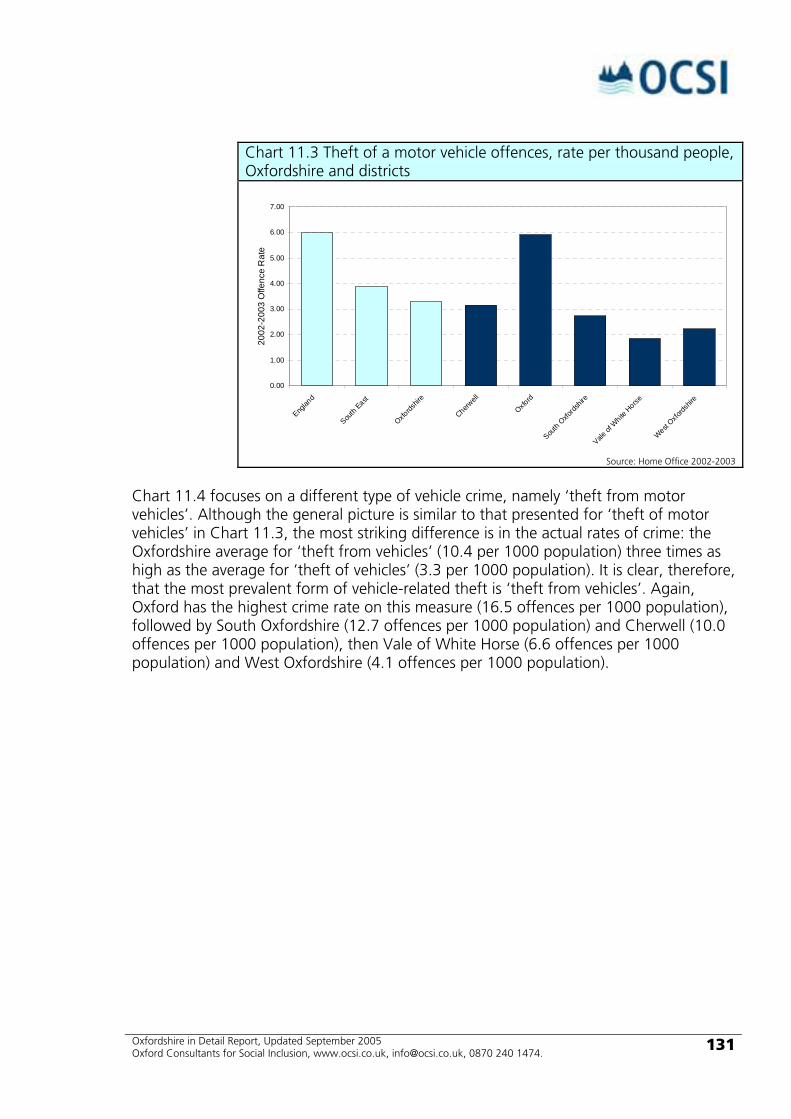
Oxfordshire in Detail Report, Updated September 2005 Oxford Consultants for Social Inclusion, www.ocsi.co.uk, [email protected], 0870 240 1474.
131
Chart 11.3 Theft of a motor vehicle offences, rate per thousand people, Oxfordshire and districts
0.00
1.00
2.00
3.00
4.00
5.00
6.00
7.00
Englan
d
South
East
Oxfords
hire
Cherwell
Oxford
South
Oxfords
hire
Vale of
White
Horse
West Oxfo
rdshir
e
2002
-200
3 O
ffenc
e R
ate
Source: Home Office 2002-2003
Chart 11.4 focuses on a different type of vehicle crime, namely ‘theft from motor vehicles’. Although the general picture is similar to that presented for ‘theft of motor vehicles’ in Chart 11.3, the most striking difference is in the actual rates of crime: the Oxfordshire average for ‘theft from vehicles’ (10.4 per 1000 population) three times as high as the average for ‘theft of vehicles’ (3.3 per 1000 population). It is clear, therefore, that the most prevalent form of vehicle-related theft is ‘theft from vehicles’. Again, Oxford has the highest crime rate on this measure (16.5 offences per 1000 population), followed by South Oxfordshire (12.7 offences per 1000 population) and Cherwell (10.0 offences per 1000 population), then Vale of White Horse (6.6 offences per 1000 population) and West Oxfordshire (4.1 offences per 1000 population).
Oxfordshire in Detail Report, Updated September 2005 Oxford Consultants for Social Inclusion, www.ocsi.co.uk, [email protected], 0870 240 1474.
132
Chart 11.4 Theft from a motor vehicle, rate per thousand people, Oxfordshire and districts
0.00
2.00
4.00
6.00
8.00
10.00
12.00
14.00
16.00
18.00
Englan
d
South
East
Oxfords
hire
Cherwell
Oxford
South
Oxfords
hire
Vale of
White
Horse
West Oxfo
rdshir
e
2002
-200
3 O
ffenc
e R
ate
Source: Home Office 2002-2003
11.2 Geographical distribution of crime across Oxfordshire The crime counts presented in the previous section are not currently available for areas smaller than the Crime and Disorder Reduction Partnerships (i.e. district level), so it is difficult to use them to analyse the patterns of crime across the county in detail. However the Indices of Deprivation 2004 (ID 2004) contain Crime domain information, which is presented at Census Super Output Area, or SOA, level (see the Background: Knowing the Geographies box in Section 3 for further information on SOAs). From this Crime domain ID 2004 information2, we can look at Oxfordshire in detail.
The overall Crime domain ID 2004 was constructed using 33 types of recorded crime which were grouped into four broad groups: ‘Violence’, ‘Burglary’, ‘Theft’, and ‘Criminal Damage’. It is important to note that the various categories of crime used to create the broad crime groups in the ID 2004 may not be the same as the categories used to create the broad groups presented in the charts above (e.g. the ‘Violence’ category of the ID 2004 does not match the ‘Violence against the person’ category in the charts). Furthermore, whereas the crime rates presented in the charts above use just resident population or households as the denominators, the ID 2004 incorporated non-resident workplace population and non-domestic properties into the crime rate denominators to give a more appropriate measure of vulnerability.
Map 11.1 below shows the Crime domain score of the ID 2004 for each SOA in Oxfordshire. The ten colour coded intervals represent deciles and are based on the distribution across England. Therefore, those SOAs in Map 11.1 that are coloured the
2 The information used in this report is the revised ID 2004 information released by the Office for the Deputy Prime Minister on June 17th 2004.
Oxfordshire in Detail Report, Updated September 2005 Oxford Consultants for Social Inclusion, www.ocsi.co.uk, [email protected], 0870 240 1474.
133
darkest shade of blue are in the ‘top’ 10% of all SOAs in England in terms of the Crime domain score of the ID 2004 (i.e. with the highest rates of crime across England).
It is clear from Map 11.1 that the majority of Oxfordshire fares relatively well on the Crime domain when considered in terms of the England distribution. Large areas of Cherwell, West Oxfordshire and Vale of White Horse are shaded yellow, indicating they have very low crime rates in relation to England as a whole. In the districts of Oxford and South Oxfordshire, however, the picture is a little less straightforward. A considerable proportion of SOAs in the south of Oxford are shaded blue, indicating these areas have high crime rates in relation to the national distribution. A number of SOAs across South Oxfordshire are also shaded blue, although these are interspersed with areas of relatively low crime crimes. The close-up maps of urban centres show that, although SOAs in urban areas do tend to have higher crime rates than more rural areas, not every urban area has high rates and not every rural area has low rates. This indicates that the improvements to the population denominators (representing vulnerability) in the ID 2004 have the desired effect of more accurately measuring crime rates in areas with low resident population but high non-resident population. Areas showing high crime rates relative to England as a whole are seen particularly in Banbury, Bicester and Oxford.
Map 11.2 below shows the same Crime domain score of the ID 2004 information as Map 11.1, except that the ten colour coded intervals represent deciles based on the distribution across the county. Therefore, those SOAs in Map 11.2 that are coloured the darkest shade of blue are in the ‘top’ 10% of all SOAs in Oxfordshire in terms of the Crime domain score of the ID 2004 (i.e. with the highest rates of crime across the county). This enables us to look at the patterns of crime within the county, where Map 11.1 helped us to look at the crime rates across the county in broader terms of the distribution across England.

Oxfordshire in Detail Report, Updated September 2005 Oxford Consultants for Social Inclusion, www.ocsi.co.uk, [email protected], 0870 240 1474.
134
Map 11.1 Showing the Crime domain of the Index of Multiple Deprivation 2004 across the county, with rankings based on the distribution across England.
Source: OCSI 2005 (from ODPM 2004)
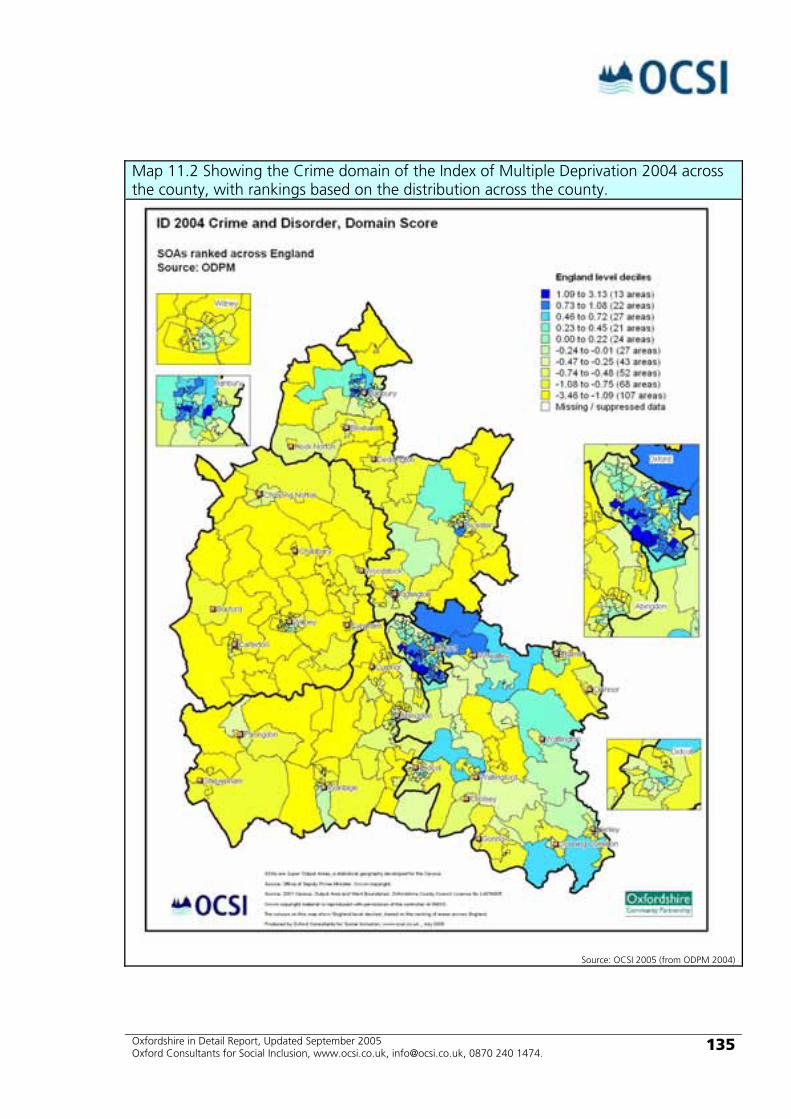
Oxfordshire in Detail Report, Updated September 2005 Oxford Consultants for Social Inclusion, www.ocsi.co.uk, [email protected], 0870 240 1474.
135
Map 11.2 Showing the Crime domain of the Index of Multiple Deprivation 2004 across the county, with rankings based on the distribution across the county.
Source: OCSI 2005 (from ODPM 2004)

Oxfordshire in Detail Report, Updated September 2005 Oxford Consultants for Social Inclusion, www.ocsi.co.uk, [email protected], 0870 240 1474.
136
Map 11.2 demonstrates more clearly the variation of crime rates within Oxfordshire. Again, the district of Oxford is clearly identifiable as having the highest concentration of SOAs with high crime rates, but a number of other areas are also revealed as having relatively high crime rates in relation to the county distribution, including large parts of Banbury and Bicester. It is interesting to note that the areas identified as having high crime rates in this section can often be seen to be classified as being relatively deprived in the other sections in this report. This indeed supports the general argument that people living in deprived areas are at greater risk of victimisation than people living in less deprived areas.
Chart 11.5 ID 2004 Crime domain rank, wards with the highest ranks across the county
0.0%
2.0%
4.0%
6.0%
8.0%
10.0%
12.0%
14.0%
16.0%
Rose H
ill an
d Iffle
y E01
02857
5 (O)
Jeric
ho and
Osn
ey E01
02855
1 (O)
Hinksey
Park
E01028
542 (
O)
Rose H
ill an
d Iffle
y E01
02857
8 (O)
Barton
and S
andh
ills E
0102
8516
(O)
Blackb
ird Le
ys E01
02851
9 (O)
Rose H
ill an
d Iffle
y E01
02857
6 (O)
Banbu
ry Grim
sbury
and C
astle E
01028
435 (
C)
Carfax E
0102
8522
(O)
Rose H
ill an
d Iffle
y E01
02857
7 (O)
St Mary
's E01
0285
88 (O
)
Banbu
ry Rus
cote
E0102
8454
(C)
Barton
and S
andh
ills E
0102
8513
(O)
Little
more E010
2855
4 (O)
Blackb
ird Le
ys E01
02852
0 (O)
St Clem
ent's E
0102
8580
(O)
Northfie
ld Brook E
0102
8568
(O)
St Clem
ent's E
0102
8581
(O)
Banbu
ry Hard
wick E01
02844
1 (C)
Banbu
ry Rus
cote
E0102
8450
(C)
Nat
iona
l per
cent
age
rank
ing
National Percentage ranks is the rank as the percentage of all areas in England
0% is most deprived 100% is the least deprived percentage rank in England Source: OCSI 2005 (from ODPM 2004)
Chart 11.5 supports this – of the twenty SOAs in the county with the highest ranking on the ID 2004 Crime domain, sixteen are in Oxford, three in Banbury and one in Bicester.
11.3 Section summary Crime rates across the county are significantly lower than across England on a number of key indicators – violence against people, burglary, robbery, sexual offences, and thefts both from and of a vehicle. This is also seen in the detailed geographical distribution of crime rates across the county, with most of the county showing rates very low when compared to the distribution across England. However, there is significant variation within the county – the district of Oxford shows rates significantly higher than the county, region and England on all the key indicators, also parts of other urban areas such as Banbury and Bicester have high crime rates compared to both England and the county.
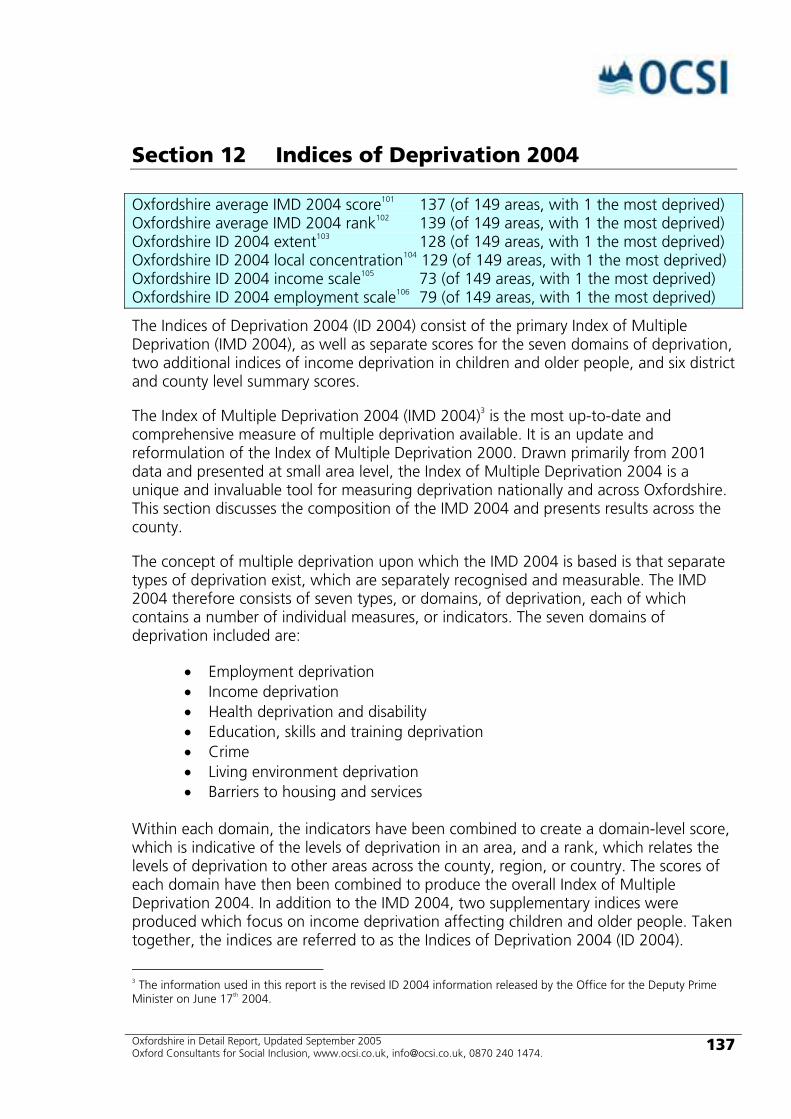
Oxfordshire in Detail Report, Updated September 2005 Oxford Consultants for Social Inclusion, www.ocsi.co.uk, [email protected], 0870 240 1474.
137
Section 12 Indices of Deprivation 2004
Oxfordshire average IMD 2004 score101 137 (of 149 areas, with 1 the most deprived) Oxfordshire average IMD 2004 rank102 139 (of 149 areas, with 1 the most deprived) Oxfordshire ID 2004 extent103 128 (of 149 areas, with 1 the most deprived) Oxfordshire ID 2004 local concentration104 129 (of 149 areas, with 1 the most deprived) Oxfordshire ID 2004 income scale105 73 (of 149 areas, with 1 the most deprived) Oxfordshire ID 2004 employment scale106 79 (of 149 areas, with 1 the most deprived)
The Indices of Deprivation 2004 (ID 2004) consist of the primary Index of Multiple Deprivation (IMD 2004), as well as separate scores for the seven domains of deprivation, two additional indices of income deprivation in children and older people, and six district and county level summary scores.
The Index of Multiple Deprivation 2004 (IMD 2004)3 is the most up-to-date and comprehensive measure of multiple deprivation available. It is an update and reformulation of the Index of Multiple Deprivation 2000. Drawn primarily from 2001 data and presented at small area level, the Index of Multiple Deprivation 2004 is a unique and invaluable tool for measuring deprivation nationally and across Oxfordshire. This section discusses the composition of the IMD 2004 and presents results across the county.
The concept of multiple deprivation upon which the IMD 2004 is based is that separate types of deprivation exist, which are separately recognised and measurable. The IMD 2004 therefore consists of seven types, or domains, of deprivation, each of which contains a number of individual measures, or indicators. The seven domains of deprivation included are:
• Employment deprivation • Income deprivation • Health deprivation and disability • Education, skills and training deprivation • Crime • Living environment deprivation • Barriers to housing and services
Within each domain, the indicators have been combined to create a domain-level score, which is indicative of the levels of deprivation in an area, and a rank, which relates the levels of deprivation to other areas across the county, region, or country. The scores of each domain have then been combined to produce the overall Index of Multiple Deprivation 2004. In addition to the IMD 2004, two supplementary indices were produced which focus on income deprivation affecting children and older people. Taken together, the indices are referred to as the Indices of Deprivation 2004 (ID 2004).
3 The information used in this report is the revised ID 2004 information released by the Office for the Deputy Prime Minister on June 17th 2004.

Oxfordshire in Detail Report, Updated September 2005 Oxford Consultants for Social Inclusion, www.ocsi.co.uk, [email protected], 0870 240 1474.
138
The IMD 2004 is released at Census Super Output Area (SOA) level, with district and county level summaries also produced. For more detail see the Background: The IMD 2004 Geography box below.
Some of the domains have been discussed in other sections, but for completeness we describe in this section each of the domains making up the ID 2004, along with the two supplementary indices.
Background: The IMD 2004 Geography The IMD 2004 has been created at Census Super Output Area (SOA) level. SOAs are created by combining together Census Output Areas, with an average population size of 1,500 people. Roughly five OAs create a single lower layer SOA – across England there are 165,665 OAs and 32,482 lower layer SOAs, while across Oxfordshire there are 1,977 OAs and 404 lower layer SOAs. For further detail see the Background: Knowing the Geographies box in Section 3.
This small area level geography allows for the identification of pockets of deprivation that might be obscured by measurements at county, district, or even ward level. For example in the Abingdon Caldecott ward in the Vale of White Horse, two SOAs rank at approximately 20,000 nationally (where a rank of 1 is the most deprived and 32,482 the least deprived). However the third SOA, in the north of the ward, ranks below 10,000, making it significantly more deprived than its neighbours.
In addition, the IMD 2004 scores have been released at district and county level summaries. These summaries describe the average scores and ranks of the SOAs within each district and county, and the proportion of the population living in the most deprived 10% of all SOAs across the country.
12.1 Multiple derivation across Oxfordshire As discussed above, the IMD 2004 combines information on deprivation from a number of domains to give a single multiple deprivation score. For full information on how the index is derived, see the full report on the English Indices of Deprivation 2004 published by the Office for the Deputy Prime Minister.
Map 12.1 below shows the IMD 2004 score for each SOA in Oxfordshire. The ten colour coded intervals represent deciles and are based on the distribution across England. Therefore, those SOAs in Map 12.1 that are coloured the darkest shade of blue are in the ‘top’ 10% of all SOAs in England in terms of the IMD 2004 (i.e. with the highest rates of multiple deprivation across England).
From Map 12.1, it is apparent that the south-eastern fringes of the district of Oxford are the county’s most deprived areas (i.e. areas in blue), with levels of multiple deprivation relatively high compared to England as a whole. Indeed, the only SOA in the county to fall into the most deprived decile in England is located in the Northfield Brook ward, in the most south-easterly area of the city. Other areas of high deprivation are located in Banbury, but overall Oxfordshire has low levels of deprivation compared to England as a whole.

Oxfordshire in Detail Report, Updated September 2005 Oxford Consultants for Social Inclusion, www.ocsi.co.uk, [email protected], 0870 240 1474.
139
Map 12.2 below shows the same IMD 2004 score information as Map 12.1, except that the ten colour coded intervals represent deciles based on the distribution across the county. Therefore, those SOAs in Map 12.2 that are coloured the darkest shade of blue are in the ‘top’ 10% of all SOAs in Oxfordshire in terms of the IMD 2004 (i.e. with the highest rates of multiple deprivation across the county). This enables us to look at the patterns of deprivation within the county, where Map 12.1 helped us to look at deprivation across the county in broader terms of the distribution across England.
Of the 404 SOAs across Oxfordshire, Map 12.2 shows that the most deprived are clearly concentrated in Oxford, however there are significant numbers of areas in Banbury, Didcot, Abingdon and Berinsfield that are also highly deprived relative to the rest of the county.
Chart 12.1 illustrates this at district level, showing the percentage of the SOAs within each district that fall within the most deprived 10% of SOAs across the county as measured by the IMD 2004. Again, it is apparent that Oxford City contains the greatest proportion of most deprived SOAs – 28.2% of the SOAs across Oxford are in the most deprived 10% across the county. This contrasts with 13.2% of the SOAs across Cherwell being in the most deprived 10% across the county, just 3.4% in South Oxfordshire, 1.3% in Vale of White Horse. No areas in West Oxfordshire are in the most deprived 10% across the county.
Chart 12.1 Proportion of Census Super Output Areas in each district that are in the most deprived 10% across the county as measured by the IMD 2004
0.0%
5.0%
10.0%
15.0%
20.0%
25.0%
30.0%
35.0%
Cherwell Oxford South Oxfordshire Vale of White Horse West Oxfordshire
Perc
enta
ge S
OA
s in
eac
h di
stric
t
Source: OCSI 2005 (from ODPM 2004)
Chart 12.2 shows the IMD 2004 rankings for the SOAs with the highest scores across the county. Of the ten SOAs with the highest scores, eight are in Oxford, with the remaining two in Banbury.
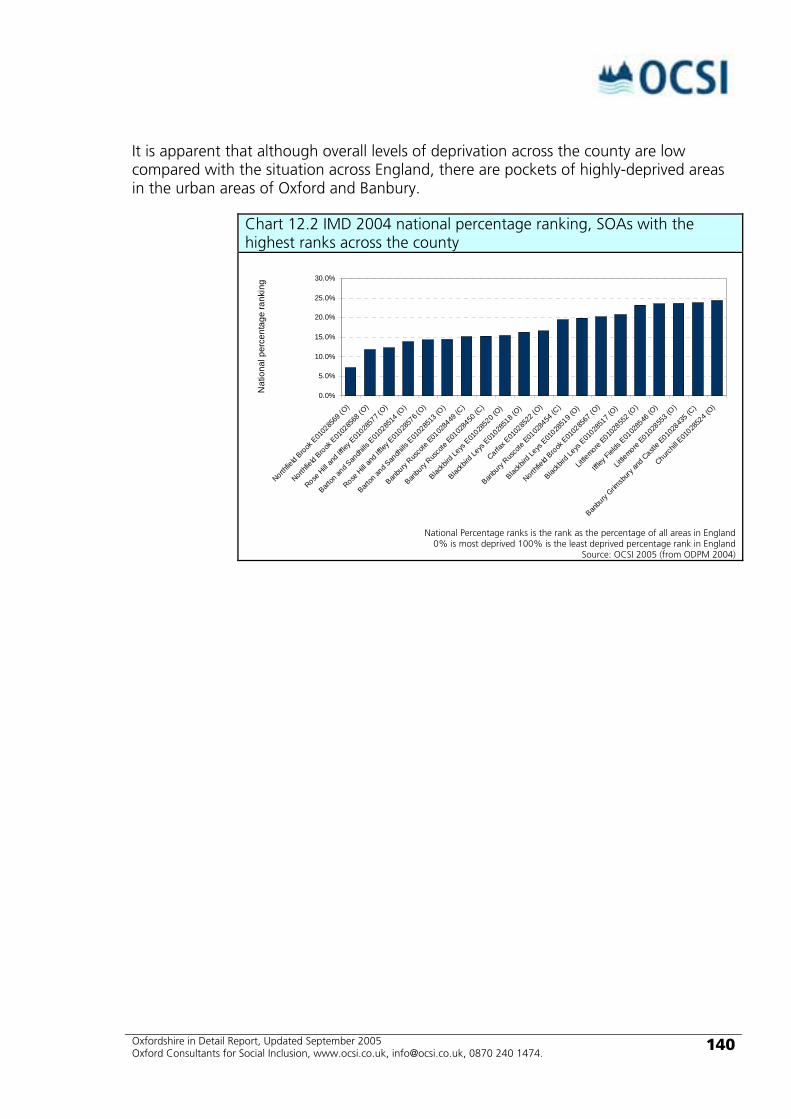
Oxfordshire in Detail Report, Updated September 2005 Oxford Consultants for Social Inclusion, www.ocsi.co.uk, [email protected], 0870 240 1474.
140
It is apparent that although overall levels of deprivation across the county are low compared with the situation across England, there are pockets of highly-deprived areas in the urban areas of Oxford and Banbury.
Chart 12.2 IMD 2004 national percentage ranking, SOAs with the highest ranks across the county
0.0%
5.0%
10.0%
15.0%
20.0%
25.0%
30.0%
Northfie
ld Brook E
0102
8569
(O)
Northfie
ld Brook E
0102
8568
(O)
Rose H
ill an
d Iffle
y E01
02857
7 (O)
Barton
and S
andh
ills E
0102
8514
(O)
Rose H
ill an
d Iffle
y E01
02857
6 (O)
Barton
and S
andh
ills E
0102
8513
(O)
Banbu
ry Rus
cote
E0102
8449
(C)
Banbu
ry Rus
cote
E0102
8450
(C)
Blackb
ird Le
ys E01
02852
0 (O)
Blackb
ird Le
ys E01
02851
8 (O)
Carfax E
0102
8522
(O)
Banbu
ry Rus
cote
E0102
8454
(C)
Blackb
ird Le
ys E01
02851
9 (O)
Northfie
ld Brook E
0102
8567
(O)
Blackb
ird Le
ys E01
02851
7 (O)
Little
more E010
2855
2 (O)
Iffley
Fields
E0102
8546
(O)
Little
more E010
2855
3 (O)
Banbu
ry Grim
sbury
and C
astle E
01028
435 (
C)
Churchil
l E01
02852
4 (O)
Nat
iona
l per
cent
age
rank
ing
National Percentage ranks is the rank as the percentage of all areas in England
0% is most deprived 100% is the least deprived percentage rank in England Source: OCSI 2005 (from ODPM 2004)
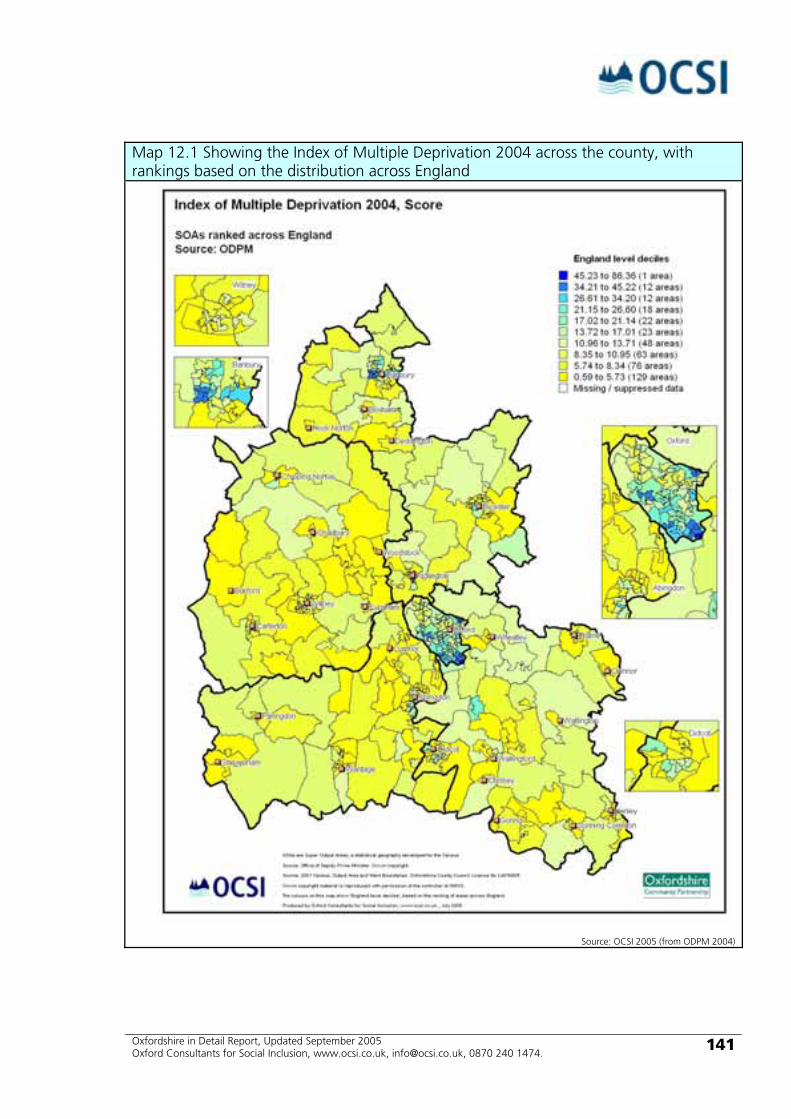
Oxfordshire in Detail Report, Updated September 2005 Oxford Consultants for Social Inclusion, www.ocsi.co.uk, [email protected], 0870 240 1474.
141
Map 12.1 Showing the Index of Multiple Deprivation 2004 across the county, with rankings based on the distribution across England
Source: OCSI 2005 (from ODPM 2004)
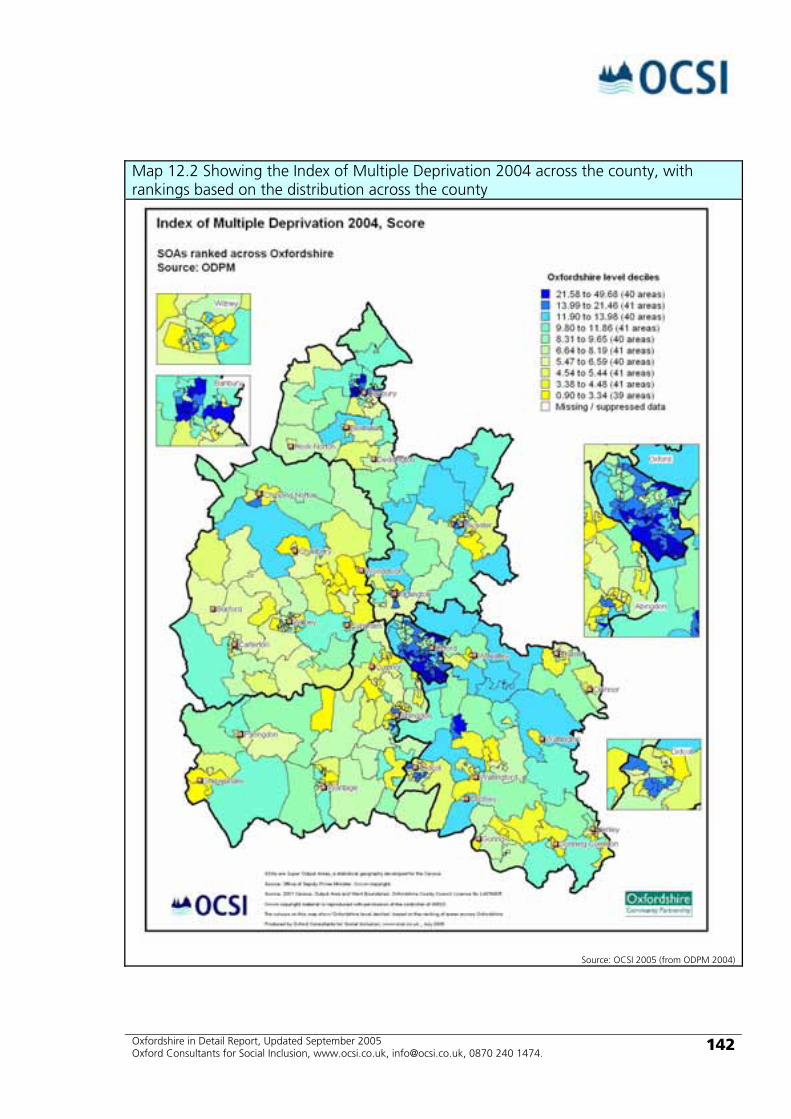
Oxfordshire in Detail Report, Updated September 2005 Oxford Consultants for Social Inclusion, www.ocsi.co.uk, [email protected], 0870 240 1474.
142
Map 12.2 Showing the Index of Multiple Deprivation 2004 across the county, with rankings based on the distribution across the county
Source: OCSI 2005 (from ODPM 2004)

Oxfordshire in Detail Report, Updated September 2005 Oxford Consultants for Social Inclusion, www.ocsi.co.uk, [email protected], 0870 240 1474.
143
Map 12.3 Showing the Employment domain of the Index of Multiple Deprivation 2004 across the county, with rankings based on the distribution across the county
Source: OCSI 2005 (from ODPM 2004)
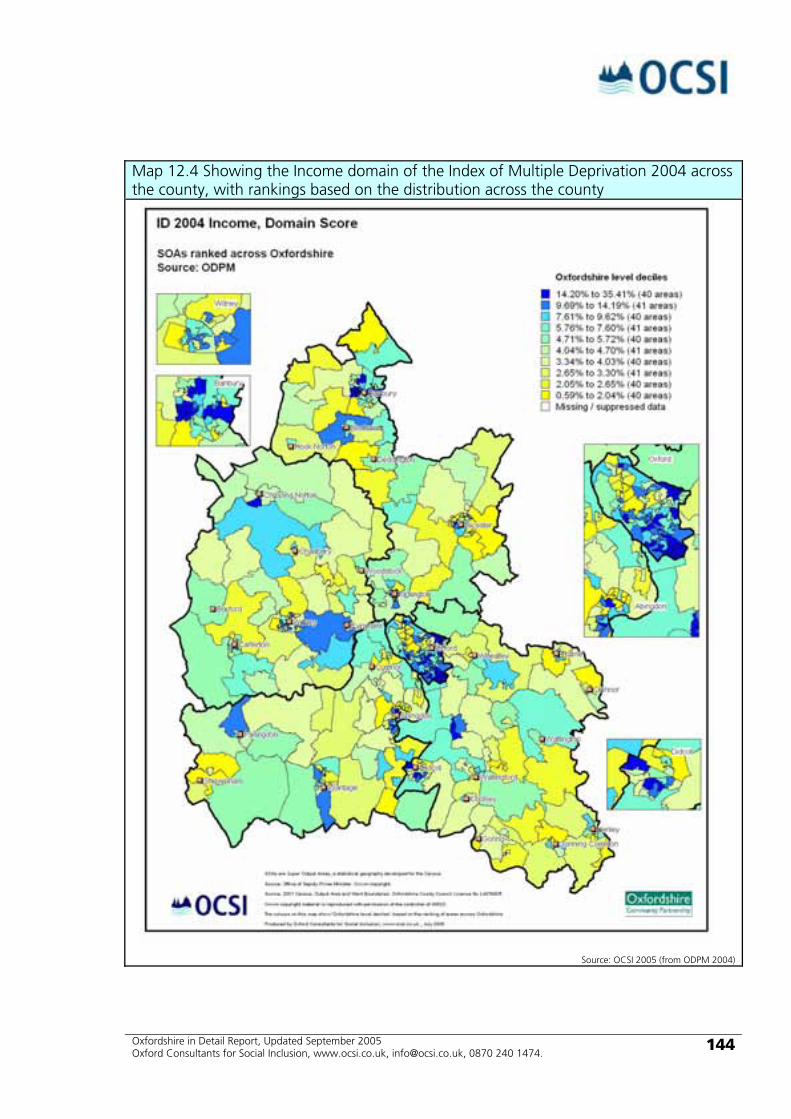
Oxfordshire in Detail Report, Updated September 2005 Oxford Consultants for Social Inclusion, www.ocsi.co.uk, [email protected], 0870 240 1474.
144
Map 12.4 Showing the Income domain of the Index of Multiple Deprivation 2004 across the county, with rankings based on the distribution across the county
Source: OCSI 2005 (from ODPM 2004)
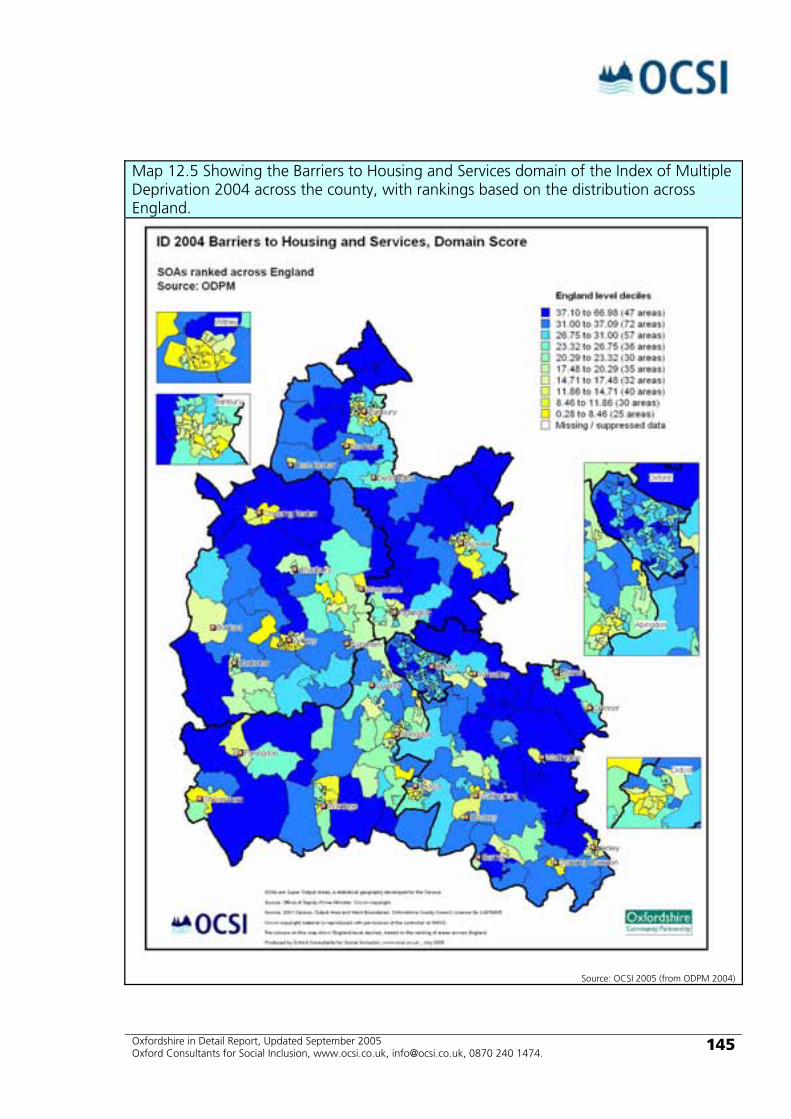
Oxfordshire in Detail Report, Updated September 2005 Oxford Consultants for Social Inclusion, www.ocsi.co.uk, [email protected], 0870 240 1474.
145
Map 12.5 Showing the Barriers to Housing and Services domain of the Index of Multiple Deprivation 2004 across the county, with rankings based on the distribution across England.
Source: OCSI 2005 (from ODPM 2004)

Oxfordshire in Detail Report, Updated September 2005 Oxford Consultants for Social Inclusion, www.ocsi.co.uk, [email protected], 0870 240 1474.
146
Map 12.6 Showing the Income Deprivation Affecting Older People supplement to the Index of Multiple Deprivation 2004 across the county, with rankings based on the distribution across the county.
Source: OCSI 2005 (from ODPM 2004)

Oxfordshire in Detail Report, Updated September 2005 Oxford Consultants for Social Inclusion, www.ocsi.co.uk, [email protected], 0870 240 1474.
147
12.2 Employment Deprivation The Employment Deprivation domain measures those people who are of working age and involuntarily excluded from the labour market, and is assigned 22.5% of the weight of the IMD 2004. The indicators included in the domain are the unemployed claimant count, claimants of Incapacity Benefit and Severe Disablement Allowance who are below pensionable age, participants in New Deal for 18-24s and New Deal for 25+ who are not included in the claimant count, and participants in New Deal for Lone Parents. This collection of indicators represents a change from the IMD 2000 in its inclusion of participants in New Deal for Lone Parents.
As the indicators in the Employment Deprivation domain are composed of the proportion of the working age population that is workless through unemployment or sickness or participating in a New Deal programme, the resulting domain score is, straightforwardly, the proportion of the working age population who are experiencing employment deprivation.
Chart 12.3 shows the Employment domain score (i.e. the proportion of the population experiencing employment deprivation) for the twenty SOAs with the highest score across the county.
Chart 12.3 ID 2004 Employment domain score, SOAs with the highest scores across the county
0.000.020.040.060.080.100.120.140.160.180.20
Little
more E010
2855
3 (O)
Northfie
ld Brook E
0102
8568
(O)
Northfie
ld Brook E
0102
8569
(O)
Blackb
ird Le
ys E01
02851
8 (O)
Rose H
ill an
d Iffle
y E01
02857
7 (O)
Barton
and S
andh
ills E
0102
8513
(O)
Churchil
l E01
02852
4 (O)
Barton
and S
andh
ills E
0102
8514
(O)
Carfax E
0102
8522
(O)
Banbu
ry Grim
sbury
and C
astle E
01028
435 (
C)
Blackb
ird Le
ys E01
02852
0 (O)
Banbu
ry Rus
cote
E0102
8454
(C)
Iffley
Fields
E0102
8546
(O)
Banbu
ry Rus
cote
E0102
8450
(C)
Banbu
ry Rus
cote
E0102
8449
(C)
Rose H
ill an
d Iffle
y E01
02857
6 (O)
Northfie
ld Brook E
0102
8567
(O)
Hinksey
Park
E01028
543 (
O)
Little
more E010
2855
2 (O)
Heading
ton H
ill and
Nort
hway E
0102
8538
(O)
2004
Inde
x S
core
Source: OCSI 2005 (from ODPM 2004)
As seen with the full IMD 2004 index, the majority of highly deprived areas are in the city of Oxford – the nine SOAs with the highest Employment domain rates are all in Oxford, with 16 of the twenty shown in Oxford, and the remaining four in Banbury (Cherwell district). It is clear that the areas of high employment deprivation are concentrated in the counties largest two urban areas of Oxford and Banbury.
Map 12.3 above shows the ID 2004 Employment domain score across the county. The ten colour coded intervals represent deciles based on the distribution across the county. Therefore, those SOAs in Map 12.3 that are coloured the darkest shade of blue are in
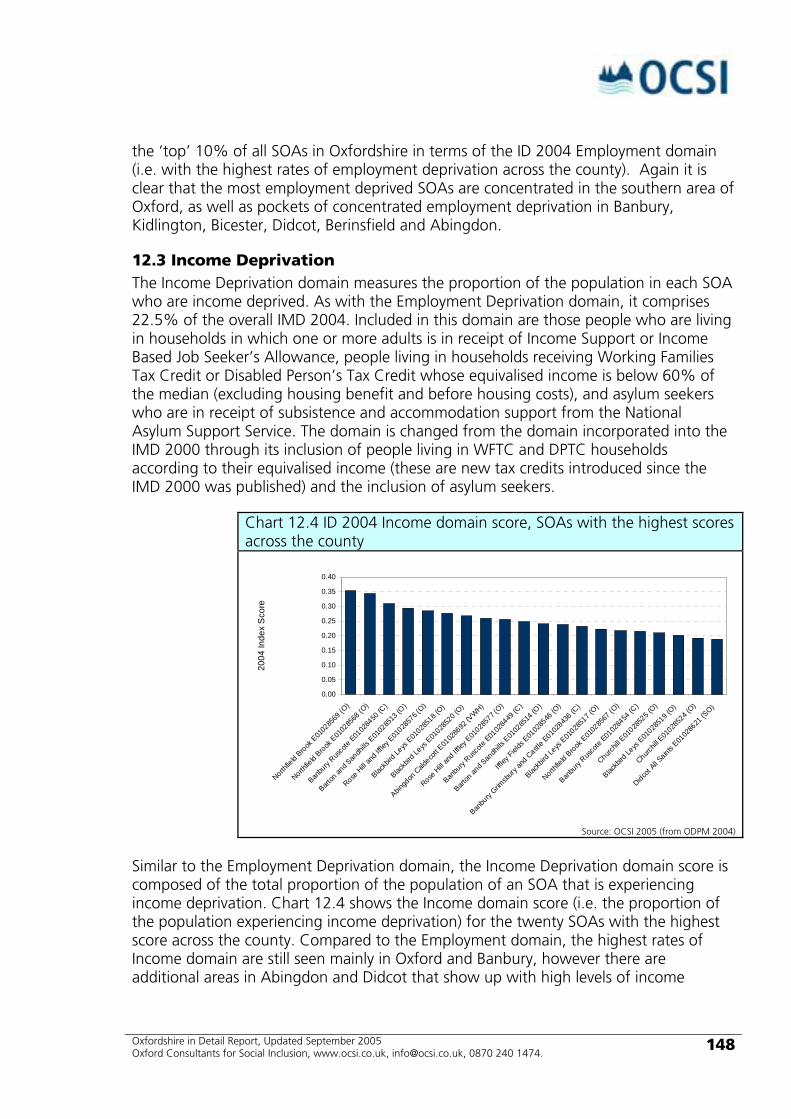
Oxfordshire in Detail Report, Updated September 2005 Oxford Consultants for Social Inclusion, www.ocsi.co.uk, [email protected], 0870 240 1474.
148
the ‘top’ 10% of all SOAs in Oxfordshire in terms of the ID 2004 Employment domain (i.e. with the highest rates of employment deprivation across the county). Again it is clear that the most employment deprived SOAs are concentrated in the southern area of Oxford, as well as pockets of concentrated employment deprivation in Banbury, Kidlington, Bicester, Didcot, Berinsfield and Abingdon.
12.3 Income Deprivation The Income Deprivation domain measures the proportion of the population in each SOA who are income deprived. As with the Employment Deprivation domain, it comprises 22.5% of the overall IMD 2004. Included in this domain are those people who are living in households in which one or more adults is in receipt of Income Support or Income Based Job Seeker’s Allowance, people living in households receiving Working Families Tax Credit or Disabled Person’s Tax Credit whose equivalised income is below 60% of the median (excluding housing benefit and before housing costs), and asylum seekers who are in receipt of subsistence and accommodation support from the National Asylum Support Service. The domain is changed from the domain incorporated into the IMD 2000 through its inclusion of people living in WFTC and DPTC households according to their equivalised income (these are new tax credits introduced since the IMD 2000 was published) and the inclusion of asylum seekers.
Chart 12.4 ID 2004 Income domain score, SOAs with the highest scores across the county
0.00
0.05
0.10
0.15
0.20
0.25
0.30
0.35
0.40
Northfie
ld Brook E
0102
8569
(O)
Northfie
ld Brook E
0102
8568
(O)
Banbu
ry Rus
cote
E0102
8450
(C)
Barton
and S
andh
ills E
0102
8513
(O)
Rose H
ill an
d Iffle
y E01
02857
6 (O)
Blackb
ird Le
ys E01
02851
8 (O)
Blackb
ird Le
ys E01
02852
0 (O)
Abingd
on C
aldeco
tt E01
0286
92 (V
WH)
Rose H
ill an
d Iffle
y E01
02857
7 (O)
Banbu
ry Rus
cote
E0102
8449
(C)
Barton
and S
andh
ills E
0102
8514
(O)
Iffley
Fields
E0102
8546
(O)
Banbu
ry Grim
sbury
and C
astle E
01028
436 (
C)
Blackb
ird Le
ys E01
02851
7 (O)
Northfie
ld Brook E
0102
8567
(O)
Banbu
ry Rus
cote
E0102
8454
(C)
Churchil
l E01
02852
5 (O)
Blackb
ird Le
ys E01
02851
9 (O)
Churchil
l E01
02852
4 (O)
Didcot A
ll Saints
E0102
8621
(SO)
2004
Inde
x S
core
Source: OCSI 2005 (from ODPM 2004)
Similar to the Employment Deprivation domain, the Income Deprivation domain score is composed of the total proportion of the population of an SOA that is experiencing income deprivation. Chart 12.4 shows the Income domain score (i.e. the proportion of the population experiencing income deprivation) for the twenty SOAs with the highest score across the county. Compared to the Employment domain, the highest rates of Income domain are still seen mainly in Oxford and Banbury, however there are additional areas in Abingdon and Didcot that show up with high levels of income
Oxfordshire in Detail Report, Updated September 2005 Oxford Consultants for Social Inclusion, www.ocsi.co.uk, [email protected], 0870 240 1474.
149
deprivation. In the two areas with the highest scores, both in Northfield Brook ward in Oxford, more than one in three people are experiencing income deprivation.
Map 12.4 above shows the ID 2004 Income domain score across the county. The ten colour coded intervals represent deciles based on the distribution across the county. Therefore, those SOAs in Map 12.4 that are coloured the darkest shade of blue are in the ‘top’ 10% of all SOAs in Oxfordshire in terms of the ID 2004 Income domain (i.e. with the highest rates of income deprivation across the county). Similar to the distribution of the ID 2004 Employment domain (Map 12.3) it is clear that the most employment deprived SOAs are concentrated in the southern area of Oxford, as well as pockets of concentrated employment deprivation in Banbury, Kidlington, Bicester, Didcot, Berinsfield and Abingdon.
12.4 Health Deprivation and Disability The Health Deprivation and Disability domain measures areas with higher than expected levels of premature mortality or greater than expected concentrations of people experiencing poor health. This domain is allocated 13.5% of the weight of the total IMD 2004. The first three indicators included are years of potential life lost, a comparative illness and disability ratio and measures of emergency hospital admissions. Each of these indicators is an age and sex standardised rate. The fourth indicator in the domain is the concentration of adults aged 18-60 who are suffering from mood or anxiety disorders, as measured by hospital episode, suicide, prescription and health benefits data. Neither hospital admissions data nor a measure of mental illness were included in the IMD 2000. The inclusion of these new indicators as well as the refinement of techniques measuring death, illness and disability at small area level make this domain a better measure of health deprivation and disability at small area level.
Chart 12.5 shows the Health domain rank4 for the twenty SOAs with the highest rank across the county. One SOA, in the Carfax ward in the centre of Oxford, is significantly more deprived than any other area in the county, and is in the most deprived 1% of all SOAs across England in terms of health deprivation. This is explored further in the Health Section 8 in this report, but is likely due to the large number of homeless hostels in the area. Of the 20 most deprived SOAs across the county on the Health domain, 18 are in Oxford City, while two are in Banbury in the Cherwell district. Indeed, just seven of the 40 SOAs that make up the most deprived 10% of the SOAs across Oxfordshire are outside of Oxford City; all of these seven are in Banbury, in the Cherwell district
4 By contrast with the Income and Employment domains above, the Health domain score (and indeed the scores for the other domains of Education, Crime, Living Environment, and Barriers to Housing and Services) is not straightforwardly the proportion of people suffering deprivation. For that reason we use the ranked scores rather than the actual scores for analysis.

Oxfordshire in Detail Report, Updated September 2005 Oxford Consultants for Social Inclusion, www.ocsi.co.uk, [email protected], 0870 240 1474.
150
Chart 12.5 ID 2004 Health domain national percentage rank, SOAs with the highest ranks across the county
0.0%
5.0%
10.0%
15.0%
20.0%
25.0%
30.0%
35.0%
Carfax E
0102
8522
(O)
Northfie
ld Brook E
0102
8569
(O)
Little
more E010
2855
3 (O)
Barton
and S
andh
ills E
0102
8513
(O)
St Mary
's E01
0285
87 (O
)
Rose H
ill an
d Iffle
y E01
02857
7 (O)
Blackb
ird Le
ys E01
02851
8 (O)
Northfie
ld Brook E
0102
8568
(O)
Banbu
ry Grim
sbury
and C
astle E
01028
435 (
C)
Barton
and S
andh
ills E
0102
8514
(O)
Little
more E010
2855
2 (O)
St Clem
ent's E
0102
8579
(O)
Cowley M
arsh E
0102
8532
(O)
Blackb
ird Le
ys E01
02852
0 (O)
St Mary
's E01
0285
86 (O
)
Churchil
l E01
02852
4 (O)
Northfie
ld Brook E
0102
8567
(O)
St Clem
ent's E
0102
8582
(O)
Rose H
ill an
d Iffle
y E01
02857
6 (O)
Banbu
ry Neit
hrop E
0102
8448
(C)
Nat
iona
l per
cent
age
rank
ing
National Percentage ranks is the rank as the percentage of all areas in England
0% is most deprived 100% is the least deprived percentage rank in England Source: OCSI 2005 (from ODPM 2004)
12.5 Education, Skills and Training Deprivation The Education, Skills and Training domain is divided into two parts, or sub-domains. The first relates to children and young people and measures the average point score of children at Key Stages 2, 3, and 4, the secondary school absence rate, the proportion of young people not staying on in school over age 16 and the proportion of young people aged under 21 who are not entering higher education. The second sub-domain measures the proportion of working age adults (aged 25-54, i.e. generally post-higher education and below retirement) who have no or low qualifications as measured by the 2001 Census. The domain is allocated 13.5% of the overall IMD 2004. The availability of individual pupil level Key Stage data and individual level Census data for adults, make this domain a marked improvement on its predecessor in the IMD 2000.
Chart 12.6 shows the Education domain rank for the twenty SOAs with the highest rank across the county. Comparison with Chart 12.5 shows that there is a marked increase in the numbers of deprived SOAs across the country when looking at Education deprivation compared with Health deprivation – all of the twenty SOAs in the county with the highest levels of Educational deprivation are in the top 10% of the SOAs across England (i.e. all are ranked higher than 3,000 out of 32,482 SOAs across England).
Of the twenty SOAs with the highest levels of Educational deprivation across the county, ten are in Oxford and six in Banbury, with the remaining four in Bicester (two SOAs), Abingdon and Berinsfield.
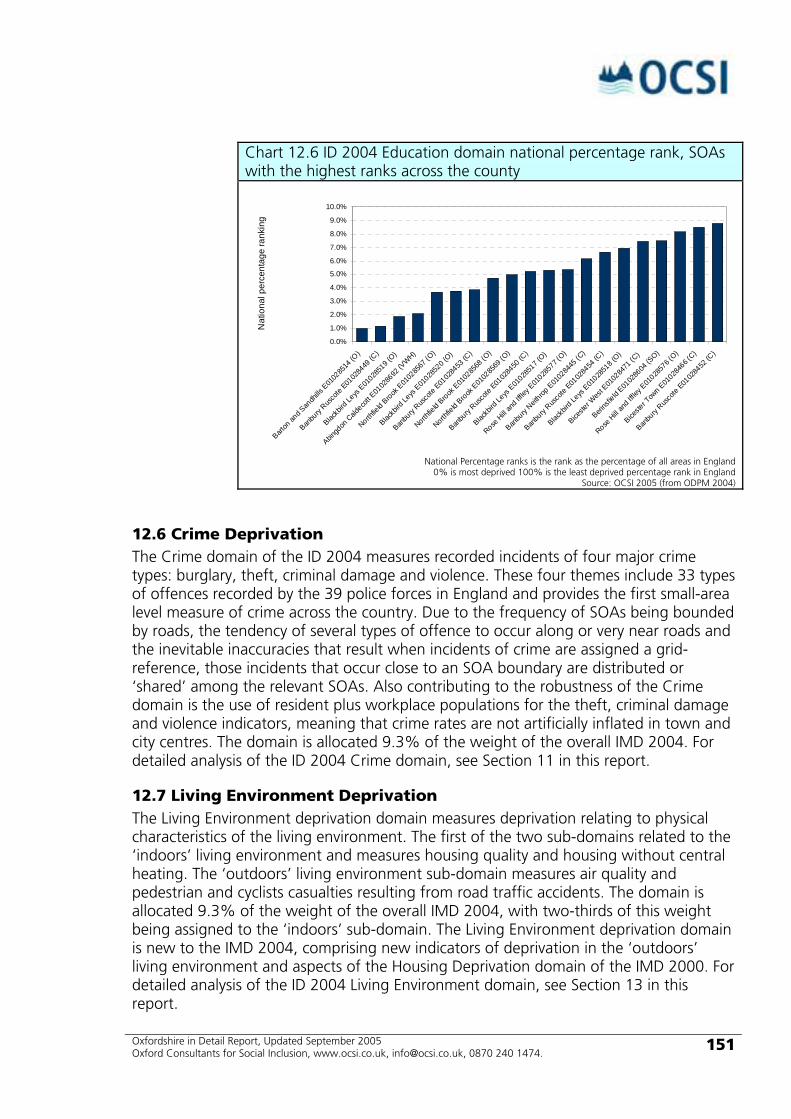
Oxfordshire in Detail Report, Updated September 2005 Oxford Consultants for Social Inclusion, www.ocsi.co.uk, [email protected], 0870 240 1474.
151
Chart 12.6 ID 2004 Education domain national percentage rank, SOAs with the highest ranks across the county
0.0%
1.0%
2.0%
3.0%
4.0%
5.0%
6.0%
7.0%
8.0%
9.0%
10.0%
Barton
and S
andh
ills E
0102
8514
(O)
Banbu
ry Rus
cote
E0102
8449
(C)
Blackb
ird Le
ys E01
02851
9 (O)
Abingd
on C
aldeco
tt E01
0286
92 (V
WH)
Northfie
ld Brook E
0102
8567
(O)
Blackb
ird Le
ys E01
02852
0 (O)
Banbu
ry Rus
cote
E0102
8453
(C)
Northfie
ld Brook E
0102
8568
(O)
Northfie
ld Brook E
0102
8569
(O)
Banbu
ry Rus
cote
E0102
8450
(C)
Blackb
ird Le
ys E01
02851
7 (O)
Rose H
ill an
d Iffle
y E01
02857
7 (O)
Banbu
ry Neit
hrop E
0102
8445
(C)
Banbu
ry Rus
cote
E0102
8454
(C)
Blackb
ird Le
ys E01
02851
8 (O)
Biceste
r Wes
t E01
0284
71 (C
)
Berins
field
E0102
8604
(SO)
Rose H
ill an
d Iffle
y E01
02857
6 (O)
Biceste
r Tow
n E01
02846
6 (C)
Banbu
ry Rus
cote
E0102
8452
(C)
Nat
iona
l per
cent
age
rank
ing
National Percentage ranks is the rank as the percentage of all areas in England
0% is most deprived 100% is the least deprived percentage rank in England Source: OCSI 2005 (from ODPM 2004)
12.6 Crime Deprivation The Crime domain of the ID 2004 measures recorded incidents of four major crime types: burglary, theft, criminal damage and violence. These four themes include 33 types of offences recorded by the 39 police forces in England and provides the first small-area level measure of crime across the country. Due to the frequency of SOAs being bounded by roads, the tendency of several types of offence to occur along or very near roads and the inevitable inaccuracies that result when incidents of crime are assigned a grid-reference, those incidents that occur close to an SOA boundary are distributed or ‘shared’ among the relevant SOAs. Also contributing to the robustness of the Crime domain is the use of resident plus workplace populations for the theft, criminal damage and violence indicators, meaning that crime rates are not artificially inflated in town and city centres. The domain is allocated 9.3% of the weight of the overall IMD 2004. For detailed analysis of the ID 2004 Crime domain, see Section 11 in this report.
12.7 Living Environment Deprivation The Living Environment deprivation domain measures deprivation relating to physical characteristics of the living environment. The first of the two sub-domains related to the ‘indoors’ living environment and measures housing quality and housing without central heating. The ‘outdoors’ living environment sub-domain measures air quality and pedestrian and cyclists casualties resulting from road traffic accidents. The domain is allocated 9.3% of the weight of the overall IMD 2004, with two-thirds of this weight being assigned to the ‘indoors’ sub-domain. The Living Environment deprivation domain is new to the IMD 2004, comprising new indicators of deprivation in the ‘outdoors’ living environment and aspects of the Housing Deprivation domain of the IMD 2000. For detailed analysis of the ID 2004 Living Environment domain, see Section 13 in this report.
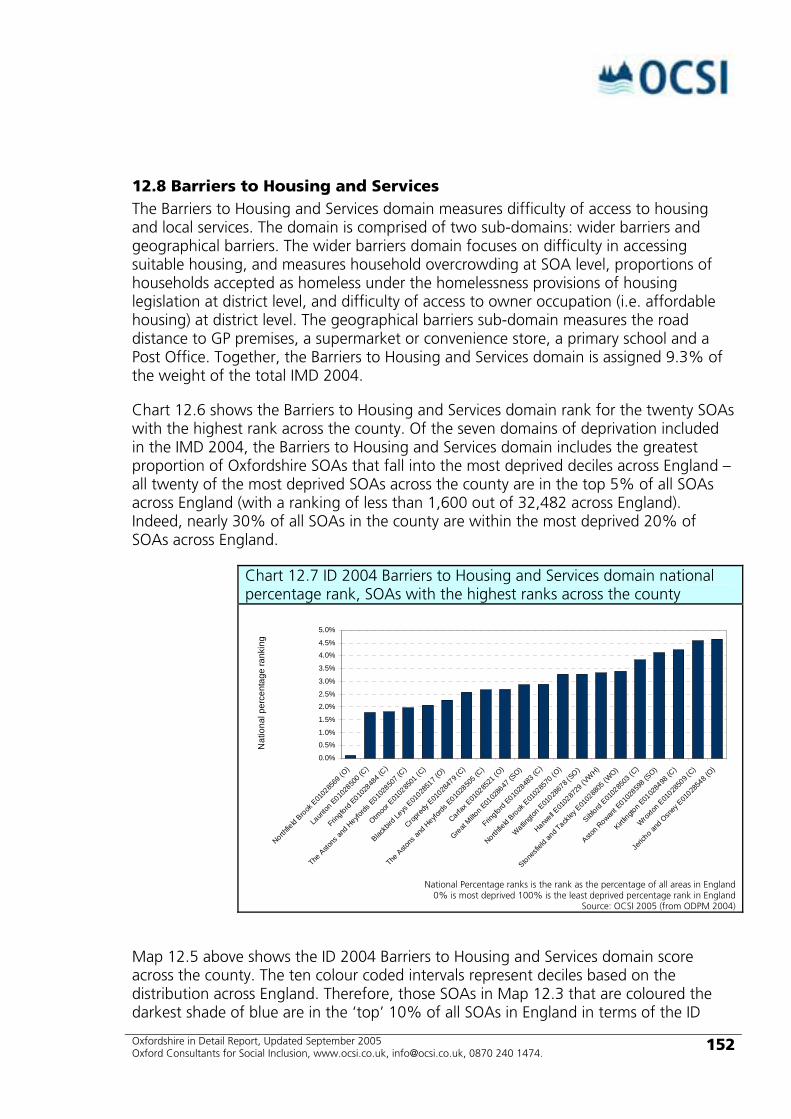
Oxfordshire in Detail Report, Updated September 2005 Oxford Consultants for Social Inclusion, www.ocsi.co.uk, [email protected], 0870 240 1474.
152
12.8 Barriers to Housing and Services The Barriers to Housing and Services domain measures difficulty of access to housing and local services. The domain is comprised of two sub-domains: wider barriers and geographical barriers. The wider barriers domain focuses on difficulty in accessing suitable housing, and measures household overcrowding at SOA level, proportions of households accepted as homeless under the homelessness provisions of housing legislation at district level, and difficulty of access to owner occupation (i.e. affordable housing) at district level. The geographical barriers sub-domain measures the road distance to GP premises, a supermarket or convenience store, a primary school and a Post Office. Together, the Barriers to Housing and Services domain is assigned 9.3% of the weight of the total IMD 2004.
Chart 12.6 shows the Barriers to Housing and Services domain rank for the twenty SOAs with the highest rank across the county. Of the seven domains of deprivation included in the IMD 2004, the Barriers to Housing and Services domain includes the greatest proportion of Oxfordshire SOAs that fall into the most deprived deciles across England – all twenty of the most deprived SOAs across the county are in the top 5% of all SOAs across England (with a ranking of less than 1,600 out of 32,482 across England). Indeed, nearly 30% of all SOAs in the county are within the most deprived 20% of SOAs across England.
Chart 12.7 ID 2004 Barriers to Housing and Services domain national percentage rank, SOAs with the highest ranks across the county
0.0%
0.5%
1.0%
1.5%
2.0%
2.5%
3.0%
3.5%
4.0%
4.5%
5.0%
Northfie
ld Brook E
0102
8569
(O)
Laun
ton E010
2850
0 (C)
Fringford
E01028
484 (
C)
The A
stons
and H
eyfords
E01028
507 (
C)
Otmoo
r E01
0285
01 (C
)
Blackb
ird Le
ys E01
02851
7 (O)
Cropred
y E01
02847
9 (C)
The A
stons
and H
eyfords
E01028
505 (
C)
Carfax E
0102
8521
(O)
Great Milto
n E01
0286
47 (S
O)
Fringford
E01028
483 (
C)
Northfie
ld Brook E
0102
8570
(O)
Watlingto
n E01028
678 (
SO)
Harwell E
0102
8729
(VW
H)
Stonesfi
eld an
d Tack
ley E
0102
8805
(WO)
Sibford
E0102
8503
(C)
Aston R
owant E
01028
598 (
SO)
Kirtlingto
n E01
0284
98 (C
)
Wroxton
E01
02850
9 (C)
Jeric
ho and
Osn
ey E01
02854
8 (O)
Nat
iona
l per
cent
age
rank
ing
National Percentage ranks is the rank as the percentage of all areas in England
0% is most deprived 100% is the least deprived percentage rank in England Source: OCSI 2005 (from ODPM 2004)
Map 12.5 above shows the ID 2004 Barriers to Housing and Services domain score across the county. The ten colour coded intervals represent deciles based on the distribution across England. Therefore, those SOAs in Map 12.3 that are coloured the darkest shade of blue are in the ‘top’ 10% of all SOAs in England in terms of the ID

Oxfordshire in Detail Report, Updated September 2005 Oxford Consultants for Social Inclusion, www.ocsi.co.uk, [email protected], 0870 240 1474.
153
2004 Barriers to Housing and Services domain (i.e. with the highest rates of Barriers to Housing and Services across England).
Within the county, Map 12.5 it is the smaller towns outside of Oxford City that are the least deprived on this measure, with the most deprived areas concentrated in Oxford and the rural areas of the four surrounding districts. This is likely to reflect the both the lack of affordable housing across the county, and the lack of access to services in rural areas.
12.9 Income Deprivation Affecting Children The Income Deprivation Affecting Children Index (IDAC) is a supplement to the Income domain (see Section 12.3), but not included in the Income domain as children experiencing income deprivation are already captured when measuring income deprivation. The IDAC Index measures the proportion of children aged under 16 who are living in families that are income deprived, that is receiving Income Support, Income Based Job Seeker’s Allowance, or Working Families Tax Credit or Disabled Person’s Tax Credit whose income is below 60% of the median (see the section on Income Deprivation for more details). For detailed analysis of the IDAC supplemental index, see Section 7.4 in this report.
12.10 Income Deprivation Affecting Older People The Income Deprivation Affecting Older People Index (IDAOP) is also a supplement to the Income domain (see Section 12.3), and similarly not included in the Income domain as income deprived older people are already captured when measuring income deprivation. The IDAOP Index measures the proportion of the 60 and over population in each SOA who are receiving Income Support or Income Based Job Seeker’s Allowance or are the partners of people who receive these benefits.
Chart 12.8Income Deprivation Affecting Older People score, SOAs with the highest scores across the county
0.00
0.05
0.10
0.15
0.20
0.25
0.30
0.35
St Mary
's E01
0285
87 (O
)
Iffley
Fields
E0102
8546
(O)
Northfie
ld Brook E
0102
8568
(O)
Barton
and S
andh
ills E
0102
8514
(O)
St Clem
ent's E
0102
8582
(O)
Carfax E
0102
8522
(O)
Banbu
ry Hard
wick E01
02844
1 (C)
Cowley M
arsh E
0102
8532
(O)
Rose H
ill an
d Iffle
y E01
02857
6 (O)
Banbu
ry Rus
cote
E0102
8454
(C)
Blackb
ird Le
ys E01
02852
0 (O)
Banbu
ry Grim
sbury
and C
astle E
01028
436 (
C)
Barton
and S
andh
ills E
0102
8513
(O)
Churchil
l E01
02852
5 (O)
Abingd
on C
aldeco
tt E01
0286
92 (V
WH)
Banbu
ry Neit
hrop E
0102
8448
(C)
Banbu
ry Rus
cote
E0102
8449
(C)
Caversf
ield E
01028
478 (
C)
Jeric
ho and
Osn
ey E01
02855
0 (O)
Banbu
ry Grim
sbury
and C
astle E
01028
435 (
C)
2004
Inde
x S
core
Source: OCSI 2005 (from ODPM 2004)
Oxfordshire in Detail Report, Updated September 2005 Oxford Consultants for Social Inclusion, www.ocsi.co.uk, [email protected], 0870 240 1474.
154
Chart 12.8 shows the Income Deprivation Affecting Older People score (i.e. the proportion of people aged 60 and over experiencing income deprivation) for the twenty SOAs with the highest score across the county. Nine areas show scores above 0.25 – in these areas more than one in four people aged 60 and over are experiencing income deprivation. Eight of these areas are in Oxford, and one in Banbury (Cherwell district). Other areas showing high levels of income deprivation among people aged 60 and over are in Abingdon and the Caversfield ward in the Cherwell district.
Map 12.6 above shows the IDAOP score across the county. The ten colour coded intervals represent deciles based on the distribution across the county. Therefore, those SOAs in Map 12.3 that are coloured the darkest shade of blue are in the ‘top’ 10% of all SOAs in Oxfordshire in terms of the IDAOP (i.e. with the highest proportions of income deprived older people across the county). It is clear that those SOAs that have the largest proportions of income deprived people aged 60 and over are located in the city of Oxford as well as in the towns of Banbury, Kidlington, Abingdon, Didcot, Witney and Chipping Norton.
12.11 Section summary Overall Oxfordshire shows relatively low levels of deprivation when compared with England as a whole. however there are clusters of more deprived areas across the county.
Across Oxfordshire, the areas experiencing the highest levels of multiple deprivation as measured by the IMD 2004 are concentrated in the south east of the city of Oxford. The component domains of deprivation reveal that many areas in the south east of the city, particularly in the Northfield Brook and Blackbird Leys wards, are also experiencing high levels of employment, income, health and disability and education skills and training deprivation. Areas of Banbury are also experiencing high levels of multiple deprivation, and there are also pockets of deprivation across the county in areas such as Berinsfield, Kidlington, Abingdon, Didcot, Witney and Chipping Norton. Looking at the Barriers to Housing and Services, there are also large parts of Oxford and rural Oxfordshire that are highly deprived, due to the lack of affordable housing and the lack of access to services.

Oxfordshire in Detail Report, Updated September 2005 Oxford Consultants for Social Inclusion, www.ocsi.co.uk, [email protected], 0870 240 1474.
155
Section 13 Other information: The living environment
The environment experienced by people plays a large part in their quality of life, with poor environment a significant factor in multiple deprivation. Although it is not straightforward to quantify the quality of environment, looking at factors such as air pollution can help us identify areas where populations are at greater risk of social exclusion through poor environment.
The two sources of information used in this section are the Indices of Deprivation 2004 Living Environment domain, and estimates of airborne pollutant concentrations from the Department for Environment, Food and Rural Affairs. See the Background: Environmental information box below for more details.
13.1 The ID 2004 Living Environment domain Map 13.1 below shows the ID 2004 Living Environment score for each SOA in Oxfordshire. The ten colour coded intervals represent deciles and are based on the distribution across England. Therefore, those SOAs in Map 13.1 that are coloured the darkest shade of blue are in the ‘top’ 10% of all SOAs in England in terms of the ID 2004 Living Environment (i.e. with the highest rates of Living Environment deprivation across England).
From Map 13.1, it is apparent that overall Oxfordshire has relatively low levels of Living Environment deprivation when compared with England as a whole – the majority of areas are in the least deprived deciles (areas that are coloured yellow). However, there are areas in the centre of Oxford and Banbury that do show high levels of environmental deprivation.
Map 13.2 below shows the same ID 2004 Living Environment score information as Map 13.1, except that the ten colour coded intervals represent deciles based on the distribution across the county. Therefore, those SOAs in Map 13.2 that are coloured the darkest shade of blue are in the ‘top’ 10% of all SOAs in Oxfordshire in terms of the ID 2004 Living Environment (i.e. with the highest rates of Living Environment across the county). This enables us to look at the patterns of deprivation within the county, where Map 13.1 helped us to look at deprivation across the county in broader terms of the distribution across England.

Oxfordshire in Detail Report, Updated September 2005 Oxford Consultants for Social Inclusion, www.ocsi.co.uk, [email protected], 0870 240 1474.
156
Background: The living environment
Indices of Deprivation 2004: The Living Environment
The Living Environment deprivation domain measures deprivation relating to physical characteristics of the living environment, and consists of two sub-domains. The first sub-domain is related to the ‘indoors’ living environment and measures housing quality and housing without central heating. The ‘outdoors’ living environment sub-domain measures air quality and pedestrian and cyclists casualties resulting from road traffic accidents.. The Living Environment deprivation domain is new to the IMD 2004, comprising new indicators of deprivation in the ‘outdoors’ living environment as well as aspects of the Housing Deprivation domain from the IMD 2000.
The Indices of Deprivation 2004 information is provided by the Office for the Deputy Prime Minister.
Air quality
Historically, the major causes of air pollution in developed and rapidly industrialising countries has been high levels of smoke and sulphur dioxide emitted from fossil fuel combustion both for industrial and domestic use. However, the situation in highly developed countries is now one where the major threat to clean air is posed by traffic emissions. Petrol- and diesel-powered vehicles emit a wide variety of pollutants, principally carbon monoxide, nitrogen dioxide and nitric oxide, volatile organic compounds such as benzene, and small airborne particulates (PM10).
Carbon monoxide
Carbon monoxide (CO) is a toxic gas emitted as a result of combustion processes, with over 90% emitted as road traffic emissions. It survives in the atmosphere for roughly one month. CO prevents transport of blood to the heart, and can have significant effects in people suffering from heart disease.
Nitrogen oxides
Nitrogen dioxide and nitric oxide (together termed NOx) are formed in high temperature combustion processes, with over 50% of emissions resulting from road traffic, the remaining emissions from power stations and other industrial processes. NOx can lower resistance to respiratory infections such as influenza, and prolonged exposure can cause increased incidence of acute respiratory illness in children.
Estimates of pollutant concentrations across the UK are provided by the UK National Atmospheric Emissions Inventory, on behalf of the Department for Environment, Food and Rural Affairs. These estimates are based on data from monitoring stations across the country, as well as known emission levels from major sources.
It is clear from Map 13.2 that Oxford contains the highest levels of Living Environment deprivation across the county, with significant numbers of SOAs in Banbury. Also Bicester, Abingdon and Didcot show high levels of Living Environment deprivation relative to the rest of the county.
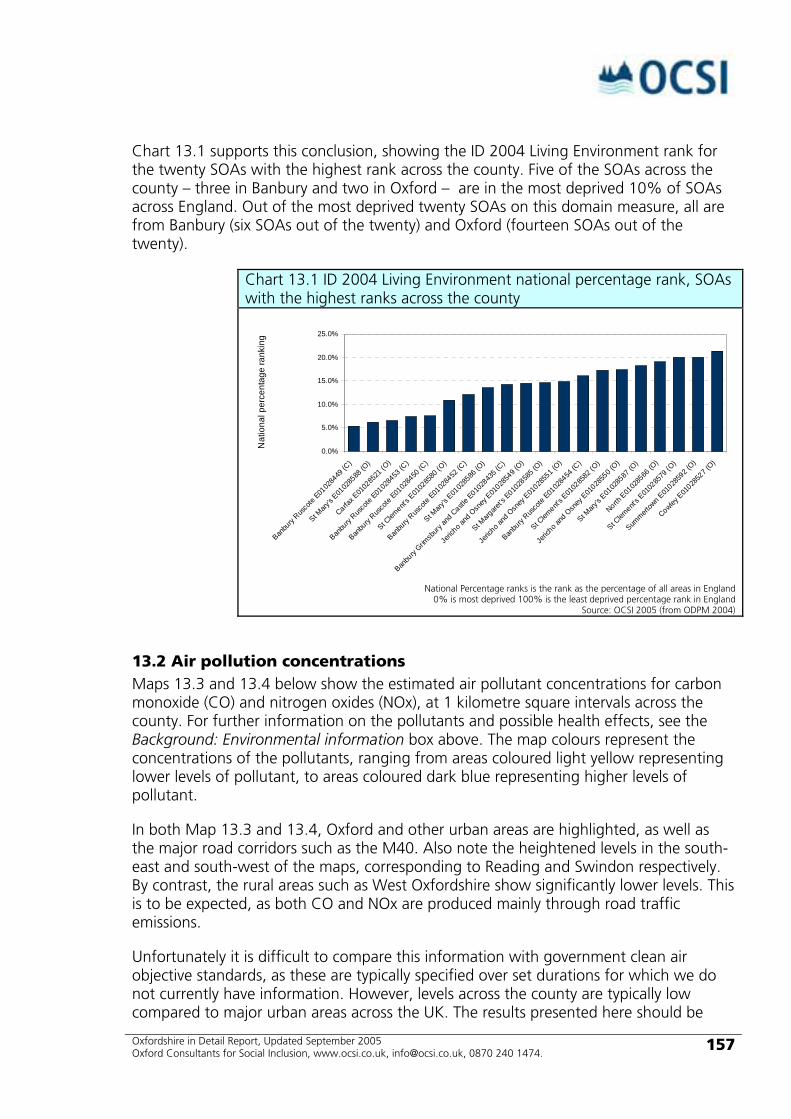
Oxfordshire in Detail Report, Updated September 2005 Oxford Consultants for Social Inclusion, www.ocsi.co.uk, [email protected], 0870 240 1474.
157
Chart 13.1 supports this conclusion, showing the ID 2004 Living Environment rank for the twenty SOAs with the highest rank across the county. Five of the SOAs across the county – three in Banbury and two in Oxford – are in the most deprived 10% of SOAs across England. Out of the most deprived twenty SOAs on this domain measure, all are from Banbury (six SOAs out of the twenty) and Oxford (fourteen SOAs out of the twenty).
Chart 13.1 ID 2004 Living Environment national percentage rank, SOAs with the highest ranks across the county
0.0%
5.0%
10.0%
15.0%
20.0%
25.0%
Banbu
ry Rus
cote
E0102
8449
(C)
St Mary
's E01
0285
88 (O
)
Carfax E
0102
8521
(O)
Banbu
ry Rus
cote
E0102
8453
(C)
Banbu
ry Rus
cote
E0102
8450
(C)
St Clem
ent's E
0102
8580
(O)
Banbu
ry Rus
cote
E0102
8452
(C)
St Mary
's E01
0285
86 (O
)
Banbu
ry Grim
sbury
and C
astle E
01028
435 (
C)
Jeric
ho and
Osn
ey E01
02854
9 (O)
St Marg
aret's
E01028
585 (
O)
Jeric
ho and
Osn
ey E01
02855
1 (O)
Banbu
ry Rus
cote
E0102
8454
(C)
St Clem
ent's E
0102
8582
(O)
Jeric
ho and
Osn
ey E01
02855
0 (O)
St Mary
's E01
0285
87 (O
)
North E01
0285
66 (O
)
St Clem
ent's E
0102
8579
(O)
Summert
own E01
02859
2 (O)
Cowley E01
02852
7 (O)
Nat
iona
l per
cent
age
rank
ing
National Percentage ranks is the rank as the percentage of all areas in England
0% is most deprived 100% is the least deprived percentage rank in England Source: OCSI 2005 (from ODPM 2004)
13.2 Air pollution concentrations Maps 13.3 and 13.4 below show the estimated air pollutant concentrations for carbon monoxide (CO) and nitrogen oxides (NOx), at 1 kilometre square intervals across the county. For further information on the pollutants and possible health effects, see the Background: Environmental information box above. The map colours represent the concentrations of the pollutants, ranging from areas coloured light yellow representing lower levels of pollutant, to areas coloured dark blue representing higher levels of pollutant.
In both Map 13.3 and 13.4, Oxford and other urban areas are highlighted, as well as the major road corridors such as the M40. Also note the heightened levels in the south-east and south-west of the maps, corresponding to Reading and Swindon respectively. By contrast, the rural areas such as West Oxfordshire show significantly lower levels. This is to be expected, as both CO and NOx are produced mainly through road traffic emissions.
Unfortunately it is difficult to compare this information with government clean air objective standards, as these are typically specified over set durations for which we do not currently have information. However, levels across the county are typically low compared to major urban areas across the UK. The results presented here should be
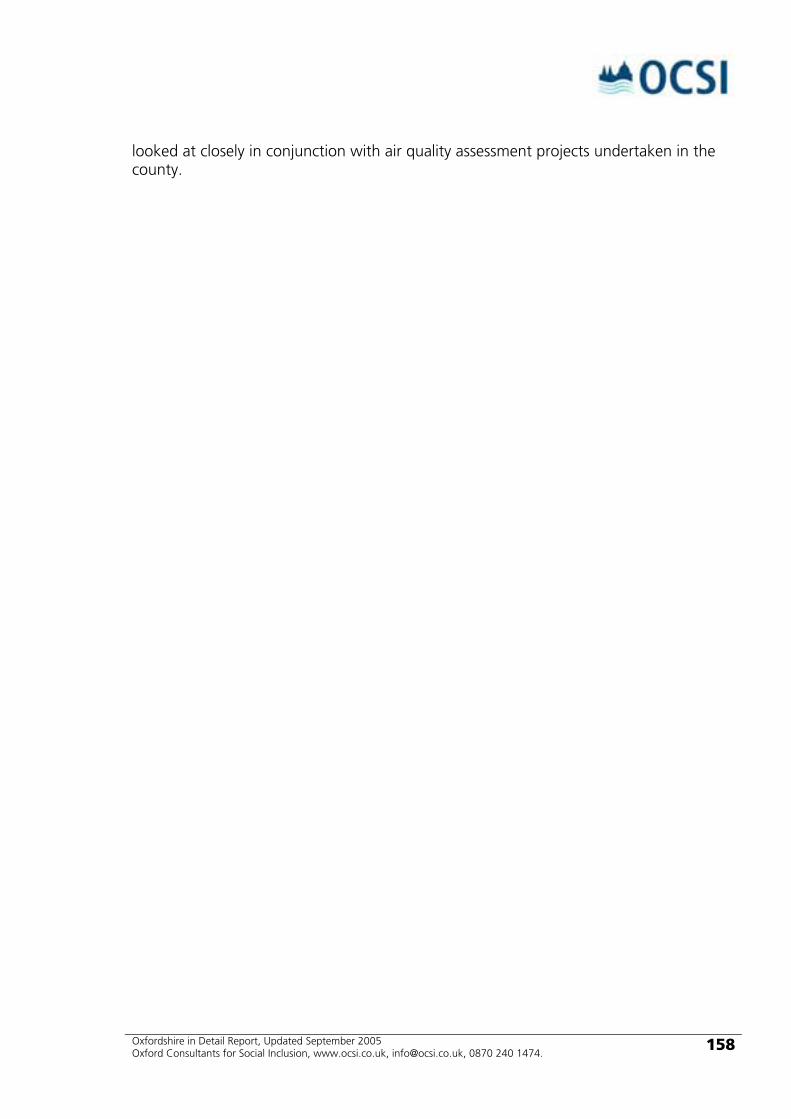
Oxfordshire in Detail Report, Updated September 2005 Oxford Consultants for Social Inclusion, www.ocsi.co.uk, [email protected], 0870 240 1474.
158
looked at closely in conjunction with air quality assessment projects undertaken in the county.

Oxfordshire in Detail Report, Updated September 2005 Oxford Consultants for Social Inclusion, www.ocsi.co.uk, [email protected], 0870 240 1474.
159
Map 13.1 Showing the ID 2004 Living Environment domain across the county, with rankings based on the distribution across England.
Source: OCSI 2005 (from ODPM 2004)
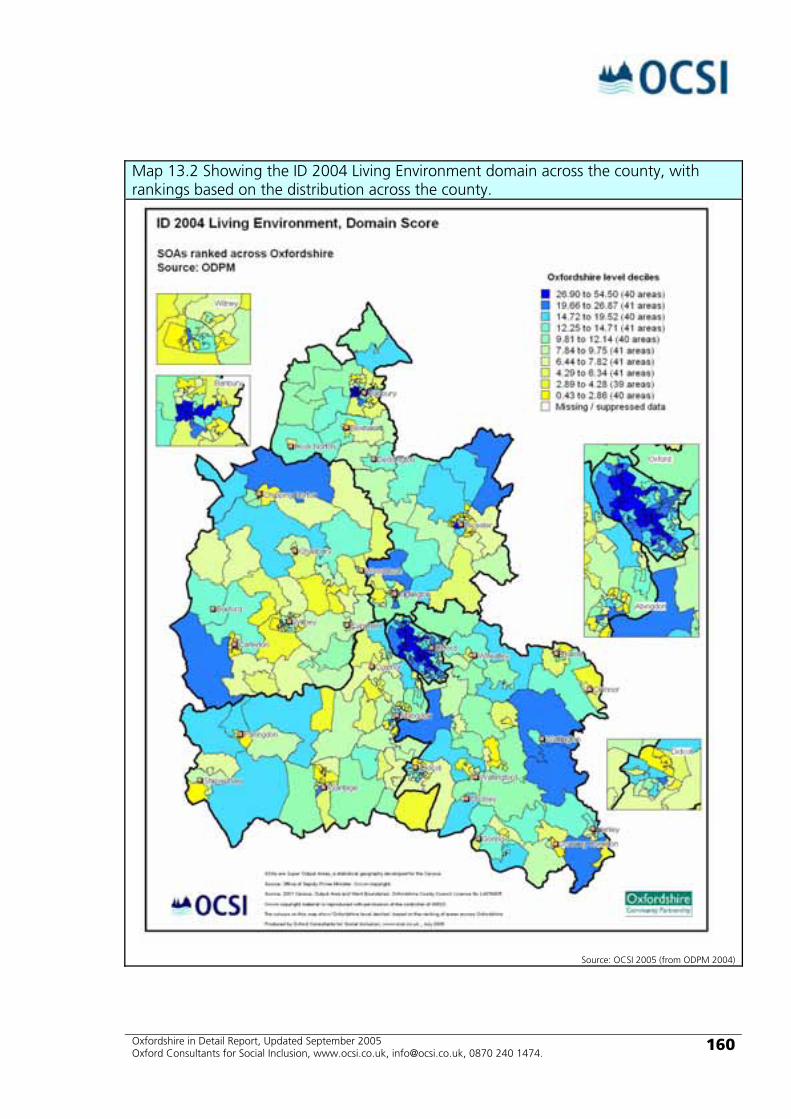
Oxfordshire in Detail Report, Updated September 2005 Oxford Consultants for Social Inclusion, www.ocsi.co.uk, [email protected], 0870 240 1474.
160
Map 13.2 Showing the ID 2004 Living Environment domain across the county, with rankings based on the distribution across the county.
Source: OCSI 2005 (from ODPM 2004)

Oxfordshire in Detail Report, Updated September 2005 Oxford Consultants for Social Inclusion, www.ocsi.co.uk, [email protected], 0870 240 1474.
161
Map 13.3 Showing airborne Carbon Monoxide estimated concentrations across the county at 1x1 Km resolution.
Source: OCSI 2005 (from National Atmospheric Emissions Inventory 2001)
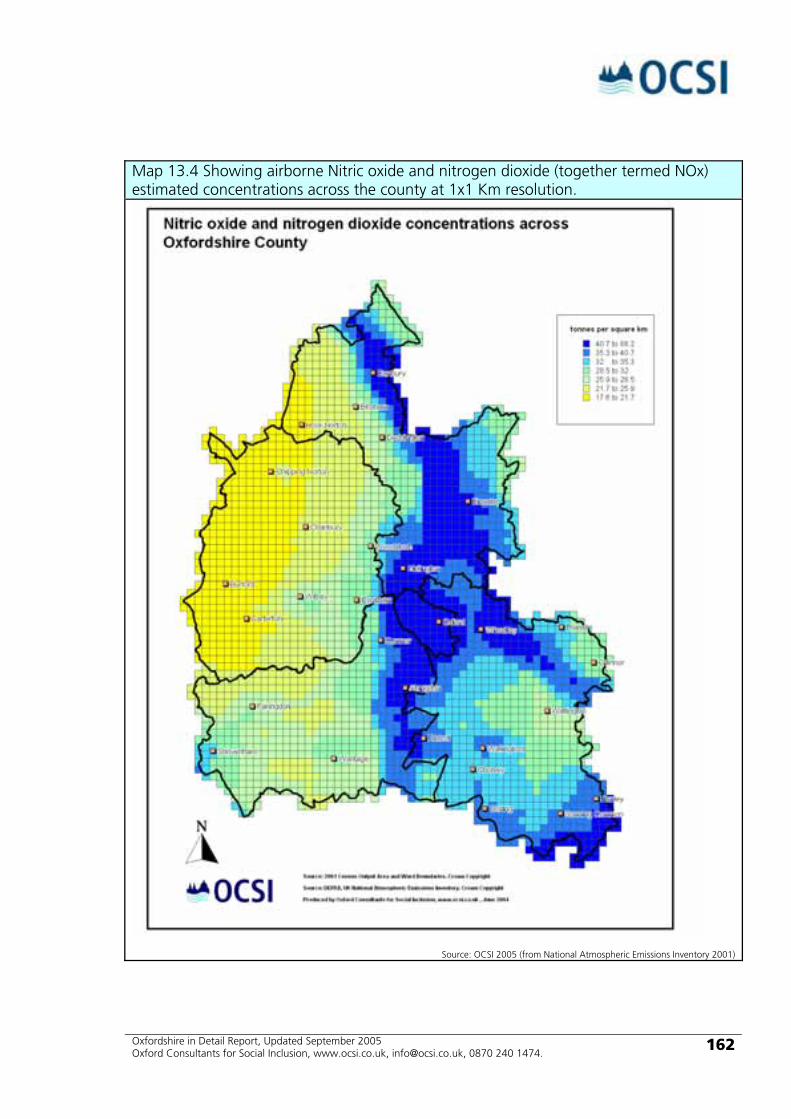
Oxfordshire in Detail Report, Updated September 2005 Oxford Consultants for Social Inclusion, www.ocsi.co.uk, [email protected], 0870 240 1474.
162
Map 13.4 Showing airborne Nitric oxide and nitrogen dioxide (together termed NOx) estimated concentrations across the county at 1x1 Km resolution.
Source: OCSI 2005 (from National Atmospheric Emissions Inventory 2001)
Oxfordshire in Detail Report, Updated September 2005 Oxford Consultants for Social Inclusion, www.ocsi.co.uk, [email protected], 0870 240 1474.
163
Appendix A Data sources and descriptions
A.1 The data sources used in this report The Government and other agencies are in the process of developing and releasing a wealth of small area statistics. Government sources releasing data include Department for Work and Pensions, Home Office; Department of Health; Office for the Deputy Prime Minister, Countryside Agency; National Assembly for Wales; Office for National Statistics; Census 2001; Valuation Office Agency; and the Land Registry.
Much of the information is available through the Office for National Statistics Neighbourhood Statistics website (http://neighbourhood.statistics.gov.uk/), which also provides some information provided by the Social Disadvantage Research Centre at Oxford University, and the University Central Admissions Service.
In addition, OCSI obtains data directly from a number of sources, including the Department of Health, Department for Education and Skills, and the Department for Work and Pensions.
A.2 Data sources by theme The data sources listed here are available at small area level, either ward level, Census Output Area level or Census Super Output level. See the data descriptions by source below for details at which small area levels the information is released. Where relevant, datasets may be shown in more than one theme.
Population Structure
• Population Counts (Census 2001; Mid Year Estimates) • Small-Area Population Estimates (OCSI Derived Statistics) • Age (Census 2001) • Gender (Census 2001) • Ethnicity (Census 2001) • Population Density (Census 2001)
Worklessness
• ID 2004 Employment Domain (ODPM / SDRC) • Jobseeker’s Allowance Claimants (DWP) • Incapacity Benefit Claimants (DWP) • Severe Disablement Allowance Claimants (DWP) • Worklessness Counts and Rates (OCSI Derived Statistics)
Living on a low income
• ID 2004 Income Domain (ODPM / SDRC) • Jobseeker’s Allowance Income-based Claimants (DWP) • Income Support Claimants (DWP)
Oxfordshire in Detail Report, Updated September 2005 Oxford Consultants for Social Inclusion, www.ocsi.co.uk, [email protected], 0870 240 1474.
164
• Income Deprived Counts and Rates (OCSI Derived Statistics) Children living in low income households
• ID 2004 Income Deprivation Affecting Children (ODPM / SDRC) • Jobseeker’s Allowance Income-based Claimants (DWP) • Income Support Claimants (DWP) • Children Living in Low Income Households Counts and Rates (OCSI Derived
Statistics) Health, sickness and disability
• ID 2004 Health Deprivation and Disability Domain (ODPM / SDRC) • Attendance Allowance Claimants (DWP) • Disability Living Allowance Claimants (DWP) • Permanently Sick and Disabled (Census 2001) • Unpaid Carers (Census 2001) • Limiting Long-Term Illness (Census 2001) • People in “Not Good Health” (Census 2001) • People Needing Care (OCSI Derived Statistics) • People Needing Mobility Assistance (OCSI Derived Statistics)
Education and skills
• ID 2004 Education Skills and Training Domain (ODPM / SDRC) • Child Benefit Claimants (DWP) • Full-time Students aged 18-74 (Census 2001) • Adults with No Qualifications (Census 2001) • Pupils Achieving 5 or more A*-C GCSE Levels (Pupil Level Annual School
Census PLASC, DFES) • Pupils Eligible for Free School Meals (Pupil Level Annual School Census
PLASC, DFES) • Staying on at School Estimated Counts and Rates (OCSI Derived Statistics)
Housing and households
• Overcrowded Households (Census 2001) • Households Lacking Amenities (Census 2001) • Households Lacking Central Heating (Census 2001) • Social Rented Households (Census 2001) • Household Type (Census 2001) • Empty Households (Census 2001) • Households of Single Pensioners (Census 2001) • All Student Households (Census 2001) • Households with Dependent Children (Census 2001)
Oxfordshire in Detail Report, Updated September 2005 Oxford Consultants for Social Inclusion, www.ocsi.co.uk, [email protected], 0870 240 1474.
165
• Lone Parent Households (Census 2001) Crime
• ID 2004 Crime and Disorder Domain (ODPM / SDRC) • Recorded Offences (Home Office)
Multiple deprivation
• Indices of Deprivation 2004 (ODPM / SDRC) Other Information ( Living Environment)
• ID 2004 Living Environment Domain (ODPM / SDRC) • Air pollutant concentration estimates (DEFRA)
A.3 Data descriptions by source
Census 2001 (Office for National Statistics)
The 2001 Census was held on 29 April 2001. It provides essential statistical information, enabling the planning and funding of public services, including education, health and transport. Results also support research and business.
Information is available from the national level down to Census Output Area level.
Mid Year Estimates (Office for National Statistics)
The Office for National Statistics publishes annual estimates of the population at district level and upwards. The estimates are available at local authority / health area level by 5-year age group and sex, including additional selected age groups.
The estimated resident population of an area includes all people who usually live there, whatever their nationality. Members of HM and US Armed Forces in England and Wales are included on a residential basis wherever possible. HM Forces stationed outside England and Wales are not included. Students are taken to be resident at their term time address.
Information is available from the national level down to district level.
Pupil Level Annual School Census PLASC (Department for Education and Skills)
Since January 2002 it has been a statutory requirement for all maintained primary, middle, secondary and special schools to provide an electronic pupil level school census return. This process is called the pupil level annual school census (PLASC). From January 2003, information was also collected on independent special schools.
Oxfordshire in Detail Report, Updated September 2005 Oxford Consultants for Social Inclusion, www.ocsi.co.uk, [email protected], 0870 240 1474.
166
Pupil level data collected via PLASC each year is matched by DfES to Key Stage attainment data and used to produce statistical analyses of performance by pupils to help school improvement strategies. No data at pupil level is published by schools, LEAs or the DfES and all data is held under the strictest security arrangements.
Information is available from the national level down to 2003 ward level.
Air pollutant concentration estimates (Department for Environment, Food and Rural Affairs)
The Department for Environment, Food and Rural Affairs (DEFRA) operate a network of monitoring stations tracking statistics on a range of air pollutant concentrations. Estimates of emissions at small area level are produced by the UK National Atmospheric Emissions Inventory (NAEI) on behalf of DEFRA.
Information is available at 1x1 kilometre resolution across the United Kingdom.
Child Benefit (Department for Work and Pensions)
Child Benefit was introduced in 1977. It replaced Family Allowance which was a benefit payable to families with 2 or more children. Child Benefit bought all children into the scheme. The benefit is designed to help with the extra costs of bringing up a child. It is a universal benefit payable to all parents/guardians in Great Britain. The benefit is not income related, is not taxable and is not based on National Insurance Contributions. Child Benefit is payable to the parents or guardians of all children under 16 years of age, normally the mother. If a child, over 16, is in full-time education, the benefit may be paid until they reach 19. Child benefit is also paid for a short period to 16 or 17 year olds who have just left school and are registered for work or work based training. There is a higher payment for the eldest child and a lower rate for all subsequent children.
Information is available from the national level down to 2003 ward level.
Income Support (Department for Work and Pensions)
Income Support (IS) is a non-contributory benefit. From October 1996, the Jobseeker's Allowance replaced IS for unemployed people. In general IS is now only available to people who are not required to be available for work such as pensioners, lone parents, sick and disabled people.
Information is available from the national level down to 2003 ward level.
Jobseeker's Allowance (Department for Work and Pensions)
Jobseeker's Allowance (JSA) replaced Unemployment Benefit and Income Support for unemployed people in October 1996. It is payable to people under pensionable age who are available for, and actively seeking, work of at least 40 hours a week. Certain groups of people may be able to restrict their availability to less than 40 hours depending upon their personal circumstances. There are contribution-based and income-based routes of entry to JSA, which is paid at standard rates. Those who have paid sufficient National
Oxfordshire in Detail Report, Updated September 2005 Oxford Consultants for Social Inclusion, www.ocsi.co.uk, [email protected], 0870 240 1474.
167
Insurance contributions receive contribution-based JSA for up to six months. Those who do not qualify for, or whose needs are not met by, contribution-based JSA, may qualify for income-based help for themselves and their dependants. There is the additional condition for income-based JSA that if a person has a working partner then that partner must work less than 24 hours a week on average. This help will continue for as long as it is needed, provided that the qualifying conditions continue to be met.
Information is available from the national level down to 2003 ward level.
Attendance Allowance (Department for Work and Pensions)
Attendance Allowance, introduced in December 1971, is a weekly benefit for people aged 65 or over, who need help with personal care because of illness or disability. For example, a person may qualify for Attendance Allowance if they have difficulty with washing, dressing or similar tasks.
Information is available from the national level down to 2003 ward level.
Disability Allowance (Department for Work and Pensions)
Disability Living Allowance (DLA) replaced and extended Attendance Allowance and Mobility Allowance in April 1992. It is paid to people who become disabled before the age of 65.
Information is available from the national level down to 2003 ward level.
Incapacity Benefit (Department for Work and Pensions)
Incapacity Benefit replaced Invalidity and Sickness Benefit in April 1995. It is paid to people who are assessed as being incapable of work and who meet the appropriate contribution conditions.
Information is available from the national level down to 2003 ward level.
Severe Disablement Allowance (Department for Work and Pensions)
Severe Disablement Allowance was introduced in November 1984 to replace the non-contributory Invalidity Pension and Housewives non-contributory Invalidity Pension. It is paid to those who cannot work because of a severe illness or disability but do not satisfy the contribution conditions for Incapacity Benefit. However, a person cannot claim Severe Disablement Allowance if they already get Incapacity Benefit. The benefit is not income related, is not taxable and is not based on National Insurance contributions. Claimants must have been aged between 16 and 65 when they made their claim, though there is no upper limit for receiving the allowance once it is awarded.
Information is available from the national level down to 2003 ward level.
Recorded Offences (Home Office)
Oxfordshire in Detail Report, Updated September 2005 Oxford Consultants for Social Inclusion, www.ocsi.co.uk, [email protected], 0870 240 1474.
168
Notifiable offences recorded by the police. The crime rates are based on resident population and therefore may give a misleading impression in areas where numbers of non-residents, such as commuters and visitors are significant.
Information is available at Crime and Disorder Reduction Partnership (CDRP) level up to national level.
Indices of Deprivation 2004 (Office for the Deputy Prime Minister / Social Disadvantage Research Centre at the University of Oxford)
The Index of Multiple Deprivation 2004 (IMD 2004) is the most up-to-date and comprehensive measure of multiple deprivation available. It is an update and reformulation of the Index of Multiple Deprivation 2000. Drawn primarily from 2001 data and presented at small area level, the Index of Multiple Deprivation 2004 is a unique and invaluable tool for measuring deprivation nationally and across Oxfordshire.
The full Indices of Deprivation 2004 (ID 2004) include the IMD 2004, alongside the seven component domains, two additional older and younger people indices, and a set of district and county summary indices.
• The seven Domain Indices are Income; Employment; Health Deprivation and Disability; Education, Skills and Training; Living Environment; Crime; and Barriers to Housing and Services
• The two additional indices – Income Deprivation Affecting Children Index and Income Deprivation Affecting Older People – are both sub-sets of the Income Domain
• The six district and county level summaries are: o The rank of the population-weighted average of all SOA scores across
the area o The rank of the proportion of the area’s population living in the most
deprived SOAs in England o The rank of the population-weighted average of the SOA ranks,
across the most deprived SOAs in the area containing exactly 10% of the area population
o The rank of the numbers of people across the area experiencing Income Deprivation
o The rank of the numbers of people across the area experiencing Employment Deprivation
o The rank of the population-weighted average of all SOA ranks across the area
Information is available at Census Super Output Area level, along with district and county level summaries.
A.4 OCSI derived statistics Small-Area Population Estimates:

Oxfordshire in Detail Report, Updated September 2005 Oxford Consultants for Social Inclusion, www.ocsi.co.uk, [email protected], 0870 240 1474.
169
See Appendix B below for details.
Information is available from the national level down to Census Output Area level.
Worklessness Counts and Rates
People workless through sickness are those in receipt of Incapacity Benefit or Severe Disablement Allowance. People workless through unemployment are those in receipt of Jobseeker’s Allowance. All workless people are those in receipt of Incapacity Benefit or Severe Disablement Allowance or Jobseeker’s Allowance.
Rates are calculated using the relevant counts and the relevant small-area population estimates.
Information is available from the national level down to 2003 ward level.
Income Deprived Counts and Rates
People living on a low income, or income deprived, are those in receipt of Income Support or Income Based Jobseeker’s Allowance. People aged 60 and over who are in receipt of Income Support receive the Minimum Income Guarantee.
Rates are calculated using the relevant counts and the relevant small-area population estimates.
Information is available from the national level down to 2003 ward level.
Children Living in Low Income Households Counts and Rates
Children living in low income households are dependents of people in receipt of Income Support (no information is currently available from Department for Work and Pensions on dependents of children in receipt of Income Based Jobseekers Allowance).
Rates are calculated using the relevant counts and the relevant small-area population estimates.
Information is available from the national level down to 2003 ward level.
People Needing Care
People needing care are those in receipt of Attendance Allowance or Disability Living Allowance Care component. People needing higher rate of care are those in receipt of Attendance Allowance Higher rate or Disability Living Allowance Higher Rate Care component.
Rates are calculated using the relevant counts and the relevant small-area population estimates.
Information is available from the national level down to 2003 ward level.

Oxfordshire in Detail Report, Updated September 2005 Oxford Consultants for Social Inclusion, www.ocsi.co.uk, [email protected], 0870 240 1474.
170
People Needing Mobility Assistance
People needing mobility assistance are those in receipt of Disability Living Allowance Mobility component. People with special mobility needs are those in receipt of Disability Living Allowance Mobility Higher Rate component.
Rates are calculated using the relevant counts and the relevant small-area population estimates.
Information is available from the national level down to 2003 ward level.
Staying on at School Estimated Counts and Rates
All dependent children remaining in full-time non-advanced education past the age of 16 receive Child Benefit (CB) until the age of 19. Levels of take-up for CB are high, and a fairly robust estimate of the numbers and proportions of pupils staying on in education can be calculated by comparing the total number of children aged 16-18 receiving CB for the post compulsory period with a similar cohort (aged 11-15) at the end of the compulsory stage. This is more accurate than using the resident 16-18 population in the area as the population denominator, as this will include any people who have moved to the area, for example giving very low estimates for staying on rates in areas with large student populations.
The estimated rate of pupils staying on at school is the numbers of children aged 16 and over receiving CB divided by the numbers of children aged 11-15 receiving CB, multiplied by 5/3 factor to give equal weight to each year group.
Information is available from the national level down to 2003 ward level.

Oxfordshire in Detail Report, Updated September 2005 Oxford Consultants for Social Inclusion, www.ocsi.co.uk, [email protected], 0870 240 1474.
171
Appendix B Estimating population denominators at small area level
Why? In order to investigate the patterns of deprivation at small area level, we need to look at the rate of deprivation across the area. Therefore we need to know both the number of people in the area experiencing that form of deprivation, and the total number of people in the area.
The Mid-Year Estimates provided annually by the Office for National Statistics give accurate and up-to-date information on how many people live in each district, county, and region across the country. The estimates are broken down by gender, and five-year bands.
If we want to look at patterns of deprivation across areas smaller than district level, we need to know the numbers of people living in these small areas. The only direct information we have on small area populations is the Census 2001 data, which is provided down to the smallest Census Output Area level. However, this is current only for the Census year 2001, and is not updated annually. In addition, the 2001 Census information is not identical to the Mid Year Estimate for 2001 due to the different times over which the data was collected.
If we want to estimate the populations at small areas for years other than the Census year, or to produce estimates that will be comparable to estimates for years other than the Census year, we use a technique based on the Mid Year Estimate for the district, and the 2001 Census data. This technique enables us to calculate the populations living in any small area, and to use these populations to calculate the proportion of population experiencing different forms of deprivation.
How? We first use the Census 2001 information to calculate the proportion of the district population living in each of the smaller areas, broken down by gender and five-year age bands. We do this by aggregating up the smaller area populations to give a district level total (this will be slightly different to the Census district total due to rounding errors, however by doing this we ensure that the final estimated populations at small area level will sum up to the Mid-Year Estimate over the district), then dividing each of the smaller populations by that total to find the ratio of the district population living in each of the smaller areas. We then assign this proportion of the Mid Year Estimate district population to each of the smaller areas, giving us an estimate of the numbers of people living in each area, broken down by gender and five-year age bands.
The technique is based on the assumption that the proportion of the district population living in each smaller area does not vary over the years following the Census. This will not be true over long periods of time - some smaller areas may see large building projects or much bigger inward or outward migration than other areas - but for years close to the Census it is likely to be reasonably accurate. Having information on change
Oxfordshire in Detail Report, Updated September 2005 Oxford Consultants for Social Inclusion, www.ocsi.co.uk, [email protected], 0870 240 1474.
172
in available housing and amount of inward and outward migration for the smaller areas can improve this population estimate, however this information is difficult to obtain.
The Mid Year Estimates and Census include information on all groups across the area, including people living in households, and people living in communal establishments such as halls of residence, medical and care establishments, prisons, and defence establishments. In some analysis members of these groups such as prisoners are typically excluded, however for the OCSI population estimates used in this report we have used the entire population. This ensures the population estimates are consistent with other work in analysing small area deprivation such as the figures produced by the Department for Work and Pensions.

Oxfordshire in Detail Report, Updated September 2005 Oxford Consultants for Social Inclusion, www.ocsi.co.uk, [email protected], 0870 240 1474.
173
Appendix C Data Tools for Social Inclusion
This report is based upon information contained in the Data Tools for Social Inclusion developed by Oxford Consultants for Social Inclusion (OCSI) for the Oxfordshire Census User Group. The commissioning partners were:
• Oxfordshire County Council • Oxford City Council • Vale of the White Horse District Council • Oxfordshire Primary Care Trusts • Thames Valley Police
The data, tables, charts, and maps used in this report are all contained in the Data Tools, along with comprehensive additional information sets on social inclusion across the county. The Data Tools contain over 360 maps, over 300 charts, and more than one thousand indicators at small area level.
For more information on the Data Tools for Social Inclusion, please visit the OCSI website or contact us:
Post Oxford Consultants for Social Inclusion Ltd (Brighton Office) Suite 6, 68 Middle Street, Brighton BN1 1AL
Web www.ocsi.co.uk/
Tel 0870 240 1474
Email [email protected]
Data Tools www.ocsi.co.uk/data_tools.html

Oxfordshire in Detail Report, Updated September 2005 Oxford Consultants for Social Inclusion, www.ocsi.co.uk, [email protected], 0870 240 1474.
174
Appendix D Indicator Definitions
1 People in receipt of unemployment (Jobseekers Allowance) or sickness (Incapacity Benefit or Severe Disablement Allowance) benefits. Source: DWP 2001. 2 People in receipt of means-tested benefits (Income Support or Income Based Jobseekers Allowance). Source: DWP 2001. 3 Dependents of people in receipt of means-tested benefits (Income Support). Source: DWP 2001. 4 Sources: Census, Office for National Statistics, 2001. People in receipt of Attendance Allowance or Disability Living Allowance benefits, DWP 2001 5 Source: Census, Office for National Statistics, 2001. 6 Source: Pupil Level Annual School Census (PLASC), DfES 2003. People aged 16-19 in receipt of Child Benefit, DWP 2001. 7 Source: Census, Office for National Statistics, 2001. 8 Source: Home Office, 2001. 9 Source: Indices of Deprivation, ODPM 2004. 10 People in receipt of unemployment (Jobseekers Allowance) or sickness (Incapacity Benefit or Severe Disablement Allowance) benefits. Source: DWP 2001. 11 People aged under 20 in receipt of means-tested benefits (Income Support or Income Based Jobseekers Allowance). Source: DWP 2001. 12 People aged 60 and over in receipt of means-tested benefits (Income Support, known as the Minimum Income Guarantee for people aged 60 and over). Source: DWP 2001. 13 Dependents of people aged under 5 in receipt of means-tested benefits (Income Support). Source: DWP 2001. 14 Source: Indices of Deprivation ODPM 2004. 15 Source: Indices of Deprivation, ODPM 2004. 16 Source: Pupil Level Annual School Census (PLASC), DfES 2003. 17 Source: Pupil Level Annual School Census (PLASC), DfES 2003. 18 Source: Census, Office for National Statistics, 2001. 19 Source: Census, Office for National Statistics, 2001. 20 Source: Census, Office for National Statistics, 2001. 21 Source: Census, Office for National Statistics, 2001. 22 Source: Census, Office for National Statistics, 2001. 23 People in receipt of unemployment (Jobseekers Allowance) or sickness (Incapacity Benefit or Severe Disablement Allowance) benefits. Source: DWP 2003. 24 People in receipt of unemployment benefits (Jobseekers Allowance). Source: DWP 2003. 25 People in receipt of sickness benefits (Incapacity Benefit or Severe Disablement Allowance). Source: DWP 2003. 26 People aged under 50 in receipt of sickness benefits (Incapacity Benefit or Severe Disablement Allowance). Source: DWP 2003. 27 People aged 50 and over in receipt of sickness benefits (Incapacity Benefit or Severe Disablement Allowance). Source: DWP 2003. 28 Source: Indices of Deprivation, ODPM 2004.
Oxfordshire in Detail Report, Updated September 2005 Oxford Consultants for Social Inclusion, www.ocsi.co.uk, [email protected], 0870 240 1474.
175
29 People in receipt of means-tested benefits (Income Support or Income Based Jobseekers Allowance). Source: DWP 2003. 30 People aged under 20 in receipt of means-tested benefits (Income Support or Income Based Jobseekers Allowance). Source: DWP 2003. 31 People aged under 50 in receipt of means-tested benefits (Income Support or Income Based Jobseekers Allowance). Source: DWP 2003. 32 People aged 60 and over in receipt of means-tested benefits (Income Support, known as the Minimum Income Guarantee for people aged 60 and over). Source: DWP 2003. 33 Source: Indices of Deprivation, ODPM 2004. 34 Dependents of people in receipt of means-tested benefits (Income Support). Source: DWP 2003. 35 Dependents aged under 5 of people in receipt of means-tested benefits (Income Support). Source: DWP 2003. 36 Dependents aged 5-19 of people in receipt of means-tested benefits (Income Support). Source: DWP 2003. 37 People in receipt of care component of Attendance Allowance or Disability Living Allowance benefits. Source: DWP 2003. 38 People in receipt of higher rate care component of Attendance Allowance or Disability Living Allowance benefits. Source: DWP 2003. 39 People in receipt of mobility component of Attendance Allowance or Disability Living Allowance benefits. Source: DWP 2003. 40 Source: Census, Office for National Statistics, 2001. 41 Source: Census, Office for National Statistics, 2001. 42 Source: Census, Office for National Statistics, 2001. 43 Source: Pupil Level Annual School Census (PLASC), DfES 2004. 44 Source: Pupil Level Annual School Census (PLASC), DfES 2004. 45 People aged 16-19 in receipt of Child Benefit, DWP 2003. 46 Source: Census, Office for National Statistics, 2001. Note that this indicator has been changed from “Economically Active Full-Time Students Aged 16-74” to “Full-Time Students and Schoolchildren Aged 18-74”. This excludes almost all schoolchildren, as well as part-time students. 47 Source: Census, Office for National Statistics, 2001. 48 Source: Census, Office for National Statistics, 2001. This indicator consists of households lacking central heating and without sole use of bath / shower and toilet. 49 Source: Census, Office for National Statistics, 2001. This indicator consists of households rented from council, housing association or registered social landlord. 50 Source: Census, Office for National Statistics, 2001. 51 Source: Home Office, 2002-3. Crime rate in parentheses are offences per thousand people. 52 Source: Home Office, 2002-3. Crime rate in parentheses are offences per thousand people. 53 Source: Home Office, 2002-3. Crime rate in parentheses are offences per thousand people. 54 Source: Home Office, 2002-3. Crime rate in parentheses are offences per thousand households.

Oxfordshire in Detail Report, Updated September 2005 Oxford Consultants for Social Inclusion, www.ocsi.co.uk, [email protected], 0870 240 1474.
176
55 Source: Home Office, 2002-3. Crime rate in parentheses are offences per thousand people. 56 Source: Home Office, 2002-3. Crime rate in parentheses are offences per thousand people. 57 Source: Indices of Deprivation, ODPM 2004. 58 Source: Indices of Deprivation, ODPM 2004. 59 Source: Indices of Deprivation, ODPM 2004. 60 Source: Indices of Deprivation, ODPM 2004. 61 Source: Indices of Deprivation, ODPM 2004. 62 Source: Indices of Deprivation, ODPM 2004. 63 Source: Census, Office for National Statistics, 2001. 64 Source: Census, Office for National Statistics, 2001. 65 Source: Census, Office for National Statistics, 2001. 66 Source: Census, Office for National Statistics, 2001. 67 People in receipt of unemployment (Jobseekers Allowance) or sickness (Incapacity Benefit or Severe Disablement Allowance) benefits. Source: DWP 2003. 68 People in receipt of unemployment benefits (Jobseekers Allowance). Source: DWP 2003. 69 People in receipt of sickness benefits (Incapacity Benefit or Severe Disablement Allowance). Source: DWP 2003. 70 People aged under 50 in receipt of sickness benefits (Incapacity Benefit or Severe Disablement Allowance). Source: DWP 2003. 71 People aged 50 and over in receipt of sickness benefits (Incapacity Benefit or Severe Disablement Allowance). Source: DWP 2003. 72 Source: Indices of Deprivation, ODPM 2004. 73 People in receipt of means-tested benefits (Income Support or Income Based Jobseekers Allowance). Source: DWP 2003. 74 People aged under 20 in receipt of means-tested benefits (Income Support or Income Based Jobseekers Allowance). Source: DWP 2003. 75 People aged under 50 in receipt of means-tested benefits (Income Support or Income Based Jobseekers Allowance). Source: DWP 2003. 76 People aged 60 and over in receipt of means-tested benefits (Income Support, known as the Minimum Income Guarantee for people aged 60 and over). Source: DWP 2003. 77 Source: Indices of Deprivation, ODPM 2004. 78 Dependents of people in receipt of means-tested benefits (Income Support). Source: DWP 2003. 79 Dependents aged under 5 of people in receipt of means-tested benefits (Income Support). Source: DWP 2003. 80 Dependents aged 5-19 of people in receipt of means-tested benefits (Income Support). Source: DWP 2003. 81 People in receipt of care component of Attendance Allowance or Disability Living Allowance benefits. Source: DWP 2003. 82 People in receipt of higher rate care component of Attendance Allowance or Disability Living Allowance benefits. Source: DWP 2003. 83 People in receipt of mobility component of Attendance Allowance or Disability Living Allowance benefits. Source: DWP 2003.
Oxfordshire in Detail Report, Updated September 2005 Oxford Consultants for Social Inclusion, www.ocsi.co.uk, [email protected], 0870 240 1474.
177
84 Source: Census, Office for National Statistics, 2001. 85 Source: Census, Office for National Statistics, 2001. 86 Source: Census, Office for National Statistics, 2001. 87 Source: Pupil Level Annual School Census (PLASC), DfES 2004. 88 Source: Pupil Level Annual School Census (PLASC), DfES 2004. 89 People aged 16-19 in receipt of Child Benefit, DWP 2003. 90 Source: Census, Office for National Statistics, 2001. Note that this indicator has been changed from “Economically Active Full-Time Students Aged 16-74” to “Full-Time Students and Schoolchildren Aged 18-74”. This excludes almost all schoolchildren, as well as part-time students. 91 Source: Census, Office for National Statistics, 2001. 92 Source: Census, Office for National Statistics, 2001. This indicator consists of households lacking central heating and without sole use of bath / shower and toilet. 93 Source: Census, Office for National Statistics, 2001. This indicator consists of households rented from council, housing association or registered social landlord. 94 Source: Census, Office for National Statistics, 2001. 95 Source: Home Office, 2002-3. Crime rate in parentheses are offences per thousand people. 96 Source: Home Office, 2002-3. Crime rate in parentheses are offences per thousand people. 97 Source: Home Office, 2002-3. Crime rate in parentheses are offences per thousand people. 98 Source: Home Office, 2002-3. Crime rate in parentheses are offences per thousand households. 99 Source: Home Office, 2002-3. Crime rate in parentheses are offences per thousand people. 100 Source: Home Office, 2002-3. Crime rate in parentheses are offences per thousand people. 101 Source: Indices of Deprivation, ODPM 2004. 102 Source: Indices of Deprivation, ODPM 2004. 103 Source: Indices of Deprivation, ODPM 2004. 104 Source: Indices of Deprivation, ODPM 2004. 105 Source: Indices of Deprivation, ODPM 2004. 106 Source: Indices of Deprivation, ODPM 2004.


Albanian
Bengali
Chinese
Hindi
Punjabi
Urdu
Alternative formats of this publication are available on request. These include other languages, large print, Braille, audiocassette,
computer disk or email.
Oxfordshire in Detail Full Report Updated September 2005
Adrian Harper-Smith
Corporate Strategies Manager Chief Executive’s Office
Oxfordshire County Council County Hall, Oxford OX1 1ND
Printed on 100% recycled paper using vegetable based inks
Printed by: Oxfordshire County Council’s Design & Print Unit - Tel: 01865 815672 - Fax: 01865 204309


