Page 1
Abstract
In recent years, a line has been drawn that separates
standard work from standardized work. Often considered
foundational, standardization is about achieving consisten-
cy, or employing work measurement for flow optimization
or task simplification. However, organizations that stand-
ardize may never realize the full potential of lean, which is
process or system improvement. Standard work, in contrast,
uses measurement to drive action. The contemporary view
relies on visuals to distinguish normal from abnormal condi-
tions, and to trigger problem resolution, or kaizen. While
research overwhelmingly supports the learning of structured
problem solving through a system, little is written on teach-
ing the information flow in an educational or training set-
ting. In this paper, a framework for connecting the flow of
information for process improvement is demonstrated
through simulation. In this study, current and past studies
that contribute to the contemporary view of standard work
were analyzed. Qualitative evaluation supports the use of
simulation for teaching standard work in education, and the
author suggests areas where further research is necessary.
Introduction and Background
Day [1] reiterates Taiichi Ohno’s words, “…where there
is no standard, there can be no kaizen”. In early quality liter-
ature, standards commonly meant quotas, conformance,
regulation or numerical measures that were acceptable or
not acceptable [2]. Today, standards normally refer to an
attribute, measurement, tolerance, target or requirement [3].
Continuous improvement relies on measuring against stand-
ards; so, if there are no standards, then there is no way to
measure effectiveness or improvement.
Standards are achieved through standardization. The term
‘standardize’ is frequently associated with maintaining the
first three S’s—Sort, Set-in-order and Shine—in the 5S pro-
cess [4-6]. Standardization commonly represents achieving
a level of consistency or predictability by preventing varia-
tion in work tasks [7-9]. In many companies, standardized
work is synonymous with SOP (standard operating proce-
dures) [6], or the safest, easiest and most effective way cur-
rently known to perform an operation [10]. Standardized
work is most often related to classical industrial engineering
methods used for simplifying a product [8] or designing
work activities. Time and resource measurements may be
utilized to optimize production. Eliminating unnecessary
steps, rearranging of operations, leveling, reviewing task
sequence, matching production to demand, controlling work
-in-process and putting into place mechanisms ensure stabil-
ity in normal practice [10-12]. In systems, standardizing
methods can prevent problems from reoccurring [13] and
support adherence until a new improvement is made [14].
Shook [15] best described the dynamic role of standardized
work and how this paves the path for continuous improve-
ment by writing, “With standardized work, best practice is
assured and the current best practice becomes the baseline
for further improvement, or kaizen”.
Standardization: Good for Change?
Without question, best practices should be captured and
standardized; the absolute goal is kaizen, to identify muda,
or waste, and continually develop processes. However,
companies can regress if their standardized work fails to
change [10]. A longitudinal study conducted on 119 organi-
zations revealed that standardization can actually be prob-
lematic for change [9]. Huber et al. [9] note:
Because standards are valued, and because organi-
zational changes might lead to destandardization,
change will more often be resisted in more stand-
ardized organizations. Consequently, it seems like-
ly that organizational changes are less frequent in
organizations characterized by greater standardiza-
tion.” (p. 239)
The analysis of findings in this study concluded that
standardizing can lead to organizational efficiency, but can
impede all types of change. Discussion with a CI manager at
a Midwest company also supported this view. Often the
problems encountered in production are lost after a tempo-
rary fix is applied. The manager’s point is simple: Flow
optimization or implementing measures that ensure that
output matches what is planned, does not automatically help
the process or system grow. High standardization, by itself,
does not initiate the regular engagement in process improve-
ment, or kaizen. The system must be designed so that when
problems do surface, they are immediately captured, thor-
oughly documented, scheduled, solved and measured.
PROCESS IMPROVEMENT THROUGH
ESTABLISHED STANDARD WORK ——————————————————————————————————————————————–————
Kevin W. Hall, Western Illinois University
——————————————————————————————————————————————–————
20 TECHNOLOGY INTERFACE INTERNATIONAL JOURNAL | VOLUME 13, NUMBER 2, SPRING/SUMMER 2013
Page 2
——————————————————————————————————————————————–————
Standard versus Standardized Work
It is no surprise that standard work is underappreciated.
Standard work and standardized work are often used inter-
changeably. While there is an abundant amount of literature
on standards, standardization and standardized work, there
is a clear absence of any universal standard definition for
standard work. A brief search will reveal that the term
standardized is often considered a poor translation from the
Japanese meaning, and many do not distinguish standard-
ized from standard. Mann [16], however, is one of the first
to make a clear distinction, explaining that standard work is
about management action taken to improve processes, and
standardized work represents time elements for work in-
cluding Takt, inventory amounts at stations and procedures.
Duggan [17] contrasts standardized work and standard work
by writing:
Much has been written on establishing flow, stand-
ardized work and the visual factory. However, to
grow the business, management needs to be freed
from day-to-day operations. That happens by set-
ting standard work for normal flow, making abnor-
mal flow visual and creating standard work for
abnormal flow so employees, not managers, can fix
it. Management, then, can work on activities that
will grow the business. (p. 29)
“Fix problems before they occur” is an integral result of
developing and implementing standard work [16], [17].
Perhaps one of the more important contributions to stand-
ard work was captured in Costantino’s [18] writing about
the wood-processing company, Cedar Works. Standardized
work methods such as work simplification, reducing non-
value-added steps, balancing and developing work proce-
dures were employed. Visual tracking charts that illustrated
the performance of production with demand were essential
in helping worker motivation, reinforcing change and iden-
tifying skill gaps. But it was through responding to undesir-
able conditions (wait times and line-stop conditions) that the
latest model of standard work began to evolve. Since wait
time resulted in variation, decision procedures were devel-
oped for line workers to restock areas, clean, assist neigh-
bors and perform required maintenance. To reduce line
stoppages, decision procedures were established to quickly
deploy team leaders in the problem-resolution process in an
effort to keep operations running. Developing If-Then ac-
tions eliminated downtime and eventually helped the com-
pany achieve a state of predictability and reliability.
Huntzinger [19] explained that problem solving is part of
standard work and wrote, “Steady progress with continuous
improvement depends on effectively incorporating improve-
ments into Standard Work. Although ‘ask why five times,’
the informal version, subdues many problems, Plan-Do-
Check-Act (PDCA, the Deming Circle) remains Toyota’s
fundamental problem-solving framework”. In an LEI Lean
Management Case Study, Plumbers Supply underwent a
lean business transformation that involved developing
standard work [20]. In the study, standard work was not just
about developing procedures or checklists, but putting into
place visual cues that indicate the presence of and subse-
quent action to rectify abnormal conditions.
Many lean practitioners differentiate standard work by
implementing an improvement component or action. This is
a noticeable separation between standard and standardized.
Standardized work is almost universally associated with
best practice, where improvements can still be made, while
standard work is associated with seeing that the process is
running as planned, problems are solved and processes are
improved. Contemporary descriptions of standard work
absorb and put into place kaizen activities, particularly clos-
er to where work occurs. Although a review of the literature
uncovered some differences in definitions and interpreta-
tion, closer examination did reveal shared themes in stand-
ards, standardized and standard work. Table 1 contains a
simplified but collective comparison of standards, standard-
ized work and standard work.
Standard Work for Kaizen
Stacks and Ulmer [7] explained that becoming a lean or-
ganization is about learning through root-cause problem
solving. Many of the ideas of process improvement and
preventing problems from reoccurring can be found in
Deming’s [2] writings. Deming described in simple lan-
guage the Shewhart Plan-Do-Check-Act Cycle and how
managers must take the lead to accomplish transformation.
Scientific method models like PDCA and DMAIC are inte-
gral to continuous improvement. Schutta [21] adds, “Kaizen
approaches involve using process thinking rather than func-
tional thinking…The improvement process of kaizen uses
Deming’s plan-do-check-act approach to problem solving”.
PDCA is the structure for an improvement cycle that chang-
es both standards and standardization [22].
Standard work is more than just job-instruction methodol-
ogy or calculations. Standard work is about process or sys-
tem improvement [10], [16], something that requires both
awareness and understanding. Awareness is accomplished
by identifying problems through visual control or detection
of abnormal signals or misses. Andon or signal boards are
effective in displaying to everyone, when and where a prob-
lem is occurring [7]. Pitch boards or tracking charts are
——————————————————————————————————————————————–————
PROCESS IMPROVEMENT THROUGH ESTABLISHED STANDARD WORK 21
Page 3
——————————————————————————————————————————————–————
22 TECHNOLOGY INTERFACE INTERNATIONAL JOURNAL | VOLUME 13, NUMBER 2, SPRING/SUMMER 2013
——————————————————————————————————————————————–————
good for showing actual performance compared to expected
performance. Awareness is also demonstrated through ac-
tion to resolve the problem. Developing, selecting and im-
plementing countermeasures are the PLAN and DO phases
of the Deming cycle. However, implementing solutions to
problems does not necessarily indicate that learning has
taken place. Problems still can be solved using stop-gap
techniques or temporary solutions that do not change stand-
ardized work. Such solutions do not result in process im-
provement, only a certainty that the organization is likely to
encounter the problem again. PDCA involves system disci-
pline, so learning takes place and mistakes are not repeated
[15]. Understanding, or becoming a “learned” organization,
requires follow-up to determine if the countermeasure was
successful and subsequently taking some kind of action. If
the countermeasure was successful, this should yield chang-
es to either standards, standardized work or both. If the
countermeasure was not successful, then the team should be
sure the problem is correctly identified and, if so, then select
an alternative countermeasure. Allen and Thomerson [23]
reinforced the importance of change as problems are solved
and wrote, “…the real aim of this process is for the opera-
tors to gain ownership of the standard work. Lean enables
operators and gives them the skills to analyze abnormalities
(e.g., quality issues, equipment downtime and overtime) and
solve problems using plan-do-check-act/ adjust methods and
statistical process control tools”.
STANDARDS STANDARDIZED WORK STANDARD WORK
Sophistication
level Low Intermediate High
Meaning ● Target – Basis-desired
condition
● Perform as planned - Expected
● Baseline for improvement
● Proactive -Taking action
● Analysis & Improvement
Function
● Support standardization
● Conformance
● Define normal (target)
● Enable/Support improvement
● Control - Simplify - Stabilize - Make rou-
tine and repeatable
● Become an efficient organization
● To achieve normal & recognize abnormal
(departure from target)
● Process improvement action
● Development
● Become a learning organization
● Recognize & Act on abnormal
Primary Consider-
ation Desired performance Current performance Future performance
Question What is the target? Is the target reached? How can the target be
reached?
Why wasn’t the target reached? What
went wrong? What is the remedy?
Elements
● Measurements
● Tolerances
● Regulations / Rules
● Ingredients
● Characteristics
● Work sequence or process steps
● Takt time calculation
● Inventory amounts (stock, SWIP)
● Layout planning
● Operator/Manager Action
● If-Then scenarios - Decision analysis -
Contingencies
● Problem solving, Countermeasures
● Process/System adjustment
Format or Tools
Specifications
Memos/Notes
Illustrations
Manuals
Drawings
Numerical
Standard operating procedures
Operator instructions
Balance or leveling charts
Standard work process sheets
Andon/Pitch boards, tracking charts
Checklists/Audits
Pitch boards, tracking charts
Decision diagrams
Problem-Resolution Form
Root-cause-analysis
PDCA/DMAIC cycle
Accomplishments board
Benefits ● Eliminate variation
● Consistency of output
● Eliminate variation
● Efficient work
● Stable operations
● Flow optimization
● Consistency of output
● Preventive - Eliminate variation
● Efficient decision making
● Change standardized work
● Stability - Prevent flow breakdowns
● Improve process/system
Table 1. Comparison of Standards, Standardized Work and Standard Work
Page 4
——————————————————————————————————————————————–————
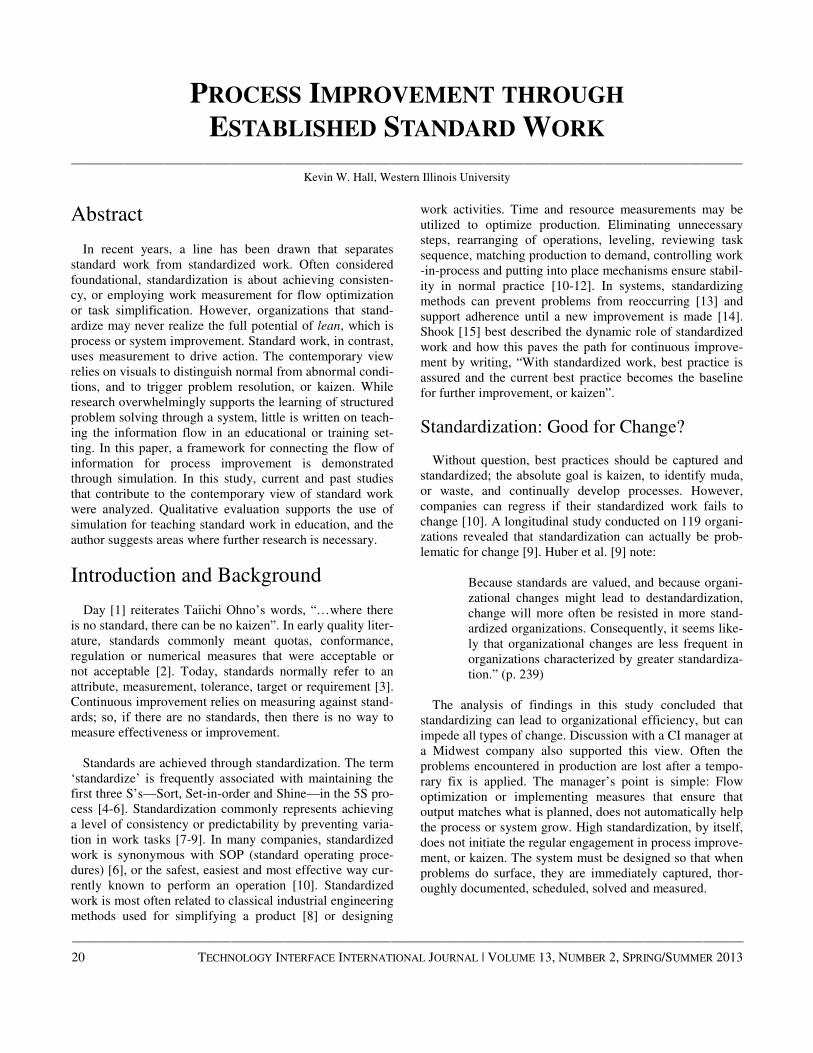
Standard work is the structure put in place to engage in
kaizen, which is accomplished through the final two phases
of the Deming cycle: CHECK and ACT. When processes or
systems positively change, kaizen may result in changes to
standards or standardized work. Figure 1 depicts Standard
Work (leadership action) for problem resolution and process
improvement using the Deming cycle. Leader standard
work recognizes that standardized work will change as
standards change.
Figure 1. Deming Cycle for Problem Resolution & Process
Improvement
Improvements should be connected to business perfor-
mance; and having a mechanism in place to capture prob-
lems is critical. Strategy deployment is often conducted
using a catchball approach that employs PDCA at opera-
tional, tactical and strategic levels [24]. Catchball refers to
information sharing through the levels so that everyone un-
derstands the goals of the organization and becomes in-
volved in problem solving for improvement. The decentral-
ized method involves using team-based problem solving
closer to where work occurs, promoting both horizontal and
vertical integration. Measurements are recorded and dash-
boards are used to indicate performance metrics so that
leadership can make informed decisions.
The power of standard work is found when the process or
system changes and fundamental to standard work is the
establishment of visuals to drive management decisions.
Visual control is commonly described as making it possible
for everyone to see whether the situation is right or wrong,
or normal or abnormal [11]. Lean systems rely on visual
indicators or signals that reflect standards to generate action.
Dennis [10] describes three characteristics of standards and
how they support visual management: “A standard is a clear
image of a desired condition. Standards make abnormalities
immediately obvious so that corrective action can be taken.
A good standard is simple, clear, and visual”.
Lean Simulation
For years, simulations have been used in training and edu-
cation for replicating workplace practices and teaching lean
flow techniques. The learning benefits and power of using
simulations, particularly the mechanics of lean, have been
well-documented. Participants get hands-on exposure and
observation of process improvement [25-27]. Simulations
can be very effective for illustrating visual control, under-
standing value streams, realizing the importance of reducing
defects and learning how charts track performance. One
simulation model demonstrated a method for engaging stu-
dents in an improvement cycle using Lego-constructed air-
planes [27]. Simulations have often been used to test scenar-
ios for error and throughput. In a clinical setting, simulation
has been used to examine the impact of lean practices on
resource utilization, distance traveled, wait time and patient
flow [28].
Problem of Opportunity
While simulations have been essential to teaching funda-
mental lean flow concepts, the exercises do not teach the
development of, in the contemporary sense, standard work.
Mcleod [25] explained that signal systems employed to il-
lustrate process status can be challenging and difficult to
explain in educational environments. Without structure,
there can be disconnect in tying a visual signal of an abnor-
mality to employing action that improves the process. Link-
ing process performance to action presents a problem of
opportunity, particularly in simulation development.
Methodology
Simulation was selected as the vehicle for delivering
standard work instruction to 24 students in a junior-level,
Engineering Technology Cost Reduction class during the
fall, 2012, semester. Six students had some form of work-
force experience. College-leavers quickly find that lean is
not only being applied in manufacturing, but also office,
healthcare, finance, agriculture, construction and distribu-
tion. Because most simulation participants did not have pri-
or work experience, a general discussion of potential prob-
lems (abnormalities) in both production and service indus-
tries was necessary. Countermeasures, or problem-solving
measures, were also discussed. Table 2 contains a con-
densed list of some abnormalities and countermeasures that
can take place in a variety of fields.
Visual control techniques and their purpose are usually
new for most students, even for those who have work expe-
rience. As a primer, participants were given detailed instruc-
——————————————————————————————————————————————–————
PROCESS IMPROVEMENT THROUGH ESTABLISHED STANDARD WORK 23
Page 5
——————————————————————————————————————————————–————
24 TECHNOLOGY INTERFACE INTERNATIONAL JOURNAL | VOLUME 13, NUMBER 2, SPRING/SUMMER 2013
——————————————————————————————————————————————–————
tion on visual control techniques as used in industry. More
than 100 pictorial examples (see Figures 2 and 3) of visual
control were used to familiarize students with the value of
organization, status and signaling. Supermarkets, FIFO
lanes and Red-Amber-Green (RAG) color coding (status
indicators) were presented to reinforce the simulation expe-
rience. Figure 2 illustrates First-In-First-Out (FIFO) control
and sequence of repair work to be completed for plastic
injection molding operations. Clipboards serve as kanbans,
and the first repairs to be made are outlined using red boxes
for the two FIFO lanes. In Figure 3, Andon lights use red
and green to indicate process status differentiating normal
from abnormal conditions.
Table 2. Forms of Abnormalities and Countermeasures
Familiarity of basic flow fundamentals was necessary.
The class had completed simulations that involved standard-
izing using Takt calculations, leveling and combining oper-
ations. Instruction also involved Value Stream Management
and pull signaling with kanbans. Up to this point, all scenar-
ios illustrated the mechanical side of lean, not the systemat-
ic structure and information flow for making process im-
provements. Before engaging in simulation, students needed
to understand the purpose of the exercise. The following
eight questions were displayed on a white board:
1. What is normal? (the target/standard)
2. How is an abnormal condition recognized?
3. How are leaders informed about the abnormal condi-
tion?
4. How is the abnormal condition documented?
5. How is action for a resolution process triggered?
6. How is the abnormality resolved?
7. What prevents the abnormality from reoccurring?
8. How is performance of resolving abnormalities meas-
ured?
Figure 2. FIFO Lanes Used to Control Work Sequence
Figure 3. Andon Lights Used to Distinguish Normal from
Abnormal in Processes
These questions were used to help students make the in-
formation connection necessary to show that lean is more
than just about material flow; lean is also about flowing
information to rapidly solve problems. The questions were
to be addressed through standard work development and
were revisited throughout the exercise.
ABNORMALITIES
● Failure/Non-conformance in information, material, product,
people, machine, process, system (cosmetic, functional, pro-
cedural, policy, design)
● Amount/Level (conditions, information, material, people,
orders, knowledge)
● Schedule (interruptions, time delay, sequence)
● Omission (missing information, steps, data, knowledge, parts,
tools, equipment, personnel)
● Safety (injury producing, environmental)
● Geographical (location, placement, or delivery error)
COUNTERMEASURES
● Good communication (visuals, pictures, clear instructions)
● Decision Logic (if-then scenarios)
● Flow strategies (layout, balancing, sequencing, combining,
leveling)
● Quality checks or audits
● Design changes (product, process, system)
● Education (training, cross-training)
● System approaches (DMAIC, PDCA)
Page 6
——————————————————————————————————————————————–————
The Simulation
It is important to note that the simulation chosen was not
as important as the overall purpose for improving the pro-
cess. A variety of simulations can be easily modified to in-
corporate standard work development. Due to time and spa-
tial constraints of a university setting, the simulation chosen
for teaching standard work was the assembly of a mechani-
cal pencil.
Figure 4 depicts the initial architecture of the simulation,
which involves four assembly operations and a final test
operation. The exercise is activated by a pull signal from a
finished-goods supermarket that contains three colors of the
finished product. When an order of a particular color is
made, a kanban signal is sent to Operation 3, where colored
sleeves are assembled to the single Work-in-Process unit.
The product is then transferred to a FIFO lane where the tips
are assembled at Operation 4 and the product is tested at
Operation 5 before being placed in the supermarket. The
simulation uses pull for Operations 1 and 2, but in the form
of visual control using designated spaces, thereby eliminat-
ing kanbans. WIP is held to one single subassembly unit
between the first three operations.
Figure 4. Simulation using Visual Control for WIP and Supply
Chain Inventory
Several walk-throughs of the simulation were conducted
to familiarize students with the mechanics of the assembly
at the stations and flow of the material throughout the simu-
lation. For instance, Operation 2 could not initiate assembly
operations until the downstream customer, Operation 3,
pulled the work-in-process unit. This simulation is compara-
ble to many other single-piece flow simulations used in
training, and provides a good starting point (current state)
for making improvements. The mechanics of lean have been
well-documented in the literature. Calculating Takt, balanc-
ing, changing sequence, combining and reacting to demand
shifts are integral to future states of this simulation. Howev-
er, these are omitted since the focus of this article is infor-
mation flow and actions to resolve problems.
PLAN: Procedure Development for
Normal and Abnormal
Each of the assembly and testing operations needed nor-
mal condition procedures. Students were divided into teams
and assigned to a station. One team member was assigned as
the team leader. Since participants had never had experience
developing procedures, instructor guidance was given. Her-
nandez [29] outlines several points when developing sys-
tems and procedures:
1. Procedures should be concise.
2. Procedures should be meaningful to those who will
use them.
3. Procedures should be dynamic and change with feed-
back.
General procedures were reduced to 3-4 concise steps for
each operation. Although essential in real-world applica-
tions, time limits made implementing visuals impossible.
The phase also involved developing operator standard
work for the supply chain component inventory levels, or
the parts to be added to the subassembly. Teams were en-
couraged to review the types of abnormalities provided in
Table 2. To further guide students, the following guidelines
were given:
1. Indicate the condition, situation or status.
2. Use IF-THEN thinking. Anticipate problems that can
occur and what actions operators may take.
3. Make the operator-to-leader connection.
4. Generate a signal that drives leader action and follow
-up.
Students were given the goal of developing procedures
that drive action. Each assembly station was given a Red-
Amber-Green sheet without documentation and a marker for
writing. The sheet represented a buffer for in-process sup-
plier inventory. Green color-coding represented normal
component inventory, yellow represented slipping and red
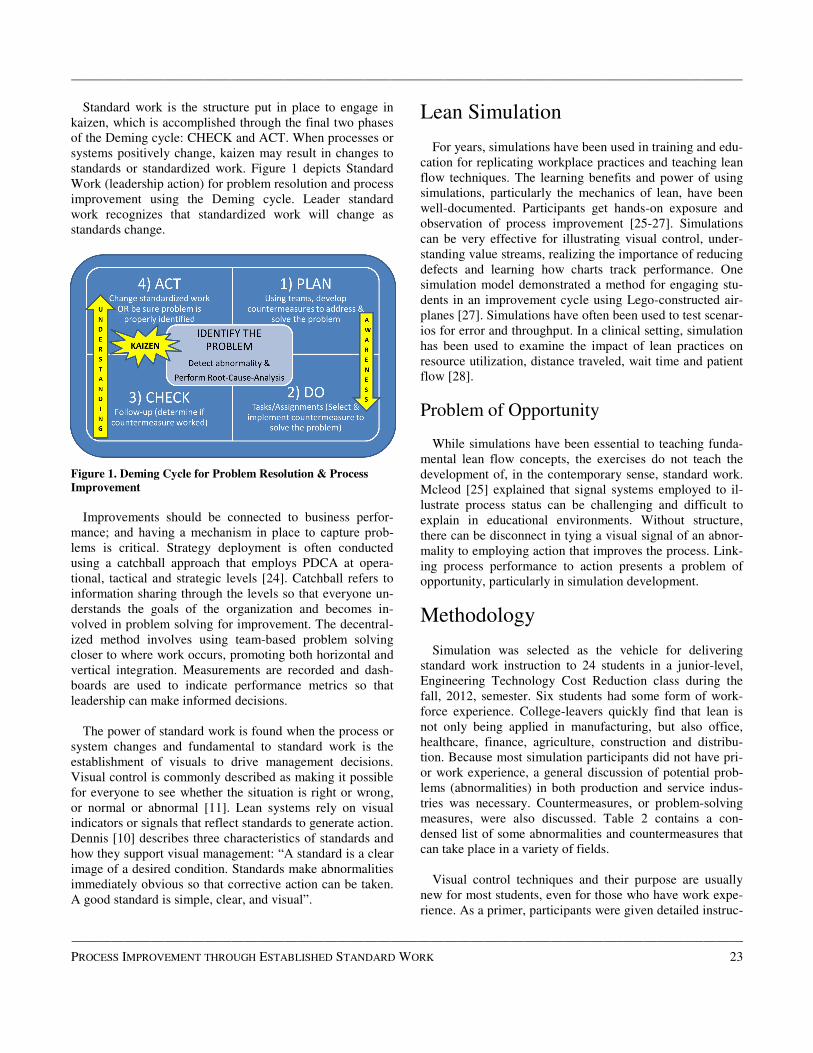
represented a critically low inventory level. Figure 5 shows
the second assembly operation with color-coding for supply
inventory.
——————————————————————————————————————————————–————
PROCESS IMPROVEMENT THROUGH ESTABLISHED STANDARD WORK 25
Page 7
——————————————————————————————————————————————–————
26 TECHNOLOGY INTERFACE INTERNATIONAL JOURNAL | VOLUME 13, NUMBER 2, SPRING/SUMMER 2013
——————————————————————————————————————————————–————
Figure 5. Assembly Operation 2 with RAG System for Supply
Inventory
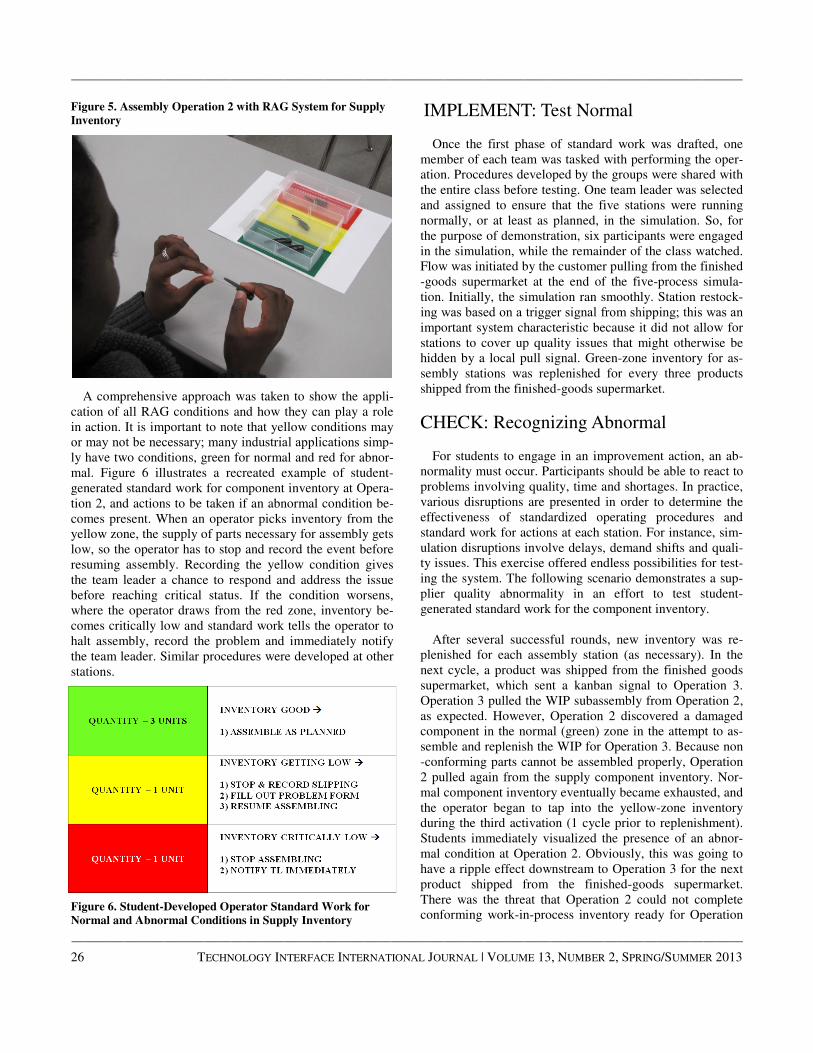
A comprehensive approach was taken to show the appli-
cation of all RAG conditions and how they can play a role
in action. It is important to note that yellow conditions may
or may not be necessary; many industrial applications simp-
ly have two conditions, green for normal and red for abnor-
mal. Figure 6 illustrates a recreated example of student-
generated standard work for component inventory at Opera-
tion 2, and actions to be taken if an abnormal condition be-
comes present. When an operator picks inventory from the
yellow zone, the supply of parts necessary for assembly gets
low, so the operator has to stop and record the event before
resuming assembly. Recording the yellow condition gives
the team leader a chance to respond and address the issue
before reaching critical status. If the condition worsens,
where the operator draws from the red zone, inventory be-
comes critically low and standard work tells the operator to
halt assembly, record the problem and immediately notify
the team leader. Similar procedures were developed at other
stations.
Figure 6. Student-Developed Operator Standard Work for
Normal and Abnormal Conditions in Supply Inventory
IMPLEMENT: Test Normal
Once the first phase of standard work was drafted, one
member of each team was tasked with performing the oper-
ation. Procedures developed by the groups were shared with
the entire class before testing. One team leader was selected
and assigned to ensure that the five stations were running
normally, or at least as planned, in the simulation. So, for
the purpose of demonstration, six participants were engaged
in the simulation, while the remainder of the class watched.
Flow was initiated by the customer pulling from the finished
-goods supermarket at the end of the five-process simula-
tion. Initially, the simulation ran smoothly. Station restock-
ing was based on a trigger signal from shipping; this was an
important system characteristic because it did not allow for
stations to cover up quality issues that might otherwise be
hidden by a local pull signal. Green-zone inventory for as-
sembly stations was replenished for every three products
shipped from the finished-goods supermarket.
CHECK: Recognizing Abnormal
For students to engage in an improvement action, an ab-
normality must occur. Participants should be able to react to
problems involving quality, time and shortages. In practice,
various disruptions are presented in order to determine the
effectiveness of standardized operating procedures and
standard work for actions at each station. For instance, sim-
ulation disruptions involve delays, demand shifts and quali-
ty issues. This exercise offered endless possibilities for test-
ing the system. The following scenario demonstrates a sup-
plier quality abnormality in an effort to test student-
generated standard work for the component inventory.
After several successful rounds, new inventory was re-
plenished for each assembly station (as necessary). In the
next cycle, a product was shipped from the finished goods
supermarket, which sent a kanban signal to Operation 3.
Operation 3 pulled the WIP subassembly from Operation 2,
as expected. However, Operation 2 discovered a damaged
component in the normal (green) zone in the attempt to as-
semble and replenish the WIP for Operation 3. Because non
-conforming parts cannot be assembled properly, Operation
2 pulled again from the supply component inventory. Nor-
mal component inventory eventually became exhausted, and
the operator began to tap into the yellow-zone inventory
during the third activation (1 cycle prior to replenishment).
Students immediately visualized the presence of an abnor-
mal condition at Operation 2. Obviously, this was going to
have a ripple effect downstream to Operation 3 for the next
product shipped from the finished-goods supermarket.
There was the threat that Operation 2 could not complete
conforming work-in-process inventory ready for Operation
Page 8
——————————————————————————————————————————————–————
3. This situation quickly sensitized students of the im-
portance of supply chain stability, and it was at this point
that the effectiveness of local operator standard work was
tested.
An essential part of this standard work phase was docu-
menting the abnormal condition, no matter how small or
large. It was through data collection that trends or patterns
presented themselves. Now that an abnormality had oc-
curred, a visual had to be registered so that the team leader
would notice and a remedy, either short-term, long-term or
both, could be applied. Since Operator 2 had tapped into the
yellow zone (low inventory), standard work required that
the assembly halt and the problem be recorded. To record
the problem, a tracking chart was used. Charts can use nu-
merical values or RAG color coding within a time interval
or track expected versus actual performance in scheduled
production (as in a Pitch or Andon board). Figure 7 illus-
trates a simple magnetic tracking chart that indicates normal
or abnormal for a work time interval.
Figure 7. Tracking Chart for Normal and Abnormal
After recording the yellow or slipping condition in the
appropriate time interval, the operator filled out necessary
information on the Problem Form, as stipulated by standard
work. Attached to each Problem Form was a red kanban to
be filled out and used for task accountability and tracking.
Operator 2 then returned and resumed assembly, as pre-
scribed in local standard work. In this test, student-
generated operator standard work was successful. If the
problem was not resolved in a timely fashion, the following
pull signal from the finished-goods supermarket to Opera-
tion 3 would result in a red dot, or imminent shutdown, be-
cause there was no WIP from Operation 2.
ACT: Leadership Action
In another scenario, a problem was captured and docu-
mented by the visual tracking chart and a Problem Form.
The visual tracking chart can be used in conjunction with an
accountability board. A task accountability board helps
schedule problem solving, whereby leaders are responsible
for follow-up resolutions to the problems discovered by
operators. Documentation can be directly applied or trans-
ferred from the Problem Description Form to cards or kan-
bans, which are placed on the accountability task board.
This allows everyone to see the status of improvements.
Figure 8 illustrates a task-board format for leadership
action. This is easily color coded, where green represents
“problem solved” and red indicates “resolution still need-
ed.” Boards do not require much structure. In the simula-
tion, a chart was made using a whiteboard with 3”x5” index
cards. Index cards are green on one side and pink on the
other and can be easily taped to the whiteboard. Other for-
mats involve green-pink sticky notes, magnetic flip cards or
just using red and green markers. The kanban format allows
for project prioritization to more easily take place. Task-
board information can vary. In this simulation, information
on the abnormality was kept to a minimum, indicating the
date/time of occurrence, team leader and description of the
problem. Expected completion date and priority would be
filled out by the team leader. In this way, management can
verify the status of solving the problem.
Figure 8. Task Board Format for Leadership Action
It is at this point that leader standard work is reviewed.
Follow-up of an abnormal condition requires leadership
action. Leader standard work may occur at timed intervals
or at random. The visual tracking board makes it easy for
the team leader to perform a quick scan in order to deter-
mine how the system is doing. Because the possibility exists
that the leader is working on solving another problem, fre-
quent, scheduled checking of the tracking board is helpful in
preventing a shut-down situation. Standard work must de-
fine the how frequent the board is to be reviewed, and if-
——————————————————————————————————————————————–————
PROCESS IMPROVEMENT THROUGH ESTABLISHED STANDARD WORK 27
Page 9
——————————————————————————————————————————————–————
28 TECHNOLOGY INTERFACE INTERNATIONAL JOURNAL | VOLUME 13, NUMBER 2, SPRING/SUMMER 2013
——————————————————————————————————————————————–————
then scenarios should guide the action to be taken. Mann
[16] explains:
…leaders must quickly perceive the series of step-
by-step actions to attack a flow interrupter or de-
velop an improvement. This skill, the ability to see
an implicit work-breakdown structure, is necessary
to make appropriate one-step-at-a-time task assign-
ments that cumulatively respond to the interruption
or opportunity. Follow-up on these task assign-
ments is straightforward with the visual daily task
board on which assignments are posted. (p.77)
In the simulation, the tracking board displayed and docu-
mented a supply chain disruption for Operation 2. Table 3
showed leader standard work developed as a class. Follow-
ing standard work, the team leader immediately recognized
the yellow condition, retrieved the Problem Form with kan-
ban and met with Operator 2. Once the facts were deter-
mined, new parts were delivered to Operation 2 and the
kanban was placed on the accountability task board to look
into identifying and solving the problem.
Table 3. Leader Standard Work
It is at this point that students made a connection between
the abnormal signal and the problem-solving action through
leader standard work. Similar to developing operator stand-
ard work, students had to account for how leaders were to
follow through with action. Figure 9 illustrates leader stand-
ard work for the task board developed by using a logic dia-
gram.
Students were again placed in their respective groups and
the team leaders were charged with following leader stand-
ard work and addressing the kanban on the task board. It
was through the PDCA process that changes to standards
and/or standardized work would be made. For this simula-
tion, the root cause was determined to be a non-
conformance delivery by the supplier.
Figure 9. Leader Standard Work to Initiate Problem
Resolution
Student teams were charged with resolving the problem
and results varied as expected. Standardized work should
not only make clear what is to be done, but also what is not
to be done. Students were quick to realize that while they
had developed assembly procedures for each operation, they
failed to initially develop standard work to resolve prob-
lems. All students felt this was an indicator of a system
shortcoming. In the example detailed, Operator 2 pulled
from the yellow-zone inventory. A defective product itself
is a visual indicator, and some believed this should not be
tolerated. Accepting poor quality was not a good standard
and should automatically be considered a red-tag condition,
rather than waiting for inventory levels to trigger operator
action. The class agreed that quality disruptions required
immediate attention, since these could compromise the abil-
ity to satisfy internal and external customers. This logic
changed the standard and resulted in a standardized counter-
measure: If a defective part is encountered, then halt assem-
bly and notify the team leader. Other suggestions indicated
that component inventory amounts may need adjusting until
the reliability of the supplier is improved. One team sug-
gested having a quality check before delivery to the opera-
tion, or requiring the supplier to perform an inspection.
Some responses involved seeking a new supplier altogether.
All of these adjustments to the system or process were ap-
propriate. Review of handling and design would also have
been appropriate.
1) CHECK TRACKING CHART EVERY 15 MINUTES.
2) IF ABNOMALITY PRESENT, MEET WITH OPERA-
TOR TO ASSESS SITUATION.
3) DOCUMENT ABNORMAL CONDITION USING
PROBLEM FORM.
4) IS PROBLEM CRITICAL?
YES � CONTACT MANAGEMENT
NO � PROCEED TO STEP #5
5) CAN PROBLEM BE FIXED IMMEDIATELY?
YES � FIX PROBLEM & SUBMIT PROBLEM
FORM TO MANAGEMENT
NO � FILL OUT KANBAN AND PLACE ON
TASK BOARD
6) COMPLETE TASK BOARD ASSIGNMENTS
Page 10
——————————————————————————————————————————————–————
When a problem is resolved through PDCA, then a red-
status visual on the task board can be changed to green. The
Problem Form is updated to indicate countermeasure imple-
mentation and can then be sent to management. From here,
a metric board can be used to analyze problem solving even
further.
Evaluation
Generally speaking, students enjoy educational experienc-
es when they are engaged in activities, especially simula-
tions. Qualitative feedback from simulation participants
included:
“Keep using the simulations - makes the class go by fast.”
“Lectures are good, but the simulations are better for
showing how things work.”
“I can’t wait to see this practiced in my job.”
“My company applies kaizen without any direction. Now
I understand how visuals and good instructions can lead
to change.”
“Information has flow.”
“Lean is more than I first thought.”
In this exercise, students collaboratively engaged in a closed
-loop improvement cycle where visual mechanisms initiated
front-line decisions. This simulation helped make the con-
nection between an event that is visually captured and prob-
lem solving, demonstrating that lean tools are geared toward
process improvement.
Conclusion
Standardization is about performance done right the first
time, whereas standard work is about making adjustments to
the process or system. The example just presented made
system adjustments to an abnormality and standardized the
improvement within the system in an effort to eliminate
future supplier quality problems and to diminish rework.
Where standardized work is commonly characterized by
procedures to ensure uniformity or industrial engineering
techniques for flow stability, a contemporary meaning of
standard work incorporates visuals to drive the process im-
provement cycle. This movement or shift may be in part
because more fields have adopted lean which, too, has
fueled new ideas for advancement and growth.
There is still much opportunity for further study. For in-
stance, analysis on standard work versus standardized work
can be completed through industrial surveys or interviews.
Researching the various techniques for teaching standard
work (in a problem-resolution sense) is also very reasona-
ble. It stands to reason that if standard work is one of the
highest leverage tools in lean, then this should be taught in
university programs. While much has been written on the
importance of teaching the mechanical side of simulations,
little has been demonstrated on how to implement infor-
mation flow for process improvement in an educational or
training environment. The writings of McManus et al. [27]
suggest that many research opportunities exist in designing
simulations to address this need. While the simplified exam-
ple presented in this paper illustrates standard work for a
supply chain disturbance, the same practices can be used for
finished-goods inventories, cross training employees, moni-
toring flow of in-process work using Pitch boards or
Heijunka boxes, completing business information requests
and numerous other areas in a system.
Some organizations measure to the standard, while others
use measurement to drive process change. Visual thresholds
supported with decision logic can expose system weakness-
es. It seems logical that all companies will benefit by having
a blend of standardized work—that optimizes flow—and
standard work—which uses a structured approach—for ac-
tion to improve processes when abnormalities arise. With-
out this integration, follow-up may suffer and many if not
most employees will be exempt from regular improvement
of processes. Through study and application, it becomes
evident that both standardized work and standard work
evolve with system maturity. However, no matter what level
of sophistication, recognizing, developing, implementing,
testing and acting remain critical factors for the continued
advancement of any system.
References
[1] Day, J. C. (1998). Learning about lean systems at
Freudenberg-NOK: Where continuous improvement
is a way of life. In Liker, J. K. (Ed.), Becoming lean:
Inside stories of U.S. manufacturers (pp. 178-198).
New York: Productivity Press.
[2] Deming, W. E. Out of the crisis. Cambridge, Massa-
chusetts: MIT Press.
[3] Schroeder, R. G. (2008). Operations management:
Contemporary concepts and cases. New York:
McGraw-Hill Irwin.
[4] Feld, W. M. (2001). Lean manufacturing: Tools,
techniques, and how to use them. New York: CRC
Press.
[5] Standard work for the shop floor. (2002). New York:
Productivity Press.
[6] Summers, D. (2011). Lean six sigma: Process im-
provement tools and techniques. Upper Saddle River,
New Jersey: Prentice Hall.
[7] Stacks, C. & Ulmer, J. M. (2009). Applied lean
thinking: general usage principles. The Technology
Interface Journal, 9 (2).
——————————————————————————————————————————————–————
PROCESS IMPROVEMENT THROUGH ESTABLISHED STANDARD WORK 29
Page 11
——————————————————————————————————————————————–————
30 TECHNOLOGY INTERFACE INTERNATIONAL JOURNAL | VOLUME 13, NUMBER 2, SPRING/SUMMER 2013
——————————————————————————————————————————————–————
[8] Martin, J. W. (2009). Lean six sigma for the office.
Boca Raton, FL: CRC Press.
[9] Huber, G. P., Sutcliffe, K. M., Miller, C. C., & Glick,
W. H. (1993). Understanding and predicting organi-
zational change. In Huber, G. P. & Glick, W. H.
(Eds.), Organizational change and redesign: Ideas
and insights for improving performance (pp. 215-
265). New York: Oxford University Press.
[10] Dennis, P. (2002). Lean production simplified: a
plain language guide to the world’s most powerful
production system. New York: Productivity Press.
[11] Hirano, H. & Black, J. T. (1988). JIT factory revolu-
tion: A pictorial guide to factory design of the future.
Cambridge, Massachusetts: Productivity Press.
[12] Kosaka, G., Kishida, M., Silva, A. H., & Guerra, E.
(n.d.). Implementing standardized work at
ThyssenKrupp in Brazil. Retrieved January 11, 2013,
from http://www.lean.org/admin/km/
documents/6d8be412-c448-425d-b852-
86962a16f736-SW_TK_English.pdf
[13] Harry, M. and Schroeder, R., (2000), Six sigma: The
breakthrough management strategy revolutionizing
the world’s top corporations. New York: Doubleday.
[14] Pull production for the shop floor. (2002). New
York: Productivity Press.
[15] Shook, J. Y. (1998). Bringing the Toyota production
system to the United States: A personal perspective.
In Liker, J. K. (Ed.), Becoming lean: Inside stories of
U.S. manufacturers (pp. 40-69). New York: Produc-
tivity Press.
[16] Mann, D. (2005). Creating a lean culture: Tools to
sustain lean conversions. New York: Productivity
Press.
[17] Duggan, K. (2012). Flowing toward business growth.
Industrial Management, 54(5), 28-30.
[18] Costantino, B. (1998). Cedar works: Making the tran-
sition to lean. In Liker, J. K. (Ed.), Becoming lean:
Inside stories of U.S. manufacturers (pp. 302-387).
New York: Productivity Press.
[19] Huntzinger, J. (2006). Why standard work is not
standard: Training Within Industry provides an an-
swer. Target, 22(4), 7-13.
[20] Drickhamer, D. (2009). Lean in distribution: Go to
where the action is! Retrieved January 3, 2013, from
http://www.lean.org/common/display/?o=2179.
[21] Schutta, J. T. (2006). Business performance through
lean six sigma: Linking the knowledge worker, the
twelve pillars, and Baldrige. Milwaukee, WI: Quality
Press.
[22] Harrington, H. J. & Lomax, K. C. (2000). Perfor-
mance improvement methods: Fighting the war on
waste. New York: MaGraw-Hill.
[23] Allen, J. & Thomerson, G. (2008). Better way in
vogue: Lean takes to the catwalk in the garment in-
dustry. Industrial Engineer, 40(11), 45-50.
[24] Bell, S. & Orzen, M. A. (2011). Lean IT: Enabling
and sustaining your lean transformation. New York:
CRC Press.
[25] Mcleod, A. (2009). Conceptual development of an
introductory lean manufacturing course for freshmen
and sophomore level students in industrial technolo-
gy. The Technology Interface Journal, 10(4).
[26] Stier, K. (2003). Teaching lean manufacturing con-
cepts through project-based learning and simulation.
Journal of Industrial Technology, 19(4), 2-6.
[27] McManus, H. L., Rebentisch, E., Murman, E. M., &
Stanke, A. (2007). Teaching lean thinking principles
through hands-on simulations. Proceedings of the 3rd
International CDIO Conference. MIT: Cambridge,
Massachusetts.
[28] Farahmand, K., Karim, R., Srinivasan, R., Sajjadi, R.,
& Fisher, L. (2011). Lean Enterprise principles ap-
plied to healthcare. International Journal of Engi-
neering Research and Innovation, 3(2).
[29] Hernandez, A. (1989). Just-in-Time manufacturing:
A practical approach. Englewood Cliffs, New Jersey:
Prentice Hall.
Biography
KEVIN HALL is an Associate Professor of Engineering
Technology in the College of Business and Technology at
Western Illinois University. For more than a decade, Kevin
has taught courses that focus on lean flow, the principles of
quality, and cost reduction strategy. He has consulted and
trained at companies throughout the Midwest, worked for
Duggan Associates in Rhode Island, and authored the dis-
sertation, “Identifying Non-Value-Added Practices in Man-
ufacturing: An Instructional Design.” His continued re-
search interest centers around robust system design for sus-
tained business growth. Dr. Hall can be reached at K-
[email protected]


![Integrated Management Systems Presentation [Autosaved]safetybakersfield.com/media/2G.pdf · •Chad San Juan‐Integration of Management Systems •Deming’s Diseases of Management](https://static.documents.pub/doc/80x56/5fb44f8c53abc8351d34ae81/integrated-management-systems-presentation-autosaved-achad-san-juanaintegration.jpg)


