+ All Categories
Home > Documents > P. JägersbergProgress Report ELPEN. European Livestock Policy Evaluation Network Reporting...

P. JägersbergProgress Report ELPEN. European Livestock Policy Evaluation Network Reporting...

Date post: 20-Jan-2018
Category:
Upload: percival-west
View: 214 times
Download: 0 times
Share this document with a friend
Description:
P. JägersbergProgress Report ELPEN. European Livestock Policy Evaluation Network Reporting back... IFCN cost comparison Results
8
P. Jägersberg Progress Report ELPEN ELPEN. European Livestock European Livestock Policy Evaluation Network Policy Evaluation Network Reporting back ... IFCN Dairy Report 2001: 20 countries Europe: D, F, ESP, UK/NI, DK, Se, A, CH FADN-data: available since May 2001 Data analysis for assessing vulnerable farms Method for cost comparison with FADN data EUROSTAT: Regio, German board of statistics: Regional data 1 Data
Transcript

P. Jägersberg Progress Report

ELPENELPEN..

European Livestock European Livestock Policy Evaluation NetworkPolicy Evaluation Network

Reporting back ...

• IFCN Dairy Report 2001: 20 countries– Europe: D, F, ESP, UK/NI, DK, Se, A, CH

• FADN-data: available since May 2001– Data analysis for assessing vulnerable farms– Method for cost comparison with FADN data

• EUROSTAT: Regio, German board of statistics: Regional data

1 Data

P. Jägersberg Progress Report

ELPENELPEN..

European Livestock European Livestock Policy Evaluation NetworkPolicy Evaluation Network

Reporting back ...

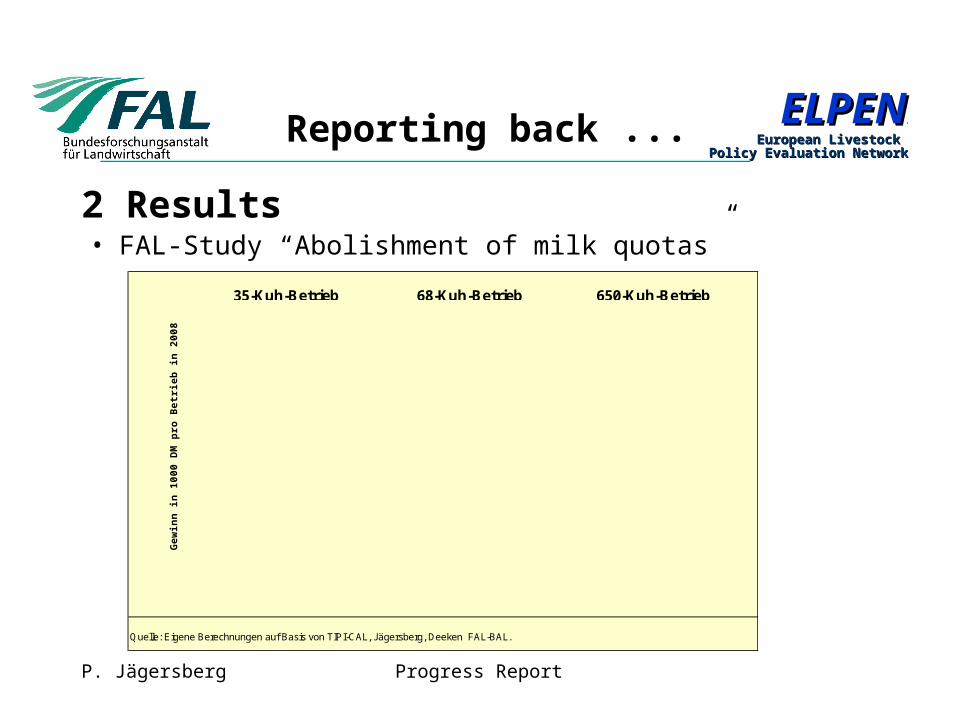
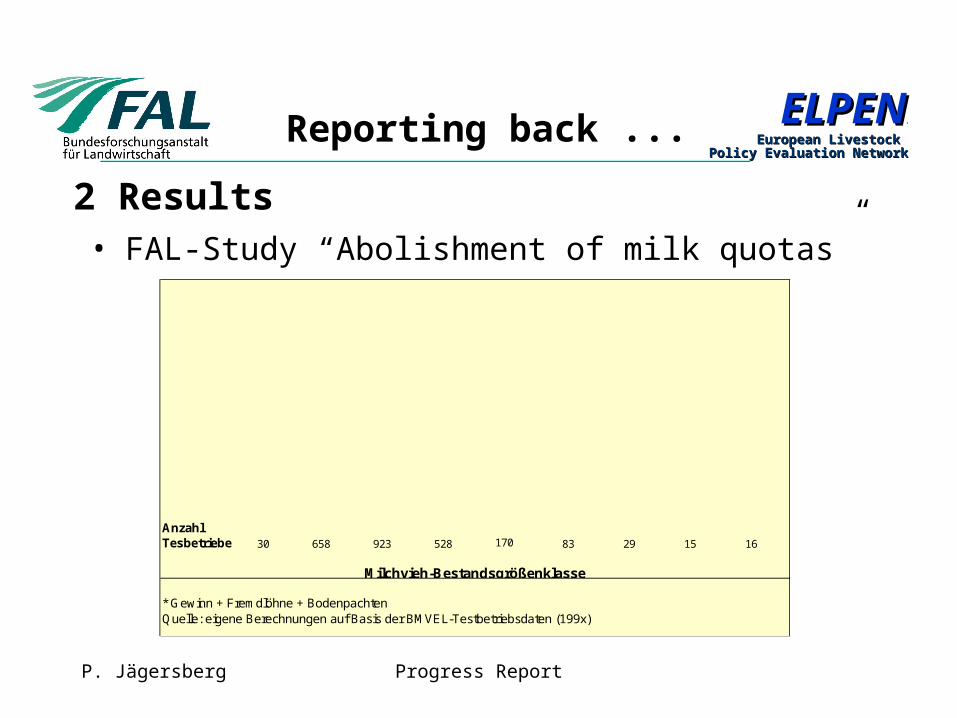
• FADN-vulnerability analysis2 Results

0,00 € 50,00 €25,00 €

411

412

431

432

44

6

711

712

721

723

81

82

69 667

21 072

6 954

130

896

502

2 805

177

1 668

116

14 664

514

P. Jägersberg Progress Report

ELPENELPEN..

European Livestock European Livestock Policy Evaluation NetworkPolicy Evaluation Network

Reporting back ...

• IFCN cost comparison 20012 Results

The Dairy Production System

No. of Cows

No.

Cow

s /

farm

Countries: Europe CEEC North America South America Ozeania

0

100

200

300

400

500

600

700

CH

-32

E

CH

-28

W

AT-2

3

DE-

35

DE-

68

DE-

650

F-31

E-32

G

E-73

G

E-10

50V

UK

-65W

A

UK

-100

HN

I

UK

-100

LNI

DK

-65V

J

DK

-83M

EJ

DK

-200

NEJ

SE-3

5gns

SE-1

00SS

SE-1

60SS

PL-3

nw

PL-2

0nw

PL-1

80nw

H-1

00

H-4

00

EE-3

5

EE-4

00

Rus

-100

0StP

Rus

-125

0StP

US-

70W

I

US-

600W

I

US-

105M

I

US-

400M

I

US-

2100

ID

AR

150C

O

AR

250S

F

AR

350C

O

AR

600B

A

BR

-15G

O1

BR

-15G

O2

BR

-50G

O

BR

-60S

P

CL-

150X

ª

CL-

300X

ª

UR

-140

SU

UR

-300

LN

CO

-153

AC

IN-2

IN-4

IN-2

2

IN-3

2

NZ-

222

Nz-

480 0 0 0 0 0 0 0 0

P. Jägersberg Progress Report

ELPENELPEN..

European Livestock European Livestock Policy Evaluation NetworkPolicy Evaluation Network

• FAL-Study “Abolishment of milk quotas”– Szenario: Reference szenario: Agenda 2000

Abolishment of the quota in 2007/08Milk price reductions by 22, 25 and 30%Transfer payments by the way of milk &

grassland premia– Main issue: Can income losses resulted by milk price

reduction be compensated by farm growth strategies?– Opinion survey among advisors

2 Results

Reporting back ...

35-cow-farm 68-cow-farm 650-cow-farmOptionsActivation of unused factor capacities 45 cows 80 cows 1000 cowsadditional milk production compared to baseline 29% 18% 54%Enlargement (barn, etc.) 60 cows 120 cows 1500 cowsadditional milk production compared to baseline 72% 76% 130%

P. Jägersberg Progress Report

ELPENELPEN..

European Livestock European Livestock Policy Evaluation NetworkPolicy Evaluation Network

• FAL-Study “Abolishment of milk quotas”2 Results

Reporting back ...G

ewin

n in

100

0 D

M p

ro B

etrie

b in

200

8

Quelle: Eigene Berechnungen auf Basis von TIPI-CAL, Jägersberg, Deeken FAL-BAL.

35-Kuh-Betrieb 68-Kuh-Betrieb 650-Kuh-Betrieb

0

20

40

60

80

100

120

140

Kuh

zahl

kons

tant

Nut

zung

frei

erSt

allk

apaz

itäte

n

Anb

au

Agenda 2000 Milchprämie Grünlandprämie

0

20

40

60

80

100

120

140

Kuh

zahl

kons

tant

Nut

zung

frei

erSt

allk

apaz

itäte

n

Anb

au0

200

400

600

800

1000

1200

1400

1600

Kuh

zahl

kons

tant

Nut

zung

frei

erSt

allk

apaz

itäte

n

Anb

au

P. Jägersberg Progress Report

ELPENELPEN..

European Livestock European Livestock Policy Evaluation NetworkPolicy Evaluation Network

• FAL-Study “Abolishment of milk quotas”2 Results

Reporting back ...

AnzahlTesbetriebe 30 658 923 528 170 83 29 15 16

* Gewinn + Fremdlöhne + BodenpachtenQuelle: eigene Berechnungen auf Basis der BMVEL-Testbetriebsdaten (199x)

Milchvieh-Bestandsgrößenklasse

0

10

20

30

40

50

60

70

80

< 15 15-29 30-49 50-69 70-89 90-119 120-199 200-499 >= 500

DM je

100

kg

Milc

h *

Ø Ø unteres Viertel Ø oberes Viertel

P. Jägersberg Progress Report

ELPENELPEN..

European Livestock European Livestock Policy Evaluation NetworkPolicy Evaluation Network

Assessment of production costs

Produktionskosten (Euro) /100 kg Milch<= 0

<= 26<= 30<= 32

<= 40<= 65

keine verfügbaren Daten

Produktionskosten spezialisierter Milchviehbetriebe

Datenquelle: FADN-Daten + eigene Berechnungen

Datenquelle: FADN-Daten + eigene Berechnungen

Produktions- incl. Nutzungskosten spezialisierter Milchviehbetriebe

Produktionskosten incl. Nutzungskosten (Euro)/100 kg Milch<= 0

<= 26<= 30<= 32

<= 40<= 65

keine verfügbaren Daten

P. Jägersberg Progress Report

ELPENELPEN..

European Livestock European Livestock Policy Evaluation NetworkPolicy Evaluation Network

Workplan next 6 monthWP 5

• Complete FADN data analysis by comparison of marginal and average costs per kg milk

• Expansion IFCN-network Europe: IRL, NL, I, PT• Policy simulation for European typical farms

– Policy impact analysis– Farm adjustment

• Unused factor capacities• Enlargement (barn, etc.)• Stop milk production (move to other production

systems?); case studies


Recommended