29
Company Visit Pacific Pipe Public Company Limited Pacific Pipe PCL Company Visit 21 March 2018
Company Visit Pacific Pipe Public Company Limited
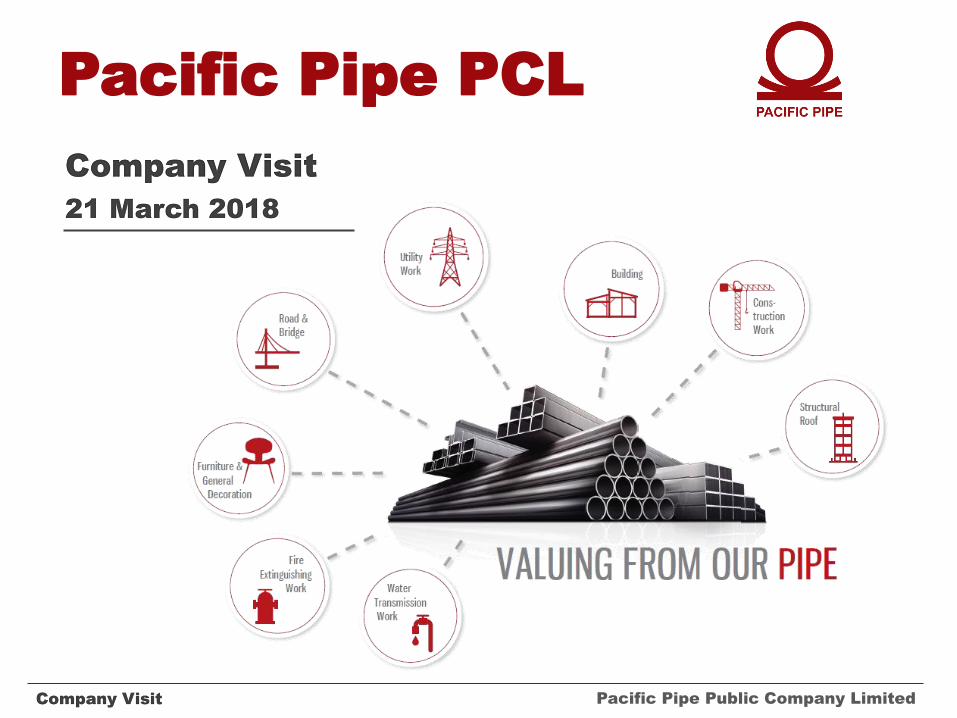
Pacific Pipe PCL
Company Visit
21 March 2018
Company Visit Pacific Pipe Public Company Limited
Disclaimer
2
This presentation includes forward-looking statements that are subject to risks and
uncertainties, including those pertaining to the anticipated benefits to be realized from the proposals
described herein. This presentation contains a number of forward-looking statements including, in
particular, statements about future events, future financial performance, plans, strategies,
expectations, prospects, competitive environment, regulation and supply and demand.
PAP has based these forward-looking statements on its views with respect to future events and
financial performance. Actual financial performance of the entities described herein could differ
materially from that projected in the forward-looking statements due to the inherent uncertainty of
estimates, forecasts and projections, and financial performance may be better or worse than
anticipated. Given these uncertainties, readers should not put undue reliance on any forward-looking
statements.
Forward-looking statements represent estimates and assumptions only as of the date that they
were made. The information contained in this presentation is subject to change without notice and
PAP does not undertake any duty to update the forward-looking statements, and the estimates and
assumptions associated with them, except to the extent required by applicable laws and regulations.
1. Overview of PAP
3. Company Performance
2. Economic & Industry Overview
Company Visit Pacific Pipe Public Company Limited
Agenda
3
Overview of PAP
Company Visit Pacific Pipe Public Company Limited4
Pacific Pipe Public Co.,Ltd was founded in 1972 by Lekapojpanich family,
operating under the name of "Tang Mong Seng“ Factory and initially
engaging in the production of toy cars.
On March 17, 2004, the company was converted into a listed firm officially
known as Pacific Pipe Public Company Limited, engaging in the production
and distribution of structural steel pipes and plumbing system steel pipes
of many international standards.
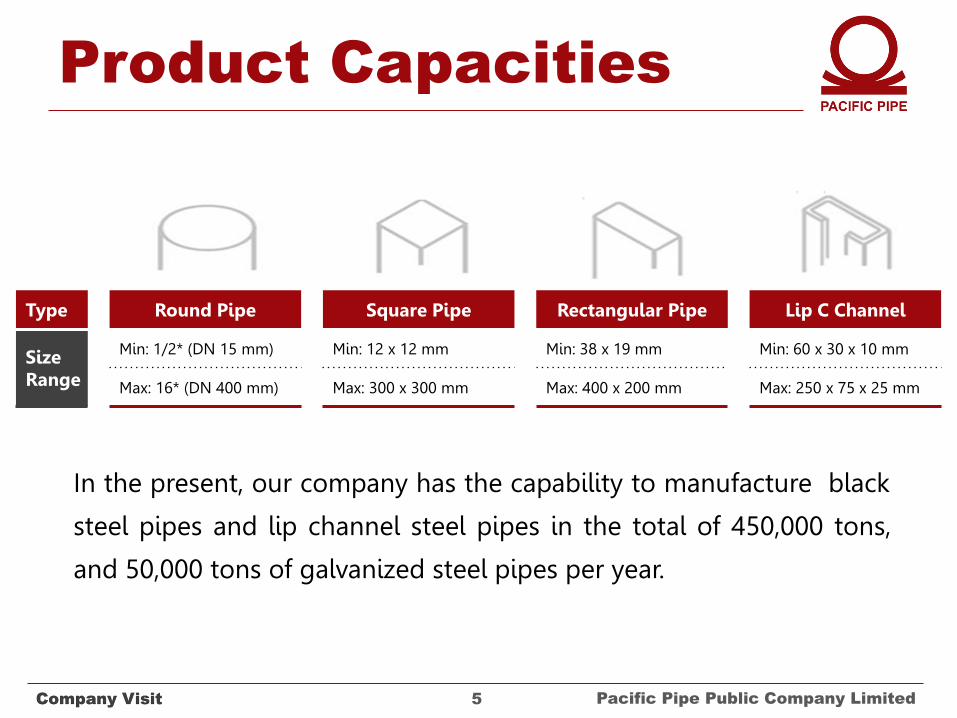
Product Capacities
Company Visit Pacific Pipe Public Company Limited5
In the present, our company has the capability to manufacture black
steel pipes and lip channel steel pipes in the total of 450,000 tons,
and 50,000 tons of galvanized steel pipes per year.
Type Round Pipe Square Pipe Rectangular Pipe Lip C Channel
Size Range
Min: 1/2* (DN 15 mm) Min: 12 x 12 mm Min: 38 x 19 mm Min: 60 x 30 x 10 mm
Max: 16* (DN 400 mm) Max: 300 x 300 mm Max: 400 x 200 mm Max: 250 x 75 x 25 mm
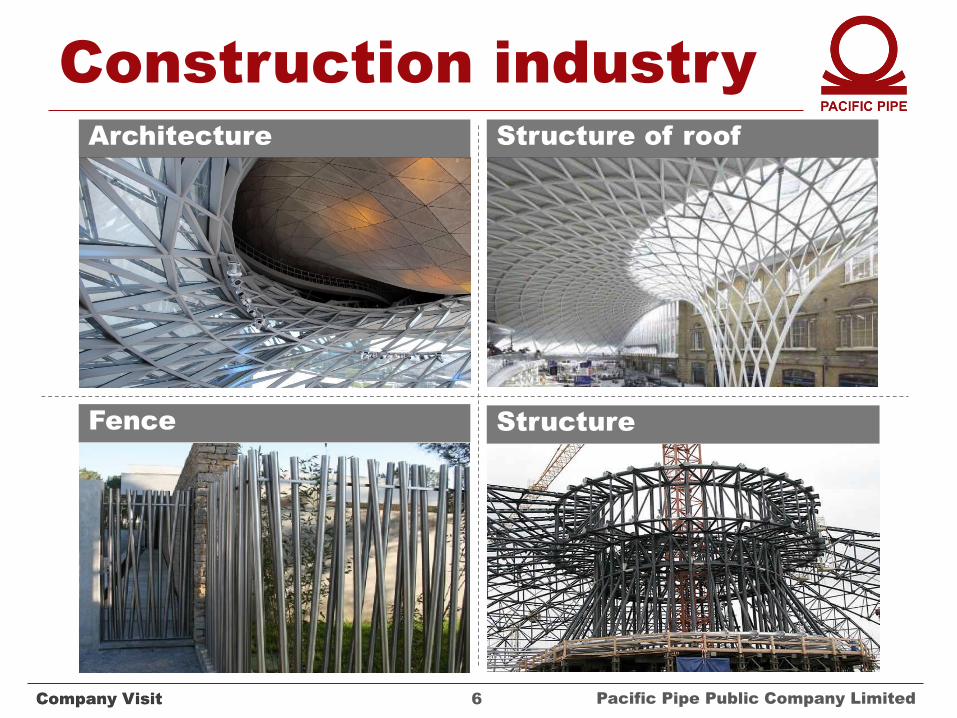
Construction industryArchitecture Structure of roof
Fence Structure
Company Visit Pacific Pipe Public Company Limited6
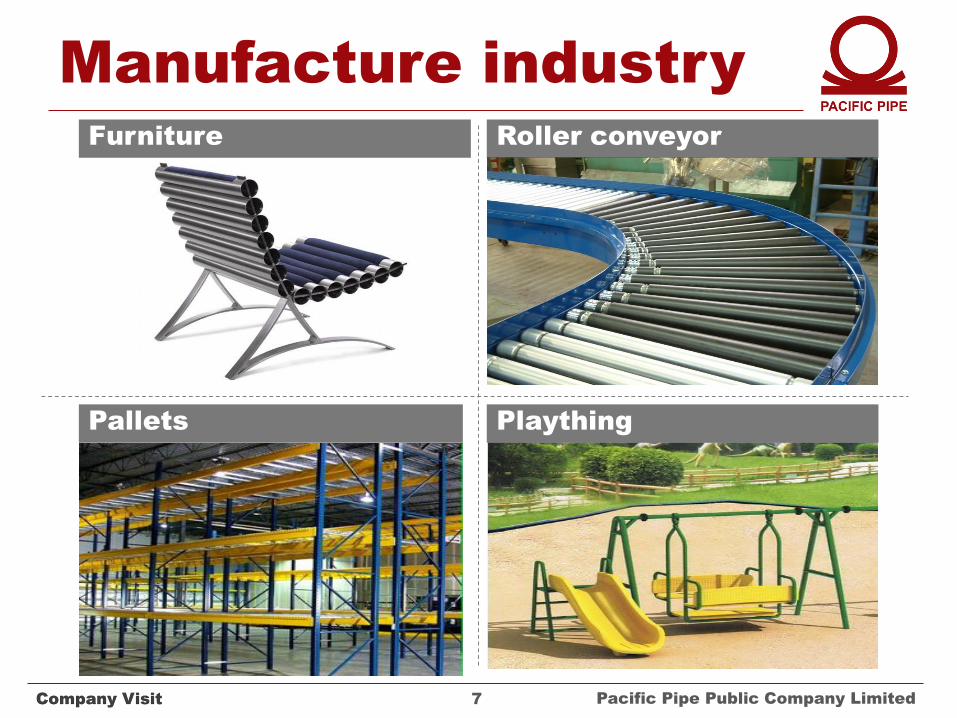
Manufacture industryFurniture Roller conveyor
Pallets Plaything
Company Visit Pacific Pipe Public Company Limited7
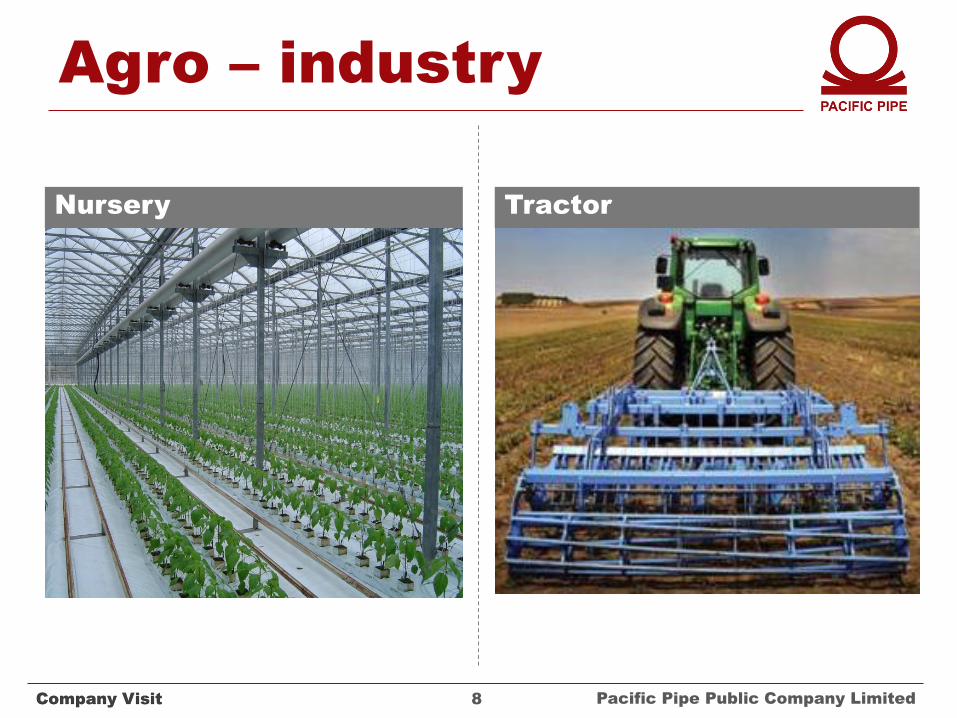
Agro – industry
Nursery Tractor
Company Visit Pacific Pipe Public Company Limited8
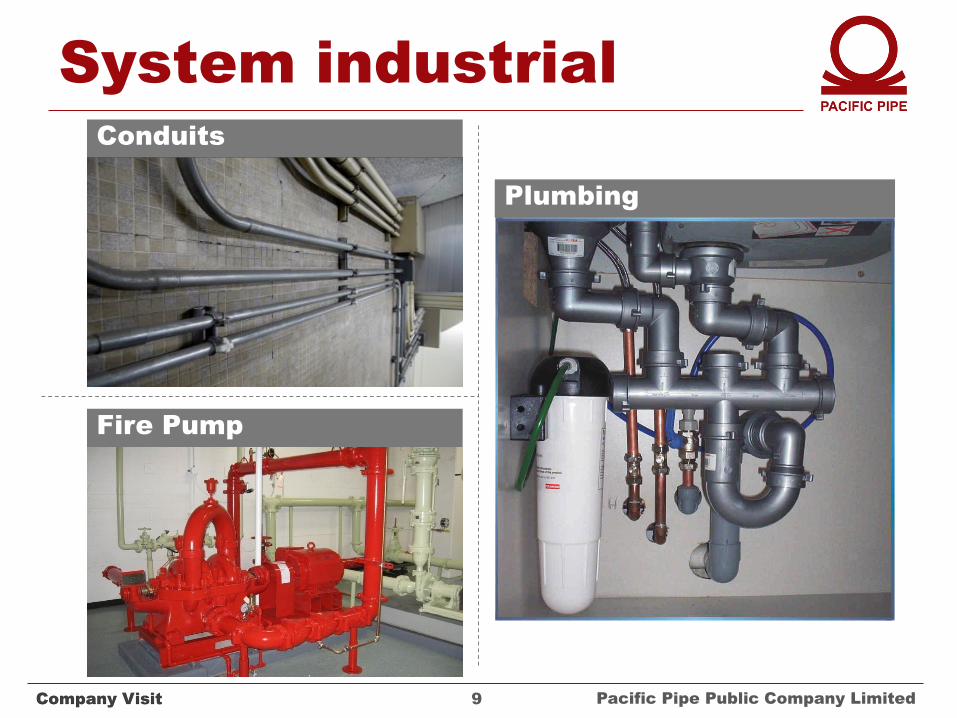
System industrialConduits
Fire Pump
Plumbing
Company Visit Pacific Pipe Public Company Limited9
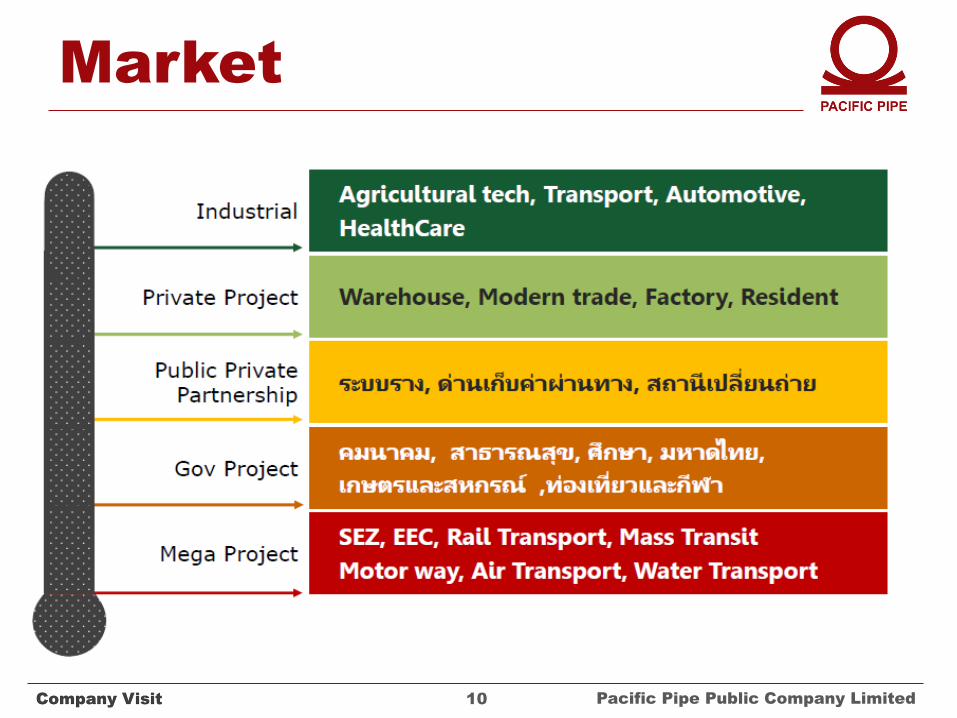
Market
Company Visit Pacific Pipe Public Company Limited10
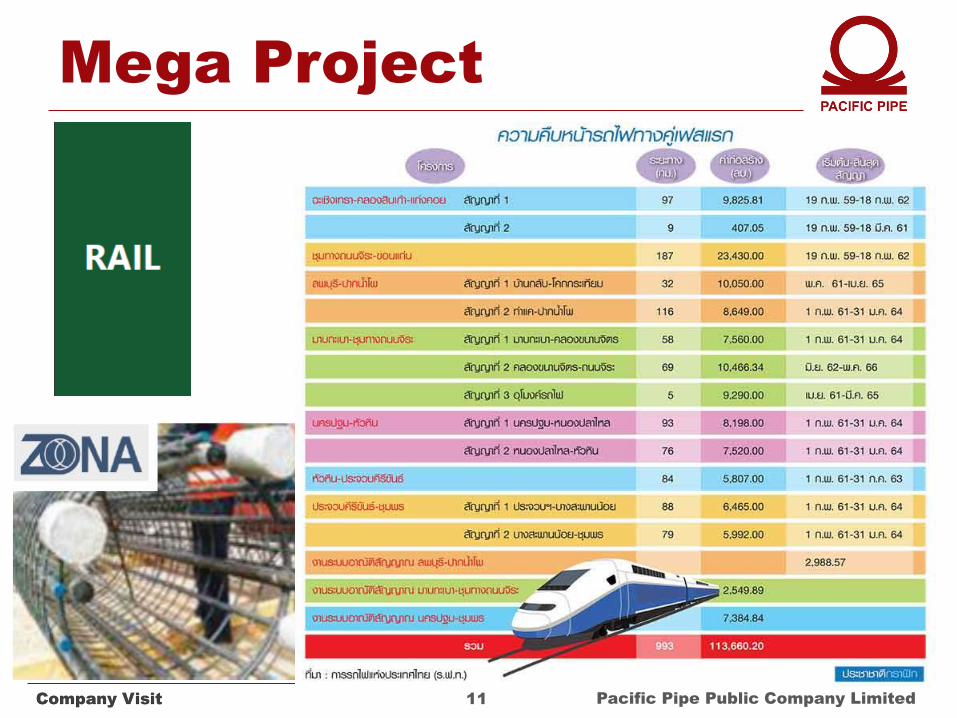
Mega Project
Company Visit Pacific Pipe Public Company Limited11

EEC
Company Visit Pacific Pipe Public Company Limited12
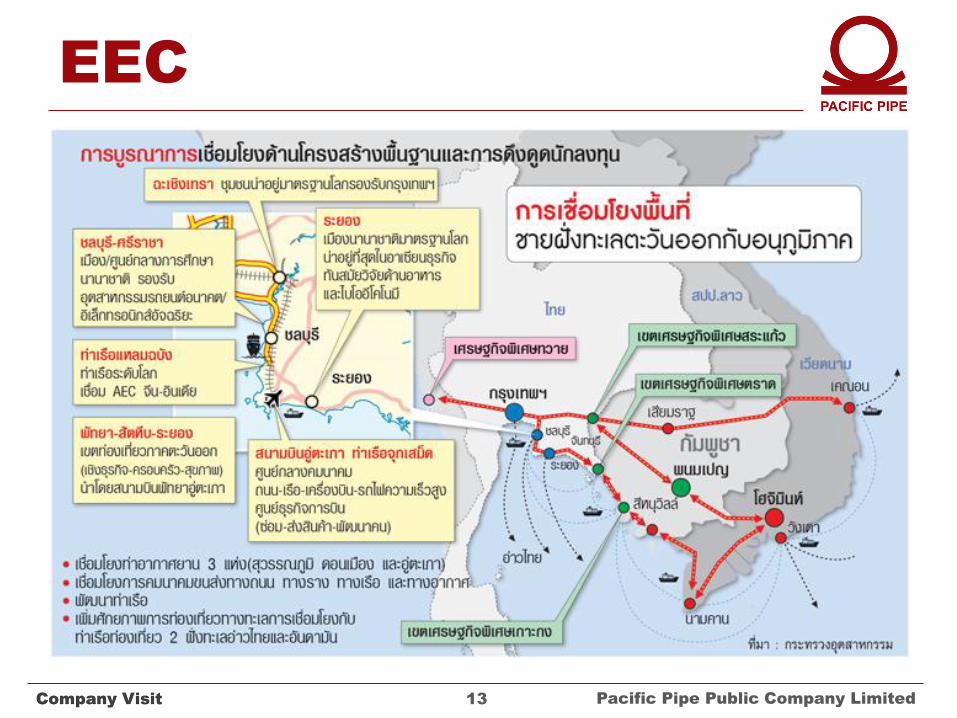
EEC
Company Visit Pacific Pipe Public Company Limited13
MRT
Company Visit Pacific Pipe Public Company Limited14
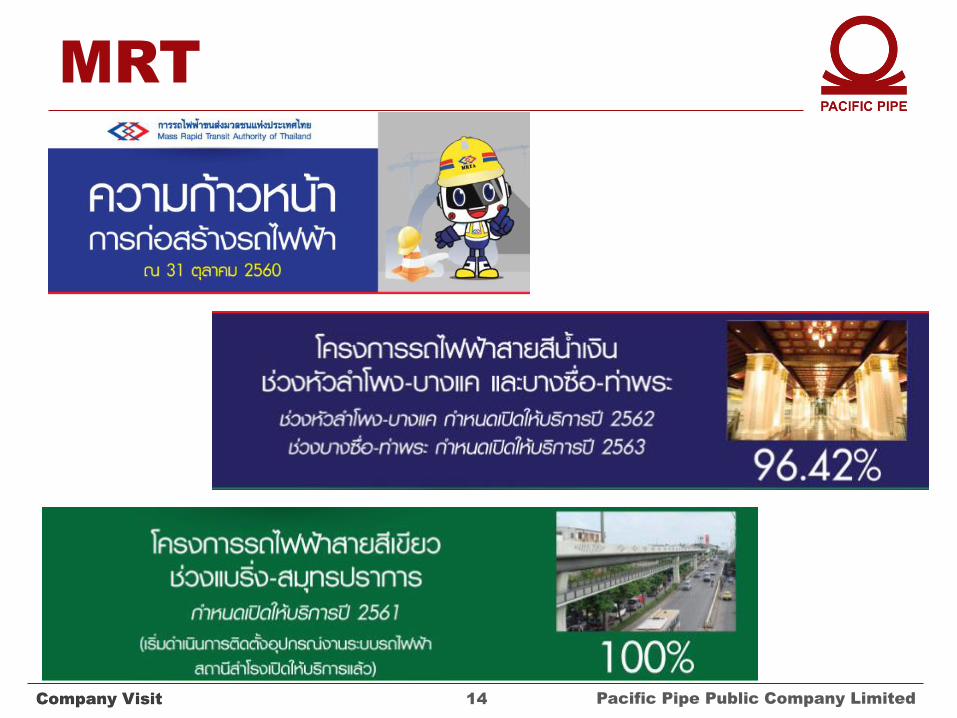
MRT
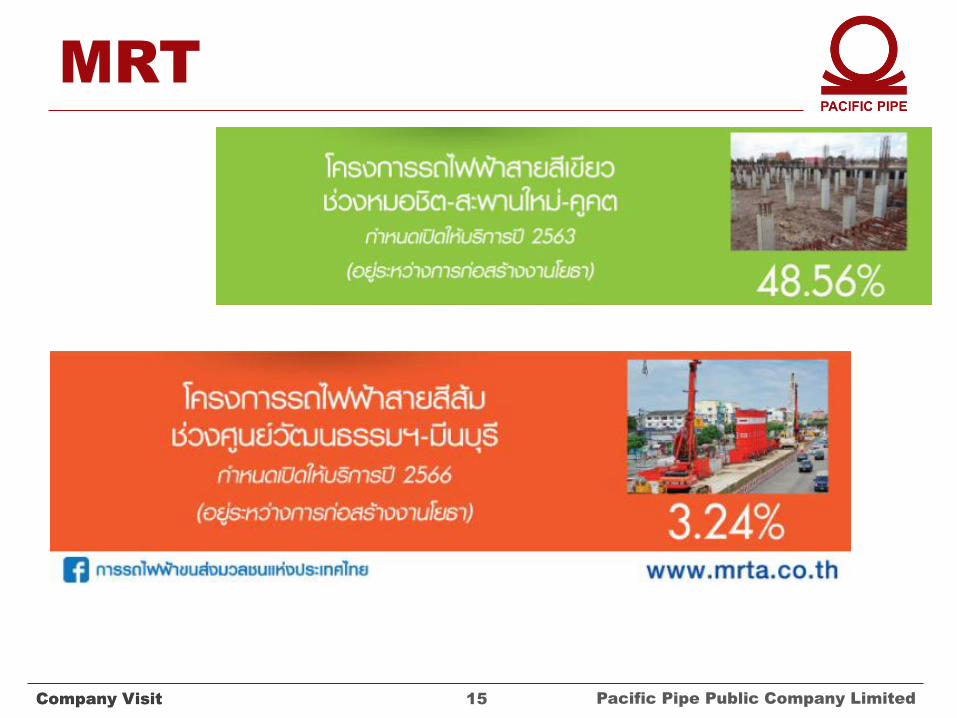
Company Visit Pacific Pipe Public Company Limited15
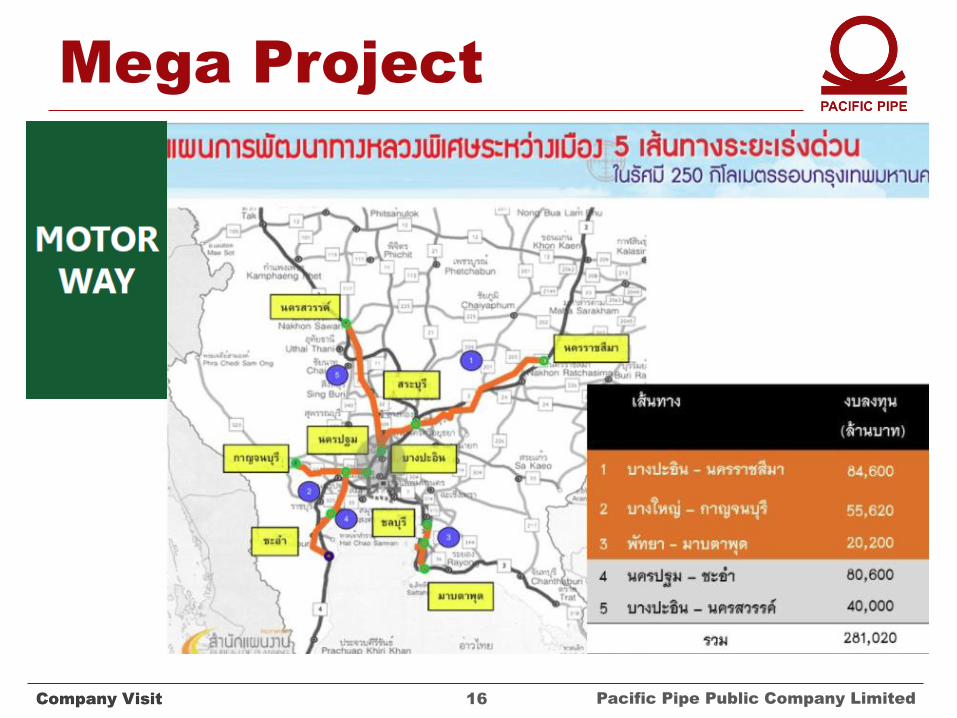
Mega Project
Company Visit Pacific Pipe Public Company Limited16
Mega Project
Company Visit Pacific Pipe Public Company Limited17
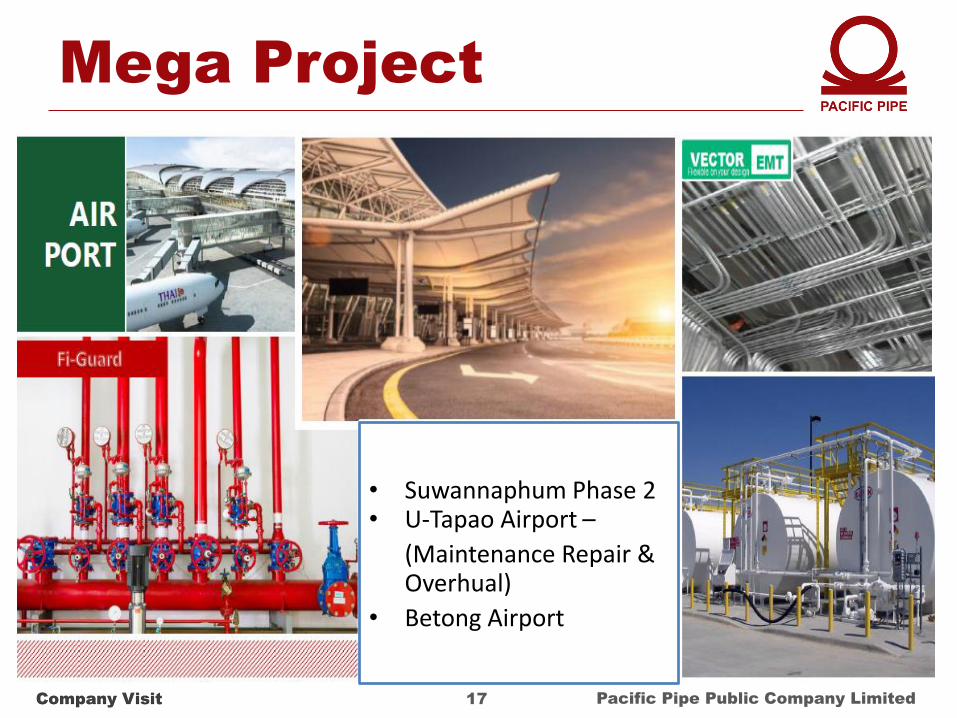
• Suwannaphum Phase 2• U-Tapao Airport –
(Maintenance Repair & Overhual)
• Betong Airport
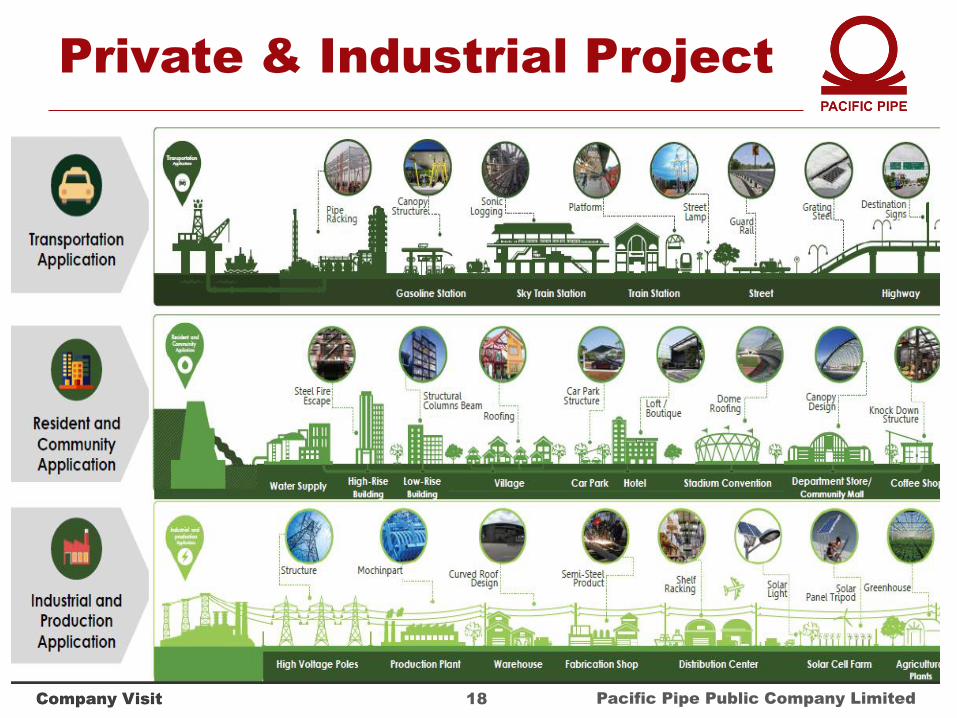
Private & Industrial Project
Company Visit Pacific Pipe Public Company Limited18
1. Overview of PAP
3. Company Performance
2. Economic & Steel Industry
Opportunity Day Pacific Pipe Public Company Limited
Agenda
19
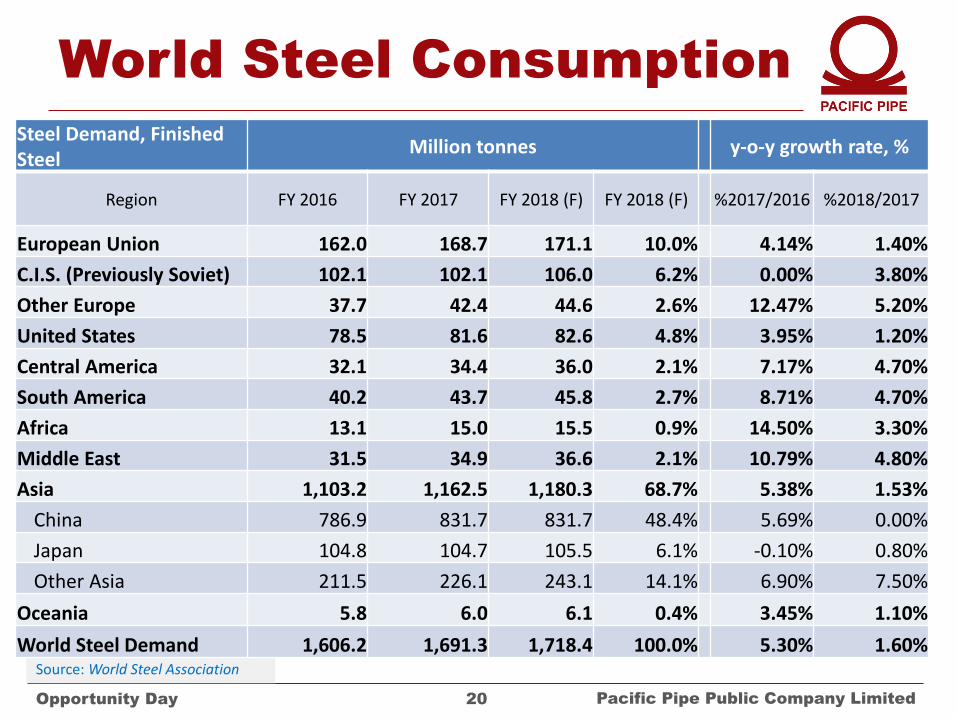
World Steel Consumption
Opportunity Day Pacific Pipe Public Company Limited20
Source: World Steel Association
Steel Demand, Finished Steel
Million tonnes y-o-y growth rate, %
Region FY 2016 FY 2017 FY 2018 (F) FY 2018 (F) %2017/2016 %2018/2017
European Union 162.0 168.7 171.1 10.0% 4.14% 1.40%
C.I.S. (Previously Soviet) 102.1 102.1 106.0 6.2% 0.00% 3.80%
Other Europe 37.7 42.4 44.6 2.6% 12.47% 5.20%
United States 78.5 81.6 82.6 4.8% 3.95% 1.20%
Central America 32.1 34.4 36.0 2.1% 7.17% 4.70%
South America 40.2 43.7 45.8 2.7% 8.71% 4.70%
Africa 13.1 15.0 15.5 0.9% 14.50% 3.30%
Middle East 31.5 34.9 36.6 2.1% 10.79% 4.80%
Asia 1,103.2 1,162.5 1,180.3 68.7% 5.38% 1.53%
China 786.9 831.7 831.7 48.4% 5.69% 0.00%
Japan 104.8 104.7 105.5 6.1% -0.10% 0.80%
Other Asia 211.5 226.1 243.1 14.1% 6.90% 7.50%
Oceania 5.8 6.0 6.1 0.4% 3.45% 1.10%
World Steel Demand 1,606.2 1,691.3 1,718.4 100.0% 5.30% 1.60%
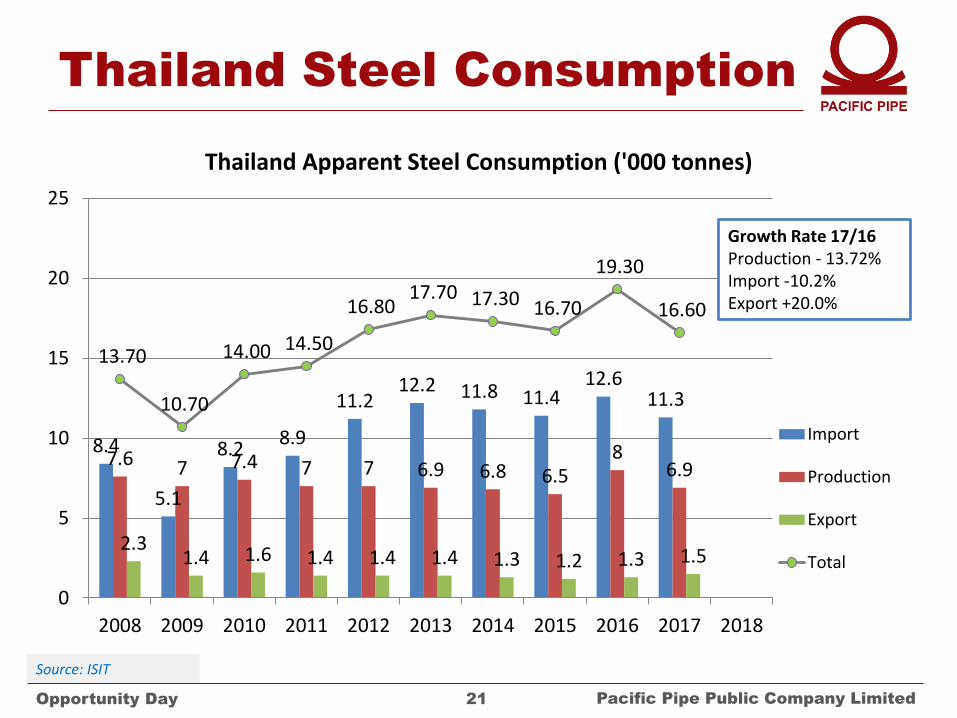
Thailand Steel Consumption
Source: ISIT
Opportunity Day Pacific Pipe Public Company Limited21
8.4
5.1
8.28.9
11.212.2 11.8 11.4
12.611.3
7.6 7 7.4 7 7 6.9 6.8 6.58
6.9
2.31.4 1.6 1.4 1.4 1.4 1.3 1.2 1.3 1.5
13.70
10.70
14.00 14.50
16.80 17.70 17.30 16.70
19.30
16.60
0
5
10
15
20
25
2008 2009 2010 2011 2012 2013 2014 2015 2016 2017 2018
Thailand Apparent Steel Consumption ('000 tonnes)
Import
Production
Export
Total
Growth Rate 17/16Production - 13.72%Import -10.2%Export +20.0%
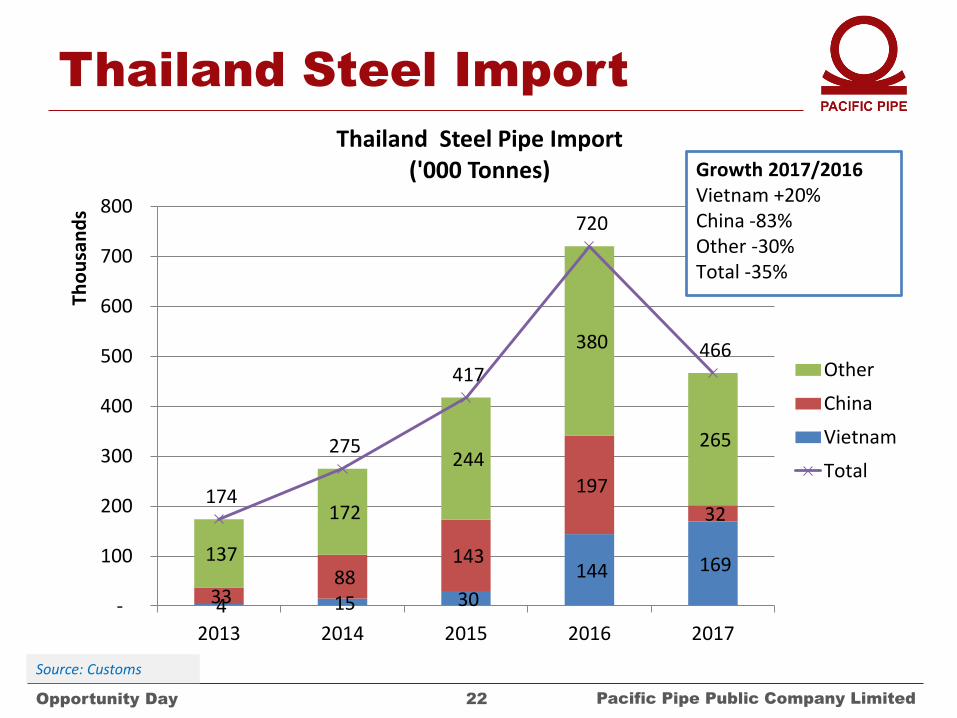
Thailand Steel Import
Opportunity Day Pacific Pipe Public Company Limited22
Source: Customs
4 15 30
144 169
33 88
143
197
32
137
172
244
380
265
174
275
417
720
466
-
100
200
300
400
500
600
700
800
2013 2014 2015 2016 2017
Tho
usa
nd
s
Thailand Steel Pipe Import ('000 Tonnes)
Other
China
Vietnam
Total
Growth 2017/2016Vietnam +20%China -83%Other -30%Total -35%

Source : PAP data center
21.30
623
797.57
200
300
400
500
600
700
800
900
12.00
13.00
14.00
15.00
16.00
17.00
18.00
19.00
20.00
21.00
22.00
Ch
ina
Mar
ket
Pri
ce (U
SD/M
T)
Thai
Mar
ket
Pri
ce(U
SD/M
T)Steel Price Trend
2 years back data
THB HRC CNY HRC CNY GI Linear (CNY HRC)
592 396
389
100
150
200
250
300
350
400
450
200
250
300
350
400
450
500
550
600
650
Thai
Mar
ket
Pri
ce(U
SD/M
T)
Raw Material Trend2 years back data
Billet Slab Scrap
21.30
623
200
250
300
350
400
450
500
550
600
650
700
12.00
13.00
14.00
15.00
16.00
17.00
18.00
19.00
20.00
21.00
22.00C
hin
a M
arke
t P
rice
(USD
/MT)
Thai
Mar
ket
Pri
ce(U
SD/M
T)
Steel Price Trend2 years back data
THB HRC CNY HRC
Supplier Financial Risk
THUS section 232
World
Factor effect Steel Price
1. Overview of PAP
3. Company Performance
2. Economic & Industry Overview
Opportunity Day Pacific Pipe Public Company Limited
Agenda
24
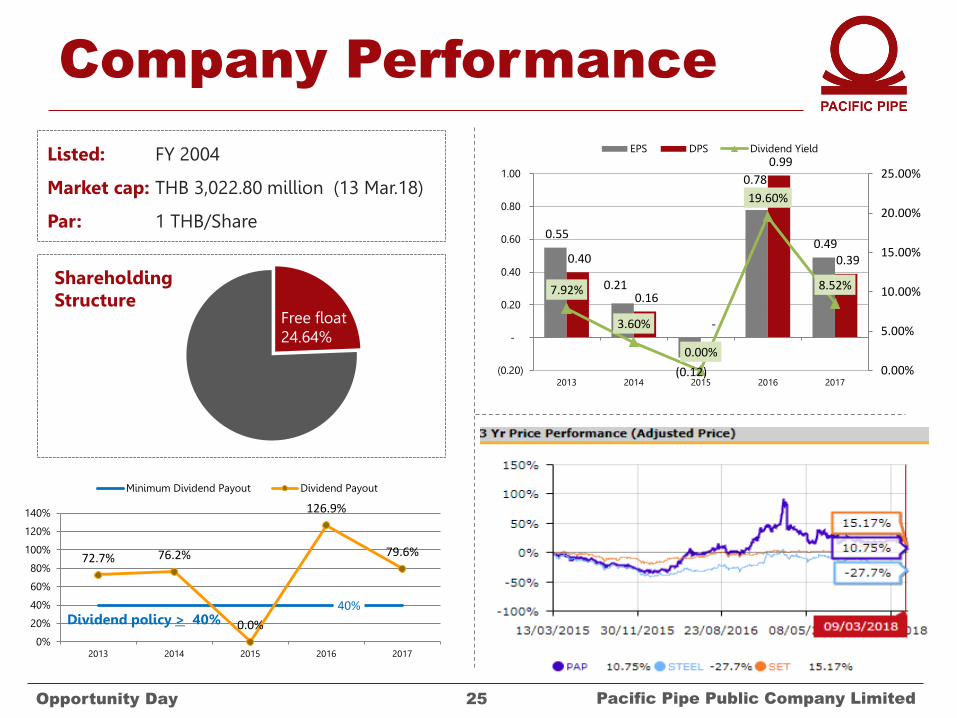
40%
72.7% 76.2%
0.0%
126.9%
79.6%
0%
20%
40%
60%
80%
100%
120%
140%
2013 2014 2015 2016 2017
Minimum Dividend Payout Dividend Payout
Company Performance
Opportunity Day Pacific Pipe Public Company Limited25
Listed: FY 2004
Market cap: THB 3,022.80 million (13 Mar.18)
Par: 1 THB/Share
Shareholding Structure
Free float 24.64%
Dividend policy > 40%
0.55
0.21
(0.12)
0.78
0.49 0.40
0.16
-
0.99
0.39
7.92%
3.60%
0.00%
19.60%
8.52%
0.00%
5.00%
10.00%
15.00%
20.00%
25.00%
(0.20)
-
0.20
0.40
0.60
0.80
1.00
2013 2014 2015 2016 2017
EPS DPS Dividend Yield
Company Performance
26Opportunity Day Pacific Pipe Public Company Limited26
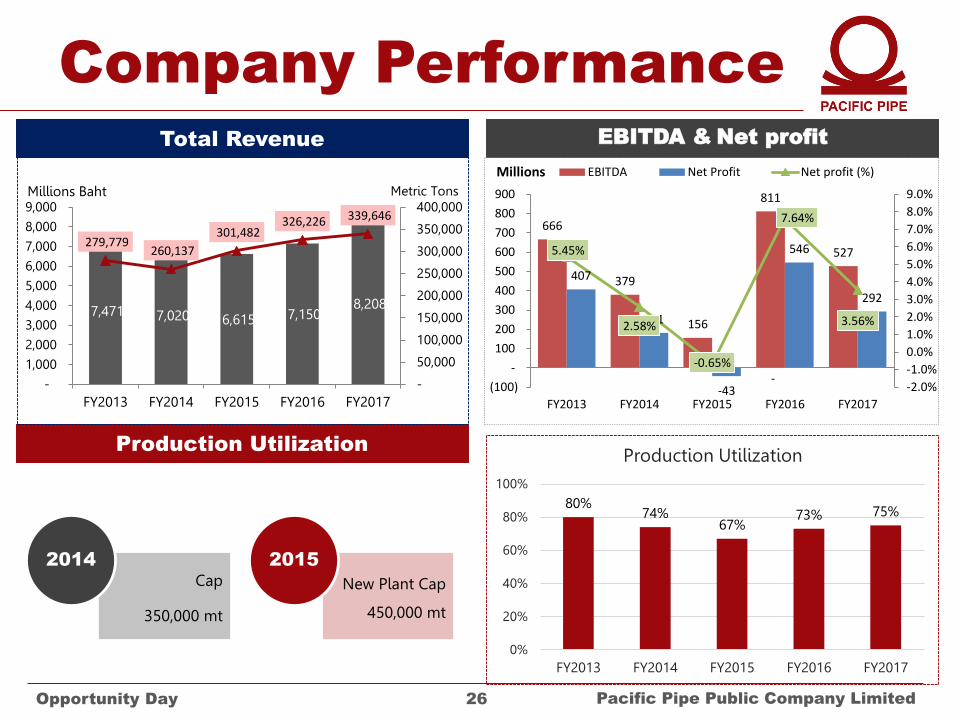
Production Utilization
Cap
350,000 mt
2014
New Plant Cap
450,000 mt
2015
Total Revenue EBITDA & Net profit
666
379
156
811
527
407
181
-43
546
292
5.45%
2.58%
-0.65%
7.64%
3.56%
-2.0%
-1.0%
0.0%
1.0%
2.0%
3.0%
4.0%
5.0%
6.0%
7.0%
8.0%
9.0%
(100)
-
100
200
300
400
500
600
700
800
900
FY2013 FY2014 FY2015 FY2016 FY2017
EBITDA Net Profit Net profit (%)Millions
-
7,471 7,020 6,615 7,150 8,208
279,779 260,137
301,482 326,226 339,646
-
50,000
100,000
150,000
200,000
250,000
300,000
350,000
400,000
- 1,000 2,000 3,000 4,000 5,000 6,000 7,000 8,000 9,000
FY2013 FY2014 FY2015 FY2016 FY2017
Millions Baht Metric Tons
80%74%
67%73% 75%
0%
20%
40%
60%
80%
100%
FY2013 FY2014 FY2015 FY2016 FY2017
Production Utilization
Company Performance
Opportunity Day Pacific Pipe Public Company Limited27
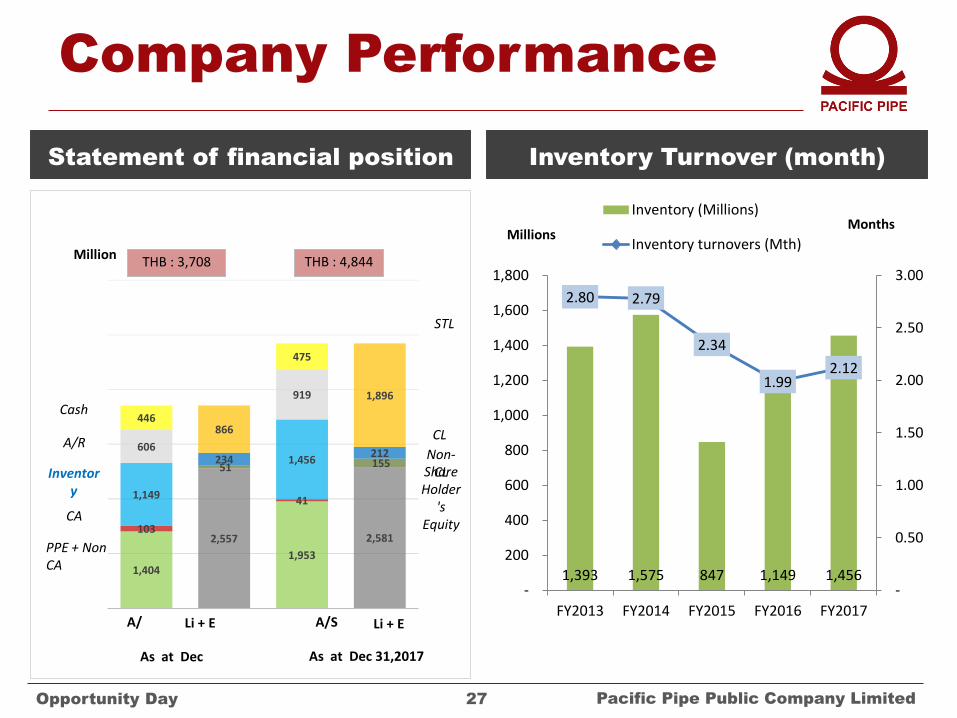
Statement of financial position Inventory Turnover (month)
1,393 1,575 847 1,149 1,456
2.80 2.79
2.34
1.992.12
-
0.50
1.00
1.50
2.00
2.50
3.00
-
200
400
600
800
1,000
1,200
1,400
1,600
1,800
FY2013 FY2014 FY2015 FY2016 FY2017
Inventory (Millions)
Inventory turnovers (Mth)Millions
Months
2,557 2,581
51 155 234212
866
1,896
1,404
1,953
103
411,149
1,456606
919
446
475
As at Dec As at Dec 31,2017
Cash
Inventory
A/R
CA
PPE + Non CA
STL
CL
Share Holder
's Equity
Million
Non-CL
A/ Li + ELi + E A/S
THB : 4,844 THB : 3,708
Company Performance
28Opportunity Day Pacific Pipe Public Company Limited28
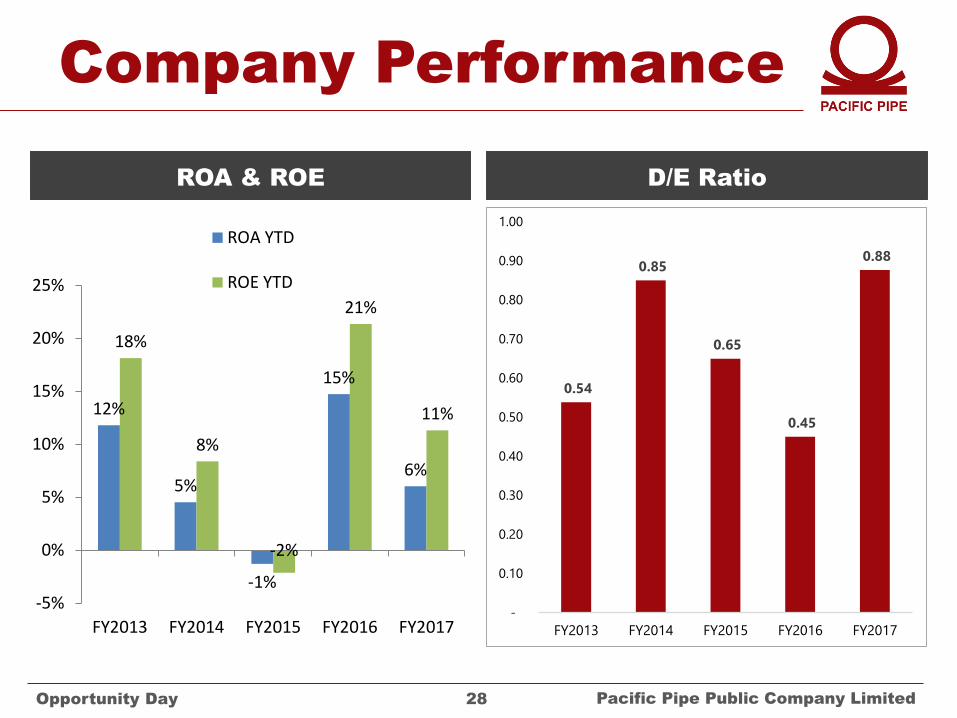
ROA & ROE D/E Ratio
0.54
0.85
0.65
0.45
0.88
-
0.10
0.20
0.30
0.40
0.50
0.60
0.70
0.80
0.90
1.00
FY2013 FY2014 FY2015 FY2016 FY2017
12%
5%
-1%
15%
6%
18%
8%
-2%
21%
11%
-5%
0%
5%
10%
15%
20%
25%
FY2013 FY2014 FY2015 FY2016 FY2017
ROA YTD
ROE YTD


