40 STRATEGIES November 2005 www.traders-mag.com Pairs trading refers to opposite positions in two different stocks or indices, that is, a long (bullish) position in one stock and another short (bearish) position in another stock. The objective is to make money on the relative price movements between them. The two stocks might both go up, but the stock you are long will go up more and faster than the stock you are short. Or, the two stocks might both go down, but the stock you are short will drop more and faster than the stock you are long. One half of the pairs trade may be profitable, and the other half of the pairs trade may lose money, but the goal is for the profits to exceed the losses. Pairs trading can be simple in concept, but can be one of the most complex types of trading in practice. This article will outline the basic approach of pairs trading, and some ideas of how to apply the strategy. What you do in a pairs trade is try to profit from a situation where one stock looks cheap or expensive relative to another. You buy the stock that is relatively cheap and sell the stock that is relatively expensive, speculating that the long position will rise relative to the short position. To make the trade more intuitive, I look at the price of one stock minus the price of another. I then try to see whether that difference is historically high or low, or if I expect it to move in one direction or another given stronger performance in one stock over another. Generally, I look at the historical spread between the two stocks to see if there is any consistent relationship. That is, does the spread fluctuate back and forth around an average number (revert to a mean), or does it seem to trend up or down? If there is an average or mean spread price over a particular period of time, I can judge whether I should sell one stock and buy the other based on whether the current spread price is higher or lower than the average. For example, if the average difference between daily closing prices of stock A and stock B (stock A minus stock B) is $1.00, and if the current price of stock A is $53 and stock B is $49, then the current difference is $4.00. That $4.00 is 3.00 points higher than the average difference. So, expecting that the difference will revert back to the mean of $1.00, a trader could infer that either stock A is overpriced at $53 or stock B is under-priced at $49. Either way, the idea would be to sell stock A and buy stock B. If the spread comes back to its average of $1.00, there is the possibility of making $3.00 on that pairs trade. Alternatively, if I expected that stock A would continue to outperform stock B, I would buy stock A and sell stock B. The stocks or indices that make good candidates for the pairs trade should have some measurable relationship. Ideally, the stocks or indices in the pairs trade should have a positive correlation and betas that are stable over time. Correlation is a statistical coefficient that measures the strength, within a range of +1 to -1, of the relationship between two variables. In this case, the variables are stocks or indices. The idea of correlation Pairs Trading
Transcript
40
STRATEGIES
November 2005 www.traders-mag.com
Pairs trading refers to opposite positions in two different stocksor indices, that is, a long (bullish) position in one stock and anothershort (bearish) position in another stock. The objective is to makemoney on the relative price movements between them. The two stocksmight both go up, but the stock you are long will go up more andfaster than the stock you are short. Or, the two stocks might both godown, but the stock you are short will drop more and faster than thestock you are long. One half of the pairs trade may be profitable, andthe other half of the pairs trade may lose money, but the goal is forthe profits to exceed the losses.
Pairs trading can be simple in concept, but can be one of the mostcomplex types of trading in practice. This article will outline the basicapproach of pairs trading, and some ideas of how to apply the strategy.
What you do in a pairs trade is try to profit from a situation whereone stock looks cheap or expensive relative to another. You buy thestock that is relatively cheap and sell the stock that is relativelyexpensive, speculating that the long position will rise relative to theshort position. To make the trade more intuitive, I look at the price ofone stock minus the price of another. I then try to see whether thatdifference is historically high or low, or if I expect it to move in onedirection or another given stronger performance in one stock overanother. Generally, I look at the historical spread between the twostocks to see if there is any consistent relationship. That is, does the
spread fluctuate back and forth around an average number (revert toa mean), or does it seem to trend up or down? If there is an average ormean spread price over a particular period of time, I can judge whetherI should sell one stock and buy the other based on whether the currentspread price is higher or lower than the average. For example, if theaverage difference between daily closing prices of stock A and stockB (stock A minus stock B) is $1.00, and if the current price of stock A is$53 and stock B is $49, then the current difference is $4.00. That $4.00is 3.00 points higher than the average difference. So, expecting thatthe difference will revert back to the mean of $1.00, a trader couldinfer that either stock A is overpriced at $53 or stock B is under-pricedat $49. Either way, the idea would be to sell stock A and buy stock B. Ifthe spread comes back to its average of $1.00, there is the possibilityof making $3.00 on that pairs trade. Alternatively, if I expected thatstock A would continue to outperform stock B, I would buy stock Aand sell stock B.
The stocks or indices that make good candidates for the pairs tradeshould have some measurable relationship. Ideally, the stocks orindices in the pairs trade should have a positive correlation and betasthat are stable over time.
Correlation is a statistical coefficient that measures the strength,within a range of +1 to -1, of the relationship between two variables.In this case, the variables are stocks or indices. The idea of correlation
Pairs Trading
41
F1) MNX Short Vertical Call
The profit/loss graph of the short MNX 160/162.5 call vertical indicatesprofit below the break even point of 161.40, with the maximum lossreached at 162.50 or higher. The idea of the pairs trade is that the loss inone spread will be offset by the gains in another.
F2) MNX vs SPY Pairs Trade
Trading software can be used to evaluate the risk of positions across twoor more underlying stocks or indices. In the case of a pairs trade, it is usefulto see what the maximum risk is for a worst-case scenario. For the MNX/SPY pairs trade, the max risk is $210 per pair if the correlation between thetwo indices breaks down.
as it relates to trading is best described by an example. If stock A andstock B both move up and down at the same time, then stock A and Bhave a high positive correlation (close to +1). If stock A moves up andstock B moves down at the same time, then stock A and B have a highnegative correlation (close to -1). If stock A and B move up and downcompletely randomly, then stock A and B have zero correlation.Correlation is calculated by dividing the covariance of the percentagechanges of each stock or index divided by the product of the standarddeviations for the two stocks. Covariance is a measure of the tendencyof the two stocks or indices to move together, and dividing thecovariance by the standard deviations sets the correlation between+1 and -1. Many trading software packages include correlationsbetween stocks, but you can use a spreadsheet function to performthe calculation using historical stock and index data. The correlationwill indicate the strength of the relationship between the changes ofthe two stocks for the time covered by the data.
When I look for candidate stocks for pairs trades, I look forcorrelations .80 or above. The reason for this is that I want stocks thathave a very consistent relationship so that I can take advantage ofthat relationship if it appears out of line. The question when measuringthe correlation coefficient between two stocks is about how muchdata to use. The correlation calculated using six months of daily datawill almost certainly be different from the correlation and betacalculated using three years of monthly data. For example, thecorrelation between MSFT and IBM for six months of daily data is .41,but for three years of monthly data, the correlation is .55. Which onedo you use? That is a question that each trader must decide for hers-
elf. But a good starting point is to use the correlation for approximatelythe same number of days that you predict you will hold the pairs trade.A technique I like that doesn’t rely on more sophisticated statisticaltests is to look at a range of dates for the calculations, say 30 days, 60days, 90 days, and 120 days and see how similar the correlations arebetween them. The more similar they are, the more confident I amthat the two stocks or indices will continue to have that relationship.
Beta is another tool used in pairs trading that predicts the behaviorof one stock based on information about another stock. It is acoefficient that measures the magnitude of the relationship betweentwo stocks or indices and is calculated with a linear regression model.In the regression, the set of one stock’s percentage returns is set asthe independent variable, and the other stock’s percentage returns isset as the dependent variable. The beta indicates the magnitude ofthe relationship of the independent variable relative to the dependentvariable. In trading terms, beta indicates how much a stock will movewhen another stock or index moves 1%. Beta is usually displayed asthe percentage that a stock moves against a particular index, such asthe S&P 500 in the U.S. For example, if you see that IBM has a beta of1.6, that suggests that when the S&P 500 moves up 1%, IBM wouldmove up 1.6%.
The questions about the amount of data to use for correlationsare applicable to beta. For six months of daily data, the beta for IBMrelative to MSFT is .54, meaning IBM moves .54% when MSFT moves1%. For three years of monthly data, the beta for IBM relative to MSFTis .73, meaning IBM moves .73% when MSFT moves 1%. I would usethe same data for the beta calculation that I use for the correlation,and would also look for the beta not to change very much betweenthe different timeframes.
Beta is used to determine how many share of each stock to execute
42
STRATEGIES
November 2005 www.traders-mag.com
for the pairs trade. Because beta measures the magnitude of therelationship between two stocks or indices, you can apply beta to thedelta of the positions to determine the quantity for each stock in thepair. Remember that delta is an estimate of how much an option willchange in value for a 1.00 change in the stock price. For example, ifstock A has a beta of 2.00 relative to stock B, then if stock B moves up1%, then stock A is expected to move up 2%. That means you need200 shares of stock B to have the same potential risk/reward profile as100 shares of stock A. There are finer points to this calculation that arebeyond the scope of this article, but that is the basic approach. Youcan get more accurate “beta-weighted” deltas on some tradingplatforms. For convenience, I typically use stocks or indices that havea beta very close to 1.00 with each other. That way, one is notsignificantly riskier than the other, and the deltas can be roughlyequivalent in the pairs positions.
Once you determine how many deltas you want for each stock orindex of the pairs trade, you have to find trades that will give you thecorrect relative exposure. You can choose between stocks, options, orstocks plus options. Each has advantages and disadvantages. Stocksare relatively easy to execute in actively traded stocks, but have virtuallyunlimited risk if you’re wrong. That is, if you expect that a spread betweentwo stocks will revert to a mean, but if it does not, you can lose a lot ofmoney on both the long and short stock positions of the pairs trade. Iuse stocks only when I am highly confident in the trade.
Options are a good vehicle for pairs trading, and can simply beused as stock substitutes: long calls for long stock, long puts for shortstock. Options have limited risk, but can be tougher to execute quickly.Options also usually have higher “slippage” in execution than stocksdo. Also, buying options has its own risks, such as time decay andexposure to drops in implied volatility (vega). Option spreads havemany advantages, such as limited risk and reduced exposure togamma, theta, and vega. They can also used to create situations whereyou can still profit if the spread between the pairs trade does not movethe way you expect it will.
When looking for strategies comprising the pair, I want to haveroughly the same dollar amount of risk between the positions. Thatis, I would make or lose roughly the same amount between the twoverticals. The reason for doing this is to have the ability for one half ofthe pairs trade to make or lose as much as the other in the event thatthe pair does not move in the way you expect. You can also adjust thetrade quantities to make the risk/reward of the long and short verticalsequal. That is, you would buy two 2.50-point verticals and sell one5.00-point vertical. Such a position could be considered to have equalrisk and reward between the two verticals. The limited riskcharacteristics of vertical spreads provides a natural “stop” for the pairstrade.
Let’s take a specific example. The MNX Mini-Nasdaq 100 Index andSPY S&P 500 Spiders have a very high, stable correlation between eachother. MNX has a beta of 1.20 and SPX has a beta of 1.00, so we canexpect that when SPY moves up 1%, MNX will likely move up 1.2%.Looking at the spread between the prices of MNX and the SPY for2005, the average spread price is roughly 32, with the MNX trading 32points higher than the SPY on average. But that spread seems tofluctuate around a mean, with high values of 38 and low value of 26.With the value currently at 36, it seems to be trading at the high endof its range. To take advantage of that, you might want to get shortMNX at 160.50 and long SPY at 124.50. A possible trade would beselling the MNX Oct 160/162.50 call vertical for 1.40 credit and buying
Verticals and Other Spreads
A vertical spread is typically an options strategy involvingthe purchase and sale of two options of the same type andexpiration dates, but different strike prices. An example wouldbe a bull call spread consisting for example of a long Decembercall at a certain strike price and a short December call at a higherstrike price. The spread reaches its maximum profit at expirationif the underlying instrument is at the same level of the higherstrike price or higher.
The idea is very similar to a pairs trade which is also referredto a as a vertical spread. Two correlated stocks are selected.One is purchased and the other is sold short, in the expectationfor example that both rise but that the purchased stockincreases more in relation to the stock that was sold short. Inboth cases the object of a vertical spread is to reduce risk bylimiting potential loss and to reduce the effects of volatility.
One way to help remember what a vertical spreads is, aswell as its cousins the horizontal and the diagonal spread, is tothink of the way newspapers list the closing prices of options.A vertical spread would involve two options from the samecolumn in a newspaper listing, because they are of the sameexpiry month. Newspapers columns run vertically. A horizontalspread would involve two calls of the same strike price listed inthe same row (horizontal) of a newspaper listing (i.e. same strikeprice, different months). A diagonal spread would involve anoption from one row and column and another from a differentrow and column i.e., long a September call at one strike price,short a December call at a higher strike price.
F3) MNX vs SPY 2005
A graph of the difference between one index and another, in this case theMNX Mini NASDAQ 100 Index and the SPY S&P 500 SPDR, can indicate notonly whether the spread is mean-reverting, but also the typical magnitudeof its range as well as overbought/oversold situations.
January
05
February
05
March
05
April 05
May 05
June 05
July 05
August 05
Septem
ber 05
0
5
10
15
20
25
3035
40
45
Spre
ad V
alue
44
STRATEGIES
November 2005 www.traders-mag.com
Prior to joining thinkorswim as ManagingPartner and Director of QuantitativeStrategies, Mr. Preston held seniorpositions with financial technologycompanies and proprietary option tradingfirms. He holds multiple advanceddegrees, including an M.B.A in Financeand Statistics from the University ofChicago. [email protected].
Thomas Preston
trade moves. When the sides of the pairs trade are of equal risk andreward, for example selling a 5.00-point vertical and buying a 5.00-pointvertical, a credit is preferable. The initial credit allows for extrememoves in the spread and still provide the potential for profit. In thecase of the MNX vertical vs SPY vertical, the difference in the width ofthe verticals (2.50 vs 2.00) was offset by the large initial credit of .40.That kept the loss limited to .10 on the upside.
When paying for a pairs trade, that is, incurring a debit uponexecution, it is better to have one side to be able to make more moneythan the other. For example, selling a 2.00-point wide vertical andbuying a 2.50-point wide vertical. In a very large move in bothunderlying stocks or indices, the profits on the long vertical arepotentially greater than the loss on the short. So, a small debit isacceptable, as long as the long vertical’s profits exceed both the losson the short vertical and that initial debit. If both the long 2.50-pointand short 2.00-point verticals reach their maximum value, the profitof the long should offset the loss on the short 2.00-point vertical andthe initial debit. If both the long and short verticals reach theirminimum values, the loss on the pairs trade is restricted to thatminimum debit. Thus, in both cases where the pairs of stocks or indicesmake extreme price moves, there is a potential profit to balance thepotential loss.
The concept of using verticals for pairs trading can be extendedto other option spreads such as butterflies and condors, where thepurchase of one option spread in one stock or index is offset by thesale of another option spread in a different stock or index. Indeed, theonly conceptual limitation to pairs trading is the creativity of the trader.
There are, though, more practical issues regarding pairs tradingthat must be managed. First, it is not possible to submit pairs tradesas a package electronically with most brokers. The exchanges have
no means of routing such orders to be executed. As such, you mayhave to call your broker to execute the pairs trade as one trade. Therisk is in revealing a trade that you do not wish anyone else to takeadvantage of. Pairs trades are difficult to find, and you don’t wantanyone else profiting from your hard work.
The second is that if you can not enter the pairs trade in oneexecution electronically, you are forced to enter it by “legging”, that is,executing the two different sides of the pairs trades independently.Trading stocks in the pairs trade is least risky in this regard, as long asthe two stocks are liquid. Trading options, though, can be a problembecause options are typically much less liquid than stocks, and gettinggood fills on options spreads quickly can be difficult. And time is oftencritical when trying to establish a pairs trade when the relationshipbetween them presents a fleeting opportunity. The longer it takes toexecute the pairs trade, the higher the risk of missing the opportunity.
Determining when to close out a pairs trade can be relativelystraightforward. When the spread between the pair reverts back to itsmean, the speculation behind the pairs trade has been met, and it iswise to close it out with a profit or loss. Losses should be rare whenthis happens if the trade was constructed carefully, such as with aninitial credit for two verticals with equal profit/loss exposure. But ifthe spread does not revert, and even moves against you, when tradingpairs with stocks you should have a stop loss point where you exit thepairs trade altogether to prevent further losses. But with options, evenwhen the spread has moved dramatically against you, the potentialloss may be manageable such that you don’t need to exit the position,but might want to wait until the options’ expiration. This case canhappen when both stocks or indices of the pair move strongly in onedirection, and your verticals are nearing maximum value. In that case,if the pair was established for a credit, that credit may still amount toa profit if both verticals are in the money or completely worthless.This illustrates how critical it is to get pairs trades on at good prices.
Pairs trading can require patience in acquiring the knowledge,finding and analyzing suitable opportunities, and executing the trade.But the strategy can open up an array of possibilities in marketconditions that don’t present attractive trades in single stocks orindices. Although pairs trading can have a wide range of risk/rewardpossibilities, using options the risks can be reduced significantly. Andeven though the returns may not be stunning, they can be consistentenough to constitute a long-term, profitable trading strategy.
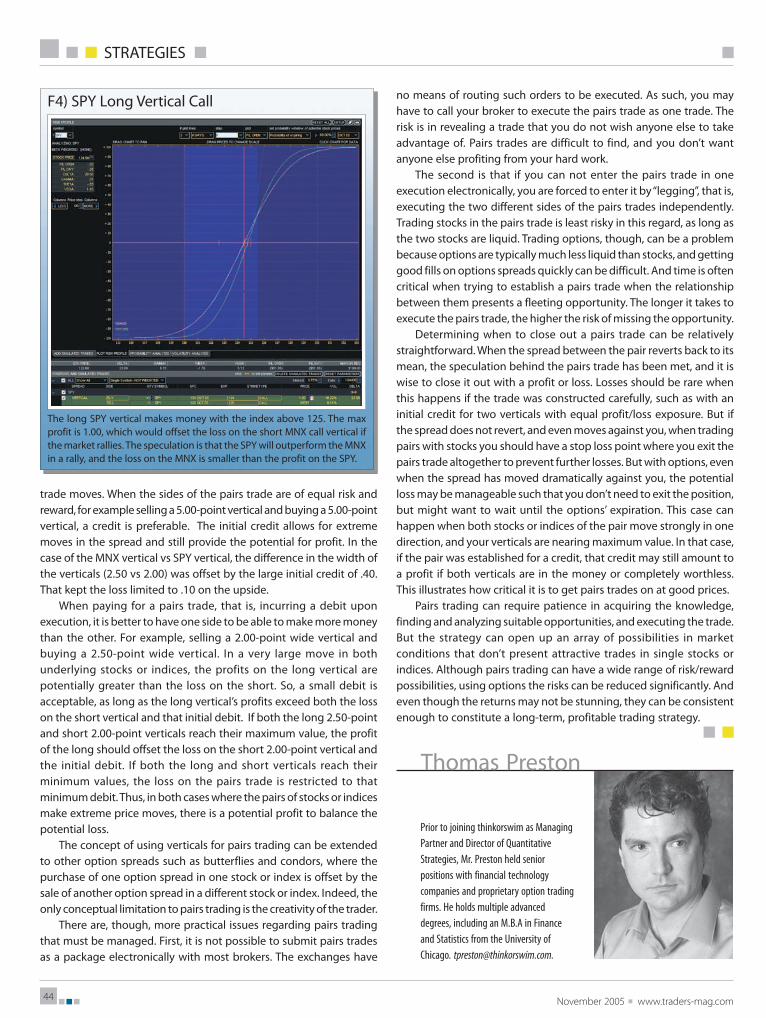
F4) SPY Long Vertical Call
The long SPY vertical makes money with the index above 125. The maxprofit is 1.00, which would offset the loss on the short MNX call vertical ifthe market rallies. The speculation is that the SPY will outperform the MNXin a rally, and the loss on the MNX is smaller than the profit on the SPY.