Pakistan Journal of Scientific and Industrial Research Vol. 52, No. 2 Contents March - April 2009 Physical Sciences Extractive Separation of Al(III) and Ni(II) by Di-2-Ethylhexyl Phosphoric Acid -Kerosene System from Aqueous Fluoride Medium Muhammad Fakhrul Islam, Dil Afroz Begum, Muhammad Matiur Rahman and Muhammad Saidur Rahman 59 Studies on the Lipolytic Enzymes of Sesamum indicum Seed Powder Nusrullah Akhtar, Salma Rahman and Abdul Jabbar 66 An Ecofriendly Systhesis of 4-Thiazolidinone Derivative Using Tributylammonium Bromide Under Microwave Irradiation Muhammad Naeem, Muhammad Nawaz Chaudhry and Rana Amjad 70 Biological Sciences Salicylic Acid Induced Physiological and Biochemical Changes in Wheat Under Drought Stress Conditions Sami Ullah Khan, Asghari Bano, Jalal Ud Din and Suba Sadiq Tahir 75 Micronutrient (Zn) Role in Stimulating Root Nodules and Yield of Chickpea Abdur Rashid 80 Status of Plant Available Sulphur and its Relationship to Other Soil Characteristics in Pothwar Soils Rizwan Khalid, Khalid Saifullah Khan, Ghulam Shabbir, Muhammad Yousaf and Shahid Yaqub Naz 84 Technology A Weak Current Amperometric Technique in Physiological and Bioelectromagnetic Measurements Masroor Hussain Shah Bukhari, John H. Miller Jr. and Zahoor Hussain Shah 91 Heterologous Expression of Chaetomium thermophilum Xylanase 11-A (CtX 11-A) Gene Saiqa Wajid, Shafiq Shahid, Farooq Latif, Zahid Mukhtar, Sher Afzal and Shahid Mansoor 100 Review Lobsters from Northern Arabian Sea (Pakistan Coast) Razia Sultana, Quddusi Begum Kazmi and Shahid Amjad 107
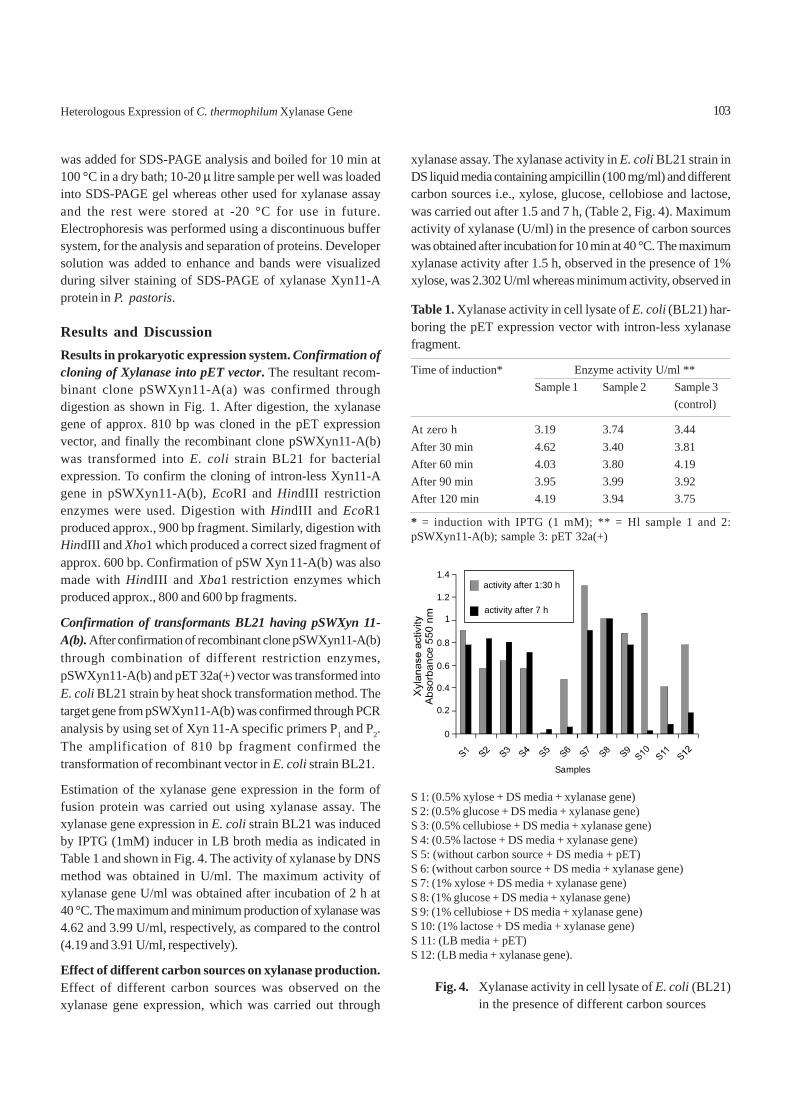
Transcript
Pakistan Journal of Scientific and Industrial Research Vol. 52, No. 2 Contents March - April 2009
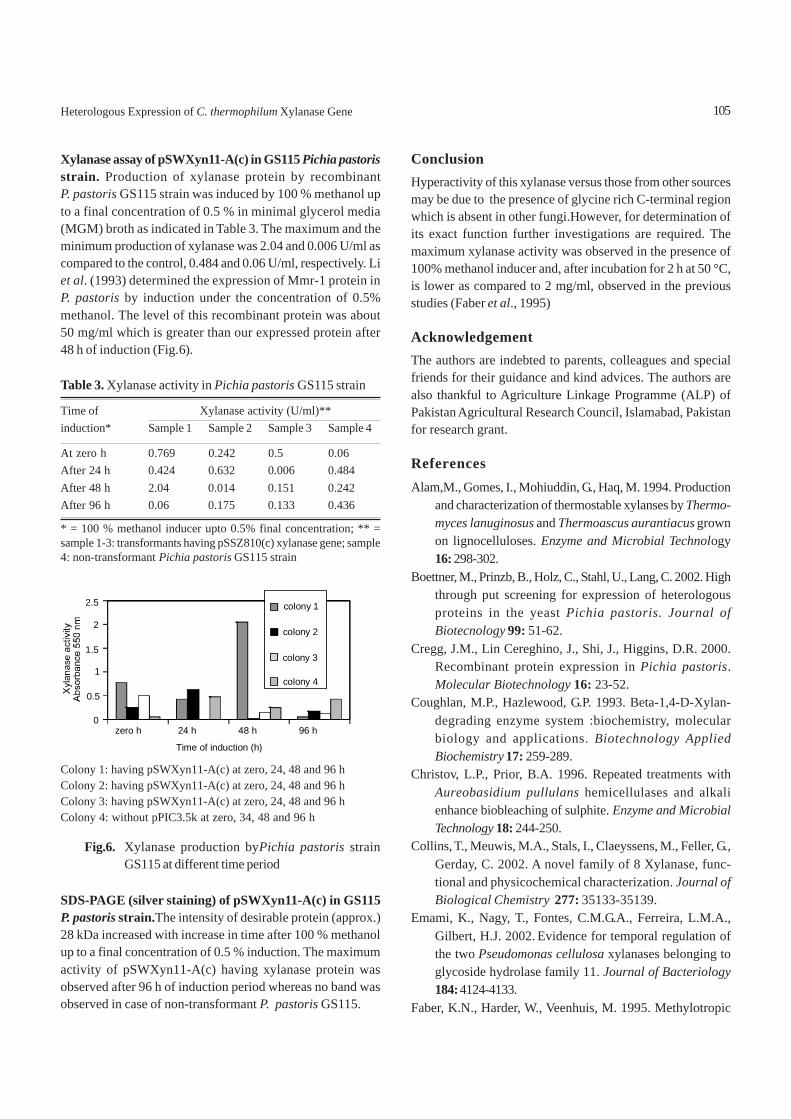
Physical Sciences
Extractive Separation of Al(III) and Ni(II) by Di-2-Ethylhexyl Phosphoric Acid -KeroseneSystem from Aqueous Fluoride MediumMuhammad Fakhrul Islam, Dil Afroz Begum, Muhammad Matiur Rahman andMuhammad Saidur Rahman 59
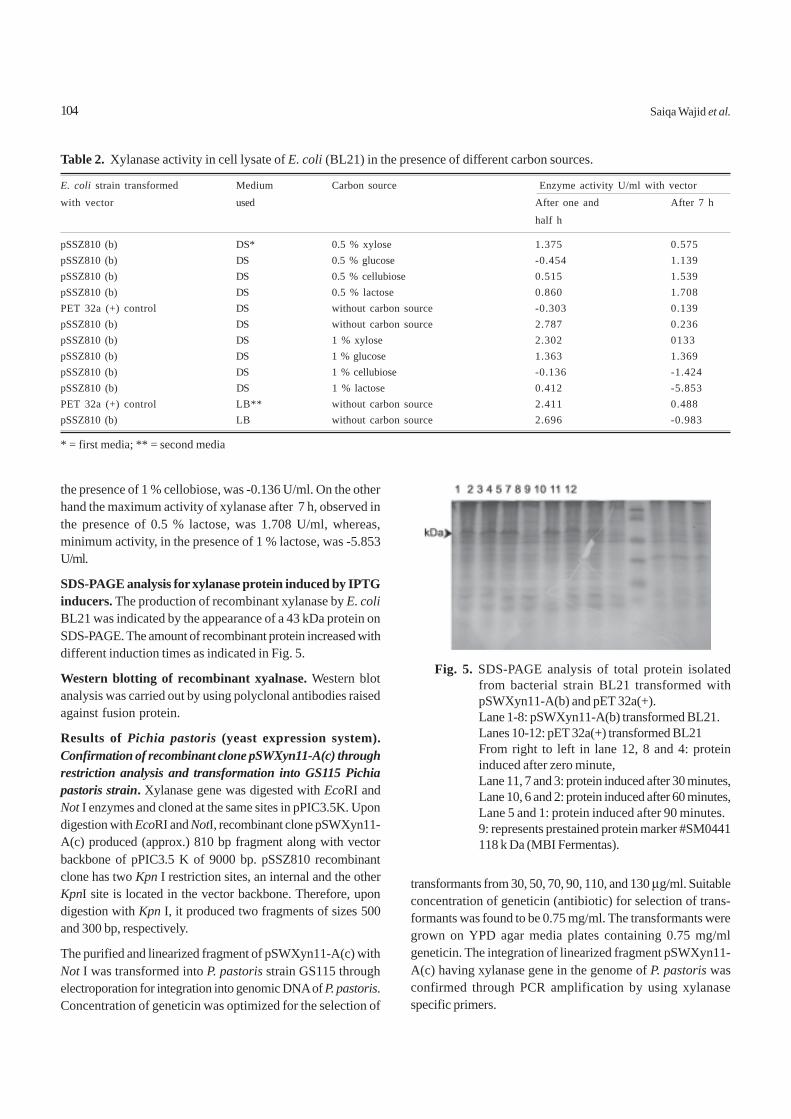
Studies on the Lipolytic Enzymes of Sesamum indicum Seed PowderNusrullah Akhtar, Salma Rahman and Abdul Jabbar 66
An Ecofriendly Systhesis of 4-Thiazolidinone Derivative Using TributylammoniumBromide Under Microwave IrradiationMuhammad Naeem, Muhammad Nawaz Chaudhry and Rana Amjad 70
Biological Sciences
Salicylic Acid Induced Physiological and Biochemical Changes in Wheat UnderDrought Stress ConditionsSami Ullah Khan, Asghari Bano, Jalal Ud Din and Suba Sadiq Tahir 75
Micronutrient (Zn) Role in Stimulating Root Nodules and Yield of ChickpeaAbdur Rashid 80
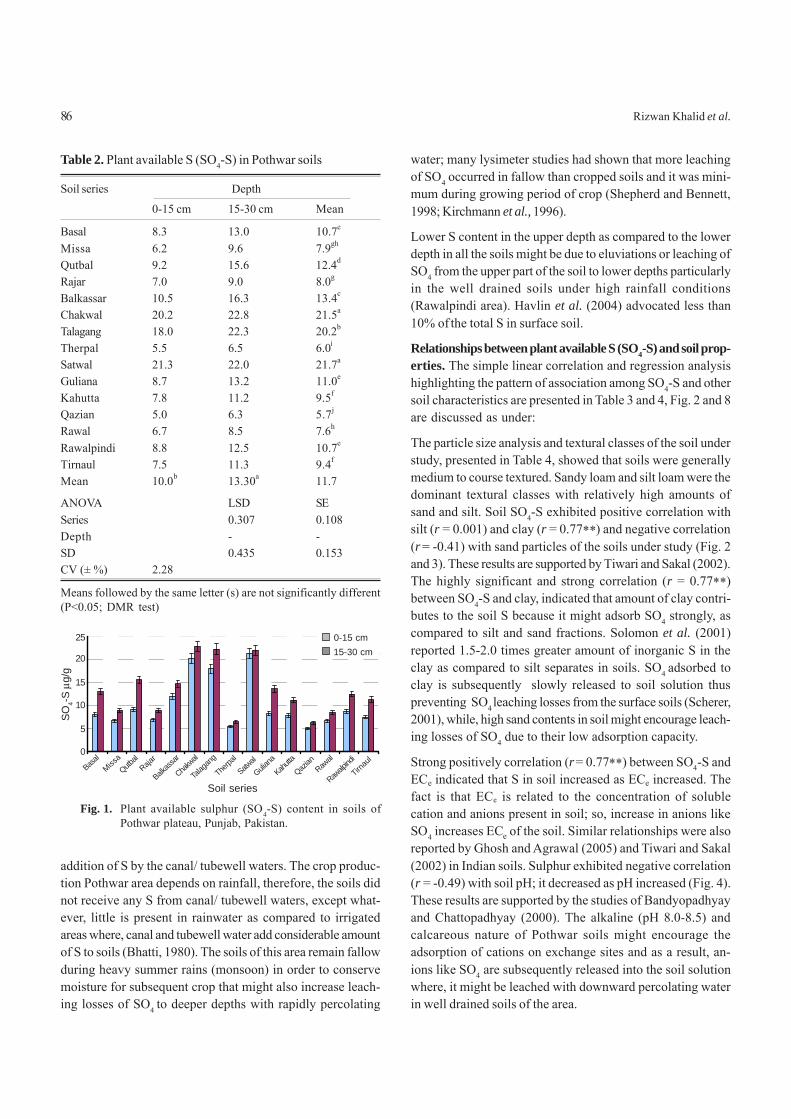
Status of Plant Available Sulphur and its Relationship to Other Soil Characteristics inPothwar SoilsRizwan Khalid, Khalid Saifullah Khan, Ghulam Shabbir, Muhammad Yousaf andShahid Yaqub Naz 84
Technology
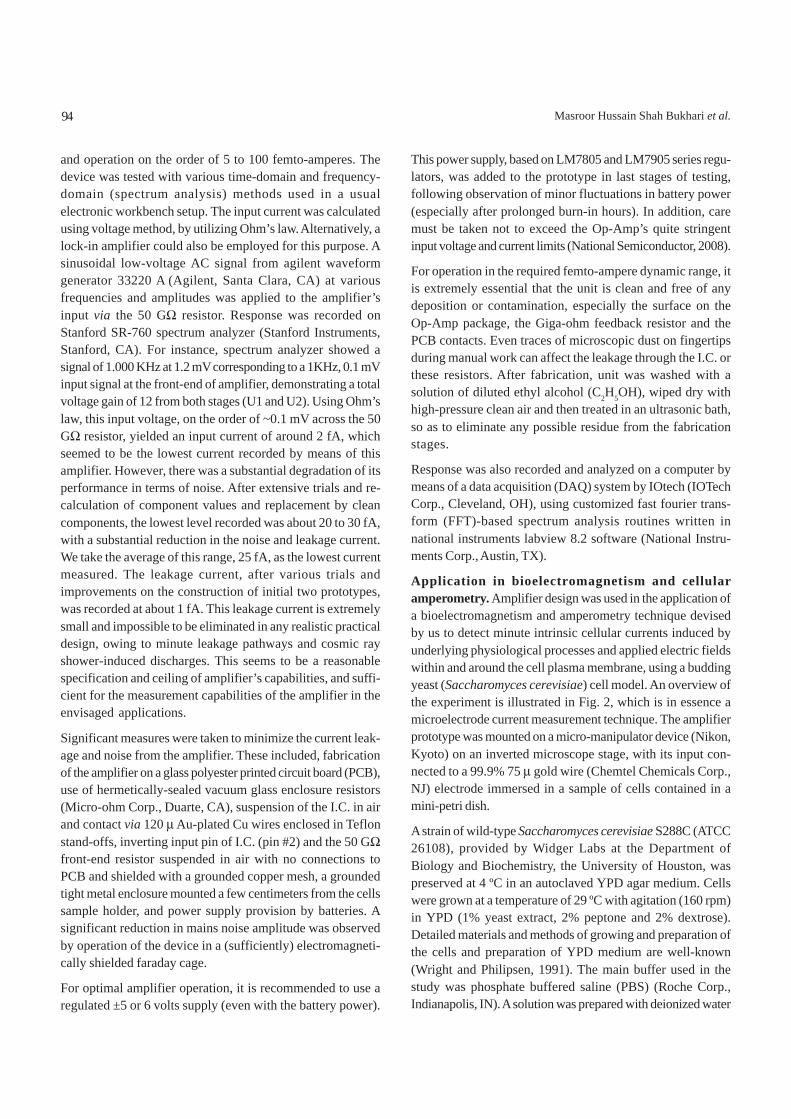
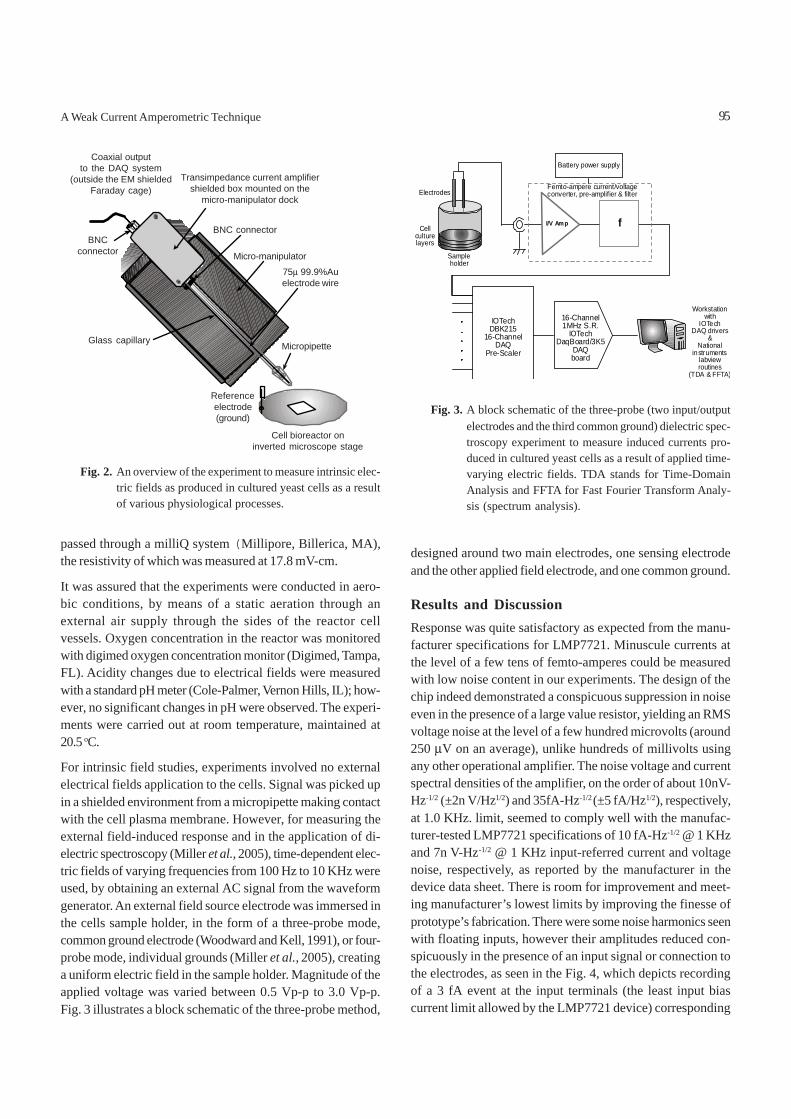
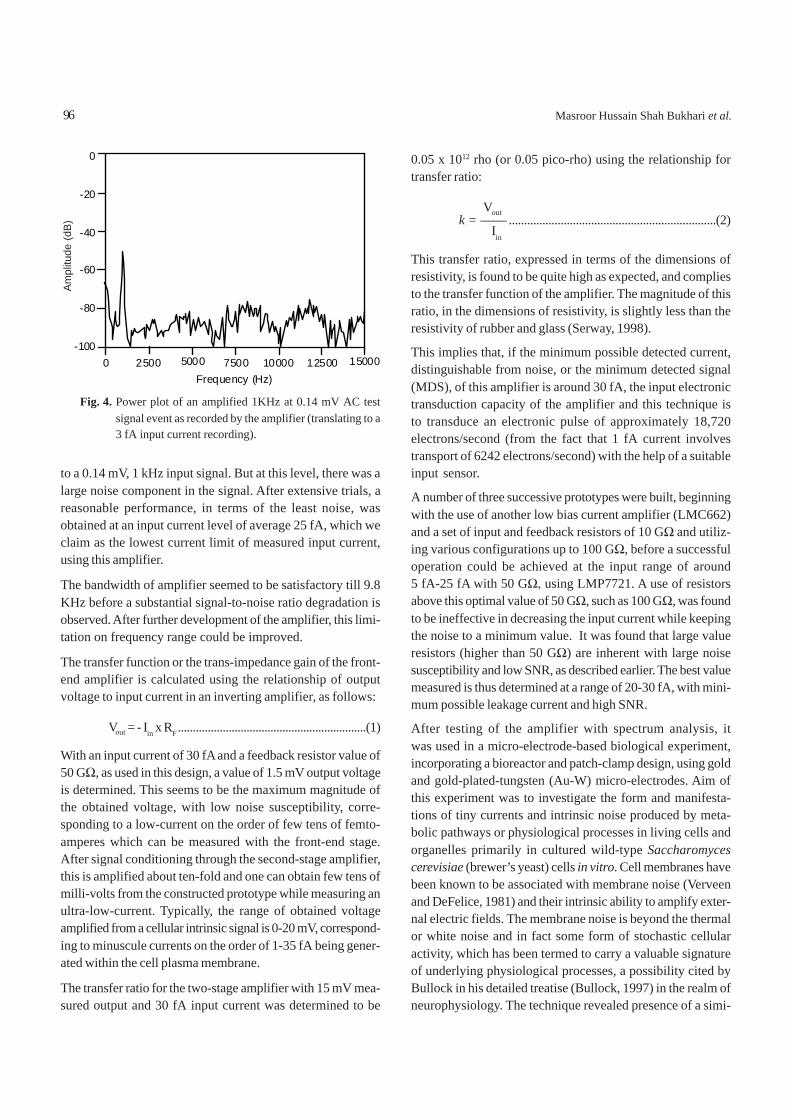
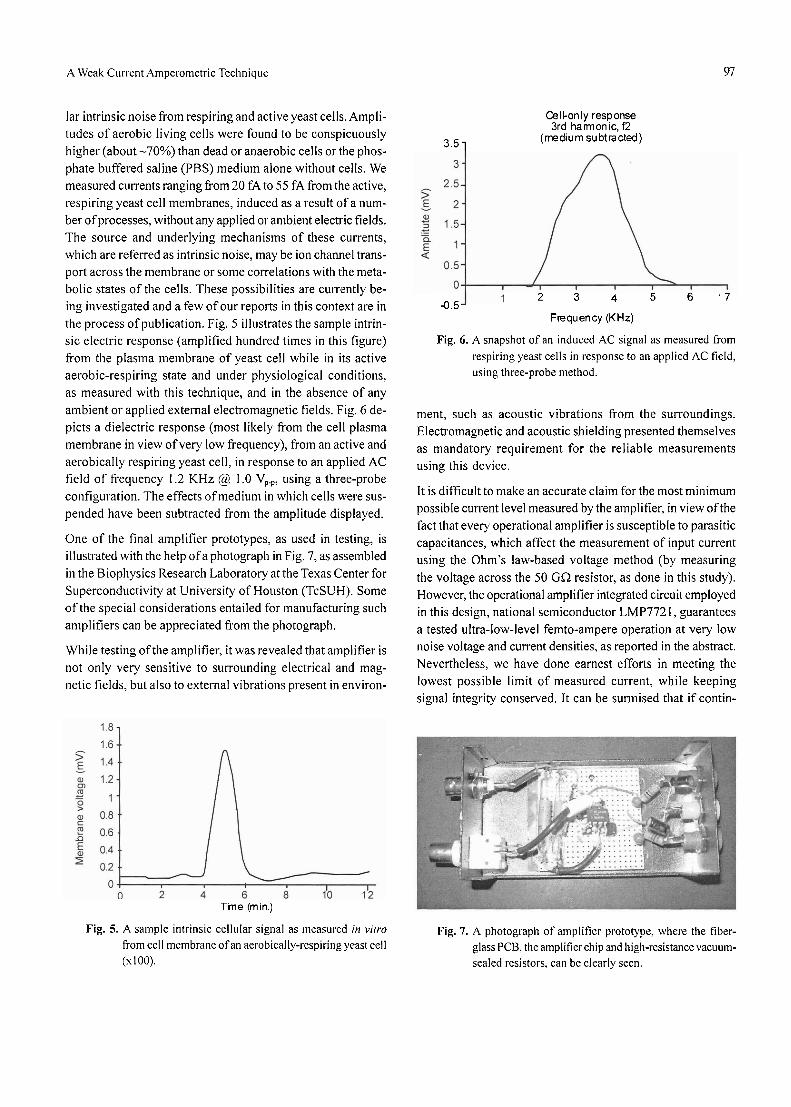
A Weak Current Amperometric Technique in Physiological and BioelectromagneticMeasurementsMasroor Hussain Shah Bukhari, John H. Miller Jr. and Zahoor Hussain Shah 91
IntroductionLiquid-liquid extraction is one of the most promising andeffective extraction and separation technique in hydrometal-lurgy. Particularly phosphorus-based extractant, D2EHPA,(a commercial extractant) has proved to be of particularsignificance for its wide range of use in the extraction (fromdivalent to heptavalent) as well as separation of metal ionsfrom different acid solutions (Nasr-Eddine Belkhouche et al.,2005; Islam and Mostafa, 1995; Islam et al., 1988; 1979). Leach-ing of the spent nickel catalyst from fertilizer factoriesproduces aluminium and nickel containing solutions (Islamand Mostafa, 1993) and a treatment is necessary to separatethe two metal ions. Previously, for this purpose, in our labora-tory some separation studies had been attempted usingvarious extractants and also with tolyl phosphate using NH3
medium in the presence of fluoride ions (Islam and Mostafa,1993) and using Cyanex 272 (Islam and Rahman, 2006).Cobalt-nickel separation using Cyanex 272, Cyanex 301 andCyanex 302 has also been reported by some workers (Reddyand Sarma, 2001; Tait and Brian, 1993; Chou and Beckstead,1990; Danesi et al.,1984; Rickelton et al., 1984). However, noreport was found on the extractive separation of Al(III) andNi(II) by D2EHPA from fluoride medium, though severalreports are available on Ni(II) and Al(III) from acidic medium.
Tributyl phosphate(TBP), di-o-tolyl phosphate (HDTP) andversatic acid-10 were attempted for extractive separation.
TBP and versatic acid-10 were unable to extract Ni(II) fromNi-Al-F solution in NH3 medium. Di-2-ethylhexyl phosphateextracted Ni(II) from Ni-Al-F complex solution, but phaseseparation was very difficult owing to emulsion formation inammoniacal media. It was observed that the waste nickelcatalyst from urea fertilizer factories is leached by HF acidmore effectively than other leachants like H2SO4, HCl etc.However, it was difficult to separate Al-Ni from such leachsolution by conventional precipitation methods.
The efficacy of D2EHPA for Al-Ni separation in acidic fluoridemedium was tried in this laboratory and is reported here.
Materials and MethodsStandard solution of Al(III) was prepared by dissolvingexactly 17.582 g of analytically pure KAl(SO4)2. 12H2O in a onelitre volumetric flask and made up to the mark with 1% HNO3
solution and standardized using spectrophotometric techniqueas indicated below. Another 1 litre standard solution of Ni (II)was prepared by dissolving exactly 8.956 g of analyticallypure NiSO4. 6 H2O in a 1 litre volumetric flask and made up tothe mark with 0.1 N HCl solution and standardized. pH ofthe aqueous solutions was adjusted by using anhydrousNa2CO3/dilute H2SO4 if needed.
The extractant D2EHPA, having 98% purity, was used withoutfurther purification. All other chemicals were of reagent gradeand used without further purification. The diluent kerosene waspurchased from the local market and distilled to collect thecolourless fraction obtained in the range of 200-260 °C.
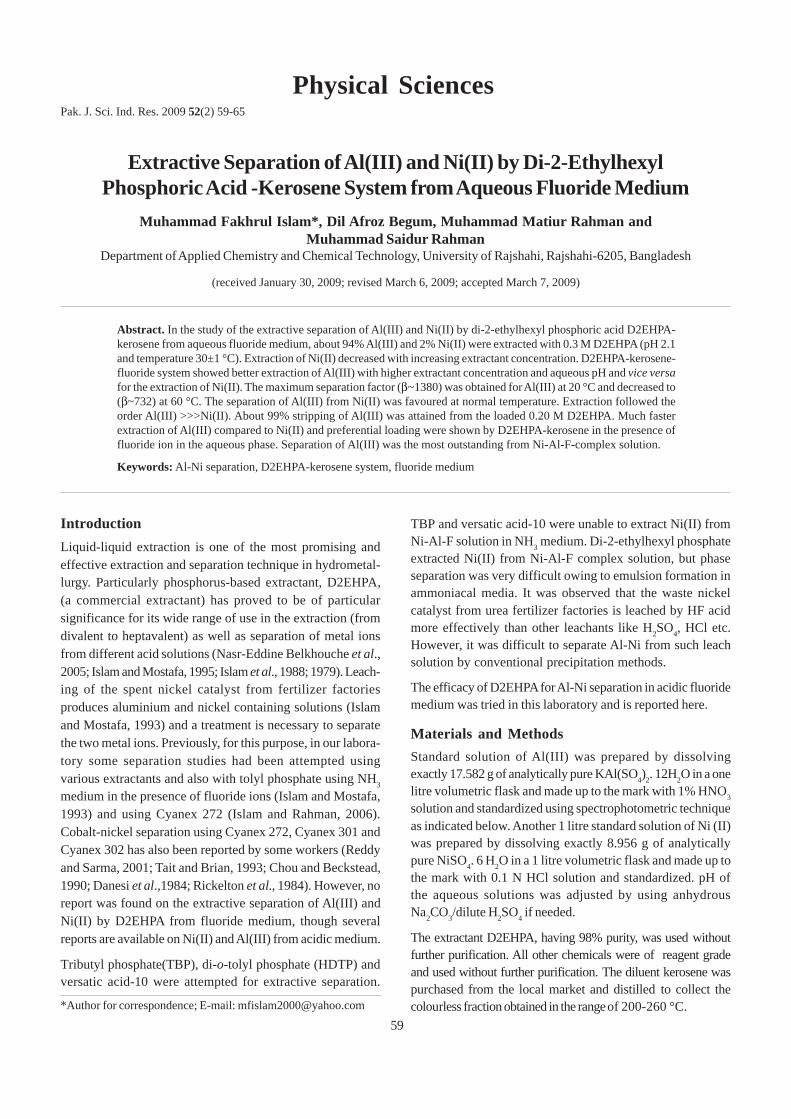
Abstract. In the study of the extractive separation of Al(III) and Ni(II) by di-2-ethylhexyl phosphoric acid D2EHPA-kerosene from aqueous fluoride medium, about 94% Al(III) and 2% Ni(II) were extracted with 0.3 M D2EHPA (pH 2.1and temperature 30±1 °C). Extraction of Ni(II) decreased with increasing extractant concentration. D2EHPA-kerosene-fluoride system showed better extraction of Al(III) with higher extractant concentration and aqueous pH and vice versafor the extraction of Ni(II). The maximum separation factor (β~1380) was obtained for Al(III) at 20 °C and decreased to(β~732) at 60 °C. The separation of Al(III) from Ni(II) was favoured at normal temperature. Extraction followed theorder Al(III) >>>Ni(II). About 99% stripping of Al(III) was attained from the loaded 0.20 M D2EHPA. Much fasterextraction of Al(III) compared to Ni(II) and preferential loading were shown by D2EHPA-kerosene in the presence offluoride ion in the aqueous phase. Separation of Al(III) was the most outstanding from Ni-Al-F-complex solution.
Keywords: Al-Ni separation, D2EHPA-kerosene system, fluoride medium
Pak. J. Sci. Ind. Res. 2009 52(2) 59-65
59
Physical Sciences
A stock solution of D2EHPA (1 M) was prepared by weighingout exactly 658.02 g of D2EHPA in a 1 litre volumetric flaskand diluting by distilled kerosene. Extractant solutions ofdifferent concentrations were prepared by proper dilution ofthe stock with distilled kerosene.
A definite aliquot (20 ml) of an aqueous phase was taken in a125 ml reagent bottle and to it same aliquot (20 ml) of organicphase was added. The bottle was stoppered and shaken fora definite time period in a thermostatic water bath at 30 °C(except for temperature dependence). After attainment ofequilibrium, phases were allowed to settle and disengaged.The aqueous phase equilibrium, pH and the metal ion concen-trations were determined.
For the stripping study, 20 ml organic phase of 0.20 MD2 EHPA-kerosene loaded with Al(III) and Ni(II) were taken ina 125 ml reagent bottle and to it, 20 ml of 6 N HCl was addedas a stripping agent and shaken for 5 min to transfer metalcontent to the aqueous HCl phase. Two layers are formed andsettled for 5 min. The aqueous HCl phase was separated andmeasured spectrophotometrically to obtain metal extracted inthe organic phase. The metal content, Al(III) and Ni(II), of theaqueous phases were determined by subtracting thevalues of organic phase metal ion contents from the initialaqueous phase values. In the case of loading test, the organicphase was repeatedly contacted with fresh equal volumes ofaqueous solutions until saturation of the organic phase withthe metal was attained.
Al(III) ion concentration in the aqueous phase wasestimated by Aluminon method (Scott, 1939) and Ni(II) ionconcentration was determined by dimethyl-glyoximecolorimetric method (Vogel, 1989) using spectrophotometerANA-75 (Tokyo Photoelectric Company). In all the cases,phase separation occurred readily, pH values of the aqueoussolutions were measured by the digital pH meter (HD-700,Japan). Distribution ratio (D) of metal ion was calculated asthe ratio of metal ion concentration in the organic phase tothat in the aqueous phase at equilibrium.
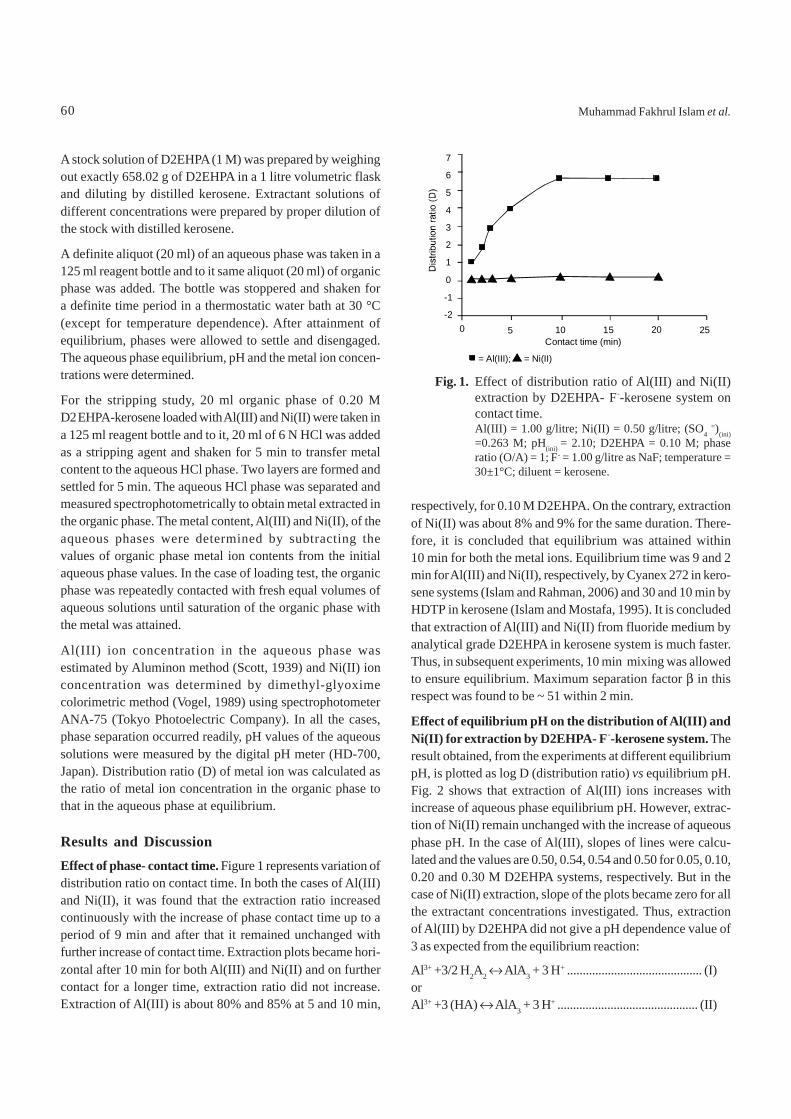
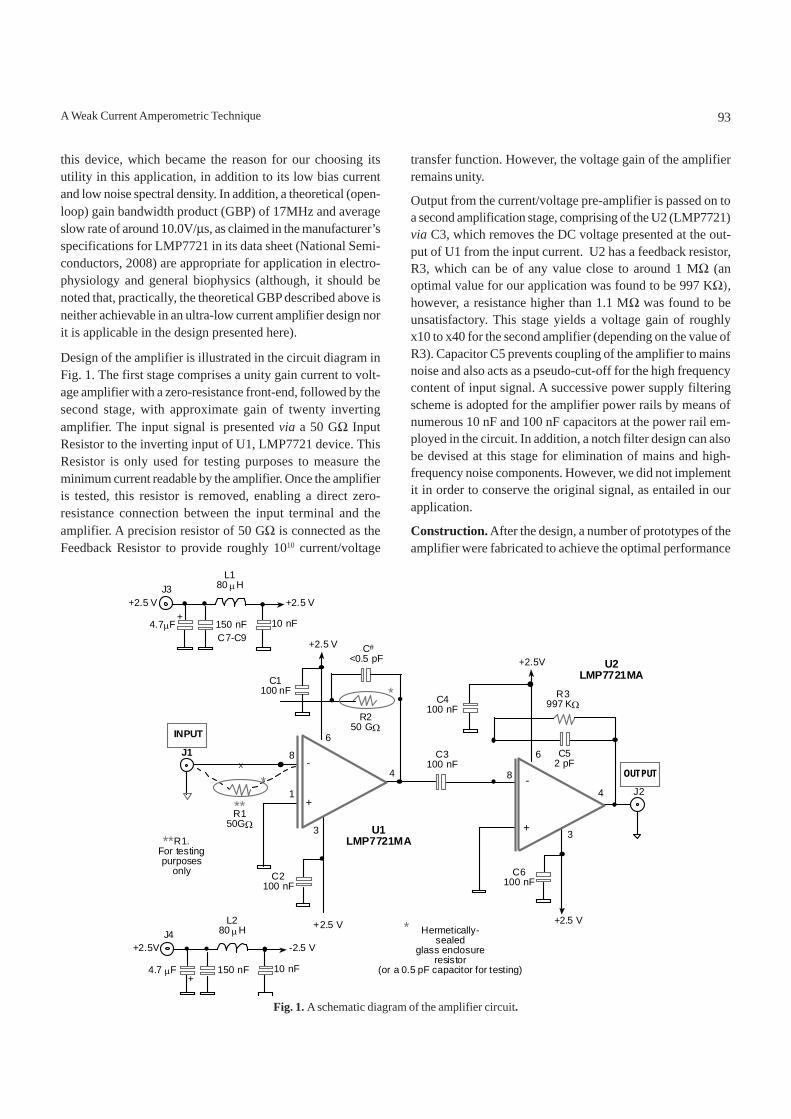
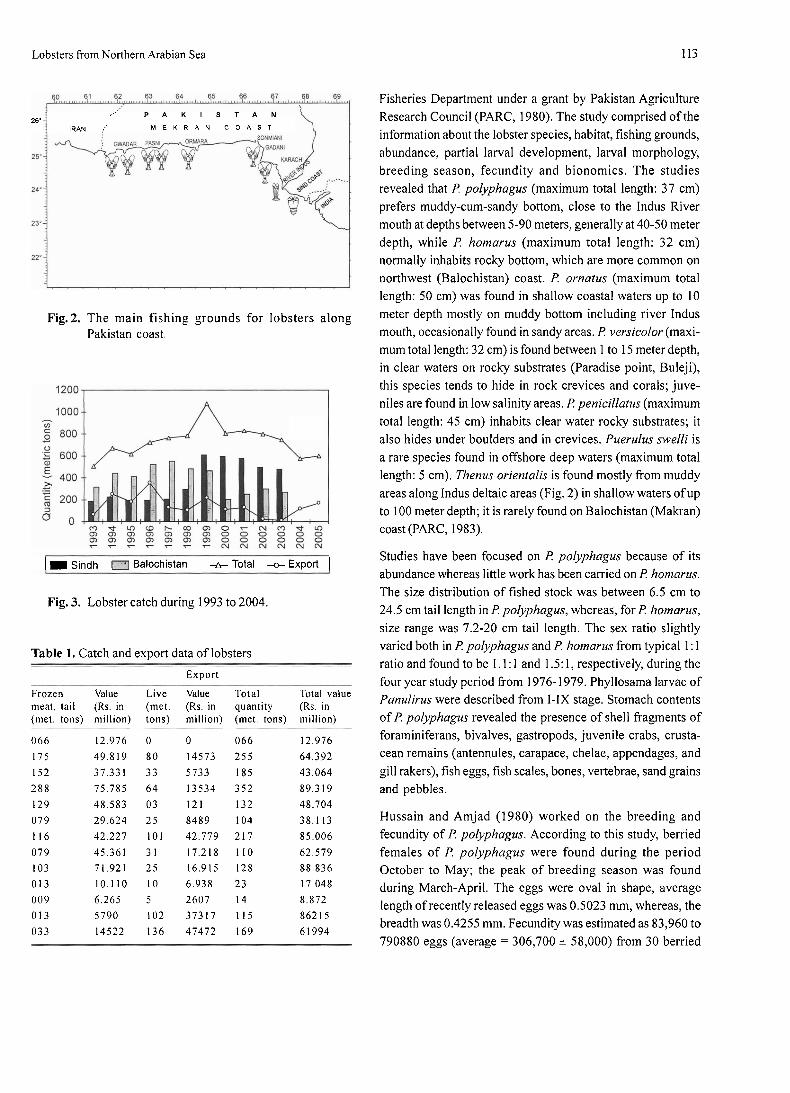
Results and DiscussionEffect of phase- contact time. Figure 1 represents variation ofdistribution ratio on contact time. In both the cases of Al(III)and Ni(II), it was found that the extraction ratio increasedcontinuously with the increase of phase contact time up to aperiod of 9 min and after that it remained unchanged withfurther increase of contact time. Extraction plots became hori-zontal after 10 min for both Al(III) and Ni(II) and on furthercontact for a longer time, extraction ratio did not increase.Extraction of Al(III) is about 80% and 85% at 5 and 10 min,
respectively, for 0.10 M D2EHPA. On the contrary, extractionof Ni(II) was about 8% and 9% for the same duration. There-fore, it is concluded that equilibrium was attained within10 min for both the metal ions. Equilibrium time was 9 and 2min for Al(III) and Ni(II), respectively, by Cyanex 272 in kero-sene systems (Islam and Rahman, 2006) and 30 and 10 min byHDTP in kerosene (Islam and Mostafa, 1995). It is concludedthat extraction of Al(III) and Ni(II) from fluoride medium byanalytical grade D2EHPA in kerosene system is much faster.Thus, in subsequent experiments, 10 min mixing was allowedto ensure equilibrium. Maximum separation factor β in thisrespect was found to be ~ 51 within 2 min.
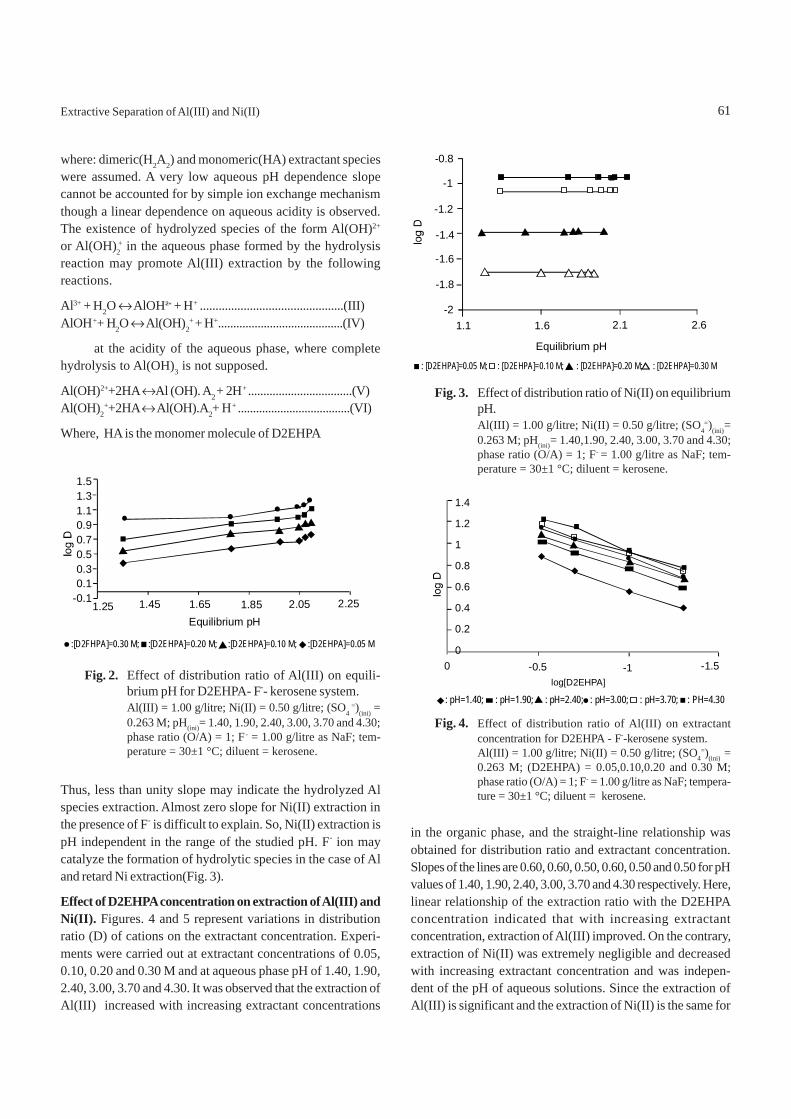
Effect of equilibrium pH on the distribution of Al(III) andNi(II) for extraction by D2EHPA- F--kerosene system. Theresult obtained, from the experiments at different equilibriumpH, is plotted as log D (distribution ratio) vs equilibrium pH.Fig. 2 shows that extraction of Al(III) ions increases withincrease of aqueous phase equilibrium pH. However, extrac-tion of Ni(II) remain unchanged with the increase of aqueousphase pH. In the case of Al(III), slopes of lines were calcu-lated and the values are 0.50, 0.54, 0.54 and 0.50 for 0.05, 0.10,0.20 and 0.30 M D2EHPA systems, respectively. But in thecase of Ni(II) extraction, slope of the plots became zero for allthe extractant concentrations investigated. Thus, extractionof Al(III) by D2EHPA did not give a pH dependence value of3 as expected from the equilibrium reaction:
Fig. 1. Effect of distribution ratio of Al(III) and Ni(II)extraction by D2EHPA- F--kerosene system oncontact time.Al(III) = 1.00 g/litre; Ni(II) = 0.50 g/litre; (SO4
=)(ini)=0.263 M; pH(ini) = 2.10; D2EHPA = 0.10 M; phaseratio (O/A) = 1; F- = 1.00 g/litre as NaF; temperature =30±1°C; diluent = kerosene.
0 5 10 15 20 25Contact time (min)
7
6
5
4
3
2
1
0
-1
-2
= Al(III); = Ni(II)
60 Muhammad Fakhrul Islam et al.
where: dimeric(H2A2) and monomeric(HA) extractant specieswere assumed. A very low aqueous pH dependence slopecannot be accounted for by simple ion exchange mechanismthough a linear dependence on aqueous acidity is observed.The existence of hydrolyzed species of the form Al(OH)2+
or Al(OH)2+ in the aqueous phase formed by the hydrolysis
reaction may promote Al(III) extraction by the followingreactions.
in the organic phase, and the straight-line relationship wasobtained for distribution ratio and extractant concentration.Slopes of the lines are 0.60, 0.60, 0.50, 0.60, 0.50 and 0.50 for pHvalues of 1.40, 1.90, 2.40, 3.00, 3.70 and 4.30 respectively. Here,linear relationship of the extraction ratio with the D2EHPAconcentration indicated that with increasing extractantconcentration, extraction of Al(III) improved. On the contrary,extraction of Ni(II) was extremely negligible and decreasedwith increasing extractant concentration and was indepen-dent of the pH of aqueous solutions. Since the extraction ofAl(III) is significant and the extraction of Ni(II) is the same for
Thus, less than unity slope may indicate the hydrolyzed Alspecies extraction. Almost zero slope for Ni(II) extraction inthe presence of F- is difficult to explain. So, Ni(II) extraction ispH independent in the range of the studied pH. F- ion maycatalyze the formation of hydrolytic species in the case of Aland retard Ni extraction(Fig. 3).
Effect of D2EHPA concentration on extraction of Al(III) andNi(II). Figures. 4 and 5 represent variations in distributionratio (D) of cations on the extractant concentration. Experi-ments were carried out at extractant concentrations of 0.05,0.10, 0.20 and 0.30 M and at aqueous phase pH of 1.40, 1.90,2.40, 3.00, 3.70 and 4.30. It was observed that the extraction ofAl(III) increased with increasing extractant concentrations
61Extractive Separation of Al(III) and Ni(II)
Fig. 2. Effect of distribution ratio of Al(III) on equili-brium pH for D2EHPA- F-- kerosene system.Al(III) = 1.00 g/litre; Ni(II) = 0.50 g/litre; (SO4
=)(ini) =0.263 M; pH(ini)= 1.40, 1.90, 2.40, 3.00, 3.70 and 4.30;phase ratio (O/A) = 1; F- = 1.00 g/litre as NaF; tem-perature = 30±1 °C; diluent = kerosene.
1.51.31.10.90.70.50.30.1
-0.11.25 1.45 1.65 1.85 2.05 2.25
Equilibrium pH
:[D2FHPA]=0.30 M; :[D2EHPA]=0.20 M; :[D2EHPA]=0.10 M; :[D2EHPA]=0.05 M
Fig. 3. Effect of distribution ratio of Ni(II) on equilibriumpH.Al(III) = 1.00 g/litre; Ni(II) = 0.50 g/litre; (SO4
=)(ini)=0.263 M; pH(ini)= 1.40,1.90, 2.40, 3.00, 3.70 and 4.30;phase ratio (O/A) = 1; F- = 1.00 g/litre as NaF; tem-perature = 30±1 °C; diluent = kerosene.
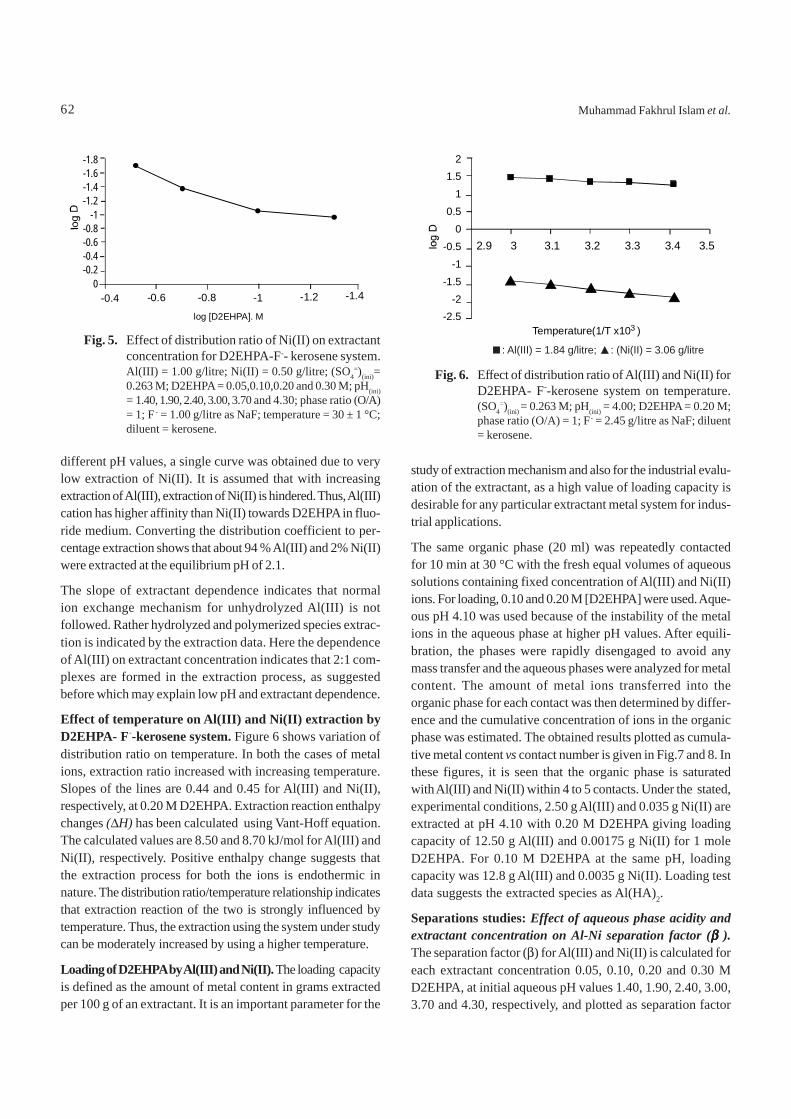
Fig. 4. Effect of distribution ratio of Al(III) on extractantconcentration for D2EHPA - F--kerosene system.Al(III) = 1.00 g/litre; Ni(II) = 0.50 g/litre; (SO4
=)(ini) =0.263 M; (D2EHPA) = 0.05,0.10,0.20 and 0.30 M;phase ratio (O/A) = 1; F- = 1.00 g/litre as NaF; tempera-ture = 30±1 °C; diluent = kerosene.
: [D2EHPA]=0.05 M; : [D2EHPA]=0.10 M; : [D2EHPA]=0.20 M; : [D2EHPA]=0.30 M
-0.8
-2
-1
-1.2
-1.4
-1.6
-1.8
1.1 1.6 2.1 2.6
Equilibrium pH
different pH values, a single curve was obtained due to verylow extraction of Ni(II). It is assumed that with increasingextraction of Al(III), extraction of Ni(II) is hindered. Thus, Al(III)cation has higher affinity than Ni(II) towards D2EHPA in fluo-ride medium. Converting the distribution coefficient to per-centage extraction shows that about 94 % Al(III) and 2% Ni(II)were extracted at the equilibrium pH of 2.1.
The slope of extractant dependence indicates that normalion exchange mechanism for unhydrolyzed Al(III) is notfollowed. Rather hydrolyzed and polymerized species extrac-tion is indicated by the extraction data. Here the dependenceof Al(III) on extractant concentration indicates that 2:1 com-plexes are formed in the extraction process, as suggestedbefore which may explain low pH and extractant dependence.
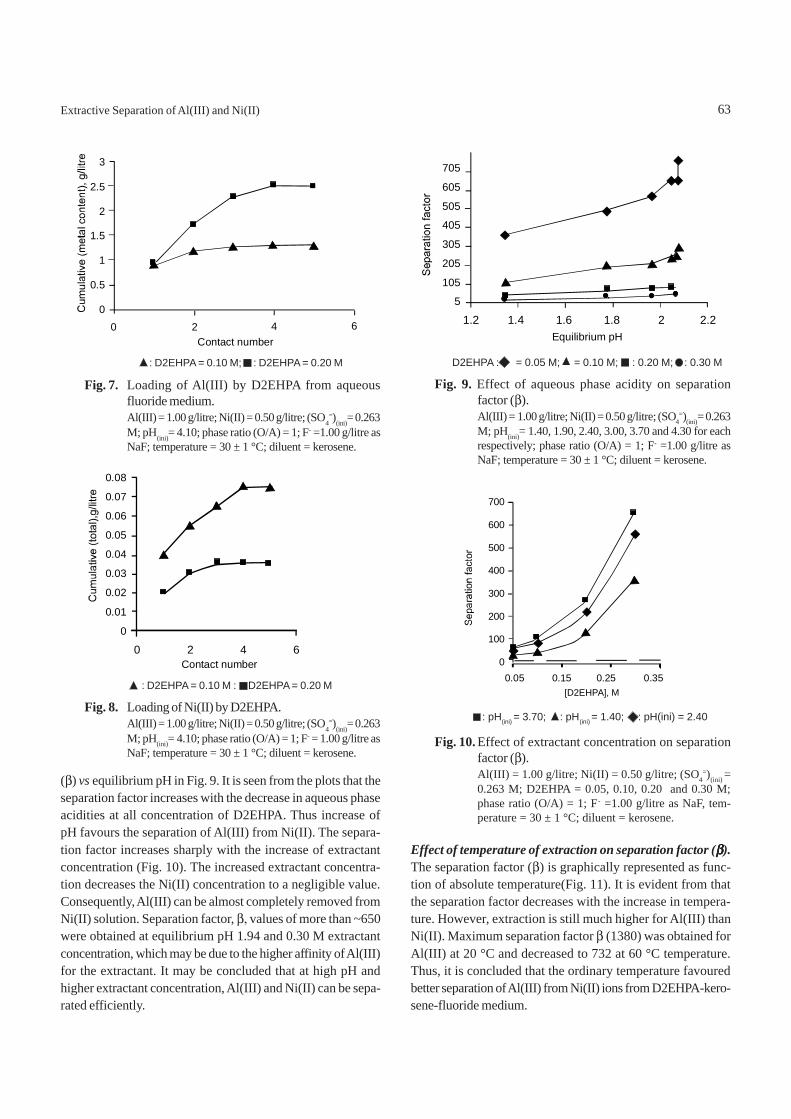
Effect of temperature on Al(III) and Ni(II) extraction byD2EHPA- F--kerosene system. Figure 6 shows variation ofdistribution ratio on temperature. In both the cases of metalions, extraction ratio increased with increasing temperature.Slopes of the lines are 0.44 and 0.45 for Al(III) and Ni(II),respectively, at 0.20 M D2EHPA. Extraction reaction enthalpychanges (ΔH) has been calculated using Vant-Hoff equation.The calculated values are 8.50 and 8.70 kJ/mol for Al(III) andNi(II), respectively. Positive enthalpy change suggests thatthe extraction process for both the ions is endothermic innature. The distribution ratio/temperature relationship indicatesthat extraction reaction of the two is strongly influenced bytemperature. Thus, the extraction using the system under studycan be moderately increased by using a higher temperature.
Loading of D2EHPA by Al(III) and Ni(II). The loading capacityis defined as the amount of metal content in grams extractedper 100 g of an extractant. It is an important parameter for the
study of extraction mechanism and also for the industrial evalu-ation of the extractant, as a high value of loading capacity isdesirable for any particular extractant metal system for indus-trial applications.
The same organic phase (20 ml) was repeatedly contactedfor 10 min at 30 °C with the fresh equal volumes of aqueoussolutions containing fixed concentration of Al(III) and Ni(II)ions. For loading, 0.10 and 0.20 M [D2EHPA] were used. Aque-ous pH 4.10 was used because of the instability of the metalions in the aqueous phase at higher pH values. After equili-bration, the phases were rapidly disengaged to avoid anymass transfer and the aqueous phases were analyzed for metalcontent. The amount of metal ions transferred into theorganic phase for each contact was then determined by differ-ence and the cumulative concentration of ions in the organicphase was estimated. The obtained results plotted as cumula-tive metal content vs contact number is given in Fig.7 and 8. Inthese figures, it is seen that the organic phase is saturatedwith Al(III) and Ni(II) within 4 to 5 contacts. Under the stated,experimental conditions, 2.50 g Al(III) and 0.035 g Ni(II) areextracted at pH 4.10 with 0.20 M D2EHPA giving loadingcapacity of 12.50 g Al(III) and 0.00175 g Ni(II) for 1 moleD2EHPA. For 0.10 M D2EHPA at the same pH, loadingcapacity was 12.8 g Al(III) and 0.0035 g Ni(II). Loading testdata suggests the extracted species as Al(HA)2.
Separations studies: Effect of aqueous phase acidity andextractant concentration on Al-Ni separation factor (β β β β β ).The separation factor (β) for Al(III) and Ni(II) is calculated foreach extractant concentration 0.05, 0.10, 0.20 and 0.30 MD2EHPA, at initial aqueous pH values 1.40, 1.90, 2.40, 3.00,3.70 and 4.30, respectively, and plotted as separation factor
Fig. 6. Effect of distribution ratio of Al(III) and Ni(II) forD2EHPA- F--kerosene system on temperature.(SO4
=)(ini) = 0.263 M; pH(ini) = 4.00; D2EHPA = 0.20 M;phase ratio (O/A) = 1; F- = 2.45 g/litre as NaF; diluent= kerosene.
21.5
10.5
0-0.5
-1-1.5
-2-2.5
2.9 3 3.1 3.2 3.3 3.4 3.5
Temperature(1/T x10 )3
Fig. 5. Effect of distribution ratio of Ni(II) on extractantconcentration for D2EHPA-F-- kerosene system.Al(III) = 1.00 g/litre; Ni(II) = 0.50 g/litre; (SO4
=)(ini)=0.263 M; D2EHPA = 0.05,0.10,0.20 and 0.30 M; pH(ini)= 1.40, 1.90, 2.40, 3.00, 3.70 and 4.30; phase ratio (O/A)= 1; F - = 1.00 g/litre as NaF; temperature = 30 ± 1 °C;diluent = kerosene.
-1.8-1.6-1.4-1.2
-1-0.8-0.6-0.4-0.2
0-0.4 -0.6 -0.8 -1 -1.2 -1.4
log [D2EHPA]. M
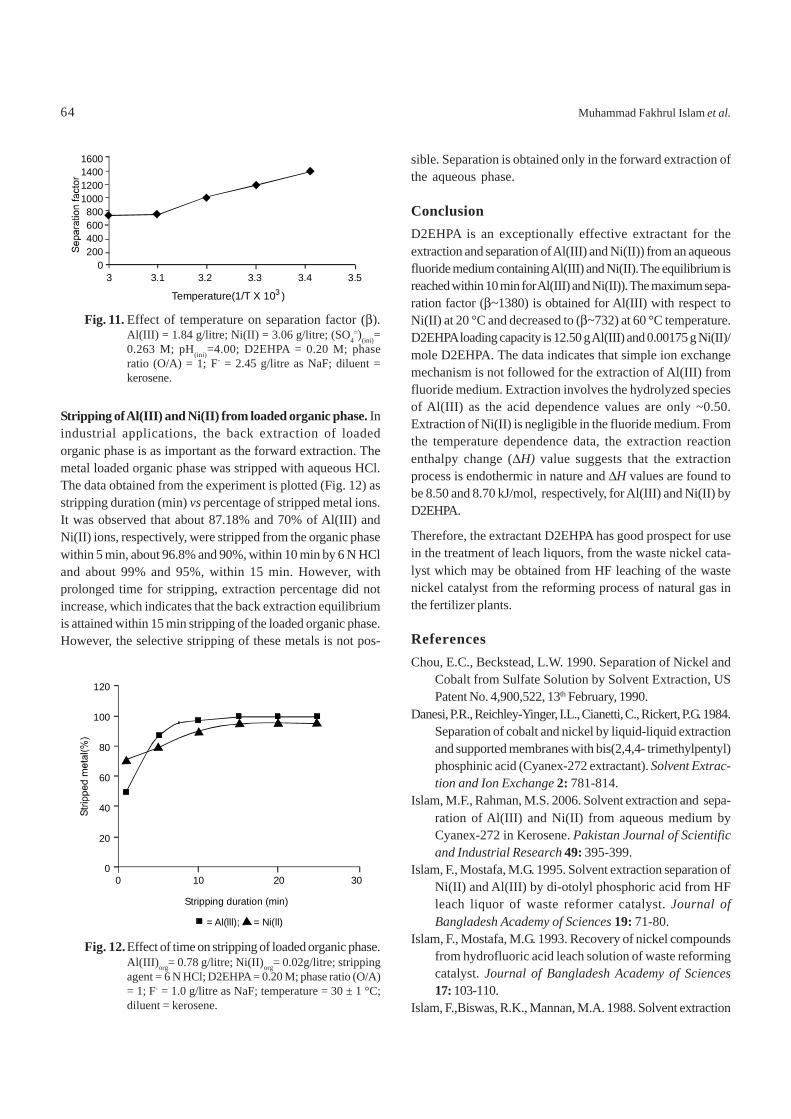
(β) vs equilibrium pH in Fig. 9. It is seen from the plots that theseparation factor increases with the decrease in aqueous phaseacidities at all concentration of D2EHPA. Thus increase ofpH favours the separation of Al(III) from Ni(II). The separa-tion factor increases sharply with the increase of extractantconcentration (Fig. 10). The increased extractant concentra-tion decreases the Ni(II) concentration to a negligible value.Consequently, Al(III) can be almost completely removed fromNi(II) solution. Separation factor, β, values of more than ~650were obtained at equilibrium pH 1.94 and 0.30 M extractantconcentration, which may be due to the higher affinity of Al(III)for the extractant. It may be concluded that at high pH andhigher extractant concentration, Al(III) and Ni(II) can be sepa-rated efficiently.
Effect of temperature of extraction on separation factor (βββββ).The separation factor (β) is graphically represented as func-tion of absolute temperature(Fig. 11). It is evident from thatthe separation factor decreases with the increase in tempera-ture. However, extraction is still much higher for Al(III) thanNi(II). Maximum separation factor β (1380) was obtained forAl(III) at 20 °C and decreased to 732 at 60 °C temperature.Thus, it is concluded that the ordinary temperature favouredbetter separation of Al(III) from Ni(II) ions from D2EHPA-kero-sene-fluoride medium.
Fig. 9. Effect of aqueous phase acidity on separationfactor (β).Al(III) = 1.00 g/litre; Ni(II) = 0.50 g/litre; (SO4
=)(ini)= 0.263M; pH(ini)= 1.40, 1.90, 2.40, 3.00, 3.70 and 4.30 for eachrespectively; phase ratio (O/A) = 1; F- =1.00 g/litre asNaF; temperature = 30 ± 1 °C; diluent = kerosene.
D2EHPA : = 0.05 M; = 0.10 M; : 0.20 M; : 0.30 M
Fig. 10. Effect of extractant concentration on separationfactor (β).Al(III) = 1.00 g/litre; Ni(II) = 0.50 g/litre; (SO4
=)(ini) =0.263 M; D2EHPA = 0.05, 0.10, 0.20 and 0.30 M;phase ratio (O/A) = 1; F- =1.00 g/litre as NaF, tem-perature = 30 ± 1 °C; diluent = kerosene.
Fig. 8. Loading of Ni(II) by D2EHPA.Al(III) = 1.00 g/litre; Ni(II) = 0.50 g/litre; (SO4
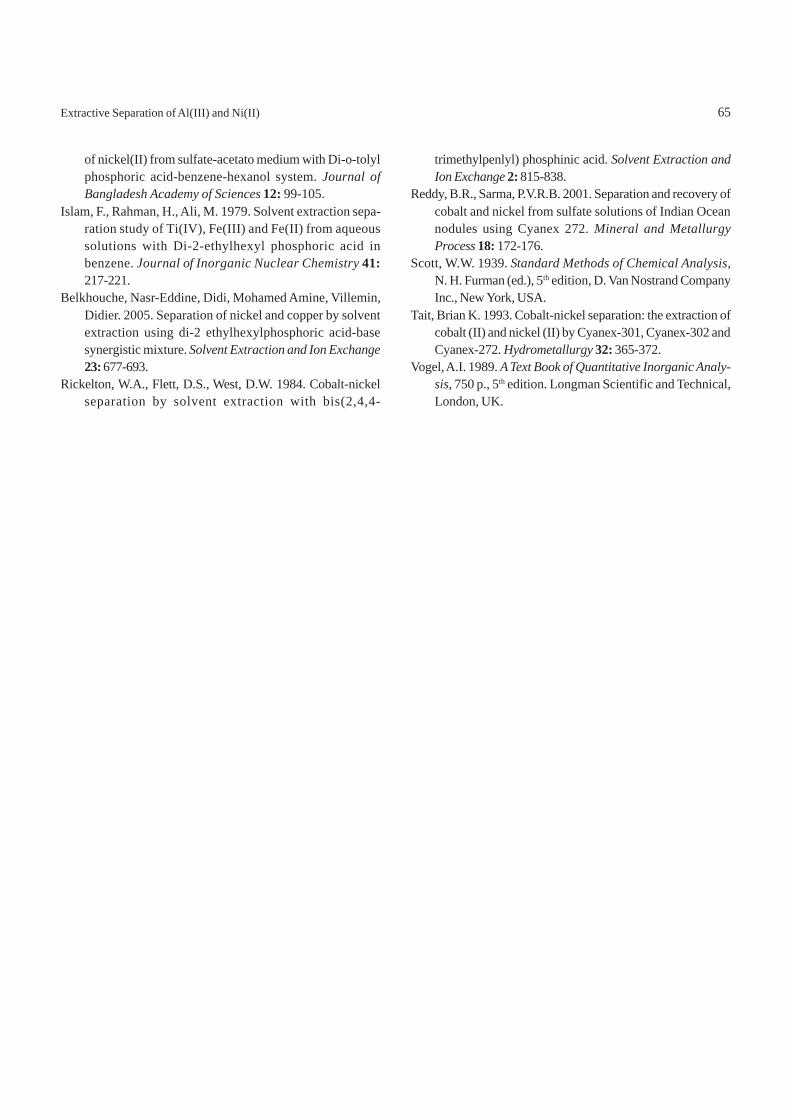
Stripping of Al(III) and Ni(II) from loaded organic phase. Inindustrial applications, the back extraction of loadedorganic phase is as important as the forward extraction. Themetal loaded organic phase was stripped with aqueous HCl.The data obtained from the experiment is plotted (Fig. 12) asstripping duration (min) vs percentage of stripped metal ions.It was observed that about 87.18% and 70% of Al(III) andNi(II) ions, respectively, were stripped from the organic phasewithin 5 min, about 96.8% and 90%, within 10 min by 6 N HCland about 99% and 95%, within 15 min. However, withprolonged time for stripping, extraction percentage did notincrease, which indicates that the back extraction equilibriumis attained within 15 min stripping of the loaded organic phase.However, the selective stripping of these metals is not pos-
sible. Separation is obtained only in the forward extraction ofthe aqueous phase.
ConclusionD2EHPA is an exceptionally effective extractant for theextraction and separation of Al(III) and Ni(II)) from an aqueousfluoride medium containing Al(III) and Ni(II). The equilibrium isreached within 10 min for Al(III) and Ni(II)). The maximum sepa-ration factor (β~1380) is obtained for Al(III) with respect toNi(II) at 20 °C and decreased to (β~732) at 60 °C temperature.D2EHPA loading capacity is 12.50 g Al(III) and 0.00175 g Ni(II)/mole D2EHPA. The data indicates that simple ion exchangemechanism is not followed for the extraction of Al(III) fromfluoride medium. Extraction involves the hydrolyzed speciesof Al(III) as the acid dependence values are only ~0.50.Extraction of Ni(II) is negligible in the fluoride medium. Fromthe temperature dependence data, the extraction reactionenthalpy change (ΔH) value suggests that the extractionprocess is endothermic in nature and ΔH values are found tobe 8.50 and 8.70 kJ/mol, respectively, for Al(III) and Ni(II) byD2EHPA.
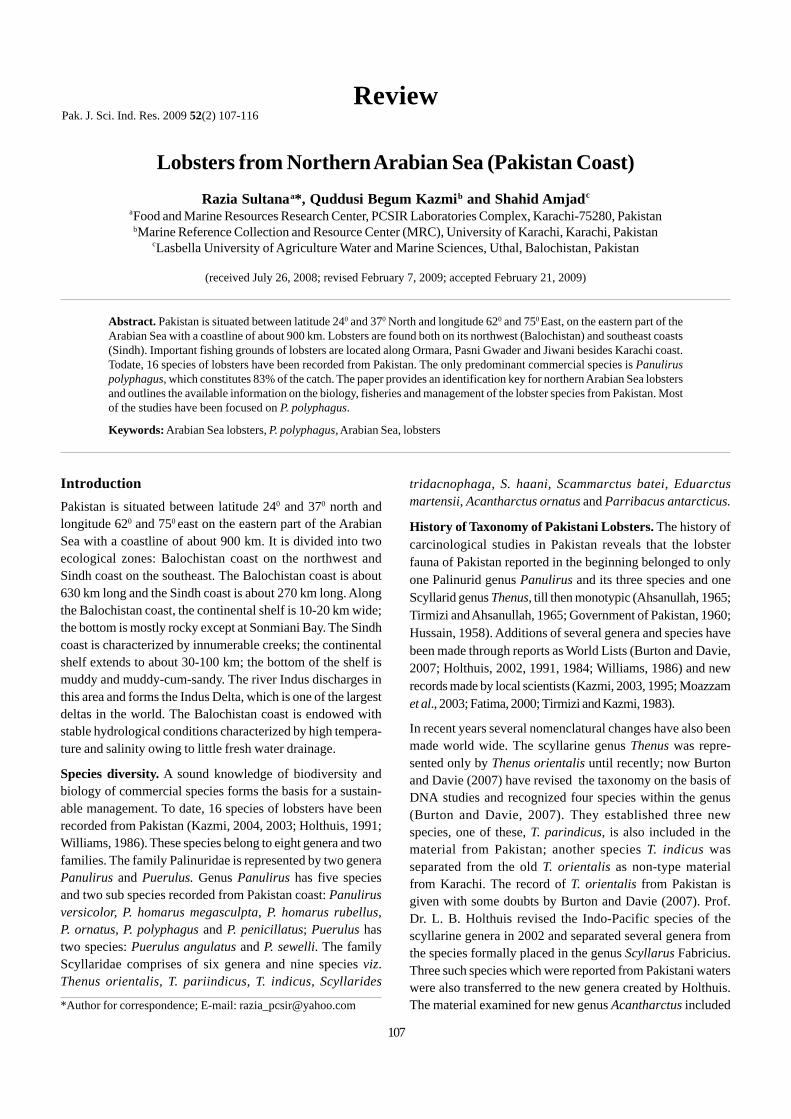
Therefore, the extractant D2EHPA has good prospect for usein the treatment of leach liquors, from the waste nickel cata-lyst which may be obtained from HF leaching of the wastenickel catalyst from the reforming process of natural gas inthe fertilizer plants.
ReferencesChou, E.C., Beckstead, L.W. 1990. Separation of Nickel and
Cobalt from Sulfate Solution by Solvent Extraction, USPatent No. 4,900,522, 13th February, 1990.
Danesi, P.R., Reichley-Yinger, I.L., Cianetti, C., Rickert, P.G. 1984.Separation of cobalt and nickel by liquid-liquid extractionand supported membranes with bis(2,4,4- trimethylpentyl)phosphinic acid (Cyanex-272 extractant). Solvent Extrac-tion and Ion Exchange 2: 781-814.
Islam, M.F., Rahman, M.S. 2006. Solvent extraction and sepa-ration of Al(III) and Ni(II) from aqueous medium byCyanex-272 in Kerosene. Pakistan Journal of Scientificand Industrial Research 49: 395-399.
Islam, F., Mostafa, M.G. 1995. Solvent extraction separation ofNi(II) and Al(III) by di-otolyl phosphoric acid from HFleach liquor of waste reformer catalyst. Journal ofBangladesh Academy of Sciences 19: 71-80.
Islam, F., Mostafa, M.G. 1993. Recovery of nickel compoundsfrom hydrofluoric acid leach solution of waste reformingcatalyst. Journal of Bangladesh Academy of Sciences17: 103-110.
Islam, F.,Biswas, R.K., Mannan, M.A. 1988. Solvent extraction
Fig. 11. Effect of temperature on separation factor (β).Al(III) = 1.84 g/litre; Ni(II) = 3.06 g/litre; (SO4
=)(ini)=0.263 M; pH(ini)=4.00; D2EHPA = 0.20 M; phaseratio (O/A) = 1; F- = 2.45 g/litre as NaF; diluent =kerosene.
3 3.1 3.2 3.3 3.4 3.5
1600140012001000800600400200
0
Temperature(1/T X 10 )3
Fig. 12.Effect of time on stripping of loaded organic phase.Al(III)org= 0.78 g/litre; Ni(II)org= 0.02g/litre; strippingagent = 6 N HCl; D2EHPA = 0.20 M; phase ratio (O/A)= 1; F- = 1.0 g/litre as NaF; temperature = 30 ± 1 °C;diluent = kerosene.
120
100
80
60
40
20
00 10 20 30
Stripping duration (min)
= Al(lll); = Ni(ll)
64 Muhammad Fakhrul Islam et al.
of nickel(II) from sulfate-acetato medium with Di-o-tolylphosphoric acid-benzene-hexanol system. Journal ofBangladesh Academy of Sciences 12: 99-105.
Islam, F., Rahman, H., Ali, M. 1979. Solvent extraction sepa-ration study of Ti(IV), Fe(III) and Fe(II) from aqueoussolutions with Di-2-ethylhexyl phosphoric acid inbenzene. Journal of Inorganic Nuclear Chemistry 41:217-221.
Belkhouche, Nasr-Eddine, Didi, Mohamed Amine, Villemin,Didier. 2005. Separation of nickel and copper by solventextraction using di-2 ethylhexylphosphoric acid-basesynergistic mixture. Solvent Extraction and Ion Exchange23: 677-693.
Rickelton, W.A., Flett, D.S., West, D.W. 1984. Cobalt-nickelseparation by solvent extraction with bis(2,4,4-
Reddy, B.R., Sarma, P.V.R.B. 2001. Separation and recovery ofcobalt and nickel from sulfate solutions of Indian Oceannodules using Cyanex 272. Mineral and MetallurgyProcess 18: 172-176.
Scott, W.W. 1939. Standard Methods of Chemical Analysis,N. H. Furman (ed.), 5th edition, D. Van Nostrand CompanyInc., New York, USA.
Tait, Brian K. 1993. Cobalt-nickel separation: the extraction ofcobalt (II) and nickel (II) by Cyanex-301, Cyanex-302 andCyanex-272. Hydrometallurgy 32: 365-372.
Vogel, A.I. 1989. A Text Book of Quantitative Inorganic Analy-sis, 750 p., 5th edition. Longman Scientific and Technical,London, UK.
65Extractive Separation of Al(III) and Ni(II)
Studies on the Lipolytic Enzymes of Sesamum indicum Seed PowderNusrullah Akhtara, Salma Rahmana* and Abdul Jabbarb
(received August 27, 2008; revised March 11, 2009; accepted March 12, 2009)
IntroductionSesamum indicum DC. oil is reckoned equal to olive oil inmedicinal properties, especially in the treatment of ulcers,psoriasis, prurigo, leucoderma and wounds (Nadkarni,1982).
Earlier studies on sesame lipids are available (Javed et al.,2000; Toro-Vazquez et al., 2000; Yashida et al., 1995; Kamaland Appelqvist, 1994) but research concerning its lipolyticenzymes (lipase and phospholipase) has so far not beenreported. Enzymes play an important role in in vivo synthesisas well as metabolism of a number of organic compounds inthe animal and plant kingdom.
In the present studies, enzymes from mature and germi-nated seeds of sesame were extracted and the enzymaticactivity of lipase and phospholipase was investigated atdifferent temperature, pH, aqueous media and organicsolvents. The objective was to establish optimum condi-tions for the hydrolysis of simple triglycerides andphospho-glycerides by lipase and phospholipase, respec-tively, therefore, these conditions can be applied both inthe laboratory and industry. Such investigations were alsomade earlier on wheat grains, castor bean, oat grains andcorn (Banu and Serban, 1970; Berner and Hammond, 1970;Ory, 1969; Ferrigan and Geddes, 1958). Similar studies onCassia sp., Nicotiana rustica, Zea mays, Carum capticum,Citrullus sp., of local origin were carried out at PCSIRLaboratories (Waheed et al., 2002; Javed et al., 1999; Ahmadet al., 1993; Aman and Akhtar, 1991; Zaka et al., 1989). Thepresent work on sesame is thus an extension of the earlierstudies.
Materials and MethodsExtraction of lipase and phospholipase. Dried seeds of sesamecollected from local market, were ground to a fine powder anddefatted in a soxhlet extractor with diethyl ether. The defattedseed powder (50 g) was suspended in 200 ml citrate buffer(citric acid 0.1 M and disodium hydrogen phoshphate 0.2 M)of pH 7 in 500 ml conical flask and was shaken at 200 rpm forone h at 40 °C, using a Gallenkamp orbital shaker. The superna-tant containing enzymes was obtained by centrifugation for15 min at 12,000 rpm. The extract was diluted to 200 ml withcitrate buffer and utilized to study enzyme activities underdifferent condition (Waheed et al., 2002).
Preparation of substrate. Olive oil (Italian origin) waspurchased from local market and its triglycerides wereseparated and purified by thin layer chromatography.Ttriglycerides (1 g) were emulsified by blending with 10%gum acacia solution (aqueous media) to determine lipaseactivity, whereas, 10% egg lecithin (BDH, England) emulsionwas used as substrate for the phospholipase activity (Kausarand Akhtar, 1979). Hydrolysis of the two substrates byenzymes (lipase and phospholipase) extracted from matureseeds under different parameters is described below.
Effect of pH. The enzyme extract was shaken for one h at40 °C and 200 rpm in the presence of substrates (triglyceridesor lecithin emulsion) separately with citrate buffer (pH 7) andcalcium chloride (0.1 M). The released fatty acids after extrac-tion with 5 ml hexane: chloroform (1:1, v/v), were treated with2.5 ml of Cu- TEA reagent in a test tube, shaken for 5 min andthen centrifuged. The upper layer (3 ml) was reacted with0.5 ml of 0.1% sodium diethyldithiocarbamate which resultedin golden yellow colour, whose absorbance (A) at a fixed wavelength (440 nm) was recorded on a spectrophotometer
Pak. J. Sci. Ind. Res. 2009 52(2) 66-69
Abstract. Optimum conditions for the hydrolysis of simple triglycerides and phosphoglycerides for the activity of thelipolytic enzymes (lipase and phospholipase) extracted from the defatted seeds of Sesamum indicum were establishedfor use in laboratory and industry. The enzymes showed optimum activity at 40 °C and pH 7 in aqueous media.N-heptane was found to be the most satisfactory solvent for maximum activities. The activity of lipase extracted fromgerminated seeds increased with the stage of seed development, but was reverse for the phospholipase activity.
(Beckman, model 24, England) against a blank prepared byboiled enzyme powder. A linear standard curve was drawnbetween the concentration, 80 μg/litre - 800 μg/litre of palmiticacid against the absorbance (A 0.300 - A 0.500) at fixed wave-length (440 nm). The standard curve was used to calculateμ equivalent of fatty acids released per g/h. The activity oflipase or phospholipase was calculated according to Guvenet al. (1979) as follows.
released were measured from the standard curve and enzy-matic activity was calculated.
Results and DiscussionEnzyme systems play an important role in the synthesis andbreakup of a number of organic compounds in animals andplants. The present study is concerned with the lipase andphospholipase enzymes of sesame seed which are involvedin the degradation of lipids. These enzymes hydrolysetriglycerides and phosphoglycerides, respectively, and theliberated fatty acids serve as indicator of their activity. Thedefatted material (meal) of resting and germinated seeds ofsesame after treatment of citrate buffer under specific condi-tions was centrifuged to get lipase and phospholipase enzymesfor studying their activities under different parameters.
Fatty acids develop golden yellow colour on treatment withcupric nitrate, triethanolamine and diethyldithiocarbamatesolution. In the present study, the absorbance of goldenyellow colour was measured by spectrophotometer at 440 nm.Concentration of fatty acids is directly proportional to thedevelopment of colour showing the activity of the particularenzyme. The concentration on the basis of absorption wasdetermined with the help of a standard curve drawn betweenthe concentrations of palmitic acid against the absorbance atthe same wavelength as mentioned above. The activity oflipase and phospholipase was calculated by Guven’s method.
The lipase and phospholipase activities were determinedunder different conditions of pH, temperatures and solvents.The conditions of pH and temperature, which gave betteractivity of lipase and phospholipase to mature seeds inaqueous media, were also applied to germinated seeds.
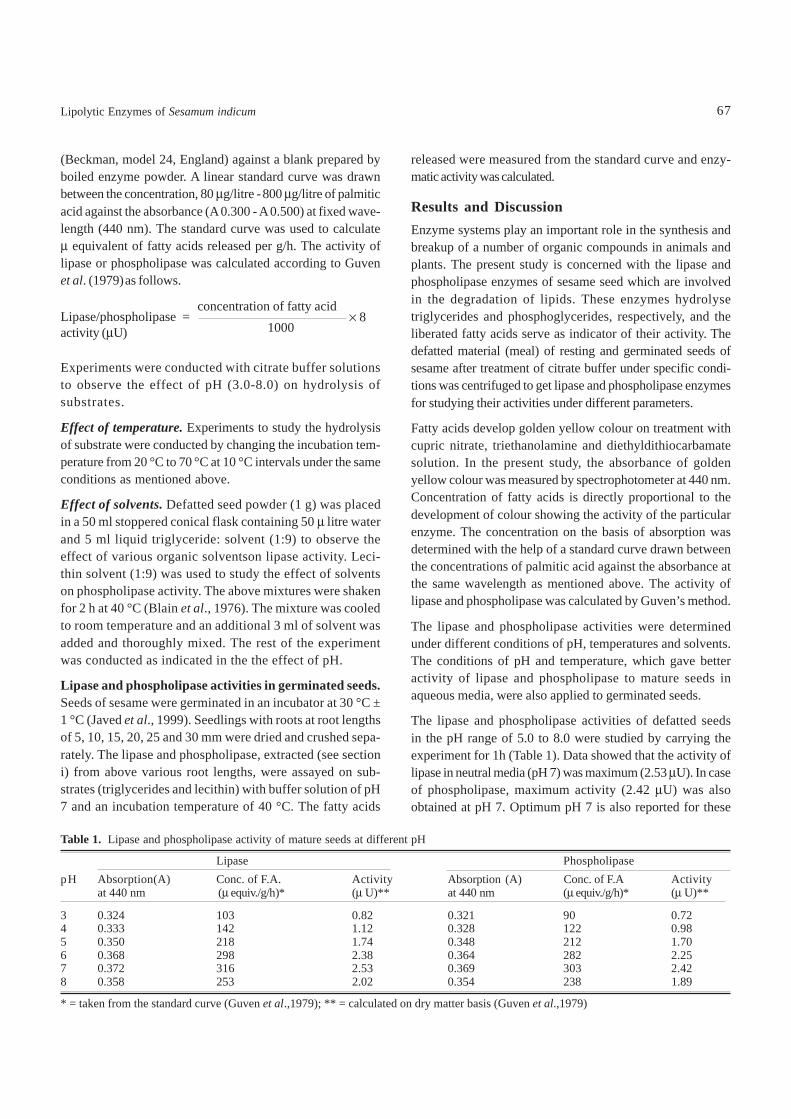
The lipase and phospholipase activities of defatted seedsin the pH range of 5.0 to 8.0 were studied by carrying theexperiment for 1h (Table 1). Data showed that the activity oflipase in neutral media (pH 7) was maximum (2.53 μU). In caseof phospholipase, maximum activity (2.42 μU) was alsoobtained at pH 7. Optimum pH 7 is also reported for these
Experiments were conducted with citrate buffer solutionsto observe the effect of pH (3.0-8.0) on hydrolysis ofsubstrates.
Effect of temperature. Experiments to study the hydrolysisof substrate were conducted by changing the incubation tem-perature from 20 °C to 70 °C at 10 °C intervals under the sameconditions as mentioned above.
Effect of solvents. Defatted seed powder (1 g) was placedin a 50 ml stoppered conical flask containing 50 μ litre waterand 5 ml liquid triglyceride: solvent (1:9) to observe theeffect of various organic solventson lipase activity. Leci-thin solvent (1:9) was used to study the effect of solventson phospholipase activity. The above mixtures were shakenfor 2 h at 40 °C (Blain et al., 1976). The mixture was cooledto room temperature and an additional 3 ml of solvent wasadded and thoroughly mixed. The rest of the experimentwas conducted as indicated in the the effect of pH.
Lipase and phospholipase activities in germinated seeds.Seeds of sesame were germinated in an incubator at 30 °C ±1 °C (Javed et al., 1999). Seedlings with roots at root lengthsof 5, 10, 15, 20, 25 and 30 mm were dried and crushed sepa-rately. The lipase and phospholipase, extracted (see sectioni) from above various root lengths, were assayed on sub-strates (triglycerides and lecithin) with buffer solution of pH7 and an incubation temperature of 40 °C. The fatty acids
Lipase/phospholipase =activity (μU)
concentration of fatty acid × 8
1000
67Lipolytic Enzymes of Sesamum indicum
Table 1. Lipase and phospholipase activity of mature seeds at different pH
Lipase PhospholipasepH Absorption(A) Conc. of F.A. Activity Absorption (A) Conc. of F.A Activity
at 440 nm (μ equiv./g/h)* (μ U)** at 440 nm (μ equiv./g/h)* (μ U)**
* = taken from the standard curve (Guven et al.,1979); ** = calculated on dry matter basis (Guven et al.,1979)
enzymes in other seeds such as groundnut, coconut, maize,wheat and almond (Akhtar et al., 1975). It was observed thatpH 7 played a vital role for the best activity in both lipase andphospholipase. Other studies were carried out by adjustingthe reaction media to pH 7 and varying the reaction tempera-ture and by changing the solvent in the media.
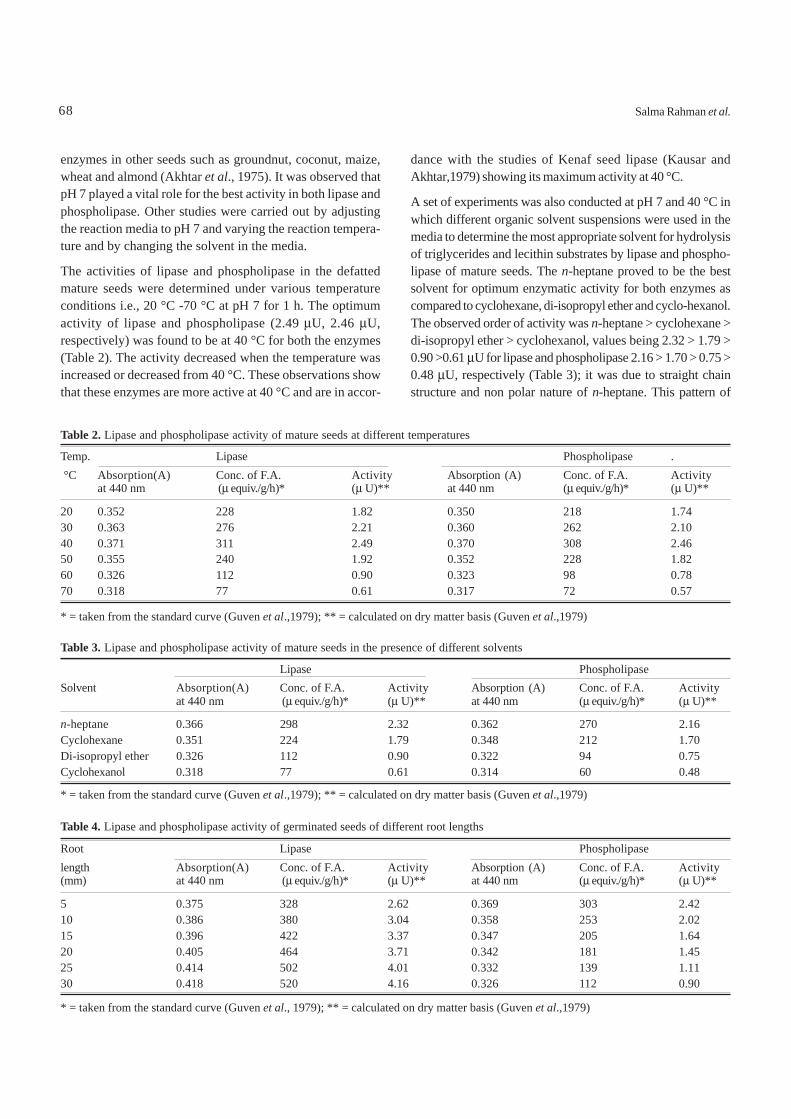
The activities of lipase and phospholipase in the defattedmature seeds were determined under various temperatureconditions i.e., 20 °C -70 °C at pH 7 for 1 h. The optimumactivity of lipase and phospholipase (2.49 μU, 2.46 μU,respectively) was found to be at 40 °C for both the enzymes(Table 2). The activity decreased when the temperature wasincreased or decreased from 40 °C. These observations showthat these enzymes are more active at 40 °C and are in accor-
dance with the studies of Kenaf seed lipase (Kausar andAkhtar,1979) showing its maximum activity at 40 °C.
A set of experiments was also conducted at pH 7 and 40 °C inwhich different organic solvent suspensions were used in themedia to determine the most appropriate solvent for hydrolysisof triglycerides and lecithin substrates by lipase and phospho-lipase of mature seeds. The n-heptane proved to be the bestsolvent for optimum enzymatic activity for both enzymes ascompared to cyclohexane, di-isopropyl ether and cyclo-hexanol.The observed order of activity was n-heptane > cyclohexane >di-isopropyl ether > cyclohexanol, values being 2.32 > 1.79 >0.90 >0.61 μU for lipase and phospholipase 2.16 > 1.70 > 0.75 >0.48 μU, respectively (Table 3); it was due to straight chainstructure and non polar nature of n-heptane. This pattern of
Table 2. Lipase and phospholipase activity of mature seeds at different temperatures
Temp. Lipase Phospholipase . °C Absorption(A) Conc. of F.A. Activity Absorption (A) Conc. of F.A. Activity
at 440 nm (μ equiv./g/h)* (μ U)** at 440 nm (μ equiv./g/h)* (μ U)**
* = taken from the standard curve (Guven et al., 1979); ** = calculated on dry matter basis (Guven et al.,1979)
68 Salma Rahman et al.
activity was also observed by Waheed et al. (2002) for Nicotianarustica.
The parameters of temperature (40 °C) and pH (7) whichshowed better activity for the enzymes from mature seedswere also applied to germinated seeds at root lengths of 5 to30 mm (Table 4). The activity of lipase, carried out inaqueous media was found to be directly proportional to theincrease in root length of germinated seeds. The maximumactivity of lipolytic enzyme is 4.16 μU at root length of 30mm. In contrast the activity of phospholipase was inverselyproportional to the root length of germinated seeds. Thebest activity of phospholipase was 2.42 μU at a root lengthof 5 mm; similar patterns were observed in other studies(Ahmad et al., 1993; Aman and Akhtar, 1991) on Zea maysand Carum capticum.
ConclusionLipase and phospholipase of mature and germinated seeds ofSesamum indicum exhibit optimum activities at pH 7 and 40 °Cin aqueous media. In case of organic solvents, n-heptaneshowed better activities for both the enzymes at pH 7 and40 °C. The lipase activity is maximum at 30 mm root length, butphospholipase activity was minimum at 30 mm root length. Itis concluded that multiple factors are involved for the lipaseand phospholipase activity of mature and germinated seeds.The optimum conditions evaluated for the activites of theseenzymes can be utilized in the industry to resolve technicalprocessing problems and to reduce the cost and processingtime for sesame and other seeds.
ReferencesAhmad, I., Raie, M.Y., Akhtar, M.W. 1993. Studies of lipase
and phospholipase procured from the meal of Carumcapticum. Pakistan Journal of Scientific and IndustrialResearch 36: 248-251.
activity in organic solvents. Pakistan Journal of Biochem-istry 9: 41-45.
Chopra,G.L. 1970. Pedaliaceae in Angiosperms, pp. 333-335,9th edition, Unique Publishers, Lahore, Pakistan.
Ferrigan, M., Geddes, W.F. 1958. Distribution of lipase in thecommercial mill products from hard red spring wheat.Cereal Chemistry 35: 422-427.
Guven, K.C., Bergisadi, N., Guler, E. 1979. A modification ofDuncombes method and its application to the lipolyticassay of Heparin. Fette, Seifen, Anstrichmittel 81: 152-154.
Javed, M.A., Ahmad, Ahmad, I., Ali, H. 1999. Studies of lipaseand phospholipase enzymes obtained form the meal ofCitrullus vulgaris of the Cucurbitaceae family.Pakistan Journal of Scientific and Industrial Research42: 345-348.
Javed, M.A., Akhtar, N., Jabbar, A. 2000. Fatty acid and lipidcomposition of Sesamum indicum DC. Pakistan Journalof Scientific and Industrial Research 43: 23-25.
Kamal, E.A., Appelpvist, L.A. 1994. Variation in fatty acidcomposition of the different acyl lipids in seed oils offour sesamum species. Journal of American Oil ChemistSociety 71: 135-139.
Kausar, N., Akhtar, M.W. 1979. Isolation and characterizationof Hibiscus cannabinus (kenat) seed lipase. PakistanJournal of Biochemistry 12: 58-64.
Nadkarni, A.K. 1982. Sesamum indicum, In: The IndianMateria Medica I part II, pp. 1126-1129, 3rd edition,Popular Prakshan Bombay, India.
Ory, R.L.1969.Acid lipase of the caster bean. Lipids 4: 177-185.Toro-Vazquez, J.F., Briceno-Montelongo, M., Dibildox,
Alvarado, E., Charo-Aionso, M., Reyes-Hernandez, J.2000. Crystallization kinetics of palm stearin in blendswith sesame seed oil. Journal of American Oil ChemistSociety 77: 297-310.
Waheed A., Mahmaud S., Ahmad A. 2002. Activity of lipaseand phospholipase extracted from the seed meal ofNicotiana rustica of the family Solanaceae. Proceed-ings of Pakistan Academy of Sciences 39: 75-78.
Yashida, H., Shigezaki, J., Takagi, S., Kajimoto, G. 1995. Varia-tion in the composition of various acyl lipids,tocopherols and lignans in sesame seed oil roasted inmicrowave oven. Journal of The Science of Food andAgriculture 68: 407-415.
Zaka, S. Akhtar, Khan, M.W., Shafiq, A.1989. PhosphatideAcyl hydrolase and triglycerides acylhydrolase activitiesin the developing seeds of Cassia species. PakistanJournal of Scientific and Industrial Research 32: 27-32.
69Lipolytic Enzymes of Sesamum indicum
Pak. J. Sci. Ind. Res. 2009 52(2) 70-74
An Ecofriendly Systhesis of 4-Thiazolidinone Derivative UsingTributylammonium Bromide Under Microwave Irradiation
Muhammad Naeema*, Muhammad Nawaz Chaudhryb and Rana AmjadcaACRC, PCSIR Laboratories Complex, Ferozepur Road Lahore, Lahore-54600, Pakistan
bCollege of Earth and Environmental Sciences, University of The Punjab, Lahore-PakistancInstitute of Chemistry, University of The Punjab, Lahore-Pakistan
(received November 17, 2008; revised February 12, 2009; accepted March 4, 2009)
Abstract. A series of new compounds 5-benzylidene-3-(4-methylphenyl)-2-(phenylimino)-4-thiazolidinone weresynthesized by adopting environment friendly microwave irradiation methodology, their structures and in vitroantibacterial and antifungal activities are reported.The synthesized compounds exhibited different levels of antibacterialactivities. Three compounds showed broad spectrum antibacterial activity.
IntroductionThiazolidinone is a useful precursor for a variety of heterocyclicproducts including drugs, dyes, herbicides, sulfur drugs,chemical reaction accelerators, flavouring substances and isassociated with broad spectrum of biological activitiesincluding antibacterial, antifungal, tuberculostatic, anthel-mentic, antitumor, anticonvulsant, diuretic, insecticidal andpesticidal properties (Singh et al., 1981).
The derivatives of 4-thiazolidinone moiety have beensynthesized by condensation of aromatic aldehyde andpipradinium benzoate in refluxing toluene (Kasmi-Mir et al.,2006). Such methods involve long reaction time, require largequantities of organic solvents and generally yieldunsatisfactorily. Microwave radiation has been employed forthe formation of different products under simple operationalconditions (Algul et al., 2008).
Phase transfer catalysts (PTC) are environmentally benignand are used for reactions in which tetraalkylammoniumcations are preferred in heterogeneous two-phasesystem.
Solvents like carbon tetrachloride, pryridine, dimethylsulphoxide, dimethyl sulphate, toluene, 1,4-dioxane arecommonly used as reaction media and for purificationpurposes. The common adverse effects of these solvents mayinclude redness, itching and rashes on skin, swelling of face,troubled breathing, shortness of breath, nasal congestion,headache, vomiting, severe upper abdominal pain, back pain,and possible allergic reaction to material if inhaled, ingested
or even contacted. Particularly adverse effects like loss ofappetite, insomnia, fatigue, depression, delirium, fever,frequent urination, and loss of coordination or judgment arecaused by pyridine, while confusion, drowsiness, diarrhoeaare due to carbon tetrachloride (Ballell et al., 2004; Rao et al.,2004; Merck Index, 1996).
In the present investigations, reaction of 3-(4-methylphenyl)-2-(phenylimino)-4-thiazolidinone with different aromaticaldehyde in the presence of tributylammonium bromide (TBAB)as phase transfer catalyst in an aqueous medium was carriedout under microwave irradiation and in vitro activity of thenewly synthesized compounds was evaluated focusing onqualitative as well as quantitative analysis. This reactionrequires only 6-8 min, is environmentally benign with lowenergy consumption and easy workup.
Materials and MethodsMelting points determined on digital melting point apparatus(Gallenkamp, England) were uncorrected. IR spectra wererecorded on a Shimadzu FTIR-8400 instrument as KBr discsand only noteworthy absorption levels (cm-1) were listed.1H-NMR spectra were recorded on a Bruker AC-300 MHz usingTMS as the internal standard and represented in chemicalshift as ä ppm downfield from TMS. Elemental analysis wascarried out using a Perkin Elmer CHNS analyzer and massspectra were recorded on a Juel D-300 spectrometer. Zoneof inhibition was calculated on digital automatic zone reader(AZ-II, SUPICO, Korea). All solvents and reagents werepurchased from Fluka, Merck, Sigma-Aldrich and used withoutpurification.
70
The reaction mixture was irradiated with microwave of lowpower (200 W). The temperature of the reaction mixture wasmonitored by temperature reader. Temperature of the reactionmixture continuously increased and the reaction was completedin 6-8 min using microwave oven (Model No.MV 32/8-O,SUPICO, Korea). The reactions were monitored by TLC usingn-hexane: ethylacetate (3:7, v/v) as developing solvent, and targetcompounds were isolated in high yield. This novel energy-savingprocedure was found to be useful for the efficient preparationof several compounds. The crude product was purified bycolumn chromatography on silica gel to ensure purity.
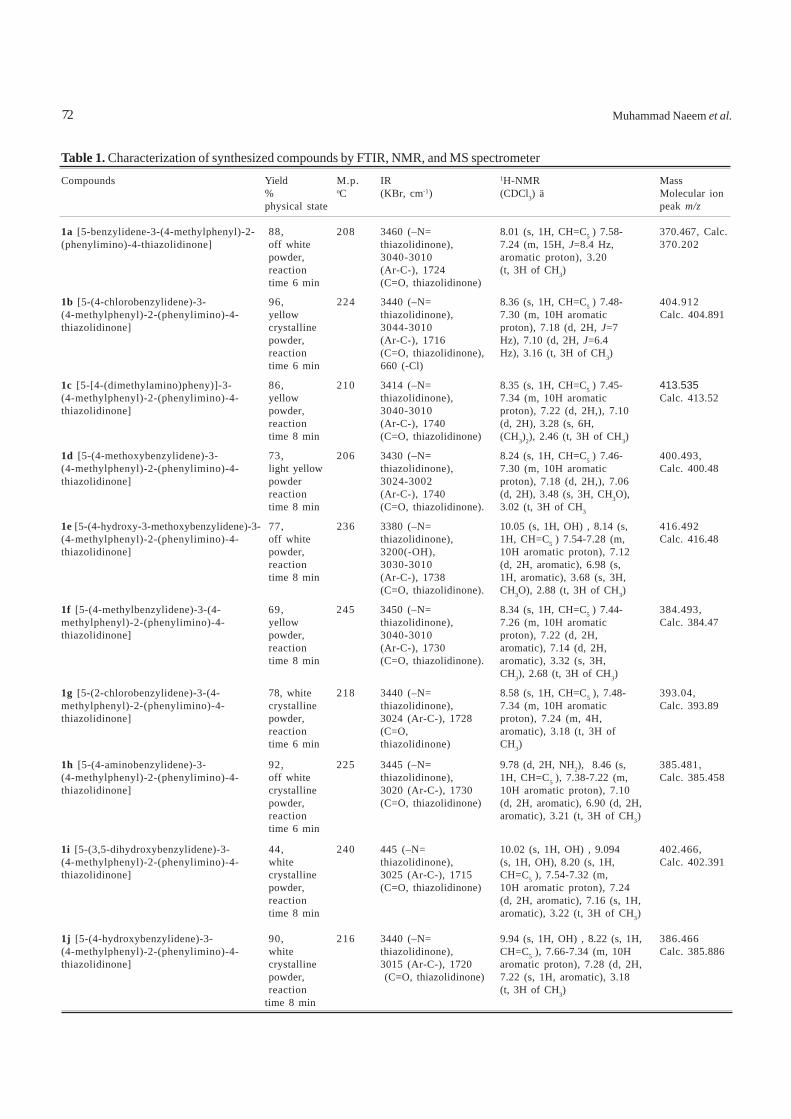
Schematic presentation of magnetron is given in Fig. 1.
was irradiated in microwave oven at 200 watts at 110 °C for6-8 min and then cooled to room temperature. The preparedcompounds were recrystallized from ethanol to get targetcompounds.
Antimicrobial activity test. The test was performed accord-ing to the disk diffusion method (United States Pharmaco-poeia, 2004). All compounds were screened for their antimi-crobial activity against a variety of bacterial strains, such asEscherichia coli, Bacillus subtilis, Staphylococcus aureusand Aspergillus niger at 20 μg/ml concentration. Apparatuswere sterilized by using autoclave for 15 min at 121 ºC (Fazzini,Model F-31, Italy). Agar plates were surface inoculateduniformly using the broth culture of the tested microorgan-isms. The potency of synthesized compound was inserted ina hole made by the porcelain cylinders under laminar flowhood. The impregnated disks were placed on the mediumsuitably spaced apart and then transferred to an incubator at37 ºC for 72 h for bacteria, and at 28 ºC for fungi (Naeem et al.,2008). Inhibition zones caused by various compounds on themicroorganisms were examined. The results of the preliminaryscreening are listed in Table 3.
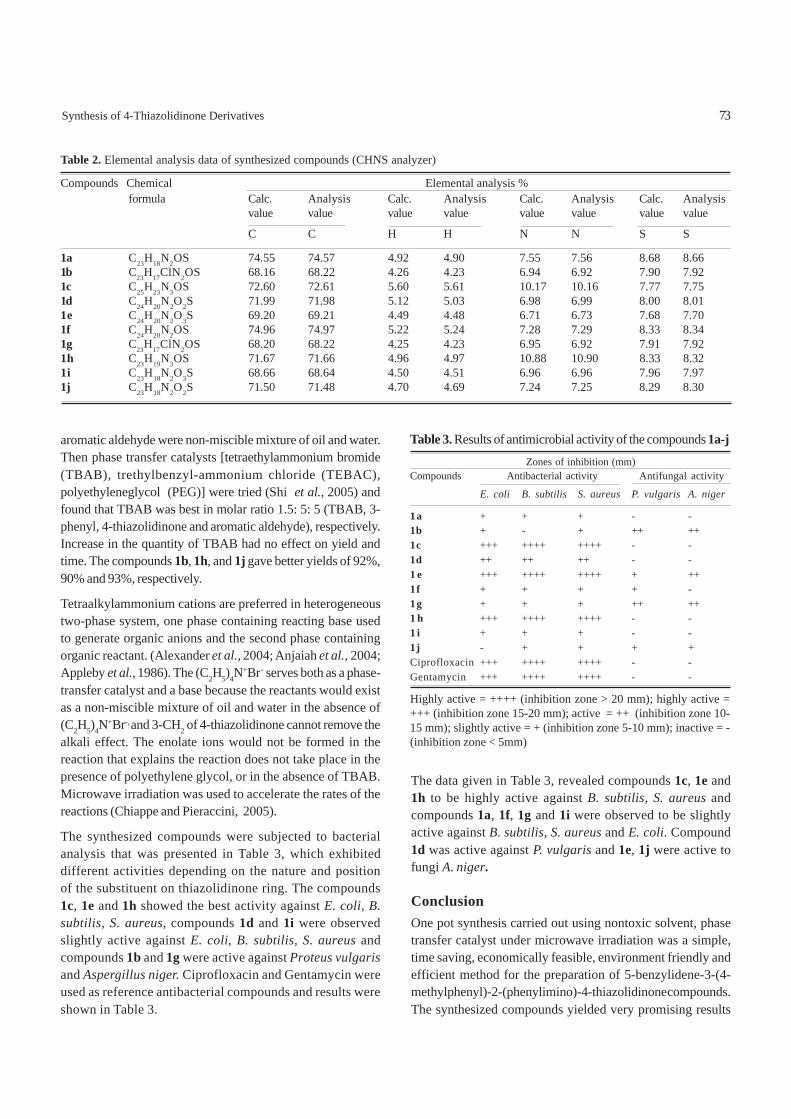
Results and DiscussionA series of ten compounds 1(a-j), 5-benzylidene-3-(4-methyl-phenyl)-2-(phenylimino)-4-thiazolidinone were synthesizedusing phase transfer catalyst (TBAB) under microwaveirradiation (synthetic scheme).
71Synthesis of 4-Thiazolidinone Derivatives
A. MagnetronB. Reaction mixture with the EDL and a magnetic stir barC. Aluminum plateD. Magnetic stirrerE. PyrometerF. Circulating water in a glass tubeG. Dummy load inside the oven cavity
Series (1a-j). Synthesis of 5-benzylidene-3-(4-methylphenyl)-2-(phenyli-mino)-4-thiazolidinone. Equimolar (5 mmol)quantity of compound 3-(4-methylphenyl)-2-(phenylimino)-4-thiazolidinone (1.4118 g) was treated with different aromaticaldehydes in the presence of phase transfer catalyst (1.6 mmoltetrabutylammonium bromide) and 20 ml water. The mixture
Structures of synthesized compounds were elucidated byspectral data mentioned in Table 1 and Table 2. Previously,under microwave irradiation, a reaction of 3-phenyl, 4-thiazolidinone with aromatic aldehyde was conducted withoutTBAB using water as solvent, for 8 min but target compoundswere not obtained, because 3-phenyl,4-thiazolidinone with
Table 1. Characterization of synthesized compounds by FTIR, NMR, and MS spectrometer
Compounds Yield M.p. IR 1H-NMR Mass% oC (KBr, cm-1) (CDCl3) ä Molecular ionphysical state peak m/z
aromatic aldehyde were non-miscible mixture of oil and water.Then phase transfer catalysts [tetraethylammonium bromide(TBAB), trethylbenzyl-ammonium chloride (TEBAC),polyethyleneglycol (PEG)] were tried (Shi et al., 2005) andfound that TBAB was best in molar ratio 1.5: 5: 5 (TBAB, 3-phenyl, 4-thiazolidinone and aromatic aldehyde), respectively.Increase in the quantity of TBAB had no effect on yield andtime. The compounds 1b, 1h, and 1j gave better yields of 92%,90% and 93%, respectively.
Tetraalkylammonium cations are preferred in heterogeneoustwo-phase system, one phase containing reacting base usedto generate organic anions and the second phase containingorganic reactant. (Alexander et al., 2004; Anjaiah et al., 2004;Appleby et al., 1986). The (C2H5)4N
+Br- serves both as a phase-transfer catalyst and a base because the reactants would existas a non-miscible mixture of oil and water in the absence of(C2H5)4N
+Br-, and 3-CH2 of 4-thiazolidinone cannot remove thealkali effect. The enolate ions would not be formed in thereaction that explains the reaction does not take place in thepresence of polyethylene glycol, or in the absence of TBAB.Microwave irradiation was used to accelerate the rates of thereactions (Chiappe and Pieraccini, 2005).
The synthesized compounds were subjected to bacterialanalysis that was presented in Table 3, which exhibiteddifferent activities depending on the nature and positionof the substituent on thiazolidinone ring. The compounds1c, 1e and 1h showed the best activity against E. coli, B.subtilis, S. aureus, compounds 1d and 1i were observedslightly active against E. coli, B. subtilis, S. aureus andcompounds 1b and 1g were active against Proteus vulgarisand Aspergillus niger. Ciprofloxacin and Gentamycin wereused as reference antibacterial compounds and results wereshown in Table 3.
Table 2. Elemental analysis data of synthesized compounds (CHNS analyzer)
The data given in Table 3, revealed compounds 1c, 1e and1h to be highly active against B. subtilis, S. aureus andcompounds 1a, 1f, 1g and 1i were observed to be slightlyactive against B. subtilis, S. aureus and E. coli. Compound1d was active against P. vulgaris and 1e, 1j were active tofungi A. niger.
ConclusionOne pot synthesis carried out using nontoxic solvent, phasetransfer catalyst under microwave irradiation was a simple,time saving, economically feasible, environment friendly andefficient method for the preparation of 5-benzylidene-3-(4-methylphenyl)-2-(phenylimino)-4-thiazolidinone compounds.The synthesized compounds yielded very promising results
Table 3. Results of antimicrobial activity of the compounds 1a-j Zones of inhibition (mm)Compounds Antibacterial activity Antifungal activity
E. coli B. subtilis S. aureus P. vulgaris A. niger
Highly active = ++++ (inhibition zone > 20 mm); highly active =+++ (inhibition zone 15-20 mm); active = ++ (inhibition zone 10-15 mm); slightly active = + (inhibition zone 5-10 mm); inactive = -(inhibition zone < 5mm)
Synthesis of 4-Thiazolidinone Derivatives 73
when compared with Ciprofloxacin and Gentamycin asreference antibiotic (fourth generation). The compounds 1c,5-[4-(dimethylamino)pheny)]-3-(4-methylphenyl)-2-(pheny-limino)-4-thiazolidinone. 1e, 5-(4-hydroxy-3-methoxybenzy-lidene)-3-(4-methylphenyl)-2-(phenylimino)-4-thiazoli-dinoneand 1h [5-(4-aminobenzylidene)-3-(4-methylphenyl)-2-(Phenylimino)-4-thiazolidinone] can be used as broadspectrum antibiotics after carrying out toxicological studies;since bacteria are developing resistance against the existingantibiotics, there is always need for developing newantibacterial compounds.
Sulfonylation reactions of aromatics using FeCl3 basedionic liquids. Journal of Molecular Catalysis 223: 1-2.
Algul, O., Kaessler, A., Apcin, Y., Yilmaz, A., Jose, J. 2008.Comparative studies on conventional and microwavesynthesis of some benzimidazole, benzothiazole and indolederivatives and testing on inhibition of hyaluronidase.Molecules 13: 736-748.
Anjaiah, S., Chandrasekhar, S., Gree, R. 2004. Synthesis andpreliminary use of novel acrylic ester-derived task-specificionic liquids. Tetrahedron Letters 45: 569-574.
Appleby, D., Hussey, C.L., Seddon, K.R., Turp, J.E. 1986. Room-temperature ionic liquids as solvents for electronicabsorption spectroscopy of halide complexes. Nature323: 614-614.
Chiappe, C., Pieraccini, D. 2005. Ionic liquids: solvent propertiesand organic reactivity. Journal of Physical OrganicChemistry 18: 275-278.
Kasmi-Mir, S., Djafri, A., Paquin, L., Hamelin, J., Rahmouni, M.2006. One-pot synthesis of 5-arylidene-2-imino-4-thiazolidinones under microwave irradiation. Molecules11: 597-602.
Merck Index, 1996. Drug Guides, 12th edition, Merck andCompany, Germany.
Naeem, M., Chauhdhry, M.N., Baloch, I.H., Rehman, S. 2008.An environmental friendly procedure for the synthesisof potentially biologically active compounds containing4-thiazolidinone. Journal of The Chemical Society ofPakistan 30: 23-28.
Rao, A., Chimirri, A., Ferro, S., Monforte, A.M., Monforte, P.2004. Microwave -thiazolidinones derivatives as HIV-1RT inhibitors. ARKIVOC 147-155.
Shi, F., Tu, S.J., Fang, F., Li, T.J. 2005. One-pot synthesis of2-amino-3-cyanopyridine derivatives under microwaveirradiation without solvent. ARKIVOC 137-142.
Singh, S.P., Parmer, K.S., Raman, K., Stenberg, V.I. 1981.Chemistry and biological activity of thiazolidinones.Chemical Reviews 81: 175-203.
United States Pharmacopoeia (USP), 2004. Bioassay, USP27-NF 22, 3: 2163-2167.
Muhammad Naeem et al.74
IntroductionWheat (Triticum aestivum L.) is the most important food cropof the world including Pakistan and ranks first among all thecereals. In Pakistan, it occupies around 8.6 million hectareswith annual production of 22.0 million tones (EconomicSurvey, 2007). Wheat yields of the country are much lower ascompared to many other countries of the world due to abioticstresses particularly drought, salinity and high temperature(Sial et al., 2005; Khan, 2003; Reynolds et al., 2001).
To overcome the consumption pressure of ever increasingpopulation, efforts are concentrating on improving wheat-yield by developing new varieties with desirable geneticmake up. Although selection and breeding is the ultimate wayto produce stress tolerant crop plants, exogenous applicationof osmoprotectants, growth promoters and antioxidant com-pounds to plants has been considered a short-term solutionfor alleviating the adverse effects of different stresses onplants during the last decade (Arfan et al., 2007; Raza et al.,2006; Iqbal and Ashraf, 2005).
Various physiological and biochemical effects of salicylicacid on plant systems have been documented in response toenvironmental stresses (Raskin, 1992). These include effectson membrane permeability, SOD activity, chlorophyll, relativewater contents etc. (Agarwal et al., 2005). It is also an importantmolecule for modulating plant responses to stress (Senaratnaet al., 2000). Any compound can be applied exogenously eitheras a pre-sowing seed treatment, as a foliar spray or through
Pak. J. Sci. Ind. Res. 2009 52(2) 75-79
Salicylic Acid Induced Physiological and Biochemical Changesin Wheat Under Drought Stress Conditions
Sami Ullah Khana, Asghari Banob, Jalal Ud Dina* and Suba Sadiq Tahirc
(received August 25, 2008; revised February 11, 2009; accepted February 13, 2009)
Abstract. Experiment for finding the effect of pre-soaking of wheat seeds varieties, viz Wafaq-2001 and Punjab-96, insalicylic acid (SA) solution on the drought tolerance of wheat, revealed increase in the total biomass and grain yield per plantas well as in spikes per plant, 100 seed weight, proline, total soluble sugars, membrane stability index (MSI), superoxidedismutase (SOD) and ascorbate peroxidase (APOX) activity in both the tested varieties. The yield increase in droughttolerant variety Wafaq-2001 was more as compared to drought sensitive Punjab-96. Results signify the role of SA inregulating the drought response of wheat and that SA could be seed primed and used as a potential growth regulator underdrought stress conditions.
the rooting medium (Ashraf and Foolad, 2007; Iqbal andAshraf, 2005) but pre-sowing seed treatment is easy, timesaving and economical for the farmers to mitigate the adverseeffects of drought stress.
The hypothesis of present research study was to analyze theeffects of salicylic acid seed pre-treatment in ameliorating theadverse effects of drought stress in wheat.
Materials and MethodsSeeds of two wheat varieties viz Wafaq-2001 and Punjab-96,obtained from wheat programme, National Agriculture ResearchCentre (NARC) Islamabad, Pakistan, were treated in aeratedaqueous solution of salicylic acid (10-4M) for 12 h and control(no SA) in black painted flasks. A separate set of plants wasmaintained which served as well watered. After hormone treat-ment, seeds were washed with distilled water and sown inpots filled with soil.
Drought stress was imposed at three developmental stagesviz tillering (48 DAS), preanthesis (80 DAS) and mid-milkystage (128 DAS) by withholding irrigation for about 5-7 daystill the signs of temporary wilting/leaf rolling started. At thissatge, samples of flag leaf were collected and analyzed forproline, soluble sugar, superoxide dismutase (SOD), ascorbateperoxidase (APOX) activity and membrane stability index(MSI). After sampling, pots were regularly irrigated. Prolinecontent of flag leaf was determined by the method of Bateset al. (1973). Total soluble sugars were measured as describedby Pattanaik and Mohapta (1988).
Biological Sciences
75
Salicylic Acid Induced Changes in Wheat 77
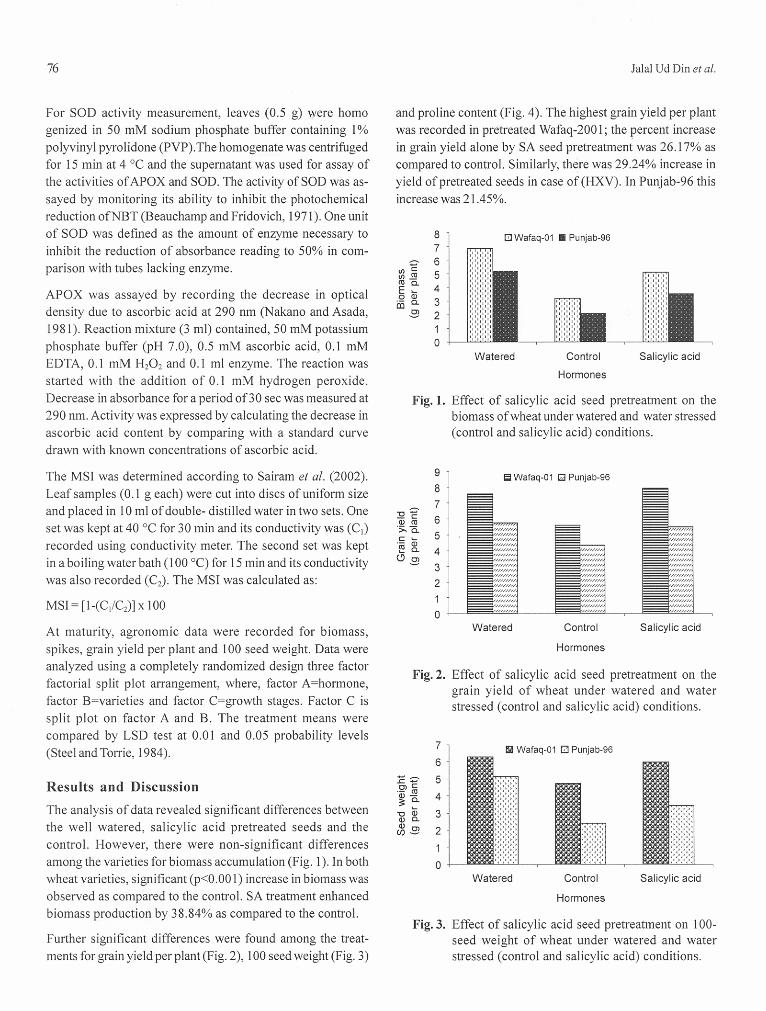
The highest 100 seed weight (23.9%) increase was observed in pretreated Wafaq-200 1. However, in case of HxV, this increase was 20.8% in case of Wafaq-200 1 and 29.61% in case of Punjab-96.
Wafaq-200 1 accumulated highest proline content, whereas, proline content was non-significant under HxV interaction. There was 40.4% increase in proline as compared to the control.
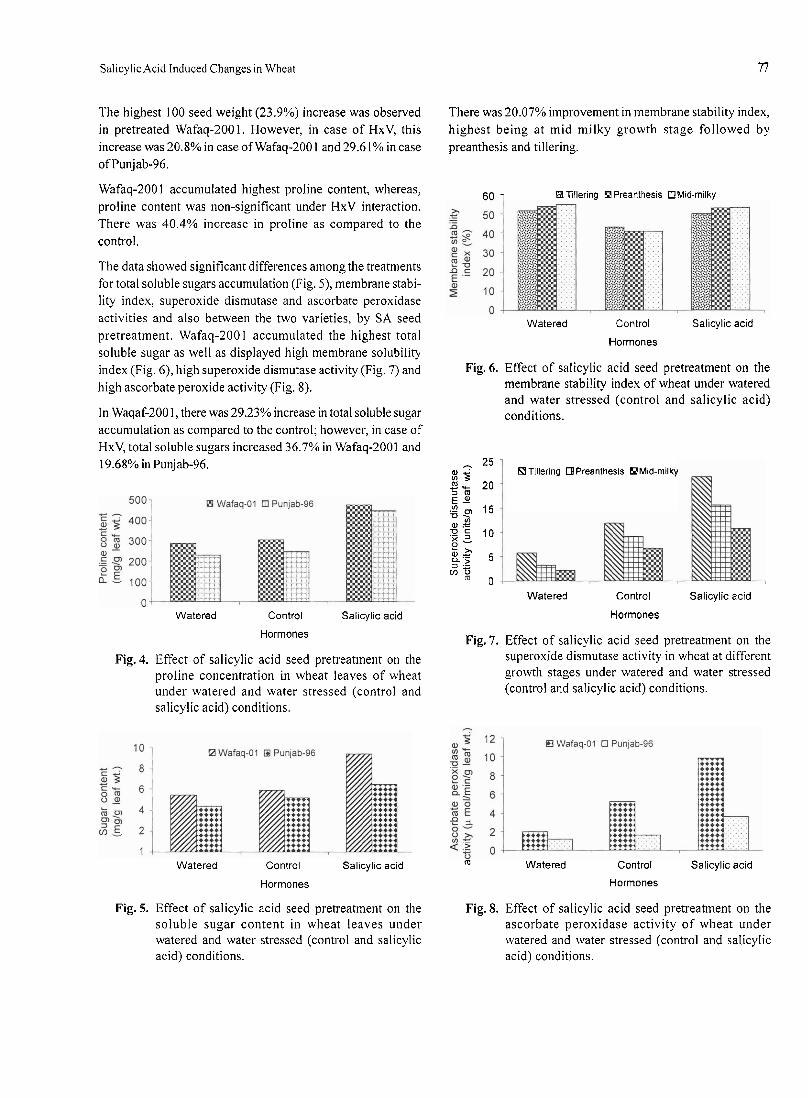
The data showed significant differences among the treatments for total soluble sugars accumulation (Fig. 5), membrane stabi- lity index, superoxide dismutase and ascorbate peroxidase activities and also between the two varieties, by SA seed pretreatment. Wafaq-2001 accumulated the highest total soluble sugar as well as displayed high membrane solubility index (Fig. 6), high superoxide dismutase activity (Fig. 7) and high ascorbate peroxide activity (Fig. 8).
In Waqaf-200 1, there was 29.23% increase in total soluble sugar accumulation as compared to the control; however, in case of HxV, total soluble sugars increased 36.7% in Wafaq-2001 and 19.68% in Punjab-96.
Watered Control Salicylic acid
Hormones
Fig. 4. Effect of salicylic acid seed pretreatment on the proline concentration in wheat leaves of wheat under watered and water stressed (control and salicylic acid) conditions.
There was 20.07% improvement in membrane stability index, highest being at mid milky growth stage followed by preanthesis and tillering.
60 1 Tillering E l Preanthesis OMid-milky
Watered Control Salicylic acid
Hormones
Fig. 6. Effect of salicylic acid seed pretreatment on the membrane stability index of wheat under watered and water stressed (control and salicylic acid) conditions.
n 25 s .j; GI Tillering H Preanthesis BMid-milky 2.8- 20 3 lu E 2 g q 15 a, .2 B ' 10 g 2 & 3 a .5 5 3 '= V) 0
0 Watered Control Salicylic acid
Hormones
Fig.7. Effect of salicylic acid seed pretreatment on the superoxide dismutase activity in wheat at different growth stages under watered and water stressed (control and salicylic acid) conditions.
Watered Control Salicylic acid Watered Control Salicylic acid m
Hormones Hormones
Fig. 5. Effect of salicylic acid seed pretreatment on the Fig. 8. Effect of salicylic acid seed pretreatment on the soluble sugar content in wheat leaves under ascorbate peroxidase activity of wheat under watered and water stressed (control and salicylic watered and water stressed (control and salicylic acid) conditions. acid) conditions.
There was 40.5% and 49.3% increase in SOD and APOXactivities, respectively, by SA seed pre-treatment alone. Incase of HxV, the increase was 40.2% and 46.6%, respectively,in Wafaq-2001 and 43.8% and 55.5%, respectively, in Punjab-96by SA seed pretreatment.
SA seed pretreatment significantly affected plant growthproperties i.e., biomass per plant, grain yield per plant,100 seedweight, proline, total soluble sugars, activity of SOD andAPOX enzymes. Drought stress caused a significant reduc-tion in the growth of two wheat varieties. However, applica-tion of salicylic acid seed pretreatment counteracted theadverse effects of low water availability on the growth of thevarieties.
From the results it can be concluded that beneficial effect ofSA application depends on type of cultivar. Bezrukova et al.(2004) also reported improvement in growth of wheat by SAapplication. In the present study increase in grain yield and100-grain weight of Wafaq-2001 was mainly due to increase ingrain size and number with SA application. This is in agree-ment with findings of Grieve et al. (1992), who inferred that thebeneficial effects of SA on grain may have been due to trans-location of more photo-assimilates to grains during grain fill-ing, thereby increasing the grain yield per plant. Zhou et al.(1999) also reported 9% increase in grain weight of maize plantsseed-soaked with SA. The second possible mechanism of SAinduced yield enhancement might be an increase in the num-ber of spikelets and number of grains, because SA has thecapacity to both directly and indirectly regulate the yield(Agarwal et al., 2005).
SA treatment increased proline content more in Wafaq-2001than Punjab-96. Proline indirectly causes increase in meta-bolic activation by providing osmoregulation for the plantsunder stress (El-Tayeb, 2005; Shakirova et al., 2003; Pesserakliand Huber, 1987) and also found increase in proline contentwith SA treatment under salinity and drought.
SOD activity increased significantly, by SA seed pretreatment(Fig. 4). The highest increase in SOD activity was observed inWafaq-2001 by SA seed pretreatment as compared to control.SA seed pre-treatment increased the activity of ascorbateperoxidase. The highest increase in ascorbate peroxidase wasobserved in Wafaq-2001 followed by Punjab-96 (Fig. 5). Thismight be due to drought tolerant character of Wafaq-2001.Salicylic acid-induced-increase in SOD, CAT and GR activitieshas also been reported by Agarwal et al. (2005), Clark et al.(2002) and Molina et al. (2002). The higher MSI in droughttolerant Wafaq-2001 suggests a better protection from theoxidative damage. The better protection in Wafaq-2001 seemsto result from the high CAT and APOX activity. These results
are in agreement with the results of Bor et al. (2003) and Sairamet al. (2002) who found a correlation between increased anti-oxidant enzymes activities and decreased lipid peroxidation insalt drought tolerant wheat and wild beet, Beta maritema,respectively, under salt stress.
ConclusionFrom the results it was inferred that SA seed treatment causedan increase in biomass and grain yield in both the two wheatvarieties. The increase in yield was more pronounced in thetolerant variety Wafaq-2001 as compared to drought sensitivePunjab-96. The SA pre-soaking increased total biomass,proline, total soluble sugars, membrane stability index,activity of superoxide dismutase and ascorbate peroxidase inboth the tested varieties. Results signify the role of SA inregulating the drought response of wheat and suggest thatSA could be seed primed and used as a potential growthregulator under drought stress conditions.
Changes in antioxidant enzymes activity and oxidativestress by abscisic acid and salicylic acid in wheat geno-types. Biologia Plantarum 49: 541-550.
Arfan, M., Athar, H.R., Ashraf, M. 2007. Does exogenousapplication of salicylic acid through the rooting mediummodulate growth and photosynthetic capacity in twodifferently adapted spring wheat cultivars under saltstress. Journal of Plant Physiology 164: 685-694.
Ashraf, M., Foolad, M.R. 2007. Roles of glycine betaine andproline in improving plant abiotic stress resistance.Environmental and Experimental Botany 59: 206-216.
Bates, L.S., Waldren , R.P., Teare, L.D. 1973. Rapid determi-nation of free proline for water-stress studies. Plant andSoil 39: 205-207.
Beauchamp, C., Fridovich, I. 1971. Superoxide dismutaseimproved assays and an assay applicable to acrylamidegels. Analytical Biochemistry 44: 276-287.
Bezrukova, M.V., Kildibekova, A.R., Avalbaev, A.M., Shakirova,F.M. 2004. Participation of wheat germ agglutinin inregulation of cell division in apical root meristem of wheatseedlings. Tsitologiya 46: 35-38.
Bor, M., Ozdemir, F., Turkan, I. 2003. The effect of salt stress onlipid per-oxidation and antioxidants in leaves of sugarbeet Beta vulgaris L. and Wild beet Beta maritima L.Plant Science 164: 77-84.
Clark, Sean F., Guy, Pau L., Burrit, David J., James, Paula E.2002. Changes in the activities of antioxidant enzymesin response to virus infection and hormone treatment.Phsiologia Plantarum 114: 157-164.
78 Jalal Ud Din et al.
Economic Survey, 2007. Government of Pakistan EconomicSurvey, pp. 12-13, Finance Division, Economic AdvisorsWing, Islamabad, Pakistan.
El-Tayeb, M.A. 2005. Response of barley grains to the inter-active effect of salinity and salicylic acid. Plant GrowthRegulation 45: 215-224.
Grieve, C.M., Lesch, S.M., Francois, L.E., Maas, E.V. 1992.Analysis of main-spike yield components in salt stressedwheat. Crop Science 32: 697-703.
Iqbal, M., Ashraf, M. 2005. Changes in growth, photosynthe-tic capacity and ionic relations in spring wheat (Triticumaestivum L.) due to pre-sowing seed treatment withpolyamines. Plant Growth Regulation 46: 19-30.
Khan, M.A. 2003. Wheat Crop Management for Yield Maxi-mization, 94 p., A publication of Agriculture Department,Government of Punjab, Lahore, Pakistan.
Molina, Anabel, Bueno, Pablo, Marlin, Maria Carmen,Rodriguez Rosales, Maria Pilar, Belver, Andres, Venema,Kees, PedroDanaire, Juan. 2002. Involvement of endo-genous salicylic acid content lipoxygenase and antioxi-dant benzymes activities in the response of tomato cellsuspension cultures to NaCl. New Phytologist 156:409-415.
Nakano, Y., Asada, K. 1981. Hydrogen peroxide is scavengedby ascorbate specific peroxidase in spinach chloroplasts.Plant Cell Physiology 22: 867-880.
Pattanaik, P.K., Mohapta, T.D. 1988. Role of assimilates andphosphates in the control of internode elongation in talland dwarf indica rice varieties. Journal of ExperimentalBotany 39: 1367-1380.
Pesserakli, M., Huber, J.T. 1987. Dry matter, yield, nitrogenabsorption and water uptake by sweet corn under saltstress. Journal of Plant Nutrition 12: 279-290.
Raskin, I. 1992. Role of salicylic acid in plants. Annual Reviewof Plant Physiology and Molecular Biology 43: 439-463.
Raza, S.H., Athar H.R, Ashraf, M. 2006. Influence of exoge-nously applied glycinebetaine on the photosyntheticcapacity of two differently adapted wheat cultivarsunder salt stress. Pakistan Journal of Botany 38: 341-352.
Reynolds, M.P., Mujeeb Kazi, A., Sawkins, M. 2001. Prospectsof utilizing plant-adaptive mechanisms to improve wheatand other crops in drought- and salinity-prone environ-ment. Annals of Applied Biology 146: 239-259.
Sairam, R.K., Rao, K.V., Srivastava, G.C. 2002. Differentialresponse of wheat genotypes to long term salinity stressin relation to oxidative stress, antioxidant activity andosmolyte concentration. Plant Science 163: 1037-1046.
Senaratna, T., Touchell,D., Bunn, E., Dixon, K. 2000. Acetylsalicylic acid (asprin) and salicylic acid induced multiplestress tolerance in bean and tomato plant. Plant GrowthRegulation 30: 157-161.
Shakirova, Farida M., Sakhabutdinova, Assol R., Bezrukova,Marina V., Fatkhutdinova, Rymma A., Fatkhudinova,Dilara R. 2003. Changes in the hormonal status of wheatseedling induced by salicylic acid and salinity. Plant Sci-ence 164: 317-322.
Sial, M.A., Arain, M.A., Khanzada, S.D., Naqvi, M.H., Dahot,M.U., Nizamani, N.A. 2005. Yield and quality parametersof wheat genotypes as affected by sowing dates and hightemperature stress. Pakistan Journal of Botany 37: 575-584.
Steel, R.G.D., Torrie, J.H. 1984. Principles and Procedures ofStatistics, McGraw Hill Book Company Inc., New York,USA.
Zhou, X.M., Mackeuzie, A.F., Madramootoo, C.A., Smith, D.L.1999. Effect of some injected plant growth regulators,with or without sucrose on grain production, biomassand photosynthetic activity of field grown corn plants.Journal of Agronomy and Crop Science 183: 103-110.
79Salicylic Acid Induced Changes in Wheat
Micronutrient (Zn) Role in Stimulating Root Nodules and Yield of ChickpeaAbdur Rashid
Arid Zone Research Institute, Pakistan Agriculture Research Council (PARC), Dera Ismail Khan, Pakistan
(received April 4, 2007; revised March 14, 2009; accepted March 16, 2009)
IntroductionIn Pakistan, soils are generally poor in micronutrients. Zincdeficiency has particularly been reported in rainfed areascausing substantial yield losses (Rashid and Rafique, 1996).Zinc deficiency restricts RNA development which in turninhibits protein synthesis and results in stunted growth.Previous research findings revealed that Zn applicationimproved the nitrogen metabolisim, yield and nitrogenfixation in legume crops (Shukla and Yadar, 1982). Similarly,Khanzada and Ahmad (1989) indicated that the applicationof iron (Fe) and zinc (Zn) significantly increased the grainyield of soybean due to improvement in the yield compo-nents and nitrogen metabolism of crop. Muhammad et al.(1999) reported that the application of Zn @ 5 kg/ha signifi-cantly increased the grain yield of rapeseed but 10 kg/ha ofZn showed depressing effect. In contrast, Sherazi et al. (2001)reported that the level of 10 kg/ha Zn significantly increasedcotton yield as against other applications in cotton zone ofPunjab, Pakistan. Nathan et al. (2005) indicated that Znfertilization increased the paddy yield by 12 to 18% comparedto the unfertilized flooded rice. Hussain and Yasin (2004)concluded that the application of 5 kg/ha zinc increased thewheat grain yield by 16% over the control.
Due to high nitrogen concentration in the tissues, pulsescontribute considerably towards soil fertility. The soil enrich-ing property of mashbean is of greater value especially to ourcountry, where soils are deficient in organic matter, nitrogenand other soil fertility parameters (Ofori and Stern, 1987).Ibrahim et al. (1987) reported that soybean can fix 60-168 kg ofatmospheric nitrogen and add to the soil per year. Pal andSheshu (2001) reported that the transfer of residual N fromnodulating soybean, lablab bean, green gram and black gramto the succeeding maize crop was of the order of 18.4-20.9,19.5-29.9, 12.0-13.7 and 9.3-10.3 kg/ha, respectively.
Chickpea (Cicer arietinum L.) pulse group is widely grown, bothin rainfed and irrigated regions of Pakistan. During 2003-04,chickpea was grown on an area of 982.3 thousand hectareswith a production of 611.1 thousand tons (Qureshi, 2004).Being leguminous in nature, it not only demands less fertilizerbut also improves soil fertility by virtue of fixing free atmos-pheric nitrogen through the root nodules. Being the richsource of protein (17-23%), it is called poor man’s meat.
In consideration of the acute shortage of proteins in cereal baseddiets of mankind and livestock, in general, and in Pakistan, inparticular, study on the effect of Zn on the production of chickpeawas undertaken in the climatic conditions of D.I. Khan, Pakistan.
Materials and MethodsThe field study was conducted to determine the response ofZn manuring on chickpea at Arid Zone Research Institute,PARC, D.I.Khan, Pakistan during Rabi season of 2004-05. Thetreatments comprised of five Zn levels (0, 2.5, 5.0, 7.5 and 10kg/ha) applied as zinc sulphate (ZnSO4) at sowing time with abasal dose of 20-50 kg NP/ha to the field. The experiment waslaid out in a randomized complete block design (RCB) withthree replications. A plot size of 5 x 1.8 m with six (6) rows perplot was maintained, keeping row to row distance of 30 cm.Soil samples collected from experimental site were air dried,grinded, sieved and mixed thoroughly for making accuratephysical and chemical analysis (Table 1).
An improved variety of chickpea “NIFA-88” was sown in a wellprepared seed bed using seed rate of 70 kg/ha. Recommendedcultural practices and plant protection measures were adoptedtill harvest of the crop. The agro-meteorological data recordedduring the growing period of crop is depicted in Fig. 1.
At complete flowering and pod formation stage, ten (10) plantsfrom each treatment were uprooted at random. Roots of
Pak. J. Sci. Ind. Res. 2009 52(2) 80-83
Abstract. In the study of the effect of zinc (Zn) on root nodule stimulation and yield of chickpea under the climaticcondition of D.I. Khan, Pakistan, significant effect of application of varying levels of zinc was noted. Plant height wassignificantly more as compared to the control. The plants receiving 7.5 kg/ha Zn had the highest weight of nodules/plantand produced maximum grain yield of 1185 kg/ha.
produced taller plants relative to the plants grown as control.A maximum of 111.7 cm plant height was recorded in the plotsfertilized with 10 kg/ha Zn, while the minimum plant height of105.1 cm was recorded for the control. Analysis of variancefor plant height of chickpea as affected by different treat-ments of Zn also indicated a significant difference (P=0.05)between different means of Zn treatments. The maximum plantheight produced with 10 kg/ha Zn was statistically at par withthe plant heights produced by the application of 5.0 and 7.5kg/ha Zn. This increase in the plant height might be attributedto the effect of Zn on vegetative growth of chickpea particu-larly plant height. Similar increase in plant height of wheat by3.2%, effective tillers by 11.6% and per grain panicle by 11%over control was reported by Jana et al. (2005).
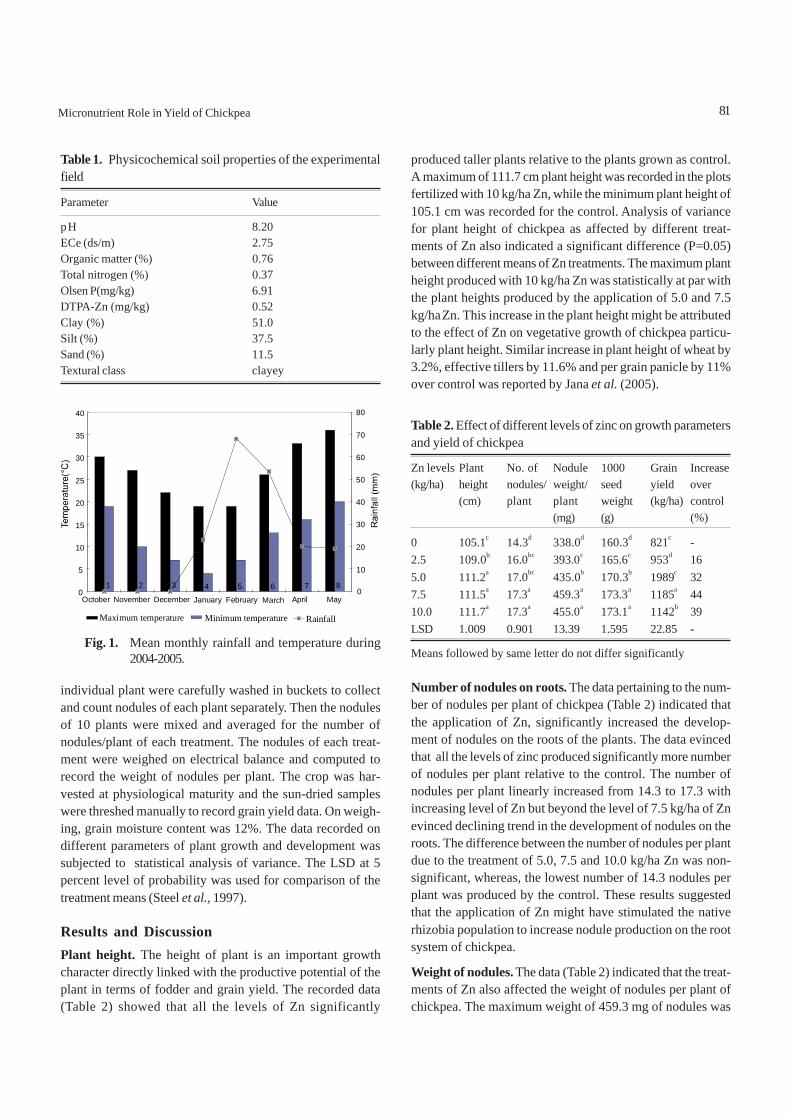
Table 1. Physicochemical soil properties of the experimentalfield
Fig. 1. Mean monthly rainfall and temperature during2004-2005.
individual plant were carefully washed in buckets to collectand count nodules of each plant separately. Then the nodulesof 10 plants were mixed and averaged for the number ofnodules/plant of each treatment. The nodules of each treat-ment were weighed on electrical balance and computed torecord the weight of nodules per plant. The crop was har-vested at physiological maturity and the sun-dried sampleswere threshed manually to record grain yield data. On weigh-ing, grain moisture content was 12%. The data recorded ondifferent parameters of plant growth and development wassubjected to statistical analysis of variance. The LSD at 5percent level of probability was used for comparison of thetreatment means (Steel et al., 1997).
Results and DiscussionPlant height. The height of plant is an important growthcharacter directly linked with the productive potential of theplant in terms of fodder and grain yield. The recorded data(Table 2) showed that all the levels of Zn significantly
81
0
5
10
15
20
25
30
35
40
1 2 3 4 5 6 7 8
October November December January February March April May0
10
20
30
40
50
60
70
80
Minimum temperatureMaximum temperature Rainfall
Micronutrient Role in Yield of Chickpea
Table 2. Effect of different levels of zinc on growth parametersand yield of chickpea
Zn levels Plant No. of Nodule 1000 Grain Increase(kg/ha) height nodules/ weight/ seed yield over
Means followed by same letter do not differ significantly
Number of nodules on roots. The data pertaining to the num-ber of nodules per plant of chickpea (Table 2) indicated thatthe application of Zn, significantly increased the develop-ment of nodules on the roots of the plants. The data evincedthat all the levels of zinc produced significantly more numberof nodules per plant relative to the control. The number ofnodules per plant linearly increased from 14.3 to 17.3 withincreasing level of Zn but beyond the level of 7.5 kg/ha of Znevinced declining trend in the development of nodules on theroots. The difference between the number of nodules per plantdue to the treatment of 5.0, 7.5 and 10.0 kg/ha Zn was non-significant, whereas, the lowest number of 14.3 nodules perplant was produced by the control. These results suggestedthat the application of Zn might have stimulated the nativerhizobia population to increase nodule production on the rootsystem of chickpea.
Weight of nodules. The data (Table 2) indicated that the treat-ments of Zn also affected the weight of nodules per plant ofchickpea. The maximum weight of 459.3 mg of nodules was
obtained by the treatment of 7.5 kg/ha Zn, whereas, minimumweight of 338 mg was recorded in the control. The differencebetween the treatments of different levels of zinc was alsosignificant except for application of 7.5 and 10 kg/ha Znlevels. Low levels of zinc gave low weight of nodules/plant ascompared to higher levels. This confirmed the synergisticeffect of Zn in the development of nodules which ultimatelyimproved the efficiency of atmospheric nitrogen fixation bylegumes as reported by Shukla and Yadar (1982) that theapplication of phosphorus and zinc improved the metabolicactivities relating to nitrogen fixation and grain yield ofchickpea.
Grain weight. The magnitude of grain development isindicated by the 1000 grain weight of crop. The data in thisrespect, depicted in Table 2, indicate that 1000 grain weight ofchickpea was significantly affected by the application of Zn.Different levels of Zn significantly increased 1000 grain weightrelative to control. Maximum of 173.3 g of 1000 grain weightwas obtained by the treatment of 7.5 kg/ha Zn followed by173.1 g obtained by that of 10 kg/ha showing non-significantdifference between the two. Minimum 1000 grains weight of160.3 g was recorded in the control. The data revealed that1000 grain weight showed positive relationship with plant heightand number of nodule per plant of the crop. This increase in1000 grain weight of chickpea due to Zn application might beattributed to vigorous vegetative growth which ultimatelyproduced well developed seeds. These results are in harmonywith the findings of Ammanullah and Hatam (2000), whoobserved positive relationship of 1000 seed weight ofsoybean with plant height and other parameters.
Grain yield. Data concerning grain yield of chickpea is pre-sented in Table 2. Statistical analysis of the data showed thatdifferent levels of Zn had significant (P=0.05) effect on grainyield of chickpea. It can be inferred from the data that maxi-mum grain yield of 1185 kg/ha was produced by Zn treatmentat the rate of 7.5 kg/ha followed by the yield of 1142 kg/haobtained by application of 10 kg/ha Zn; the minimum grainyield of 821 kg/ha was produced by control. These results arein line with the findings of Hussain et al. (2007), Iqbal et al.(2002) and Khanzada and Ahmad (1989), who observed similarincrease in grain yield of different crops with application ofmicronutrients. The data further revealed that the differencebetween the treatment means of different levels of Zn wasalso significant. The percentage increase in grain yield ofchickpea with different levels of Zn ranged from 16 to 44%over control. The maximum increase was recorded by thetreatment of 7.5 kg/ha Zn as compared to the low and the highlevel of Zn. Beyond this level, grain yield of chickpea declinedwith higher level of treatment. These results are in conformity
with the work of Muhammad et al. (1999) who observed similardecrease in yield of rapeseed with 10 kg/ha of Zn as comparedto the lower level. Similarly, Sharma et al. (2000) reportedthat wheat responded only to 5 kg Zn/ha and resulted in 13.62and 6.14% higher grain yield as compared to the control andapplication of 10 kg Zn/ha, respectively.
ConclusionThe findings of this study suggest that soils, poor in micro-nutrients may be supplied with the respective micronutrientfertilizer, so as to overcome the deficiency. The data showedconsiderable increase in the development of root nodulesthat might improve the soil fertility through the symbioticnitrogen fixation. Increase in grain yield of chickpea withzinc (Zn) supply also suggests application of micro-nutrients for improvement of yield and nitrogen fixingcapability of the leguminous crops.
However, for sustainable productivity, further research isrecommended for studying the multiple effects of micro-nutrients with reference to the mobilization/stimulation of theroot system and the yield of pulses.
ReferencesAmmanullah., Hatam, M. 2000. Performance and nodulation
efficiency of soybean cultivars. Pakistan Journal ofBiosciences 3: 1822-1823.
Hussain, F., Yasin, M. 2004. Soil fertility monitoring andmanagement in rice-wheat system. Annual Report LRRP,NARC, pp. 1-33, Islamabad, Pakistan.
Hussain, R., Rashid, M., Akram, M., Hussain, K., Jami,A.R. 2007. Wheat response to Zn and K applicationunder rainfed condition. Soil and Environment 26:134-138.
Ibrahim, M., Dogar, A.M.S., Chaudry, M.A. 1987. Phali DarFaslein (Urdu). Zarat Nama 26: 1-17.
Iqbal, J., Gill, K.H., Sherazi, S.J.A., Sheikh, A.A., Ramzan, M.,Shaheen, M.K. 2002. Wheat response to zinc applicationin various zones of the Punjab. Pakistan Journal of SoilScience 21: 38-43.
Jana, P.K., Ghattak, R., Sounda, G., Ghosh, R.K. 2005. Responseof wheat to levels of zinc sulfate at farmer’s field in redand laterite soils. Environment and Ecology 23: 36-361.
Khanzada., Ahmad, S. 1989. Micronutrients nutrition of inocu-lated soybean in relation to yield and yield components.Pakistan Journal of Agricultural Research 10: 132-137.
Muhammad, W., Shah S.M., Nawaz, H., Iqbal, M.M. 1999.Interactive effect of nitrogen, zinc and boron on yieldand nutrient uptake by rapeseed. Pakistan Journal ofSoil Science 16: 111-114.
82 Abdur Rashid
Nathan, A.S., Norman, R. J., Wilson, C.E. 2005. Effect ofzinc source and application time on zinc uptake andgrain yield of flood irrigated rice. Agronomy Journal 97:272-278.
Ofori, F., Stern, W. R. 1987. Cereal legumes intercroppingsystem. Advance Agronomy 41: 41-90.
Pal, U. R., Sheshu, Y. 2001. Direct and residual contributionof symbiotic nitrogen fixation by legumes to theyield and nitrogen uptake of maize in the NigerianSavannah. Journal of Agronomy and Crop Science187: 53-58.
Qureshi, M.I. 2004. Agriculture Statistic of Pakistan, pp. 44-45, Ministry of Food, Agriculture and Livestock,Islamabad, Pakistan.
Rashid, A., Rafique, E. 1996. Micronutrients in Pakistanagriculture: significance and use. Technical Brochure,
Pakistan Agriculture Research Council, Islamabad,Pakistan.
Sharma, P.K., Yadav, G.L., Sharma, B.L., Sudesh, K. 2000.Response of wheat to nitrogen and zinc fertilization.Indian Journal of Agronomy 45:124-127.
Sherazi, S.J.A., Iqbal, J., Gill, K.H., Ramzan, M., Shaheen, M.K.,Hameed, Z. 2001. Cotton response to Zn and B applica-tion in cotton in central zone of the Punjab, PakistanJournal of Soil Science 20: 65-72.
Shukla, G.C., Yadar, O.P. 1982. Effect of phosphorus and Zn asnodulation and nitrogen fixation of chickpea. Plant andSoil 65: 239-248.
Steel, R.G.D., Torrie, J.H., Dicky, D.A. 1997. Principle andProcedures of Statistics- A Biometrical Approach,pp. 204-227, 3rd edition, McGraw-Hill Book InternationalCo., Singapore.
83Micronutrient Role in Yield of Chickpea
Status of Plant Available Sulphur and Its Relationship to Other SoilCharacteristics in Pothwar Soils
Rizwan Khalida*, Khalid Saifullah Khanb, Ghulam Shabbirb, Muhammad Yousaf b and Shahid Yaqub Naza
aSoil Fertility Institute, Rawalpindi, PakistanbDepartment of Soil Science and SWC, University of Arid Agriculture, Rawalpindi, Pakistan
(received October 4, 2008; revised February 23, 2009; accepted February 26, 2009)
Pak. J. Sci. Ind. Res. 2009 52(2) 84-90
Abstract. Assessment of the amount of plant available sulphur (SO4-S) in soils of Pothwar, Pakistan revealed theaverage S contents in the soil to range from 5.7 to 21.7 μg/g. Five out of fifteen soil series were deficient (< 10 μg S/g)in SO4-S with a range of 5.0 to 9.0 μg/g, six were deficient only at upper (0-15 cm) soil depth while, the remaining fourhad satisfactory level (10-30 μg S/g) at both the soil depths. Sulphur exhibited significant positive correlation with clay(r = 0.77**), ECe (r = 0.77**), organic C (r = 0.82**), total N (r = 0.88**) and extractable P (r = 0.72**) contents in soil.Correlation coefficients of SO4-S with sand (r = -0.41), soil pH (r = -0.49) and CaCO3 (r = -0.60*) contents werenegative. Organic C and N had the most pronounced effects (R2 > 65) on S availability in soil.
IntroductionThe Pothwar Plateau (latitude 32º 10 to 34º 9 N and longitude71º 10 to 73º 55 E) constitutes an important part of the rainfedagricultural area of Pakistan. It consists mainly of Rawalpindi,Chakwal, Attock and Jhelum districts of northern Punjab,Pakistan. The annual rainfall varies from 500 to 1000 mm, outof which almost 70 percent is received in the form of heavysummer rains. 1
The main crops of Pothwar are wheat, millet, pulses, rapeseedand groundnut. The area contributes significantly, to agricul-tural and livestock production of Pakistan. Farmers of Pothwarregion practice low inputs in agriculture because of high costs,uncertainty of rainfall and unawareness of modern techno-logy. The use of fertilizers in this area is 3 to 4 times less incomparison to that of irrigated regions (Ahmed and Rashid,2003; Ali et al., 2002). Almost all soils of Pothwar are deficientin nitrogen and phosphorus while potassium is adequate forplant growth except in sandy soils.
Sulphur is the fourth major plant nutrient and in conjunctionwith NPK, plays a vital role in cell wall formation, proteinsynthesis and enzyme reactions as well as in seed formationand oil synthesis in oilseed crops. The deficiency of S hasbeen reported by Rashid et al. (1995) and Ahmad et al. (1994)in the Pothwar area. However, the information regarding thesulfur status of Pothwar soils and its response in crops is notadequate (Ahmad et al., 1994).
Rapeseed and mustard are important oilseed crops of thePothwar. They require comparatively greater amount of S for
proper growth and higher yields than cereals. It has beenestimated that 60 kg of sulphur is removed in producing oneton of rapeseed (Ahmed and Rashid, 2003). Therefore, to getbetter yields of oilseeds in this area, the knowledge of sulphurstatus and S supplying capacity of soil is imperative.
Sulphur in Pothwar soils is mostly inherited from parentmaterial (inorganic) or added through rainwater because it isspeculated that the amount of S generated from organicsources in Pothwar soils cannot be appreciable due to rela-tively low organic matter in soil and lack of recycling of cropresidues. Rich source of S from canal and tubewell water isnot available in this rainfed area. The present study wascarried out to assess plant available S (SO4-S) in prominentsoil series of Pothwar region of Pakistan and to study itsrelationship with other important soil characteristics.
Materials and MethodsSoils belonging to 15 dominant series in the Pothwar tract ofthe Punjab province of Pakistan were collected from theirrelevant locations, earmarked by the Soil Survey of Pakistan(Soil Survey of Pakistan, 1971; 1967). Four soil series (Qutbal,Missa, Rajar and Basal) from Attock district, five soil series(Talagang, Balkassar, Chakwal, Satwal and Therpal) fromChakwal district and six soil series (Guliana, Kahuta,Rawalpindi, Rawal, Tirnaul and Qazian) from Rawalpindidistrict were collected. These soils were classified as (1) TypicUstochrepts: Missa, Basal, Talagang, Rawalpindi, Rawal,Tirnaul, (2) Typic Haplustalfs: Balkassar, Chakwal, Therpal,Kahuta and Gulianan, (3) Typic Ustorthents: Qutbal, Missaand Rajar, (4) Typic Torripsamments: Qazian and (5) Typic*Author for correspondence; E-mail: [email protected]
85
Chromusterts: Satwal (Table 1). These soils fall into twoclimatic zones, high and medium rainfall, of the Pothwarregion. Soil sampling was carried out during the months ofSeptember and October, 2004. At the time of sampling, most ofthe sampling fields were kept fallow in order to conservemoisture for the winter crops. The moisture content in most ofthe soils was below the field capacity as sampling was carriedout during the dry period following the summer rains. Informa-tion about the sampling area, soil series, soil type and parentmaterial is given in Table 1. Quadruplicate soil samples weretaken from two depths, i.e., 0-15 and 15-30 cm using a soilauger, transferred into polyethylene bags and brought to thelaboratory. The field moist samples were spread over thepolyethylene sheets separately, hand-picked to removestones, homogenized and stored in plastic containers untilanalysis. The mean annual temperature in the experimentalarea was 24.5 °C and the mean annual precipitation was750 mm. However, precipitation is unevenly distributed overthe year, i.e., approximately 60% in the monsoonal months ofJuly and August.
A small portion of each sample was taken, air-dried, ground,mixed thoroughly and analysed for different soil properties.The samples were analysed for texture, ECe, pH, soil organic C,total N and extractable P by methods described by Page et al.(1982); 0.15 % CaCl2 extractable SO4-S by turbidimetric method(Verma et al., 1977). The data for SO4-S were classified intofour categories, deficient (< 10 μg/g), satisfactory (11-30 μg/g),adequate (31-100 μg/g), and excessive (> 100 μg/g) asdescribed by Ahmad et al. (1994).
The relationships between plant available S content anddifferent soil properties were analysed by simple linearcorrelation and regression analysis using MS Office (Excel)package-2003 and Stat View 5.0 (SAS Inst. Inc.).
Results and DiscussionPlant available sulphur (SO4-S) status of Pothwar soils. Thedata presented in Table 2 and Fig. 1 revealed that Satwal andChakwal soils had significantly higher plant available S (SO4-S) contents, though both were statistically at par with eachother, followed by Talagang soils. Five out of fifteen soils i.e.,Missa, Rajar, Rawal, Therpal and Qazian were deficient (<10μg S/g), having 5.0 to 9.0 μg S/g at both soil depths; six soils,i.e., Basal, Qutbal, Guliana, Rawalpindi and Tirnaul, were defi-cient only at upper depth (0-15 cm), while the remaining fouri.e., Balkassar, Chakwal, Satwal and Talagang had satisfac-tory level of sulphur (10-30 μg S/g) at both the soil depths.
Overall, the average SO4-S content in soils under study was11.7 μg/g (Table 3). The minimum mean SO4-S (5.7 μg/g) wasrecorded at Qazian (Typic Torripsamments) and maximum (21.7μg/g) at Satwal (Typic Chromusterts). Though the averagevalues of SO4-S were in the satisfactory range but all the soilsof Attock district and most of the Rawalpindi district weredeficient in sulphur, while most of the soils belonging toChakwal area, except Therpal, had sufficient S content.
The present results of study are supported by Ahmad et al.(1994) and Saleem and Davide (1987) who attributed low S insoils of rainfed areas of Pakistan to leaching losses and no
Table 1. Parent material, climate and cropping pattern and texture of soils of Pothwar region
Soil series Area Climate Parent material Textural class Soil classification
water; many lysimeter studies had shown that more leachingof SO4 occurred in fallow than cropped soils and it was mini-mum during growing period of crop (Shepherd and Bennett,1998; Kirchmann et al., 1996).
Lower S content in the upper depth as compared to the lowerdepth in all the soils might be due to eluviations or leaching ofSO4 from the upper part of the soil to lower depths particularlyin the well drained soils under high rainfall conditions(Rawalpindi area). Havlin et al. (2004) advocated less than10% of the total S in surface soil.
Relationships between plant available S (SO4-S) and soil prop-erties. The simple linear correlation and regression analysishighlighting the pattern of association among SO4-S and othersoil characteristics are presented in Table 3 and 4, Fig. 2 and 8are discussed as under:
The particle size analysis and textural classes of the soil understudy, presented in Table 4, showed that soils were generallymedium to course textured. Sandy loam and silt loam were thedominant textural classes with relatively high amounts ofsand and silt. Soil SO4-S exhibited positive correlation withsilt (r = 0.001) and clay (r = 0.77**) and negative correlation(r = -0.41) with sand particles of the soils under study (Fig. 2and 3). These results are supported by Tiwari and Sakal (2002).The highly significant and strong correlation (r = 0.77**)between SO4-S and clay, indicated that amount of clay contri-butes to the soil S because it might adsorb SO4 strongly, ascompared to silt and sand fractions. Solomon et al. (2001)reported 1.5-2.0 times greater amount of inorganic S in theclay as compared to silt separates in soils. SO4 adsorbed toclay is subsequently slowly released to soil solution thuspreventing SO4 leaching losses from the surface soils (Scherer,2001), while, high sand contents in soil might encourage leach-ing losses of SO4 due to their low adsorption capacity.
Strong positively correlation (r = 0.77**) between SO4-S andECe indicated that S in soil increased as ECe increased. Thefact is that ECe is related to the concentration of solublecation and anions present in soil; so, increase in anions likeSO4 increases ECe of the soil. Similar relationships were alsoreported by Ghosh and Agrawal (2005) and Tiwari and Sakal(2002) in Indian soils. Sulphur exhibited negative correlation(r = -0.49) with soil pH; it decreased as pH increased (Fig. 4).These results are supported by the studies of Bandyopadhyayand Chattopadhyay (2000). The alkaline (pH 8.0-8.5) andcalcareous nature of Pothwar soils might encourage theadsorption of cations on exchange sites and as a result, an-ions like SO4 are subsequently released into the soil solutionwhere, it might be leached with downward percolating waterin well drained soils of the area.
Table 2. Plant available S (SO4-S) in Pothwar soils
Means followed by the same letter (s) are not significantly different(P<0.05; DMR test)
addition of S by the canal/ tubewell waters. The crop produc-tion Pothwar area depends on rainfall, therefore, the soils didnot receive any S from canal/ tubewell waters, except what-ever, little is present in rainwater as compared to irrigatedareas where, canal and tubewell water add considerable amountof S to soils (Bhatti, 1980). The soils of this area remain fallowduring heavy summer rains (monsoon) in order to conservemoisture for subsequent crop that might also increase leach-ing losses of SO4
to deeper depths with rapidly percolating
Rizwan Khalid et al.
Fig. 1. Plant available sulphur (SO4-S) content in soils ofPothwar plateau, Punjab, Pakistan.
0-15 cm15-30 cm
SO4-S
μg/
g
25
20
15
10
5
0
0-15 cm 15-30 cm
Basal
Missa
Qutbal
Rajar
Balkas
sar
Chakw
al
Talag
ang
Therpa
l
Satwal
Guliana
Kahutta
Qazian
Rawal
Rawalp
indi
Tirnau
l
Soil series
The soils of Pothwar plateau inherited CaCO3 contents fromtheir parent materials because most soils have originated fromfine grained loess material containing calcite. The significantnegative correlation (r = -0.60*) of S with CaCO3 indicated thatSO4 in calcareous soil (Fig. 5) may form insoluble compoundswith CaCO3 and become less available. These results are inline with those of Havlin et al. (2004) and Trivedi et al. (2000).
Strong positive correlation (r = 0.82**) between SO4-S andorganic C exhibited the importance of organic C to S availa-bility in soil (Fig. 6). However, the low (<5.0 mg/g) organic Ccontent (Table 2) with little addition of farmyard manure (FYM)and no recycling of crop residues in the soils under studyindicated that the amount of S generated from this sourcecannot be appreciable. These results support other findings(Hedge and Murthy, 2005; Srinivasarao et al., 2004; Trivedi etal., 2000; Ahmad et al., 1994). Since S is an integral constitu-ent of soil organic matter, the enrichment with S generallydetermines the S supplying capacity of soils. In the fifteensoil series analysed, C:S ratio showed much variations (Table 2)
Table 3. Physicochemical characteristics of soils of Pothwar*
Soil Sand Silt Clay ECe pH CaCO3 SOC TN EP SO4-S C:S N:Sseries (%) (%) (%) dS/m (g/100 g) (g/100 g) (g/100 g) (μg/g) (μg/g) ratio ratio
*=average of two soil depths 0-15 and 15-30 cm; SOC = soil organic carbon; C:S = carbon:sulphur ratio; TN = total nitrogen; N:S = nitrogen :sulphur ratio; EP = extractable-P
Plant Available Sulphur in Soil
Table 4. Relationship between soil characteristics (x) and SO4-Scontents (y) in different soil types of Pothwar (n =15)
Soil r Regression R2
characteristics equations
Sand - 0.41 y = 21.20 - 0.20x 0.17
Silt 0.00 y = 11.70 + 0.00x 0.00
Clay 0.77** y = - 0.30 + 0.75x 0.60
E Ce 0.77** y = - 5.90 + 42.46x 0.59
pH - 0.49 y = 131.42 -15.28x 0.25
CaCO3 - 0.60* y = 19.20 -1.06x 0.36
Organic C 0.82** y = - 7.80+ 6.63x 0.67
Total N 0.88** y = - 12.65 + 81.65x 0.77
Extractable P 0.72** y = 8.21- 4.02 x 0.52
r=simple linear correlation coefficient; R2=multiple reg. coefficientof determination; *=significant at P=0.05 (> 0.52); **=highly sig-nificant at P=0.01(> 0.64)
Rizwan Khalid et al.
and ranged from 165 to 38 1; the lowest was observed in Talagang while, the highest was recoded in Rawal soil.
The C:S ratio (with respect to the C levels) tend to be more variable; it has been reported in the range of 143: 1 in alkaline soils of Oregon, USA (White, 2005); 92: 1 in Eastern Australia (Havlin et a/., 2004) and 100: 1.2 in Alfisols of India (Sharma and Jaggi, 200 1). However, the C:S ratio of 100: 1 was described as a reasonable representative by Brady and Weil (2002). The rather wide C:S ratios in all soils under study suggested that these soils contained less proportion of both organic C and S contents.
Sulphur exhibited highly significant positive correlation with N (r = 0.88**) and P (r = 0.72**) in soils under study. Sulphur
Fig. 2. Correlation between SO,-S and sand fraction.
0 0 5 15 25 35
Clay (%)
Fig. 3. Correlation between SO,-S and clay fraction.
Soil pH
Fig. 4. Correlation between SO,-S and pH.
CaCO, (g1100g)
Fig. 5. Correlation between SO,-S and CaCO,.
Fig. 6. Correlation between SO,-S and total organic C.
Total N (mglg)
Fig. 7. Correlation between SO,-S and total N.
0 1 I I 3.0 4.0 5.0 6.0 7.0 8.0
Extractable P (pglg)
Fig. 8. Correlation between SO,-S and extractable P.
in soil decreased as NP concentration decreased (Fig. 7 and8). It may be due to coarse texture and calcareous nature ofPothwar soils, which caused low availability of these plantnutrients. The high N:S ratios (Table 3) in the soils might bedue to more use of N fertilizers like urea in the soils. Farmers ofPothwar region practice low agricultural input because of un-certainty of rainfall; N alone accounted 90 percent of the totalconsump-tion of all the three major nutrients (NPK) inRawalpindi area during 2004-05 (NFDC, 2005). Application ofhigh rates of N fertilizer on marginally S deficient soils canresult in faster depletion of S from the soil, with little or noincrease in the yield (Malhi and Gill, 2002). Maximum rapeseedyield responses to N and S were observed only when theavailability of N and S was in approximate balance (7:1).
Sulphur and P both form insoluble compounds in the presenceof CaCO3 in the soil and get converted into insoluble fractionsin alkaline calcareous soils at higher soil pH. Similar resultswere reported by earlier workers (Ghosh and Agrawal, 2005;Kaistha et al., 2002) in case of Indian soils.
Overall influence of soil characteristics on SO4-S availabilityare presented through regression analysis and equations(Table 4) while, the corresponding relations are presented inFig. 2-8. It indicated that effect of all the parameters on soil Swas not similar (P<0.05). Some soil characteristics had moreinfluence on plant available S than others. Higher coefficientof determination values (R2 >50) for clay content, ECe, organicC, N and P depicted close association of these characteristicswith SO4-S, while, sand content, soil pH and CaCO3 had lessimpact (R2 < 50) on soil S content. Higher association of claycontent (R2= 59) to soil S as compared to sand (R2 = 17) indi-cated presence of clay to be more important for adsorptionand availability of S than other soil fractions. However, amongall soil characteristics, organic C and N had the most pro-nounced effect (R2> 65) on S availability which emphasizedthe importance of organic C to plant nutrients availability par-ticularly S. Therefore, to get better yields of crops particularlyoilseed in Pothwar soil, management of organic C is veryimportant through crop residue incorporation and FYMaddition.
ConclusionThe results revealed that majority of soils in Pothwar weredeficient in plant available sulphur. All the soils of Attockdistrict and most of the Rawalpindi district were found to bedeficient while, most soils of Chakwal area had sufficient plantavailable S content. The problem was found very prominentin areas with light textured soils, low organic matters and undermedium to high rainfall conditions, which might encourageleaching losses of SO4-S to lower soil depths. A significant,
positive relationship between organic C content and SO4-Scontents suggested that organic matter content inspite ofbeing low, may have contributed to the increase in S availa-bility in soil.
ReferencesAhmad, N., Saleem, M. T., Rashid, M., Jalil, A. 1994. Sulfur
Status and Crop Response in Pakistan Soils, Publi-cation No.7/94, National Fertilizer Development Center,Planning and Development Division, Islamabad, Pakistan.
Ahmed, N., Rashid, M. 2003. Fertilizer Use in Pakistan, 138 p.,National Fertilizer Development Center, Planning andDevelopment Division, Islamabad,Pakistan.
Ali, S., Schwenke, G. D., Peoples, M. B., Scott, J.F., Herridge,D.F. 2002. Nitrogen, yield and economic benefits of sum-mer legumes for wheat production in rainfed northernPakistan. Pakistan Journal of Agronomy 1: 15-19.
Bandyopadhayay, P.K., Chattopadhyay, G. N. 2000. Availa-bility of boron and sulphur and their nutrition of rape-seed plants in alfisols of West Bengal. Journal ofInteracademicia 4: 67-72.
Bhatti, M. H. 1980. Quality of water of different qualities re-quired to grow successful arable crops and keep a healthysalt balance in the soil. Annual Report for 1979-1980,Punjab Agricultural Research Institute, Faisalabad,Pakistan.
Brady, N. C., Weil, R. R. 2002. The Nature and Properties ofSoils, pp. 573-589, 13th edition, Pearson Education Inc.,Singapore.
Ghosh, A.K., Agrawal, H. P. 2005. Distribution and criticallimits of sulfur for chickpea cultivation in inceptisols ofVaranasi District of Uttar Pradesh. Environment Econo-mics 23: 635-639.
Havlin, John, L., Beaton, J. D., Tisdale, S. L., Nelson, W. L.2004. Soil Fertility and Fertilizers: An Introduction toNutrient Management, 515 p., 7th edition, Pearson Edu-cation Inc., Singapore.
Hegde, D.M., Murthy, I. Y. L. N. 2005. Management of second-ary nutrients. Achievements and Challenges. IndianJournal of Fertilizer 1: 93-110.
Kaistha, B. P., Kumar, Pushpinder, Dubey, Y. P. 2002. Forms ofsulfur and their relationships with soil properties in somegobhi sarson (Brassica napus) growing soils of N.W.Himalayas. Himachal Journal of Agricultural Research28: 13-19.
Kirchmann, H., Pichlmayer, F., Gerzabek, M.H. 1996. Sulfurbalances and sulfur-34 abundance in a long term fertilizerexperiment. Soil Sciences Society of American Journal60: 174-178.
89Plant Available Sulphur in Soil
Malhi, S. S., Gill, K. S. 2002. Effectiveness of sulphate-Sfertilization at different growth stages for yield, seedquality and S uptake of canola. Canadian Journal ofPlant Science 82: 665-674.
NFDC, 2005. Annual Fertilizer Review 2004-05, NationalFertilizer Development Center, Planning and DevelopmentDivision, Islamabad, Pakistan.
Page, A. L., Miller, R. H., Keeney, D. R. 1982. Methods of SoilAnalysis Part II, Chemical and Microbiological Proper-ties, 2nd edition, American Society of Agronomy Mono-graph No.9, Madison, Wisconsin, USA.
Rashid, M., Ishaq, M., Saeed, M. 1995. Sulfur status of soilsand plants in Punjab province of Pakistan. Sulphur inAgriculture 19: 48-53.
Saleem, M. T., Davide, J. G. 1987. Sulfur balance in Pakistanisoils. Sulphur in Agriculture 11: 6-11.
Scherer, W.H. 2001. Sulphur in crop production-Invited paper.European Journal of Agronomy 14: 81-111.
Sharma, R. K., Jaggi, R. C. 2001. Relationships of forms andavailability indices of sulfur with properties of soils ofKangra, Himachal Pradesh. Journal of Indian Society ofSoil Science. 49: 698-702.
Shepherd, M. A., Bennett, G. 1998. Nutrient leaching lossesfrom a sandy soil in lysimeters. Communication in SoilSciences and Plant Analysis 29: 931-946.
Solomon, D., Lehmann, J., Tekalign, M., Fritzsche, F., Zech,
W. 2001. Sulfur fractions in particle-size separates of thesub-humid Ethiopian highlands as influenced by land usechanges. Geoderma 102: 41-59.
Soil Survey of Pakistan. 1967. Reconnaissance Soil SurveyReport of Rawalpindi Area, Soil Survey of Pakistan,Lahore, Pakistan.
Soil Survey of Pakistan. 1971. Reconnaissance Soil Survey ofCampbellpur, Soil Survey of Pakistan, Lahore, Pakistan.
Srinivasarao, C., Ganeshamurthy, A. N., Masood, A., Singh,R.N., Singh, K.K. 2004. Sulfur availability and responseof mungbean and urdbean to sulfur on different soil typesof pulse growing regions of India. Communications in SoilScience and Plant Analysis 35: 1211-1212 and 1713-1723.
Tiwari, S., Sakal, R. 2002. Extractability of soil sulfur in relationto certain soil properties and plant parameters. Annals ofAgricultural Research 23: 146-154.
Trivedi, S.K., Bansal, K. N., Tomar R. A. S., Verma, R. S. 2000.Vertical distribution of forms of sulfur in some profiles ofMorena and Bhind districts of Madhya Pradesh. Journalof Indian Society of Soil Sciences 48: 238-241.
Verma, B. C., Swaminathan, K., Sud, K.C. 1977. An improvedturbidimetric procedure for determination of sulphate inplants and soils. Talanta 24: 49-50.
White, R.E. 2005. Principles and Practice of Soil Science:The Soil as a Natural Resource, pp. 211-213, 4th edition,Blackwell Publishing, Oxford, UK.
90 Rizwan Khalid et al.
A Weak Current Amperometric Technique in Physiological andBioelectromagnetic Measurements
Masroor Hussain Shah Bukhariab*, John H. Miller Jr.a and Zahoor Hussain Shahc
aDepartment of Physics, University of Houston, Houston, Texas 77204, USAbUnit of Experimental Physiology and Biophysics, Department of Physiology, Dow University of
Health Sciences, Karachi-74200, PakistancDepartment of Chemistry, Faculty of Marine Sciences, Lasbela University, Uthal, Lasbela 90150, Balochistan, Pakistan
(received January 5, 2009; revised March 3, 2009; accepted March 4, 2009)
Abstract. A technique for measuring ultra-low electric currents from living cells, using electrodes, biosensors or magneticdetectors is reported, based on the design of a sensitive, ultra-low-noise trans-impedance amplifier. This technique offersa low-noise, low current measurement capability down on the order of 2 x 10-14 amperes, with specifications such as inputleakage current of less than 1 x 10-15 amperes and a dynamic range of 30-100 x 10-14 amperes. Maximum bandwidth ofroughly 10KHz was observed, while working in the specified dynamic range. This set of specifications is quite satisfactoryand desirable for many low-frequency applications in bioelectromagnetism and bio-amperometry. The technique findsnumerous applications in studying intrinsic cellular fields and induced currents originated in cells under physiologicalconditions. A few applications envisaged for its possible utility include bio-sensing amperometry, general studies inbioelectromagnetism and ion transport studies in plasma membrane and mitochondrial inner membrane, by incorporationof the amplifier with suitable micro-electrodes or nano-scale electrical, magnetic or optical sensors.
IntroductionA large number of important measurement applications inexperimental physiology and biophysics, such as living cellbioelectromagnetism, weak current amperometry and bio-sensing with the help of embedded nanotechnology, requireextremely sensitive and ultra-low-noise current measurementtechniques, which can measure tiny currents at the levels ofpico-amperes to femto-amperes. These measurements aretypically made with micro-electrodes, quantum devices anddetectors, and low-temperature cryogenic superconductingquantum interference device (SQUID) detectors, or SQUID-based nanotubes (Cleuziou et al., 2006). Various electrophysio-logical studies with ion channels (Hamill et al., 1981) or inves-tigations on intrinsic currents (Axmacher and Miles, 2004) orweak electrical field processes within living cells (Bullock, 1997)also require sensitive instrumentation and amplification at thelevel of femto-amperes to pico-amperes input current.Pico-ampere amplifiers are widely available and can be easilyfabricated on an electronics workbench in a physiologicallaboratory. Unfortunately, techniques to measure ultra-low-current (such as on the level of femto-amperes) cellularsignals with least noise susceptibility are neither easy to
develop nor widely available in market, in view of the specialdesign and fabrication considerations required for theirdevelopment. The main impediments faced in such designsare leakage of tiny input bias currents through the amplifiercircuitry and the inherent large noise associated withmeasurement of ultra-low currents. With the help of specialdesign and fabrication measures, one can venture down to anorder of about 2-10 femto-amperes (with considerable noisereduction), while keeping the leakage current to a minimumextent, not affecting the measurement in a significant way.Going beyond that domain becomes an impervious task forin-house development, as at first, there are no general-purpose operational amplifiers available in market which cansense lower bias currents beyond that range, and secondly,various terrestrial and celestial effects (such as ambientelectromagnetic fields in the vicinity and cosmic ray–inducedelectron shower events) induce tiny currents in the front-endsection of the amplifier, creating unavoidable currentleakages.
Industrial-grade commercial pico- and femto-ampere measure-ment instruments are available in market, but unfortunatelythey are an expensive modality and beyond the range ofbudgets of small biophysics and physiology laboratories,
91
Technology
especially in colleges with limited budgets. Buying a commer-cial product off-the-shelf also precludes the experimenters frommaking alteration or customization in the device, in view oftheir specific applications. A small-scale biophysical or physio-logical research laboratory has to thus rely on in-housedesigns.
There are some public-domain designs available for low-levelbiological signal voltage and current amplifiers, as publishedextensively in literature, such as instrumentation amplifiersand pico-ampere electrometers for physiological applications,but there are a number of problems with these designs. Firstof all, most of the designs are for voltage mode meters.Secondly, if there are few current amplifier designs published,they are limited to nano-amperes or pico-amperes range, notpresenting a design which can venture down to femto-amperes. These design ideas also pose limitations in terms ofkeeping the signal integrity conserved. Most importantly, thesedesigns do not present special considerations and techniquesentailed to measure ultra-low-level signals, while limiting theleakage currents and inherent noise which are coupled tosmall-current measurements. Thus, availability of a meredesign, such as by an amplifier chip’s manufacturer speci-fications sheet, is not sufficient to implement it in practicalapplication.
In a biophysical study by authors to investigate the possibilityand manifestations of intrinsic electric currents and endo-genous electromagnetic fields in living cell systems, it wasundertaken to design and fabricate a sensitive current tovoltage converting amplifier which could successfully andefficiently present a practical design of an ultra-low-currentand ultra-low-noise trans-impedance amplifier.
The design of this technique and its constituent amplifierdiffers from other conventional techniques and amplifiers in anumber of ways. First of all, it presents a design paradigmwhich can venture down to a few tens of femto-amperes, whileminimizing the leakage current and noise, with the help of itscareful choice of components and special considerationsfollowed during the fabrication of the device. Secondly,instead of just showing a way to measure the induced fieldcurrents from applied potentials, it presents a technique forlow-current measurement from the living cells, which attemptsto measure low-frequency intrinsic electric fields and inducedfemto-ampere currents, produced as a result of intrinsiceffects inherent within the cell plasma membrane. This is donein an electromagnetically shielded environment and in theabsence of applied fields. Third, the amplifier and measure-ment technique can be developed in a small laboratory with avery limited budget, costing even less than the cost of anaverage digital multimeter (DMM).
This technique offers an enhanced accuracy in cell ampero-metry or bioelectromagnetism studies by the virtue of animprovement in its meticulous design and development.Design of the amplifier is made on a special glass fiber boardinstead of a conventional printed circuit board (PCB) andcomponents (including the amplifier integrated circuits) aremounted on teflon stand-offs using special considerations,as summarized in the next section. Noise susceptibility andcurrent leakage paths are kept to a very minimum. Usage ismade of some of the most precision components available inmarket, conserving the precision and signal integrity. Theoperational amplifier device used in this design, NationalLMP7721, has a few excellent specifications, especially thelarge error rejection capabilities due to the use of giga-ohmvalue feedback resistances, incorporated in the design. Theconstructed amplifier prototype is enclosed in a shieldedminiature aluminum box and mounted on the micro-manipula-tor arm on the microscope stage, and the input of the amplifieris directly connected to the cell electrode via a short 90μ wire,without using any cable or connector. This eliminates the noiseand signal losses in the cable communicating the signal fromcells to the amplifier and to the data acquisition stage. Thus,adoption of special measures and extensive trials haveresulted into a design which has lower current measurementrange and higher accuracy and precision in terms of measure-ment and signal integrity, as compared to other designsdescribed in the literature.
Materials and MethodsAmplifier design. The design of the amplifier comprises oftwo stages and is built around a recently-introduced preci-sion operational amplifier IC (integrated circuit), national semi-conductors LMP7721. The design reported in this paper isbased on meticulous modification of a basic design as per themanufacturer’s specifications (National Semiconductors,2008). This device is an ultra-low-noise, ultra-low input biascurrent, operational amplifier, manufactured with metal oxidesilicon (MOS) technology input stage. It has one of thelowest input bias current operations available in the market,guaranteed by manufacturer after extensive testing at around3 x 10-15A. Moreover, it offers superior noise performance,tested by manufacturer at 10fA-Hz-1/2 @ 1KHz and 7nV-Hz-1/2
@ 1KHz input-referred current and voltage noise, respectively,and a total harmonic distortion (THD) of 0.003% @ 1KHz, asclaimed by the manufacturer. Its one of the most importantfeatures is curtailing of the magnitude of error produced whenused with a large-value resistance, such as giga-ohms. It sup-presses the large error by a factor of about 103 to 106, a greatadvantage in femto-ampere level current measurement usinga high-value feedback resistor. This is a major advantage of
92 Masroor Hussain Shah Bukhari et al.
this device, which became the reason for our choosing itsutility in this application, in addition to its low bias currentand low noise spectral density. In addition, a theoretical (open-loop) gain bandwidth product (GBP) of 17MHz and averageslow rate of around 10.0V/μs, as claimed in the manufacturer’sspecifications for LMP7721 in its data sheet (National Semi-conductors, 2008) are appropriate for application in electro-physiology and general biophysics (although, it should benoted that, practically, the theoretical GBP described above isneither achievable in an ultra-low current amplifier design norit is applicable in the design presented here).
Design of the amplifier is illustrated in the circuit diagram inFig. 1. The first stage comprises a unity gain current to volt-age amplifier with a zero-resistance front-end, followed by thesecond stage, with approximate gain of twenty invertingamplifier. The input signal is presented via a 50 GΩ InputResistor to the inverting input of U1, LMP7721 device. ThisResistor is only used for testing purposes to measure theminimum current readable by the amplifier. Once the amplifieris tested, this resistor is removed, enabling a direct zero-resistance connection between the input terminal and theamplifier. A precision resistor of 50 GΩ is connected as theFeedback Resistor to provide roughly 1010 current/voltage
transfer function. However, the voltage gain of the amplifierremains unity.
Output from the current/voltage pre-amplifier is passed on toa second amplification stage, comprising of the U2 (LMP7721)via C3, which removes the DC voltage presented at the out-put of U1 from the input current. U2 has a feedback resistor,R3, which can be of any value close to around 1 MΩ (anoptimal value for our application was found to be 997 KΩ),however, a resistance higher than 1.1 MΩ was found to beunsatisfactory. This stage yields a voltage gain of roughlyx10 to x40 for the second amplifier (depending on the value ofR3). Capacitor C5 prevents coupling of the amplifier to mainsnoise and also acts as a pseudo-cut-off for the high frequencycontent of input signal. A successive power supply filteringscheme is adopted for the amplifier power rails by means ofnumerous 10 nF and 100 nF capacitors at the power rail em-ployed in the circuit. In addition, a notch filter design can alsobe devised at this stage for elimination of mains and high-frequency noise components. However, we did not implementit in order to conserve the original signal, as entailed in ourapplication.
Construction. After the design, a number of prototypes of theamplifier were fabricated to achieve the optimal performance
Fig. 1. A schematic diagram of the amplifier circuit.
93
X
+2.5 V
C1100 nF
R250 GΩ
C<0.5 pF
#
6
8
4
1
-
+
INPUT
J1
C4100 nF
C3100 nF
*
+2.5V
6
8
4
C52 pF
R3997 KΩ
U2LMP7721MA
OUTPUT*
**R150GΩ 3 U1
LMP7721MA
C2100 nF
J2
C6100 nF
+2.5 V
3
+2.5 V
+2.5 VJ3
4.7μF+
L180 μH
+2.5 V
10 nF150 nFC7-C9
+2.5VJ4
4.7 μF+
L280 μH
-2.5 V
10 nF150 nF
R1.For testingpurposes
only
**
Hermetically-sealed
glass enclosureresistor
(or a 0.5 pF capacitor for testing)
*
-
+
A Weak Current Amperometric Technique
and operation on the order of 5 to 100 femto-amperes. Thedevice was tested with various time-domain and frequency-domain (spectrum analysis) methods used in a usualelectronic workbench setup. The input current was calculatedusing voltage method, by utilizing Ohm’s law. Alternatively, alock-in amplifier could also be employed for this purpose. Asinusoidal low-voltage AC signal from agilent waveformgenerator 33220 A (Agilent, Santa Clara, CA) at variousfrequencies and amplitudes was applied to the amplifier’sinput via the 50 GΩ resistor. Response was recorded onStanford SR-760 spectrum analyzer (Stanford Instruments,Stanford, CA). For instance, spectrum analyzer showed asignal of 1.000 KHz at 1.2 mV corresponding to a 1KHz, 0.1 mVinput signal at the front-end of amplifier, demonstrating a totalvoltage gain of 12 from both stages (U1 and U2). Using Ohm’slaw, this input voltage, on the order of ~0.1 mV across the 50GΩ resistor, yielded an input current of around 2 fA, whichseemed to be the lowest current recorded by means of thisamplifier. However, there was a substantial degradation of itsperformance in terms of noise. After extensive trials and re-calculation of component values and replacement by cleancomponents, the lowest level recorded was about 20 to 30 fA,with a substantial reduction in the noise and leakage current.We take the average of this range, 25 fA, as the lowest currentmeasured. The leakage current, after various trials andimprovements on the construction of initial two prototypes,was recorded at about 1 fA. This leakage current is extremelysmall and impossible to be eliminated in any realistic practicaldesign, owing to minute leakage pathways and cosmic rayshower-induced discharges. This seems to be a reasonablespecification and ceiling of amplifier’s capabilities, and suffi-cient for the measurement capabilities of the amplifier in theenvisaged applications.
Significant measures were taken to minimize the current leak-age and noise from the amplifier. These included, fabricationof the amplifier on a glass polyester printed circuit board (PCB),use of hermetically-sealed vacuum glass enclosure resistors(Micro-ohm Corp., Duarte, CA), suspension of the I.C. in airand contact via 120 μ Au-plated Cu wires enclosed in Teflonstand-offs, inverting input pin of I.C. (pin #2) and the 50 GΩfront-end resistor suspended in air with no connections toPCB and shielded with a grounded copper mesh, a groundedtight metal enclosure mounted a few centimeters from the cellssample holder, and power supply provision by batteries. Asignificant reduction in mains noise amplitude was observedby operation of the device in a (sufficiently) electromagneti-cally shielded faraday cage.
For optimal amplifier operation, it is recommended to use aregulated ±5 or 6 volts supply (even with the battery power).
This power supply, based on LM7805 and LM7905 series regu-lators, was added to the prototype in last stages of testing,following observation of minor fluctuations in battery power(especially after prolonged burn-in hours). In addition, caremust be taken not to exceed the Op-Amp’s quite stringentinput voltage and current limits (National Semiconductor, 2008).
For operation in the required femto-ampere dynamic range, itis extremely essential that the unit is clean and free of anydeposition or contamination, especially the surface on theOp-Amp package, the Giga-ohm feedback resistor and thePCB contacts. Even traces of microscopic dust on fingertipsduring manual work can affect the leakage through the I.C. orthese resistors. After fabrication, unit was washed with asolution of diluted ethyl alcohol (C2H5OH), wiped dry withhigh-pressure clean air and then treated in an ultrasonic bath,so as to eliminate any possible residue from the fabricationstages.
Response was also recorded and analyzed on a computer bymeans of a data acquisition (DAQ) system by IOtech (IOTechCorp., Cleveland, OH), using customized fast fourier trans-form (FFT)-based spectrum analysis routines written innational instruments labview 8.2 software (National Instru-ments Corp., Austin, TX).
Application in bioelectromagnetism and cellularamperometry. Amplifier design was used in the application ofa bioelectromagnetism and amperometry technique devisedby us to detect minute intrinsic cellular currents induced byunderlying physiological processes and applied electric fieldswithin and around the cell plasma membrane, using a buddingyeast (Saccharomyces cerevisiae) cell model. An overview ofthe experiment is illustrated in Fig. 2, which is in essence amicroelectrode current measurement technique. The amplifierprototype was mounted on a micro-manipulator device (Nikon,Kyoto) on an inverted microscope stage, with its input con-nected to a 99.9% 75 μ gold wire (Chemtel Chemicals Corp.,NJ) electrode immersed in a sample of cells contained in amini-petri dish.
A strain of wild-type Saccharomyces cerevisiae S288C (ATCC26108), provided by Widger Labs at the Department ofBiology and Biochemistry, the University of Houston, waspreserved at 4 ºC in an autoclaved YPD agar medium. Cellswere grown at a temperature of 29 ºC with agitation (160 rpm)in YPD (1% yeast extract, 2% peptone and 2% dextrose).Detailed materials and methods of growing and preparation ofthe cells and preparation of YPD medium are well-known(Wright and Philipsen, 1991). The main buffer used in thestudy was phosphate buffered saline (PBS) (Roche Corp.,Indianapolis, IN). A solution was prepared with deionized water
94 Masroor Hussain Shah Bukhari et al.
passed through a milliQ system (Millipore, Billerica, MA),the resistivity of which was measured at 17.8 mV-cm.
It was assured that the experiments were conducted in aero-bic conditions, by means of a static aeration through anexternal air supply through the sides of the reactor cellvessels. Oxygen concentration in the reactor was monitoredwith digimed oxygen concentration monitor (Digimed, Tampa,FL). Acidity changes due to electrical fields were measuredwith a standard pH meter (Cole-Palmer, Vernon Hills, IL); how-ever, no significant changes in pH were observed. The experi-ments were carried out at room temperature, maintained at20.5 oC.
For intrinsic field studies, experiments involved no externalelectrical fields application to the cells. Signal was picked upin a shielded environment from a micropipette making contactwith the cell plasma membrane. However, for measuring theexternal field-induced response and in the application of di-electric spectroscopy (Miller et al., 2005), time-dependent elec-tric fields of varying frequencies from 100 Hz to 10 KHz wereused, by obtaining an external AC signal from the waveformgenerator. An external field source electrode was immersed inthe cells sample holder, in the form of a three-probe mode,common ground electrode (Woodward and Kell, 1991), or four-probe mode, individual grounds (Miller et al., 2005), creatinga uniform electric field in the sample holder. Magnitude of theapplied voltage was varied between 0.5 Vp-p to 3.0 Vp-p.Fig. 3 illustrates a block schematic of the three-probe method,
designed around two main electrodes, one sensing electrodeand the other applied field electrode, and one common ground.
Results and DiscussionResponse was quite satisfactory as expected from the manu-facturer specifications for LMP7721. Minuscule currents atthe level of a few tens of femto-amperes could be measuredwith low noise content in our experiments. The design of thechip indeed demonstrated a conspicuous suppression in noiseeven in the presence of a large value resistor, yielding an RMSvoltage noise at the level of a few hundred microvolts (around250 μV on an average), unlike hundreds of millivolts usingany other operational amplifier. The noise voltage and currentspectral densities of the amplifier, on the order of about 10nV-Hz-1/2 (±2n V/Hz1/2) and 35fA-Hz-1/2 (±5 fA/Hz1/2), respectively,at 1.0 KHz. limit, seemed to comply well with the manufac-turer-tested LMP7721 specifications of 10 fA-Hz-1/2 @ 1 KHzand 7n V-Hz-1/2 @ 1 KHz input-referred current and voltagenoise, respectively, as reported by the manufacturer in thedevice data sheet. There is room for improvement and meet-ing manufacturer’s lowest limits by improving the finesse ofprototype’s fabrication. There were some noise harmonics seenwith floating inputs, however their amplitudes reduced con-spicuously in the presence of an input signal or connection tothe electrodes, as seen in the Fig. 4, which depicts recordingof a 3 fA event at the input terminals (the least input biascurrent limit allowed by the LMP7721 device) corresponding
Fig. 2. An overview of the experiment to measure intrinsic elec-tric fields as produced in cultured yeast cells as a resultof various physiological processes.
Fig. 3. A block schematic of the three-probe (two input/outputelectrodes and the third common ground) dielectric spec-troscopy experiment to measure induced currents pro-duced in cultured yeast cells as a result of applied time-varying electric fields. TDA stands for Time-DomainAnalysis and FFTA for Fast Fourier Transform Analy-sis (spectrum analysis).
Transimpedance current amplifiershielded box mounted on the
micro-manipulator dock
BNC connectorBNC
connector Micro-manipulator
75μ 99.9%Auelectrode wire
MicropipetteGlass capillary
Referenceelectrode(ground)
Cell bioreactor oninverted microscope stage
to a 0.14 mV, 1 kHz input signal. But at this level, there was alarge noise component in the signal. After extensive trials, areasonable performance, in terms of the least noise, wasobtained at an input current level of average 25 fA, which weclaim as the lowest current limit of measured input current,using this amplifier.
The bandwidth of amplifier seemed to be satisfactory till 9.8KHz before a substantial signal-to-noise ratio degradation isobserved. After further development of the amplifier, this limi-tation on frequency range could be improved.
The transfer function or the trans-impedance gain of the front-end amplifier is calculated using the relationship of outputvoltage to input current in an inverting amplifier, as follows:
Vout = - Iin x RF ...............................................................(1)
With an input current of 30 fA and a feedback resistor value of50 GΩ, as used in this design, a value of 1.5 mV output voltageis determined. This seems to be the maximum magnitude ofthe obtained voltage, with low noise susceptibility, corre-sponding to a low-current on the order of few tens of femto-amperes which can be measured with the front-end stage.After signal conditioning through the second-stage amplifier,this is amplified about ten-fold and one can obtain few tens ofmilli-volts from the constructed prototype while measuring anultra-low-current. Typically, the range of obtained voltageamplified from a cellular intrinsic signal is 0-20 mV, correspond-ing to minuscule currents on the order of 1-35 fA being gener-ated within the cell plasma membrane.
The transfer ratio for the two-stage amplifier with 15 mV mea-sured output and 30 fA input current was determined to be
0.05 x 10¹² rho (or 0.05 pico-rho) using the relationship fortransfer ratio:
This transfer ratio, expressed in terms of the dimensions ofresistivity, is found to be quite high as expected, and compliesto the transfer function of the amplifier. The magnitude of thisratio, in the dimensions of resistivity, is slightly less than theresistivity of rubber and glass (Serway, 1998).
This implies that, if the minimum possible detected current,distinguishable from noise, or the minimum detected signal(MDS), of this amplifier is around 30 fA, the input electronictransduction capacity of the amplifier and this technique isto transduce an electronic pulse of approximately 18,720electrons/second (from the fact that 1 fA current involvestransport of 6242 electrons/second) with the help of a suitableinput sensor.
A number of three successive prototypes were built, beginningwith the use of another low bias current amplifier (LMC662)and a set of input and feedback resistors of 10 GΩ and utiliz-ing various configurations up to 100 GΩ, before a successfuloperation could be achieved at the input range of around5 fA-25 fA with 50 GΩ, using LMP7721. A use of resistorsabove this optimal value of 50 GΩ, such as 100 GΩ, was foundto be ineffective in decreasing the input current while keepingthe noise to a minimum value. It was found that large valueresistors (higher than 50 GΩ) are inherent with large noisesusceptibility and low SNR, as described earlier. The best valuemeasured is thus determined at a range of 20-30 fA, with mini-mum possible leakage current and high SNR.
After testing of the amplifier with spectrum analysis, itwas used in a micro-electrode-based biological experiment,incorporating a bioreactor and patch-clamp design, using goldand gold-plated-tungsten (Au-W) micro-electrodes. Aim ofthis experiment was to investigate the form and manifesta-tions of tiny currents and intrinsic noise produced by meta-bolic pathways or physiological processes in living cells andorganelles primarily in cultured wild-type Saccharomycescerevisiae (brewer’s yeast) cells in vitro. Cell membranes havebeen known to be associated with membrane noise (Verveenand DeFelice, 1981) and their intrinsic ability to amplify exter-nal electric fields. The membrane noise is beyond the thermalor white noise and in fact some form of stochastic cellularactivity, which has been termed to carry a valuable signatureof underlying physiological processes, a possibility cited byBullock in his detailed treatise (Bullock, 1997) in the realm ofneurophysiology. The technique revealed presence of a simi-
96
Fig. 4. Power plot of an amplified 1KHz at 0.14 mV AC testsignal event as recorded by the amplifier (translating to a3 fA input current recording).
0
-20
-40
-60
-80
-1000 2500 5000 7500 10000 12500 15000
Frequency (Hz)
Am
plitu
de (d
B)
Masroor Hussain Shah Bukhari et al.
A Weak Current Amperometric Technique 97
lar intrinsic noise from respiring and active yeast cells. Ampli- tudes of aerobic living cells were found to be conspicuously higher (about -70%) than dead or anaerobic cells or the phos- phate buffered saline (PBS) medium alone without cells. We measured currents ranging &om 20 fA to 55 fA from the active, respiring yeast cell membranes, induced as a result of a num- ber of processes, without any applied or ambient electric fields. The source and underlying mechanisms of these currents, which are referred as intrinsic noise, may be ion channel trans- port across the membrane or some correlations with the meta- bolic states of the cells. These possibilities are currently be- ing investigated and a few of our reports in this context are in the process of publication. Fig. 5 illustrates the sample intrin- sic electric response (amplified hundred times in this figure) from the plasma membrane of yeast cell while in its active aerobic-respiring state and under physiological conditions, as measured with this technique, and in the absence of any ambient or applied external electromagnetic fields. Fig. 6 de- picts a dielectric response (most likely from the cell plasma membrane in view of very low frequency), from an active and aerobically respiring yeast cell, in response to an applied AC field of frequency 1.2 KHz @ 1.0 V,.,, using a three-probe configuration. The effects of medium in which cells were sus- pended have been subtracted from the amplitude displayed.
One of the final amplifier prototypes, as used in testing, is illustrated with the help ofa photograph in Fig. 7, as assembled in the Biophysics Research Laboratory at the Texas Center for Superconductivity at University of Houston (TcSUH). Some of the special considerations entailed for manufacturing such amplifiers can be appreciated from the photograph.
While testing ofthe amplifier, it was revealed that amplifier is not only very sensitive to surrounding electrical and mag- netic fields, but also to external vibrations present in environ-
Tine (min.)
Fig. 5. A sample intrinsic cellular signal as measured in vitro from cell membrane of an aerobically-respiring yeast cell (x 1 00).
Ce Ikon l y response 3rd harmonic, f2
3.5 1 (medium subtracted)
2 3 4 5 6 & 7 4 .5
Frequency (KHz)
Fig. 6. A snapshot of an induced AC signal as measured from respiring yeast cells in response to an applied AC field, using three-probe method.
ment, such as acoustic vibrations from the surroundings. Electromagnetic and acoustic shielding presented themselves as mandatory requirement for the reliable measurements using this device.
It is difficult to make an accurate claim for the most minimum possible current level measured by the amplifier, in view ofthe fact that every operational amplifier is susceptible to parasitic capacitances, which affect the measurement of input current using the Ohm's law-based voltage method (by measuring the voltage across the 50 GQ resistor, as done in this study). However, the operational amplifier integrated circuit employed in this design, national semiconductor LMP772 1, guarantees a tested ultra-low-level femto-ampere operation at very low noise voltage and current densities, as reported in the abstract. Nevertheless, we have done earnest efforts in meeting the lowest possible limit of measured current, while keeping signal integrity conserved. It can be surmised that if contin-
Fig. 7. A photograph of amplifier prototype, where the fiber- glass PCB, the amplifier chip and high-resistance vacuum- sealed resistors, can be clearly seen.
ued improvements are made in the proper selection of compo-nents and careful assembling of the amplifier, as described inthis report, it could possibly result into an amplifier capable ofmeasuring a lowest possible current of 1 to 3 fA. Neverthe-less, in our study we could make measurements with currentsat the scale of around 25-30 fA at a bandwidth of 10 KHz, withsatisfactory noise suppression. This is our claimed minimuminput level of measurement, which is a reasonable lower limitand sufficient for a broad spectrum of applications in bio-physics and electrophysiology.
Although, theoretically the claimed bandwidth for LMP7721is quite high, as highlighted earlier, but our analysis of theamplifier and testing revealed the experimental bandwidthlimited to around 10 KHz. This constrains the amplifier’sapplication to its use limited to low-frequency signals regime,such as in general cell electrophysiology, low-frequency bio-logical amperometry, electroencephalography (EEG) and elec-trocardiography (ECG) etc. Modifying the design of the firststage front-end amplifier can increase the bandwidth windowmanifold, but would adversely affect the minimum current mea-surement capabilities and noise performance. A trade-off wouldbe required in the two parameters, depending on the problemat hand.
ConclusionDesign and development of a very sensitive, low-noise andlow-cost amplifier have been carried out, as reported in thispaper, which is found to work at an input current dynamicrange of ~2 x 10-14 to 1 x 10-13 amperes, with a lowest measuredcurrent limit of around 25 femto-amperes with low-noise con-tent, yielding voltage and current noise spectral densities onthe order of about 10n V-Hz-1/2 and 35 fA-Hz-1/2, respectively,at 1.0 KHz. Initial testing was done with workbench time-do-main and spectrum analysis methods. The amplifier wasincorporated in an application study by investigating itsresponse to very low current sources, such as membranecurrents and intrinsic noise in cultured living cells, as well asin recordings of minute changes in the harmonic response ofcells to applied sinusoidal electrical fields. On the basis ofthis, a technique was developed to measure ultra-lowcurrents within the living cell plasma membranes.
Another application of this amplifier and its based techniquelies in the experimental measurement of mass-transport-diffu-sion current (Taylor and Schultz, 1996) in biosensors orbioelectronic electrodes which work on the principle ofamperometric transduction of biological processes. By use ofa suitable biosensor, such as a carbon electrode, or an embed-ded field effect transistor (FET) in a constant-potential con-figuration, minuscule fluctuations in current may be detected
which are the direct measure of the rate of electron transferreaction in the diffusion layer (the region of solution inbioreactor in which the sensor/electrode is immersed). Thetechnique can be utilized in measuring the electron transportcurrent, which has a mathematical value as expressed byEquation 3.
Where F is the Faraday’s Constant, A the area of electrode, δthe thickness of diffusion layer, C concentration, D the diffu-sion coefficient and n the number of transferred electrons.
Knowing the current, one can easily deduce the diffusioncoefficient in a biological experiment. With the incorporationof this amplifier design, transduction of a weak stream of mass-transport-diffusion electrons from a biosensor can be detected,which would otherwise be difficult with conventionalamperometry techniques. This area needs investigation. Anexperiment in this direction is currently being considered byus for carrying out.
The design has great potential in its application in many areasin general biological and physiological measurement. It is ear-nestly hoped that this design will stimulate further efforts inthis direction which could bring forth improved designs ofsimilar ultra-low-level-current, ultra-low-noise and low-costamplifiers, advancing the field of measurement science andtechnology in biosensors, bioelectronics, electrophysiologyand quantum computing applications. By offering a measure-ment technique to measure non-thermal noise stochastic sig-nals, which may be rich in knowledge pertaining to underly-ing physiological processes, as suggested by Bullock (1997)in the case of neurophysiology, this technique has greatpotential to be further investigated.
AcknowledgementDevelopment and construction of the amplifier and its appli-cation in studies with yeast cells were funded by grant E-1221from the Robert A. Welch Foundation, Texas, USA. Yeastinocula were kindly provided by William Widger at theDepartment of Biology and Biochemistry, University ofHouston. Author MHSB was supported by a post-doctoralfellowship from the Texas Centre for Superconductivity at theUniversity of Houston (a public institution of the State ofTexas) where this work was carried out. Current funding ofauthor MHSB is by the Higher Education Commission ofPakistan, under the HEC SFHP (Phase III) Programme. Authorswould like to thank the Welch Foundation, State of Texas,
98 Masroor Hussain Shah Bukhari et al.
the Texas Centre for Superconductivity at the University ofHouston, and the Higher Education Commission of Pakistan,for their generous support.
ReferencesAxmacher, N., Miles, R. 2004. Intrinsic cellular currents and the
temporal precision of EPSP-action potential coupling inCA1 pyramidal cells. Journal of Physiology 555: 713-725
Bullock, T. H. 1997. Signals and signs in the nervous system:the dynamic anatomy of electrical activity is probablyinformation-rich. Proceedings of The National Academyof Sciences USA 94: 1-6.
Cleuziou, J.P., Wernsdorfer, W., Bouchiat, V., Ondarcuhu, T.Monthioux, M. 2006. Carbon nanotube superconductingquantum interference device. Nature Nanotechnology1: 53-59.
Hamill, O. P., Marty, A., Neher, E., Sakmann, B., Sigworth, F.J.1981. Improved patch-clamp techniques for high-resolu-tion current recording from cells and cell-free membranepatches. Pflügers Archiv 391: 85-100
Miller, J. H. Jr. , Nawarathna, D., Vajrala, V., Gardner, J., Widger,
W.R. 2005. Electromagnetic probes of molecular motorsin the electron transport chains of mitochondria and chlo-roplasts. Journal de Physique IV 131: 363-366.
National Semiconductors 2008. LMP7721 Data Sheet, ReleaseI, National Semiconductors Corp., Santa Clara, CA, USA.
Serway, R. A. 1998. The Principles of Physics, 2nd edition,Saunders College Publ., London, UK.
Taylor, R. F., Schultz, J. S. 1996. Handbook of Chemical andBiological Sensors, pp. 123-129, 236-243, 259-274,1st edition, CRC Press, London, UK.
Verveen, A.A., DeFelice, L. J. 1974. Membrane noise. Pro-gramme in Biophysics and Molecular Biology 28: 189-265.
Woodward, A. M., Kell, D. B. 1991. Confirmation by usingmutant strains that the membrane-bound H+-ATPaseis the major source of non-linear dielectricity inSaccharomyces cerevisiae. FEMS Microbiology Letters84: 91-96.
Wright, M. C., Philipsen, P. 1991. Replicative transformationof the filamentous fungus Ashbya gossypii with plasmidscontaining Saccharomyces cerevisiae ARS elements. Gene109: 99-105.
99A Weak Current Amperometric Technique
Pak. J. Sci. Ind. Res. 2009 52(2) 100-106
Heterologous Expression of Chaetomium thermophilumXylanase 11-A (CtX 11-A) Gene
aNational Institute for Biotechnology and Genetic Engineering (NIBGE), Faisalabad, Pakistanbc/o Wajid Arshad Abbasi, Programme Officer/IT Focal Person/PS to PM, Prime Minister Secretariat,
Muzaffarabad, Azad Kashmir, Pakistan
(received September 24, 2008; revised February 19, 2009; accepted February 23, 2009)
Abstract. Chaetomium has a potential source of xylanase and cellulase enzymes, both of which are required in thetreatment of fibre in the poultry feed. The titre of the enzymes needs to be enhanced by using recombinant DNAtechnology for fulfilling the requirement of the industries. Efforts are made to construct prokaryotic and eukaryoticexpression cassettes that can be cloned under specific strong promoters i.e., T7 and AOX1, respectively, and theenhancer elements to get the maximum gene expression. In the present study BL21 E. coli and GS115 Pichia pastorisstrains are used as model organisms to express the CtX 11-A gene in the presence of 1 mM IPTG and 100% methanolupto final concentration of 0.5. In case of BL21 expression, the maximum xylanase activity was observed after 1.5 hin the presence of 1% xylose, which was 2.302 U/ml and after 7 h in the presence of 0.5% lactose, was 1.708 U/ml.However, in Pichia pastoris the maximum production of xylanase was 2.904 and 0.006 U/ml as compared to control0.484 and 0.06 U/ml, respectively.
Keywords: thermophilic fungi, Cheatomium thermophilum xylanase A (CtXA), cloning and gene expression, Escherichiacoli, Pichia pastoris
IntroductionAmong the most abundant hemicelluloses in plant cell wallpolysaccharides, xylanase has many important applicationsin various industries such as foods, chemicals, paper, fuelsetc., (Boettner et al., 2002; Christov and Prior, 1996; Alam etal., 1994; Coughtan and Hazlewood, 1993; Wong and Saddler,1992).
Xylanases are classified into two distinct families, F/10 andG/11, of the glycoside hydrolases (Henrissat and Bairoch,1993). A number of xylanase-producing fungi and bacteriahave been isolated from a variety of sources, which have aclose relation with the characterization of the producedxylanases. Sinha et al. (2004) isolated an extremely thermo-stable xylanase from a thermophilic eubacterium. Collinset al. (2002) isolated a cold active xylanase from the antarcticbacterium Pseudoalteromonas haloplanktis. Bacillus sp.,strain AR-009, an alkaliphile from an alkaline soda lake,produced two alkaliphilic xylanases (Emami et al., 2002). Inaddition, an acidophilic xylanase was isolated from Penicil-lium sp. 40, which was screened from an acidic soil (Kimuraet al., 2000).
Production of thermostable cellulases and xylanases fromthermophilic fungi is an important industrial source for
hemi-cellulases such as glucanases, xylanases, galactanases,mannases, galactomanases and pentosanases. C. thermophilumis a thermophilic filamentous fungus that produces thermostablexylanase (Latif et al., 1995) It is frequently found in soil, air andplant debris and produces endoxylanase, Xyn11-A. Enhancedenzyme production can be achieved by isolation, characteriza-tion, cloning and expression of the genes under specific strongpromoters and enhancer elements.
In recent years, several industrial yeasts have been developedas recombinant host systems for the commercial production ofheterologous proteins. These organisms combine ease of geneticmanipulation with the ability to perform many eukaryotic post-translational modifications (Lin Cereghino et al., 2002). One ofthe most commonly used systems is the methylotrophic yeastPichia pastoris, in which expression is driven by one of thestrongest known regulated promoters, the alcohol oxidase I(AOX1) promoter, which is induced by methanol and repressedby other carbon sources such as glucose, glycerol, and ethanol(Lin Cereghino and Cregg, 2000). Another important feature ofthis system is its ability to achieve extremely high cell densities,enabling efficient protein production and secretion (Pickfordand O’Leary, 2004; Sreekrishna et al., 1997).
At the National Institute for Biotechnology and GeneticEngineering (NIBGE), Faisalabad, Pakistan, there is a largecollection of thermophilic fungi (Latif et al., 1994), which have
100
potential applications in the poultry feed industry and paperand pulp industry. Wong and Saddler (1992) demonstratedthat C. thermophile shows large amounts of extra cellularcellulase and xylanase activity when grown on cellulosic orlignocellulosic substrates as carbon sources. In the presentstudies efforts were made to isolate xylanase (Xyn 11-A) genefrom C. thermophile strain NIBGE-1 and clone the xylanasegene in prokaryotic and yeast model systems. In this context,the expression model systems BL21 (Novogen) and P. pastorisis selected (Invitrogen, USA). P. pastoris has many advan-tages of higher eukaryotic expression systems such asprotein processing, protein folding and post-translationalmodification. It is faster, easier and less expensive to usethan other eukaryotic expression systems such as baculovirusor mammalian tissue culture and generally gives higherexpression levels.
Materials and MethodsProkaryotic expression system. Isolation and amplificationof Xyn 11-A gene. Xylanase gene (860 bps) was isolated fromChaetomium thermophilum NIBGE-1 strain by designing aset of primers Xyn 11-A (F) 5′- GGC GAT AGC TAG CAT GGTCAA CTT CTC AAC TCTC -3′ (34 mers) and Xyn 11-A (R) 5′-GGA AGG GCC CGC ACT GCA TGC TTG TTA GC -3′ based onthe reported sequence from Gene bank nucleotide databaseaccession no. AJ508931. This fragment was cloned into T/Acloning vector pTZ57R (MBI Fermentas) and the cloned wassequenced from Microsynth GmbH, Switzerland. The sequencewas submitted to Gene bank and assigned accession No.AY366479. Sequencing and characterization of gene infor-mation revealed a 35 bp intron with two exons in the isolatedgene fragment. The gene sequence AY366479 was comparedwith other xylanase genes from other organisms using onlinesoftware. Intron was removed by amplifying the insert alongwith vector backbone except intron by using primers P3
5’-AGA CTC GAG TCG AAC CCC GGT ATC GAC -3’ 27 mersand P4 5’-CTG CTC GAG GCG CTG GAA ATG TTT TGT TGG-3’ 30 mers. The desired gene was named as Xyn 11-A, and theresultant construct was named as pSWXyn11-A(a) asindicated in Fig. 1.
Cloning and Expression of Xyn 11-A in BL21 E. coli strain.Xyn 11-A gene, (810 bps), from pSWXyn11-A(a) and pET32a(+) was restricted with EcoRI and Hind III, respectively. Theeluted fragments were ligated for overnight at 16 °C andtransformed into 10b E. coli strain through heat shock at42 °C. The transformants were selected on Laurie bertini (LB)medium supplemented with 100 mg/ml ampicillin. The resultantconstruct pSWXyn11-A(b) was confirmed with thecombination of different restriction enzymes EcoRI, Hind III,Xho I and Xba I, respectively. The recombinant clonepSWXyn11-A(b) as indicated in Fig. 2, was transformed intoheat shock BL21 competent cells and the transformants wereverified through PCR analysis. The colony was cultured intobroth LB medium supplemented with 100 mg/ml ampicillin andincubated at 37 °C for overnight. Next day, 2 ml of overnightculture was transferred to 50 ml (100 mg/ml) ampicillin LB brothmedium and again incubated for 3 h at 37 °C. After three hoursof growth, 70 μl of 1 mM IPTG inducer was added and the cellswere again incubated at 37 °C for 3 h. Samples were collectedevery 30 min, cells were pelleted down and given the freezethaw treatment. Cell lysate was dissolved in 1 ml citrate bufferand sonicated for complete lysis. The lysate was centrifugedat 13,500 rpm for 10 min and supernatant was used for furtheranalysis.
SDS-PAGE analysis. The supernatant fluid from cell lysate ofselected cultures of E. coli were separated by SDS-PAGE on10 % and visualized by coomassie blue staining.
Western blot analysis. Protein, 15 μg, from both transformedand non-transformed E. coli cells were run on 15 % SDS-PAGE gels and transferred to nitrocellulose paper. Thepolyclonal antibodies, raised against fusion part of the protein,conjugated to alkaline phosphatase detected bands thatbound antibodies.
Inoculum preparation for induction of xylanase gene byusing different carbon substrates. Different soluble carbonsubstrates were used at 0.5% and 1% level to induce the
101Heterologous Expression of C. thermophilum Xylanase Gene
Fl ori Lac Z xyn II-A Lac Z
T7 trxA S. Tag xyn 11-A T7 term
X BE H Xh
xylanase gene expression in Dubose Salt (DS) media. Thesecarbon sources were xylose, glucose, cellubiose and lactose.Colonies were picked and cultured in the test tubes containing3 ml DS broth media with 100 mg/ml ampicillin (antibiotic) andxylose, glucose, cellubiose and lactose at 0.5% and 1% wereused as carbon sources. Next day 1 ml culture was transferredto 2 ml DS broth media with 100 mg/ml ampicillin, and grownfor 3 h on a shaker at 37 °C. After 3 h growth, 4.7 ml of (1m M)IPTG was added to act as inducer. Cultures were further grownon a shaker at 37 °C for one and a half hour and for 7 h.Medium containing growth was centrifuged at 13,500 rpm for5 min. The xylanase activity from E. coli was assayed againstoat spelt xylan method as described by Tuncer et al. (1999).Two ml of above reaction mixture containing 1 ml of cell lysate,0.5 ml of 1 % oat spelt xylan and 0.5 ml of citrate phosphatebuffer (pH 6) was incubated at 40 °C for 2 h at 60 rpm. Thereducing sugar was determined by dinitrosalicylic acid (DNS)procedure.
Pichia pastoris (yeast expression system). Cloning andtransformation of xylanase gene into E. coli TOP10F’strain. The intron-less 810 bp fragment of xylanase genefrom pSWXyn11-A(b) and pPIC3.5K P. pastoris vector weredigested with EcoRI and NotI restriction enzymes and placedat 37 ºC for 1 h. Digestion was run on 0.5 % agarose gel andthe targeted fragments were eluted from the gel by usingextraction Kit (MBI, Fermentas). Eluted fragments wereligated and transformed into heat shocked competent cellsof E. coli TOP10F’ strain (Li et al., 2005). Colonies wereselected randomly from overnight grown E. coli in LB agarmedium containing ampicillin (100 mg/ml). Plasmid isolationwas done by miniprep method (MBI, Fermentas). Theresultant recombinant clone was confirmed throughcombination of different restriction enzymes i.e., EcoRI, NotIand KpnI.
Transformation and screening of resultant recombinantclone into Pichia pastoris.The resultant recombinant vectorpSWXyn11-A(c) (Fig. 3) was linearized with NotI restrictionenzyme, transferred to the cuvette and electric shock wasgiven at 2.0 kvolts for integration in the genomic DNA ofP. pastoris. Then immediately 1ml of 1M sorbitol was addedand cuvettes were placed on shaker at 30 °C. After 2 h themedium was spread on the 0.75 mg/ml concentration ofgeneticin YPD agar medium plates for the selection oftransformants. These plates were incubated at 30 °C untilcolonies appeared. Colonies were picked from 0.75 mg/mlgeneticin plate and cultured into YPD liquid medium withoutantibiotic and incubated at 30 °C till the time that cell densityreached up to (OD600 =1.0). The transformants were confirmedthrough PCR analysis by using set of primers P3 and P4. The
sample was prepared for PCR reaction under denaturationat 94 °C for 5 min, annealing at 60 °C for 1 min, extension to72 °C for 1 min and 35 cycles, as 10 μ litre of P. pastorisculture into 1.5 ml microcentrifuge tube, 5 μ litre zymolyaseenzyme was added and incubated at 30 °C for 10 min. Thesample was frozen at -70 °C for 10 min.
Optimization of P. pastoris growth for xylanase assay andSDS-PAGE analysis. P. pastoris transformants havingpSWXyn11-A(c) were picked from 0.75 mg/ml geneticin YPDagar media plates along with non-transformant GS115 ascontrol and cultured into YPD broth media without antibioticat 30 °C (OD600 = 1.0). Cells were harvested by centrifugationat 3000 rpm for 5 min at room temperature. Supernatant wasdiscarded and cell pellets were resuspended into 25 ml mini-mal glycerol medium (MGM) and 0.02% 10 X dextrose in a 100ml flask. Cultures were placed at 28-30 °C in a shaking incuba-tor (150-200 rpm) until growth reached the log phase. Oncethe cells are in log phase, they can be induced for xylanaseexpression. One ml culture was taken before each induction of100 % methanol to a final concentration of 0.5% in 25 ml MGmedium. Induced culture was collected at different time inter-vals i.e. 24, 48, 72, 96 and 120 h. One ml of culture was trans-ferred to 1.5 microcentrifuge tubes. These samples were usedto analyze expression levels and determine the optimal timefrom post-induction to harvest. Cells were centrifuged at 13,500rpm at room temperature for 2-3 min. For intracellular andsecreted expression, both supernatant and pellet were storedat -70 °C until ready for protein assay.
Preparation of samples for xylanase assay and SDS-PAGE.The activity of xylanase was determined by the methoddescribed by Tuncer et al. (1999) against oat spelt xylan. Thesample was prepared for both SDS-PAGE and xylanase assayas thawed cell pellets and quickly placed on ice. Pellets, weredissolved in 1 ml distilled water and 100 μ litre breaking bufferand an equal volume of acid washed glass beads (size 0.5mm)was added, vortexed for 30 sec., incubated on ice for 30 sec(repeated for several times) than centrifuged at 13,500 rpm for10 min. Clear supernatant was transferred to a fresh 1.5 mlmicrocentrifuge tube, and 50 μ litre SDS-PAGE loading dye
Table 1. Xylanase activity in cell lysate of E. coli (BL21) har-boring the pET expression vector with intron-less xylanasefragment.
Time of induction* Enzyme activity U/ml **Sample 1 Sample 2 Sample 3
(control)
At zero h 3.19 3.74 3.44After 30 min 4.62 3.40 3.81After 60 min 4.03 3.80 4.19After 90 min 3.95 3.99 3.92After 120 min 4.19 3.94 3.75
* = induction with IPTG (1 mM); ** = Hl sample 1 and 2:pSWXyn11-A(b); sample 3: pET 32a(+)
was added for SDS-PAGE analysis and boiled for 10 min at100 °C in a dry bath; 10-20 μ litre sample per well was loadedinto SDS-PAGE gel whereas other used for xylanase assayand the rest were stored at -20 °C for use in future.Electrophoresis was performed using a discontinuous buffersystem, for the analysis and separation of proteins. Developersolution was added to enhance and bands were visualizedduring silver staining of SDS-PAGE of xylanase Xyn11-Aprotein in P. pastoris.
Results and DiscussionResults in prokaryotic expression system. Confirmation ofcloning of Xylanase into pET vector. The resultant recom-binant clone pSWXyn11-A(a) was confirmed throughdigestion as shown in Fig. 1. After digestion, the xylanasegene of approx. 810 bp was cloned in the pET expressionvector, and finally the recombinant clone pSWXyn11-A(b)was transformed into E. coli strain BL21 for bacterialexpression. To confirm the cloning of intron-less Xyn11-Agene in pSWXyn11-A(b), EcoRI and HindIII restrictionenzymes were used. Digestion with HindIII and EcoR1produced approx., 900 bp fragment. Similarly, digestion withHindIII and Xho1 which produced a correct sized fragment ofapprox. 600 bp. Confirmation of pSW Xyn11-A(b) was alsomade with HindIII and Xba1 restriction enzymes whichproduced approx., 800 and 600 bp fragments.
Confirmation of transformants BL21 having pSWXyn 11-A(b). After confirmation of recombinant clone pSWXyn11-A(b)through combination of different restriction enzymes,pSWXyn11-A(b) and pET 32a(+) vector was transformed intoE. coli BL21 strain by heat shock transformation method. Thetarget gene from pSWXyn11-A(b) was confirmed through PCRanalysis by using set of Xyn 11-A specific primers P1 and P2.The amplification of 810 bp fragment confirmed thetransformation of recombinant vector in E. coli strain BL21.
Estimation of the xylanase gene expression in the form offusion protein was carried out using xylanase assay. Thexylanase gene expression in E. coli strain BL21 was inducedby IPTG (1mM) inducer in LB broth media as indicated inTable 1 and shown in Fig. 4. The activity of xylanase by DNSmethod was obtained in U/ml. The maximum activity ofxylanase gene U/ml was obtained after incubation of 2 h at40 °C. The maximum and minimum production of xylanase was4.62 and 3.99 U/ml, respectively, as compared to the control(4.19 and 3.91 U/ml, respectively).
Effect of different carbon sources on xylanase production.Effect of different carbon sources was observed on thexylanase gene expression, which was carried out through
xylanase assay. The xylanase activity in E. coli BL21 strain inDS liquid media containing ampicillin (100 mg/ml) and differentcarbon sources i.e., xylose, glucose, cellobiose and lactose,was carried out after 1.5 and 7 h, (Table 2, Fig. 4). Maximumactivity of xylanase (U/ml) in the presence of carbon sourceswas obtained after incubation for 10 min at 40 °C. The maximumxylanase activity after 1.5 h, observed in the presence of 1%xylose, was 2.302 U/ml whereas minimum activity, observed in
Fig. 4. Xylanase activity in cell lysate of E. coli (BL21)in the presence of different carbon sources
S 1: (0.5% xylose + DS media + xylanase gene)S 2: (0.5% glucose + DS media + xylanase gene)S 3: (0.5% cellubiose + DS media + xylanase gene)S 4: (0.5% lactose + DS media + xylanase gene)S 5: (without carbon source + DS media + pET)S 6: (without carbon source + DS media + xylanase gene)S 7: (1% xylose + DS media + xylanase gene)S 8: (1% glucose + DS media + xylanase gene)S 9: (1% cellubiose + DS media + xylanase gene)S 10: (1% lactose + DS media + xylanase gene)S 11: (LB media + pET)S 12: (LB media + xylanase gene).
103Heterologous Expression of C. thermophilum Xylanase Gene
0
0.2
0.4
0.6
0.8
1
1.2
1.4
Samples
activity after 1:30 h
activity after 7 h
the presence of 1 % cellobiose, was -0.136 U/ml. On the otherhand the maximum activity of xylanase after 7 h, observed inthe presence of 0.5 % lactose, was 1.708 U/ml, whereas,minimum activity, in the presence of 1 % lactose, was -5.853U/ml.
SDS-PAGE analysis for xylanase protein induced by IPTGinducers. The production of recombinant xylanase by E. coliBL21 was indicated by the appearance of a 43 kDa protein onSDS-PAGE. The amount of recombinant protein increased withdifferent induction times as indicated in Fig. 5.
Western blotting of recombinant xyalnase. Western blotanalysis was carried out by using polyclonal antibodies raisedagainst fusion protein.
Results of Pichia pastoris (yeast expression system).Confirmation of recombinant clone pSWXyn11-A(c) throughrestriction analysis and transformation into GS115 Pichiapastoris strain. Xylanase gene was digested with EcoRI andNot I enzymes and cloned at the same sites in pPIC3.5K. Upondigestion with EcoRI and NotI, recombinant clone pSWXyn11-A(c) produced (approx.) 810 bp fragment along with vectorbackbone of pPIC3.5 K of 9000 bp. pSSZ810 recombinantclone has two Kpn I restriction sites, an internal and the otherKpnI site is located in the vector backbone. Therefore, upondigestion with Kpn I, it produced two fragments of sizes 500and 300 bp, respectively.
The purified and linearized fragment of pSWXyn11-A(c) withNot I was transformed into P. pastoris strain GS115 throughelectroporation for integration into genomic DNA of P. pastoris.Concentration of geneticin was optimized for the selection of
104
transformants from 30, 50, 70, 90, 110, and 130 μg/ml. Suitableconcentration of geneticin (antibiotic) for selection of trans-formants was found to be 0.75 mg/ml. The transformants weregrown on YPD agar media plates containing 0.75 mg/mlgeneticin. The integration of linearized fragment pSWXyn11-A(c) having xylanase gene in the genome of P. pastoris wasconfirmed through PCR amplification by using xylanasespecific primers.
Saiqa Wajid et al.
Fig. 5. SDS-PAGE analysis of total protein isolatedfrom bacterial strain BL21 transformed withpSWXyn11-A(b) and pET 32a(+).Lane 1-8: pSWXyn11-A(b) transformed BL21.Lanes 10-12: pET 32a(+) transformed BL21From right to left in lane 12, 8 and 4: proteininduced after zero minute,Lane 11, 7 and 3: protein induced after 30 minutes,Lane 10, 6 and 2: protein induced after 60 minutes,Lane 5 and 1: protein induced after 90 minutes.9: represents prestained protein marker #SM0441118 k Da (MBI Fermentas).
Table 2. Xylanase activity in cell lysate of E. coli (BL21) in the presence of different carbon sources.
E. coli strain transformed Medium Carbon source Enzyme activity U/ml with vectorwith vector used After one and After 7 h
Xylanase assay of pSWXyn11-A(c) in GS115 Pichia pastorisstrain. Production of xylanase protein by recombinantP. pastoris GS115 strain was induced by 100 % methanol upto a final concentration of 0.5 % in minimal glycerol media(MGM) broth as indicated in Table 3. The maximum and theminimum production of xylanase was 2.04 and 0.006 U/ml ascompared to the control, 0.484 and 0.06 U/ml, respectively. Liet al. (1993) determined the expression of Mmr-1 protein inP. pastoris by induction under the concentration of 0.5%methanol. The level of this recombinant protein was about50 mg/ml which is greater than our expressed protein after48 h of induction (Fig.6).
105
Table 3. Xylanase activity in Pichia pastoris GS115 strain
Time of Xylanase activity (U/ml)**induction* Sample 1 Sample 2 Sample 3 Sample 4
At zero h 0.769 0.242 0.5 0.06After 24 h 0.424 0.632 0.006 0.484After 48 h 2.04 0.014 0.151 0.242After 96 h 0.06 0.175 0.133 0.436
Fig.6. Xylanase production byPichia pastoris strainGS115 at different time period
Colony 1: having pSWXyn11-A(c) at zero, 24, 48 and 96 hColony 2: having pSWXyn11-A(c) at zero, 24, 48 and 96 hColony 3: having pSWXyn11-A(c) at zero, 24, 48 and 96 hColony 4: without pPIC3.5k at zero, 34, 48 and 96 h
ConclusionHyperactivity of this xylanase versus those from other sourcesmay be due to the presence of glycine rich C-terminal regionwhich is absent in other fungi.However, for determination ofits exact function further investigations are required. Themaximum xylanase activity was observed in the presence of100% methanol inducer and, after incubation for 2 h at 50 °C,is lower as compared to 2 mg/ml, observed in the previousstudies (Faber et al., 1995)
AcknowledgementThe authors are indebted to parents, colleagues and specialfriends for their guidance and kind advices. The authors arealso thankful to Agriculture Linkage Programme (ALP) ofPakistan Agricultural Research Council, Islamabad, Pakistanfor research grant.
ReferencesAlam,M., Gomes, I., Mohiuddin, G., Haq, M. 1994. Production
and characterization of thermostable xylanses by Thermo-myces lanuginosus and Thermoascus aurantiacus grownon lignocelluloses. Enzyme and Microbial Technology16: 298-302.
Boettner, M., Prinzb, B., Holz, C., Stahl, U., Lang, C. 2002. Highthrough put screening for expression of heterologousproteins in the yeast Pichia pastoris. Journal ofBiotecnology 99: 51-62.
Cregg, J.M., Lin Cereghino, J., Shi, J., Higgins, D.R. 2000.Recombinant protein expression in Pichia pastoris.Molecular Biotechnology 16: 23-52.
Coughlan, M.P., Hazlewood, G.P. 1993. Beta-1,4-D-Xylan-degrading enzyme system :biochemistry, molecularbiology and applications. Biotechnology AppliedBiochemistry 17: 259-289.
Christov, L.P., Prior, B.A. 1996. Repeated treatments withAureobasidium pullulans hemicellulases and alkalienhance biobleaching of sulphite. Enzyme and MicrobialTechnology 18: 244-250.
Collins, T., Meuwis, M.A., Stals, I., Claeyssens, M., Feller, G.,Gerday, C. 2002. A novel family of 8 Xylanase, func-tional and physicochemical characterization. Journal ofBiological Chemistry 277: 35133-35139.
Emami, K., Nagy, T., Fontes, C.M.G.A., Ferreira, L.M.A.,Gilbert, H.J. 2002. Evidence for temporal regulation ofthe two Pseudomonas cellulosa xylanases belonging toglycoside hydrolase family 11. Journal of Bacteriology184: 4124-4133.
Faber, K.N., Harder, W., Veenhuis, M. 1995. Methylotropic
Heterologous Expression of C. thermophilum Xylanase Gene
SDS-PAGE (silver staining) of pSWXyn11-A(c) in GS115P. pastoris strain.The intensity of desirable protein (approx.)28 kDa increased with increase in time after 100 % methanolup to a final concentration of 0.5 % induction. The maximumactivity of pSWXyn11-A(c) having xylanase protein wasobserved after 96 h of induction period whereas no band wasobserved in case of non-transformant P. pastoris GS115.
0
0.5
1
1.5
2
2.5
zero h 24 h 48 h 96 h
Time of induction (h)
colony 1
colony 2
colony 3
colony 4
yeasts as factories for the production of foreign proteins.Yeast 11: 1331-1344.
Henrissat, B., Bairoch, A. 1993. New family in the classificationof glycosyl hydrolases based on amino acid sequencesimilarities. Biochemistry Journal 293: 781-788.
Kimura, T., Ito, J., Kawano, A., Makino, T., Kondo, H., Karita,S., Sakka, K., Ohmiya, K. 2000. Purification, characteriza-tion and molecular cloning of acidophilic xylanase fromPenicillium sp.40. Bioscience, Biotechnology, andBiochemistry 64: 1230-1237.
Latif, F., Rajoka, M. I., Malik, K.A. 1995. Production ofcellulases by thermophilic fungi grown on Leptochloafusca straw. World Journal of Microbiology andBiotechnology 11: 347-348.
Li, T.B., Hu, Y., Wang, Y.G., Xia, H.Z. 2005. Cloning ofmMR-I gene and expression in Pichia pastoris system.Sheng Wu Gong Cheng Xue Bao. 21: 25-29.
Li, X.L., Zhang, Z.Q., Dean, J.F., Eriksson, K.E., Ljungdhal,L.G. 1993. Purification and characterization of a newxylanase (APX-II) from the fungus Aureobasidiumpullulans Y-2311-1. Applied and Environmental Micro-biology 59: 3212-18.
Lin Cereghino, G.P., Lin Cereghino, J.L., Ilgen, C., Cregg, J.M.,
106 Saiqa Wajid et al.
2002. Production of recombinant protein in fermentercultures of the yeast Pichia pastoris. Current Opinionin Biotechnology 13: 329-333.
Lin Cereghino, J., Cregg, J.M. 2000. Heterologous proteinexpression in the methylotrophic yeast Pichia pastoris.FEMS Microbiology Reviews 24: 45-66.
Pickford, A.R., O’Leary, J.M. 2004. Isotopic labelling ofrecombinant proteins from the methylotrophic yeastPichia pastoris. Methods in Molecular Biology 278: 17-33.
Sinha, J., Plantz, B.A., Inan, M.,Meagher, M.M. 2004. Causes ofproteolytic degradation of secreted recombinantproteins produced in methylotropic yeast Pichia pastoris:case study with recombinant ovine-interferon-tau.Biotechnology and Bioengineering 89: 102-112.
Sreekrishna, K., Brankamp, R.G., Kropp, K.E., Blankenship, D.T.,Tsay, J.T., Smith, P.L., Wierschke, J.D., Subramaniam, A.,Birkenberger, L.A. 1997. Stratagies for optimal synthesisof heterologous proteins in the methylotropic yeast Pichiapastoris. Gene 190: 55-62.
Tuncer, M., Ball, A.S., Rob, A., Wilson, M.T. 1999. Optimiza-tion of extra cellular lignocellulolytic enzyme productionby a thermophilic actinomycete Thermomonospora fuscaBD25. Enzyme and Microbial Technology 25: 38-47.
IntroductionPakistan is situated between latitude 240 and 370 north andlongitude 620 and 750 east on the eastern part of the ArabianSea with a coastline of about 900 km. It is divided into twoecological zones: Balochistan coast on the northwest andSindh coast on the southeast. The Balochistan coast is about630 km long and the Sindh coast is about 270 km long. Alongthe Balochistan coast, the continental shelf is 10-20 km wide;the bottom is mostly rocky except at Sonmiani Bay. The Sindhcoast is characterized by innumerable creeks; the continentalshelf extends to about 30-100 km; the bottom of the shelf ismuddy and muddy-cum-sandy. The river Indus discharges inthis area and forms the Indus Delta, which is one of the largestdeltas in the world. The Balochistan coast is endowed withstable hydrological conditions characterized by high tempera-ture and salinity owing to little fresh water drainage.
Species diversity. A sound knowledge of biodiversity andbiology of commercial species forms the basis for a sustain-able management. To date, 16 species of lobsters have beenrecorded from Pakistan (Kazmi, 2004, 2003; Holthuis, 1991;Williams, 1986). These species belong to eight genera and twofamilies. The family Palinuridae is represented by two generaPanulirus and Puerulus. Genus Panulirus has five speciesand two sub species recorded from Pakistan coast: Panulirusversicolor, P. homarus megasculpta, P. homarus rubellus,P. ornatus, P. polyphagus and P. penicillatus; Puerulus hastwo species: Puerulus angulatus and P. sewelli. The familyScyllaridae comprises of six genera and nine species viz.Thenus orientalis, T. pariindicus, T. indicus, Scyllarides
Pak. J. Sci. Ind. Res. 2009 52(2) 107-116
Lobsters from Northern Arabian Sea (Pakistan Coast)Razia Sultanaa*, Quddusi Begum Kazmib and Shahid Amjadc
aFood and Marine Resources Research Center, PCSIR Laboratories Complex, Karachi-75280, PakistanbMarine Reference Collection and Resource Center (MRC), University of Karachi, Karachi, Pakistan
cLasbella University of Agriculture Water and Marine Sciences, Uthal, Balochistan, Pakistan
(received July 26, 2008; revised February 7, 2009; accepted February 21, 2009)
Abstract. Pakistan is situated between latitude 240 and 370 North and longitude 620 and 750 East, on the eastern part of theArabian Sea with a coastline of about 900 km. Lobsters are found both on its northwest (Balochistan) and southeast coasts(Sindh). Important fishing grounds of lobsters are located along Ormara, Pasni Gwader and Jiwani besides Karachi coast.Todate, 16 species of lobsters have been recorded from Pakistan. The only predominant commercial species is Panuliruspolyphagus, which constitutes 83% of the catch. The paper provides an identification key for northern Arabian Sea lobstersand outlines the available information on the biology, fisheries and management of the lobster species from Pakistan. Mostof the studies have been focused on P. polyphagus.
Keywords: Arabian Sea lobsters, P. polyphagus, Arabian Sea, lobsters
tridacnophaga, S. haani, Scammarctus batei, Eduarctusmartensii, Acantharctus ornatus and Parribacus antarcticus.
History of Taxonomy of Pakistani Lobsters. The history ofcarcinological studies in Pakistan reveals that the lobsterfauna of Pakistan reported in the beginning belonged to onlyone Palinurid genus Panulirus and its three species and oneScyllarid genus Thenus, till then monotypic (Ahsanullah, 1965;Tirmizi and Ahsanullah, 1965; Government of Pakistan, 1960;Hussain, 1958). Additions of several genera and species havebeen made through reports as World Lists (Burton and Davie,2007; Holthuis, 2002, 1991, 1984; Williams, 1986) and newrecords made by local scientists (Kazmi, 2003, 1995; Moazzamet al., 2003; Fatima, 2000; Tirmizi and Kazmi, 1983).
In recent years several nomenclatural changes have also beenmade world wide. The scyllarine genus Thenus was repre-sented only by Thenus orientalis until recently; now Burtonand Davie (2007) have revised the taxonomy on the basis ofDNA studies and recognized four species within the genus(Burton and Davie, 2007). They established three newspecies, one of these, T. parindicus, is also included in thematerial from Pakistan; another species T. indicus wasseparated from the old T. orientalis as non-type materialfrom Karachi. The record of T. orientalis from Pakistan isgiven with some doubts by Burton and Davie (2007). Prof.Dr. L. B. Holthuis revised the Indo-Pacific species of thescyllarine genera in 2002 and separated several genera fromthe species formally placed in the genus Scyllarus Fabricius.Three such species which were reported from Pakistani waterswere also transferred to the new genera created by Holthuis.The material examined for new genus Acantharctus included
Review
107
108 Razia Sultana el 01.
material collected fi-om Pakistan (then British India) in 1930. More works on taxonomic status also altered the species composition occurring in the northern Arabian Sea up to 10 O N . Some old records were found to be misidentified, for example Jasus lalandi reported by Prasad and Tampi (1968) is actually Parribacus antarticus (Holthuis, 1985). Pollock et al. (2000) have given the distribution of the species Jaszrs lalandi in the south east Atlantic region, so J, lalandi is no more included in the faunal list from Arabian Sea. Similarly the case of genus Parribacus (P. antarticus), reported by Williams (1986) from the northern Arabian Sea (including Pakistani waters), has to be treated with some reservation since it was not included by Holthuis (1991) in the world list of lobsters from Pakistan or either Arabian Sea. Another problematic genus is Palinustus. What is believed to be P. wagt~ensis has been reported under the name o f I? rnossambicus from the Arabian Sea. The taxonomic status oft! waguensis vis-ci-vis P. r~~ossambicus is far from clear and closer study of the complex is still highly desirable (Holthuis, 1991).
The nominotypical form of Panulirus homarus (Ph. hornarus) is found throughout the range ofspecies but P. h. rnegasclupta is known only from the northern Arabian Sea and P 11. rzrbellus inhabits S. E. Africa and S. E. Madagascar (Holthuis, 1991). These subspecies were not distinguished in the study by Tirmizi and Ahsanullah (1965). Kazmi (1995) reported a speci- men of P homarus collected from Churna Island, Makran Coast (25'.5'E, 67O.5'N). Interestingly, this specimen appeared to be more similar to P h. rubellus than to the local subspecies I? h. megasculpta. The colour pattern differed from all the known forms and some minor morphological differences were also noticed in the antennal peduncle, antennular plate, and the abdominal pleura. There is a prominent spine at the inner anterolateral angle of the basal antennal segment (Fig. la). The antennular plate has two unequal pairs of principal spines, two tufts ofcourse plumose setae arranged in double row with three sharp spinules (Fig. Ib). The scallops of the abdominal grooves are deep, large and interrupted; the armature on the posterior margin o f the abdominal pleurae is strongly developed (Fig. Ic). The live specimen (MRC Catalogue No. Rapt. 1) was dark brown with the anterior portion of the carapace brick red mid-dorsally and the abdomen was light orange. It is probable that two mentioned forms may have intermingled and a hybrid is emerging in our area since hybrids are common in areas where subspecies overlap (Pollock, 1993).
An earlier unpublished key prepared for the northern Arabian Sea up to lo0 N, under the Pakistan Science Foundation Research Project (1 988-89) tit1ed"Guide to the Malacostraca of
Fig. la-c. (a) The prominent spine at the inner antero- lateral angle of the basal antennal segment. (b) The antennular plate showing two unequal pairs of principal spines, two tufts of plumose setae in double row with three sharp spinules. (c) The strong armature on the posterior margin of the abdominal pleurae.
the Arabian Sea" by Tirmizi and Kazmi (1989) included fewer taxa. This key has been updated and included in this publi- cation. To date two nephropine genera, Nephropsis and Acanthocaris, one polychelid genus Polycheles, one ibacine genus Parribacus, one arctidine genus Scyllarides, sole thenine genus Thenus, five scyllarine genera Scammarctus,
Bathyarctus, Eduarctus, Acantharctus and Biarctus and twopalinurid genera Panulirus and Puerulus are reported fromthe Arabian Sea. Out of these Parribacus, Thenus, Scyllarides,Scammarctus, Eduarctus, Acantharctus, Panulirus andPuerulus extend to north in the Arabia Sea (24-37 °N) inPakistani coastal waters.
The key presented here has been fabricated using differentsources mainly from Holthuis (1991). The first reports of thespecies from the area are referenced. For the higher taxa thekey by Martin and Davis (2001) has been followed. FurtherAhyong and O’Meally (2004) and Dixon et al. (2003) revisedreptantian classification and changed the position ofScyllaridae and Palinuridae and put them in the infraorderAchelata.
Key to the northern Arabian Sea lobsters.
1a. First three pairs of pereiopods with true chelae, first pairthe largest and most robust ----------------------------------- 2
1b. Third pereiopod never with a true chela, in most groupschelae also absent from first and second pereiopods --- 3
2a. Fourth pereiopod and usually also the fifth, without truechelae. Carapace cylindrical not flattened ----- InfraorderAstacidea, Superfamily Nephropoidea, Family Nephro-pidae - Deep sea true lobsters and lobsterettes ---------- 4
2b. All pereiopods, or at least the first four, with true chelae.Carapace flattened ----------------- Infraorder Palinuridea,Superfamily Eryonoidea, Family Polychelidae -------------A single genus and single species: Polycheles andama-nicus
(Ramadan, 1938).
3a. Antennal flagellum reduced to a single broad and flatsegment, similar to the other antennal segments ----------Infraorder Palinuridea, Superfamily Palinuroidea, FamilyScyllaridae ---- Slipper lobsters ------------------------------- 9
3b. Antennal flagellum long, multi-articulate, flexible, whip-like or more rigid. Epistome short, far shorter than 1/3 ofthe carapace. Eyes not placed on an elevation of thecephalon. Carapace with numerous strong and less strongspines and two frontal horns over the eyes. Rostrumabsent or reduced to a single spine. Legs 2 to 4 (usuallyalso 1) without chelae or subchelae ---------- InfraorderPalinuridea, Superfamily Palinuroidea, Family Palinuridae-Spiny lobsters or Langoustes ------------------------------- 19
4a. Rostrum laterally compressed for the larger part of itslength, with dorsal and ventral, but no lateral teeth. Cara-pace with branchiostegal spine. Body entirely coveredby numerous closely placed and sharply pointed spinules.Lateral margin of the telson with 6 to 12 spines ----------------------- Subfamily Neophoberinae -----------------------------
A single genus and single species: Prickly deep- sealobster ------------------ Acanthacaris tenuimana
(Holthuis, 1984; Alcock and Anderson, 1894).
4b. Rostrum dorsoventrally depressed with lateral (andsometimes ventral) but without dorsal teeth; sometimeswithout any teeth. Carapace without a branchiostegalspine. Body never uniformly covered with spinules,although granules may be present all over or spinulesmay be placed on the carapace. The lateral margin of thetelson with at the most three lateral spines, which ifpresent, are usually small and irregular.Scaphocerite absent. Carapace without postorbital spine.Abdominal sternites unarmed in both sexes. No podo-branch on second maxilliped ---- Subfamily Thymopinae.Antennal scale absent. Pincers of first pair of legs withsoft pubescence. Body not uniformly spinulose. Abdo-men without a distinct median ridge --------- single genus:Nephropsis -------------------------------------------------------- 5
5a. Rostrum without lateral teeth. A strong post-supraorbitalspine present behind the supraorbital spine. Abdominalsomites III to VI with a median dorsal carina. Anteriormargin of pleura of abdominal somite II without spines.Telson without medio-dorsal spine - Gladiator lobsterette-------------------------- N. ensirostris
(Macpherson, 1990).
5b. Rostrum with lateral teeth. Other characters mentionedunder 5a present or absent ------------------------------------ 6
6a. Rostrum with one pair of lateral teeth (one tooth on eithermargin). Anterior margin of pleuron of second abdominalsomite without a spine, although the pleuron itself mayend in a sharp, spine-like tip ----------------------------------- 7
6b. Rostrum with two pairs of lateral teeth. Anterior marginof second abdominal somite with or without spine ------ 8
7a. Abdominal somites without any trace of a mid-dorsalcarina. No post supraorbital spine on carapace. The dis-tance between the supraorbital spines and the gastrictubercle is less than half the distance between the gastrictubercle and the cervical groove. Exopod of uropod witha diaeresis ------- Indian Ocean lobsterette ------ N. stewarti
(Macpherson, 1990).
7b. Median dorsal carinae on abdominal somites III to VI, butnot second -------------- Ridge-back lobsterette ---------------------------------- N. carpenteri
(Holthuis, 1991).
8a. Abdomen with a dorsomedian carina on the somites II toVI. Exopod of uropod with a diaeresis. Rostrum with twopairs of lateral teeth in the basal part. The supraorbitalspine is followed by a post supraorbital spine. Anterior
Lobsters from Northern Arabian Sea 109
margin of pleura of abdominal somite II with one or twospines in the basal half. Telson without mediodorsal spinein the basal part.Median groove of rostrum reaching distinctly beyondanterior pair of lateral rostral teeth. Distance betweensupraorbital spine and gastric tubercle is half the dis-tance between gastric tubercle and postcervical groove--------------- Grooved lobsterette ----------------- N. sulcata
(Holthuis, 1991).
8b. Abdomen without mediodorsal carina. Exopod of uropodwithout diaeresis --------- Red and white lobsterette ------------------------------- N. suhmi.
(Macpherson,1990; Ramadan, 1938).
9a. Exopod of all maxillipeds with a multiarticulate flagellum.----------------------------------------------------------------------- 10
9b. Exopod of third and first maxilliped without a flagellum;the flagellum of the second maxilliped transformed to asingle laminate segment --------------------------------------- 11
10a. Carapace strongly depressed, with a deep cervical inci-sion in the lateral margin. Mandible with a simple two-segmented palp -------- Sculptured mitten lobster ----------------------------------- Subfamily lbacinaeA single genus and single species: Parribacus antarcticus
(Williams, 1986).
10b. Carapace rather highly vaulted, with a small, shallowcervical incision, which may be lacking altogether.Mandible with three-segmented palp ----------- SubfamilyArctidinae.A single genus: Scyllarides --------------------------------- 19
11a. Orbits on the anterolateral angle of the carapace. Bodystrongly depressed. Lateral margin of the carapace withonly the cervical incision. No teeth on the lateral marginof the carapace, apart from the anterolateral andpostcervical. Fifth leg of female without a chela ------------------------ Subfamily Theninae.A sole genus Thenus and single species: Flat-headlobster ------------------------------------------------------------ 12
11b. Orbits on the anterior margin of the carapace, some dis-tance from the anterolateral angle. Body not depressed,but rather high and vaulted. Lateral margin of the cara-pace with both cervical and postcervical incisions,neither of which is very deep. Lateral margin of thecarapace with numerous teeth or squamiform tubercles.Fifth leg of female with a chela ------Subfamily Scyllarinae----------------------------------------------------------------------- 14
12a. Spotting on pereiopods absent. Outer face of propodusof second leg having upper most longitudinal grooveswith setae reduced to short thin line near base, or completly
lacking. Merus of third maxilliped with out a small spineproximally on inner ventral margin; inner margin ofischium distally dentate, but smoother and slightlymolariform proximally ------------ T. parindicus.
(Burton and Davie, 2007).
12b. Spotting on pereiopods either present or absent. Outerface of propodus of second leg having upper most longi-tudinal grooves bearing obvious setae over at least proxi-mal half. Merus of third maxilliped with a small spine proxi-mally on inner ventral margin; inner margin of ischiumprominently dentate along entire length ------------------ 13
13a. Numerous small spots or blotches present on some or allsegment of pereiopods -------------------------- T. orientalis
(Ahsanullah, 1965).
13b. Small spotting on pereiopods absent, ventral face of somesegments may be darkly blotched. Inner face of merus ofone or more periopods lacking a large purple to blackpigmented blotch ------------------------------------- T. indicus
(Burton and Davie, 2007).
14a. Posterior half of the dorsal surface of abdominal somitesII to IV with a rather wide transverse groove over themiddle, sometimes with tubercles on either side, but with-out an arborescent pattern of narrow grooves. Abdomi-nal somites with a distinct median longitudinal carinasharply set off from the rest of the dorsal surface ------ 15
14b. Posterior half of the dorsal surface of abdominal somitesII to IV with an arborescent pattern of a narrow centraltransverse groove with side grooves, that often arebranched ---------------------------------------------------------- 16
15a. Anterior part of thoracic sternum gutter-like sunken anddirected down, its anterior margin tapering anteriorly andending in a median point, which is placed lower than theanterolateral angles of the sternum. Fourth and fifth legsunusually long and slender, the fifth reaching the base ofthe antenna. Dactylus of third to fifth legs with a doubledorsal fringe of setae. Fourth antennal segment withoutadditional carina ScammarctusA single species: Soft locust lobster -------------- S. batei
(Holthuis,1991, as Scyllarus batei).
15b. Anterior margin of thoracic sternum V- or U- shapedlyincised, truncate or convex, but in a horizontal plane,top not sunken. Fourth and fifth legs not remarkablyslender and without a double dorsal fringe of setae onthe dactylus.Anterior margin of thoracic sternum truncate or convex,sometimes with a median tubercle but with median inci-sion; this margin situated on about the same level as theanterolateral teeth of the rostrum. Propodii of first four
110 Razia Sultana et al.
legs often with ventral setae ----------- Bathyarctus A singlespecies: B. rubens (Holthuis 1991; George, 1969, as Scyllarus rubens).
16a. Fourth segment of antenna with an additional carina or arow of tubercles outside the main oblique carina.Abdominal somites II to IV with a median dorsal carina,that of somite III usually highest. Rostral tooth absent orsmall. Fourth antennal segment with an additional row oftubercles ------------------ Eduarctus ------------------------- 17
16b. Fourth segment of antenna with a single oblique carinaover its full length; no additional carina or rows oftubercles. Abdominal somites usually without a mediancarina -------------------------------------------------------------- 18
17a. The posterior margin of the smooth anterior half ofabdominal somites II to IV crenulated -------- E. aesopius
(Holthuis, 1991 as Scyllarus aesopius).
17b. The posterior margin of the smooth anterior half ofabdominal somites II to IV is straight, non crenulated ------------- Striated locust lobster ------------------ E. martensii
(Holthuis, 1991, as Scyllarus martensii).
18a. Last segment of thoracic sternum with a sharp medianthorn ----- Acantharctus ----- A single species: A. ornatus (Ramadan, 1938, as Scyllarus arctus var. paradoxus).
18b. Last segment of thoracic sternum at most with a centraltubercle.Anterior margin of thoracic sternum deeply V - shapedlyincised, without additional tubercles, pregastric toothabsent ------- Biarctus ------- A single species: B. sordidus(Chhapgar and Deshmukh, 1964, as Scyllarus sordidus).
19a. Red spot on smooth part of somite 1 small and irregular;somites III-IV distinctly humped - Humpbacked locustlobster or Aeosop slipper lobster ------------------ S. haanii
(Moazzam et al., 2003; Williams, 1986).
19b. Smooth part of somite1 without spot, or more often with 3or more red or reddish spots of varying size and intensity----------------------------------------------------------------------- 20
20a. Somite 1 with median spot diffuse, not surrounded byring of yellow; pale red blotches on body surface, marbledwith brown or grey; side plates of somite II toothed onmargin ----- Locust lobster or Blunt slipper lobster --------------- S. squammosus
(Holthuis, 1991).
20b. Somite 1 with spots placed widely apart and nearly equalin size; yellowish brown - Clam - killer slipper lobster ------------------ S. tridacnophaga
(Tirmizi and Kazmi, 1983).
21a. Flagella of antennules long, whip-like, longer thanpeduncle of antennules ------------ Panulirus ------------ 24
21b. Flagella of antennules short, shorter than last segment ofantennular peduncle ------------------------------------------- 22
22a. Frontal horns truncated with anterior margin crenulated;first segment of antennular peduncle reaching beyondantennal peduncle ------------- Palinustus ----------- A singlespecies: P. mossambicus
(Kurian, 1967).
22b. Frontal horns tapering to a sharp point; first segment ofantennular peduncle not over-reaching antennal peduncle.Antennular plate distinct, a stridulating organ present.Carapace with a median ridge behind the cervical groove,often with spines or tubercles, but without submedianrows ---------------------Puerulus ------------------------------ 23
23a. Median keel of carapace with 8 small teeth (5 postcervical,3 intestinal). Surface of carapace covered with scatteredgranules, large tubercles present on ridges, 2 spinesbehind supraorbital spines ------ Arabian whip lobster ------------- P. sewelli
(Ramadan, 1938).
23b. Median keel of carapace with 5 teeth (3 postcervical, 2intestinal); body spines distinct and sharp; 3 spinesbehind supraorbital spines; fifth pereiopod of male notchelate -------- Banded whip lobster ---------- P. angulatus
(Moazzam et al., 2003).
23c. Median keel of carapace with 5 to 7 teeth (3 postcervical,2 to 4 intestinal); fifth leg of male chelate - Red whiplobster --------------- P. carinatus
(Moazzam et al., 2003).
24a. Abdominal somites with a distinct transverse groovewhich may be interrupted in the middle. Third maxillipedwith or without exopod ---------------------------------------- 25
24b. Abdominal somites smooth, without transverse groove.Third maxilliped without exopod ---------------------------- 26
25a. Anterior margin of transverse groove of abdominalsomites crenulated. Groove itself either complete or inter-rupted in the middle. Antennules plate with 4 equal large,well separated spines, arranged in a square with addi-tional very small spinules scattered in between. Exopodof third maxilliped absent. Colour: body dark green orreddish brown, finely spotted with white. No distinctbands of light colour on the abdomen. A light anteriorspot at the base of the abdomen pleura. Antennulesbanded. Legs rather uniform in colour, sometimes withfaint, longitudinal streaks --------- Scalloped spiny lobster----------- P. homarus.
(Tirmizi and Ahsanullah, 1965).
111Lobsters from Northern Arabian Sea
25b. Transverse groove of abdominal somites with straightmargins, not crenulated.Antennular plate with 4 strong spines, which are fused attheir bases, forming a single bunch of 4 diverging points;the anterior pair shorter than the posterior. Exopod ofthird maxilliped present, with flagellum. Transversegrooves over the abdominal somites usually uninter-rupted. Colour: body greenish or reddish, ranging fromyellowish green through brown green to blue-black ordark reddish brown; speckled on carapace and abdomenwith tiny whitish spots. No transverse colour bands onabdomen, but two rather large whitish spots on somite I.Antennules not banded. Legs with wider or narrower lon-gitudinal yellowish lines or streaks on a dark (greenish orreddish) background -------- Pronghorn spiny lobster ------------ P. penicillatus
(Tirmizi and Ahsanullah, 1965).
26a. Abdominal somites 1 to 6 with a distinct uninterruptedwhite transverse band along the posterior margin ----- 27
26b. Abdomen without distinct transverse bands on all somites,sometimes there is a line of pale spots there, or a narrowline is present on somites I to III, but on somites IV and V,this is replaced by a row of spots. Antennular plate with4 spines.Abdominal somites smooth and naked. Colour of abdo-men brownish or greenish grey with at most minute indis-tinct speckles. The usual large eyespot in the anterior halfnear the base of the pleura is accompanied by an obliquepale streak placed somewhat middle of the eyespot. Thepleura have white tips, sometimes this white colourextends slightly up the anterior and posterior margins.Carapace with a peculiar and very characteristic marblingof pale lines near the bases of the frontal horns. Legs notstreaked, but with very sharply defined irregular darkspots of a bluish or brownish colour, which often formincomplete rings around the various segments. Antennalflagella distinctly ringed --------- Ornate spiny lobster ------------------------ P. ornatus
(Fatima, 2000; Holthuis, 1991; Chhapgar and Deshmukh, 1964; Government of Pakistan, 1960).
27a. Antennular plate with 2 strong spines; surface of abdomi-nal somites naked and smooth Colour: abdominal somitesII to V with a white transverse band along the posteriormargin which, however, is not set off by dark bands. Colourof body and abdomen usually greyish green withoutspots. Tailfan of a rather uniform colour. Legs irregularlyspotted, not distinctly streaked -------------- Mud spinylobster --------- P. polyphagus
(Tirmizi and Ahsanullah, 1965).
112 Razia Sultana et al.
27b. Antennular plate with 4 strong spines arranged in aquadrangle. The whitish transverse bands along theposterior margin of the abdominal somites very distinctbecause they have a dark band in front and just behindthem - Painted spiny lobster ------------------ P. versicolor
(Tirmizi and Kazmi, 1983).
Lobster fisheries. The main fishing grounds for lobsters alongthe coast of Pakistan are shown in Fig. 2. Best lobsters interms of size and weight are caught along Karachi coast thoughthe quantity is low; other important fishing grounds arelocated along Balochistan coast (Ormara, Pasni, Gwader andJiwani). The spiny lobsters, after being caught, are mostlykept alive in seawater cages in shallow submerged areas ofthe coast and at processing units till they are either locallymarketed or exported to other countries. The average size ofspiny lobsters is 106 mm carapace length (Tirmizi and Bashir,1975). Out of 16 recorded species, P. polyphagus was the onlyspecies exploited commercially; 83% of the samples studiedconsisted of P. polyphagus, whereas 16% comprised ofP. homarus, and 1% included Thenus orientalis and otherspecies. The magnitude of lobster fisheries is low despiteconsiderable species diversity. Total lobster catch during 1993to 2005 is presented in Fig. 3 (Marine Fisheries Department,2002) alongwith the total export and catch of lobsters sepa-rately from two maritime provinces viz Sindh and Balochistan.The lobster catch ranged between 615 to 1077 metric tonduring 1993-2004; the maximum catch was observed in 1999.Lobster catches were high from Balochistan during 1993 to1998 comprising of 62-73% of the total catch, whereas from1999 onwards more than 50 percent (57-73%) of the total catchwas obtained from Sindh coast; increase in lobster catch fromSindh coast was due to the intensification of catch effort alongSindh coast. Lobster fishing is conducted almost round theyear but the best catches were observed by the end of Augustto end of September, whereas, minimum or almost nil catcheswere observed in June, July and early August due to the strongsouthwest monsoon which limits fishing activities. Export oflobsters ranged between 66 to 288 metric tones (Table 1) andthe earnings ranged between Rs.6.3 to 75.8 million (1US$ =Rs.80).
Lobsters are exported in both the live and the frozen forms(whole, meat, tails) to USA, Japan, Saudi Arabia, Oman, Italy,The Netherlands, Hong Kong, Singapore, Belgium, France,Kuwait and Maldives (Marine Fisheries Department, 2002).
Biological studies. Present knowledge on lobster biology isbased exclusively on a project report conducted by Marine
Lobsters from Northern Arabian Sea 113
26' ," P A K I S T A N
IRAN { M E K R A N C O A S T
Fig.2. The main fishing grounds for lobsters along Pakistan coast.
I Sindh Balochistan -A- Total -c- Export 1
Fig. 3. Lobster catch during 1993 to 2004.
Table 1. Catch and export data of lobsters
Export
Frozen Value Live Value Total Total value meat, tail (Rs. in (met. (Rs. in quantity (Rs, in (met. tons) million) tons) million) (met. tons) n~illion)
Fisheries Department under a grant by Pakistan Agriculture Research Council (PARC, 1980). The study comprised of the information about the lobster species, habitat, fishing grounds, abundance, partial larval development, larval morphology, breeding season, fecundity and bionomics. The studies revealed that I? polyphagus (maximum total length: 37 cm) prefers muddy-cum-sandy bottom, close to the Indus River mouth at depths between 5-90 meters, generally at 40-50 meter depth, while I? homarus (maximum total length: 32 cm) normally inhabits rocky bottom, which are more common on northwest (Balochistan) coast. I? ornatus (maximum total length: 50 cm) was found in shallow coastal waters up to 10 meter depth mostly on muddy bottom including river Indus mouth, occasionally found in sandy areas. I? versicolor (maxi- mum total length: 32 cm) is found between 1 to 15 meter depth, in clear waters on rocky substrates (Paradise point, Buleji), this species tends to hide in rock crevices and corals; juve- niles are found in low salinity areas. I? penicillatus (maximum total length: 45 cm) inhabits clear water rocky substrates; it also hides under boulders and in crevices. Puerulus swelli is a rare species found in offshore deep waters (maximum total length: 5 cm). Thenus orientalis is found mostly from muddy areas along Indus deltaic areas (Fig. 2) in shallow waters of up to 100 meter depth; it is rarely found on Balochistan (Makran) coast (PARC, 1983).
Studies have been focused on I? polyphagus because of its abundance whereas little work has been carried on I? homarus. The size distribution of fished stock was between 6.5 cm to 24.5 cm tail length in I? polyphagus, whereas, for I? homarus, size range was 7.2-20 cm tail length. The sex ratio slightly varied both in I? polyphagus and I? homarus from typical 1 : 1 ratio and found to be 1.1 : 1 and 1.5: 1, respectively, during the four year study period from 1976- 1979. Phyllosama larvae of Panulirus were described from I-IX stage. Stomach contents of I? polyphagus revealed the presence of shell fragments of foraminiferans, bivalves, gastropods, juvenile crabs, crusta- cean remains (antennules, carapace, chelae, appendages, and gill rakers), fish eggs, fish scales, bones, vertebrae, sand grains and pebbles.
Hussain and Amjad (1980) worked on the breeding and fecundity of I? polyphagus. According to this study, berried females of I? polyphagus were found during the period October to May; the peak of breeding season was found during March-April. The eggs were oval in shape, average length of recently released eggs was 0.5023 mm, whereas, the breadth was 0.4255 mm. Fecundity was estimated as 83,960 to 790880 eggs (average = 306,700 + 58,000) from 30 berried
females ranging in tail length from139 mm to 211 mm andweighing between 130 to 360 g tail weights (measured fromanterior tip of the first abdominal terga to the tip of telson).Fecundity has a positive relationship with both tail length andtail weight of the lobster. Larval stages of lobsters collectedfrom plankton from near shore and offshore samples were alsostudied and described by Ghory et al. (2005). Nutritional valueand macro- and micro-nutrients of Panulirus sp. have beenstudied by Nisa et al. (1995).
Management. During the past decade, a number of interna-tional conventions included new obligations for managementactivities regulating ocean uses. The conventions (and codes)make explicit reference to protection of ecosystem features.The overarching convention in this respect is the Conventionon Biological Diversity (CBD). Other international legalinstruments include the UN Fish Stock Agreement and theFAO Code of Conduct. In response to these internationalagreements, national legislation and policies are required toincorporate ecosystem considerations more explicitly withinnational ocean management regimes. Pakistan is a signatoryto the above cited conventions and has taken some importantmeasures into consideration for the management of lobsterfisheries in Pakistan:
1. Minimum catchable size of lobsters. Minimum legal sizefor catch is <15.0 cm, i.e. lobsters of less than 15.0 cm are notallowed to be caught and when captured should be immedi-ately released back into the sea alive and shall not be landedor marketed.
2. Protection of berried females. No berried female shouldbe caught and when captured should be released immediatelyinto the sea alive
3. Protection of soft shelled lobsters. Protection of soft shelledor newly moulted lobster is considered necessary becausemoulting precedes mating (reproductive cycle).
Fisheries management in Pakistan is generally carried outthrough licensing, indicating exploitable stocks, designatingthe environmental friendly fishing gears and methods and byenforcing restrictions with regard to the closed season andclosed areas. Pakistan also adopted guide lines to the code ofconduct for responsible fisheries laid down by FAO. Thereare various regulations formulated within the country formanagement of fishing in Exclusive Fishing Zone (EEZ ofthe country (Regulation of Fishing Act, 1975, amended 1993;the Sindh Fisheries Ordinance, 1980; the Balochistan SeaFisheries Act No. IX, 1971). Co-operation among fishermen,scientists, and government agencies is important for imple-
mentation, which at present, is lacking. There is a need foreffective management programmes for sustainable utilizationof lobster resources. Research on population dynamics,effects of dwindling habitats on various populations andstocks assessment are urgently needed. In addition, legalimplementation of fishing regulations, creation of awarenessamong fishers on the negative impact of over-fishing andmarketing of egg-bearing lobsters and juveniles are the mostimportant aspects, which have not been given due consider-ation. There is a need of adopting less destructive methodslike use of lobster traps and to educate the fishermen torelease egg-bearing lobsters. Pakistan has no commercialfishing fleet to explore the deep sea resources; the rights fordeep sea fishing have been given to various foreign countriesthrough licensing. Deep sea fishing zone and catch, both arenot inspected or documented by any agency. It may be inferredthat deep sea forms of Pakistani waters are still unexploited.
AcknowledgementThe authors are grateful to Prof. Dr. L.B. Holthuis of Leiden,The Netherlands for promptly answering queries relevant toresearch on decapod Crustaceans of Pakistan including thelobsters. Dr. Holthuis has also very kindly provided muchneeded literature on lobsters. The efforts of Mr. MohammedWasim of the Marine Fisheries Department, Government ofPakistan are also acknowledged for providing some data.
References
Ahsanullah, M. 1965. A contribution to the systematic studyof family Palinuridae. Agriculture Pakistan 16: 385-392.
Ahyong, Shane T., O’Meally, Denis O. 2004. Phylogeny of theDecapoda Reptantia: Resolution using three molecularloci and morphology. The Raffles Bulletin of Zoology 52:673-693.
Alcock, A., Anderson, A.R.S. 1894. Natural history notes fromH. M. Indian Marine Survey Steamer “Investigator, com-mander C. F. Oldham, R. N., commanding. Series II, no.14.An account of a recent collection of deep sea Crustaceafrom the Bay of Bengal and Laccadive Sea. Journal ofThe Asiatic Society of Bengal (II. Natural Sciences) 63:141-185.
Ali, S. 1987. Lobster Fisheries. Pakistan Sea Food Digest,November 1987, p. 21.
Burton, T.E., Davie, P.J.F. 2007. A revision of the shovel-nosedlobsters of the genus Thenus (Crustacea: Decapoda:Scyllaridae), with descriptions of three new species.Zootaxa 1429: 1-38.
114 Razia Sultana et al.
Chhapgar, B.F., Deshmukh, S.K. 1964. Further records oflobsters from Bombay. The Journal of Bombay NaturalHistory Society 61: 203-207.
Dixon, C.J., Ahyong, S.T., Schram, F.R. 2003. A new hypothesisof decapod phylogeny. Crustaceana 76: 935-975.
Fatima, M. 2000. Occurrence of Panulirus ornatus Fabriciusfrom coastal waters of Karachi (Pakistan). PakistanJournal of Biological Sciences 3: 362.
George, M.J. 1969. Two new records of scyllarid lobstersfrom the Arabian Sea. Journal of Marine BiologicalAssociation of India 9: 433-435.
Ghory, F.S., Kazmi, Q.B., Akhtar, N., Roohi, Z., Bano, H. 2005.Some development stages of spiny lobsters collectedfrom the northern Arabian Sea. Pakistan Journal ofMarine Sciences 14: 145-156.
Government of Pakistan 1960. Report on the ExploratoryFishing on the Coast of West Pakistan, 14 p., FisheriesDepartment.
Holthuis, L.B. 1991. FAO Species Catalogue. Marine Lobstersof the World. FAO Fisheries Synopsis. 13: 1-292.
Holthuis, L.B. 1985. A revision of the family Scyllaridae(Crustacea; Decapoda; Macrura). I. subfamily Ibacinae.Zoologistche Verhandelingeh 218: 1-130.
Holthuis, L.B. 1984. Lobsters from Western Indian Ocean(Fishery Area, 51). W. Fischer, and G. Bianchi (eds.), vol. 5,pp. 1-65. FAO Species Identification Sheets for FisheryPurpose.
Hussain, Z. 1958. Spiny lobster fishery of West Pakistan coast[Arabian Sea]. Agricultural Pakistan 19: 213-222.
Husain, M., Amjad, S. 1980. A study of breeding and fecun-dity of spiny lobster Panulirus polyphagus Herbst(Decapoda, Palinuridae) occurring along Pakistan coast[Arabian Sea]. Pakistan Journal of Agricultural Research1: 9-13.
Kazmi, Q.B. 2004. An annotated checklist of Pakistani marinelobster species. Marine Reference Collection andResource Center, Unpublished Report, pp. 1-3.
Kazmi, Q.B. 2003. Taxonomic studies of Crustaceans in Pakistan.Global Taxonomy initiative in Asia. Report, Proceeding of1st GIT Regional Workshop in Asia Putrajaya, Malaysia,J. Shimura (ed.), vol. 175, pp. 230-248, National Institutefor Environmental Studies, Japan.
Kazmi, Q.B. 1995. Note on a recently collected spiny lobster,
Panulirus homarus (Linnaeus, 1758) from Pakistanwaters. MRC Newsletter 4: 4.
Kurian, C.V. 1967. Further observations on deep water lobstersin the collections of R.V. Conch. Bulletin Department ofMarine Biology and Oceanography 3: 131-135.
Macpherson, E. 1990. Crustacea Decapoda: On a collection ofNephropidae from the Indian Ocean and western pacificIn: Resultats Des Campagnes MUSORSTOM, A. Crosnier(ed.), vol. 6, Memories du Museum National d’HistoriteNaturelle, Paris 145: 1-388.
Marine Fisheries Department, 2002. Hand Book of FisheryStatistics of Pakistan, vol. 18, 251 p., Marine FisheriesDepartment, Fish Horbour, West Wharf, Pakistan.
Martin, J.W., Davis, G.E. 2001. An updated classification of therecent Crustacea. Natural History Museum Los AngelesCounty, Scientific Series 39: 1-142.
Moazzam, M., Kazmi, Q.B., Rizvi, S.H.N., Husain, M. 2003.On some marine Decapods from the Pakistani waters.Pakistan Journal of Marine Sciences 12: 75-181.
Nisa, K., Fatima, R., Qadri, R.B., Khan, F.A., Mahmood, S.N.1995. Proximate composition and macro- and micro-nutrients in finfish and shellfish from Pakistan coastalarea. Tropical Science 35: 156-160.
PARC, 1980. Lobster research scheme. 6th Annual Report(unpublished), pp. 1-47, Directorate of Marine Fisheries.
PARC, 1983. Survey of fish and shellfish (Mollusca andhiger Crustacea) of Baluchistan coast. 1st Annual Report(unpublished), 172 p.
Pollock, D.E. 1993. Speciation in spiny lobsters- clues toclimatically induced changes in ocean circulationpatterns. Bulletin of Marine Science 53: 937-944.
Pollock, D.E., Cockcroft, A.C., Groeneveld, J.C., Schoeman,D.S. 2000. The commercial fisheries for Jasus andPalinurus species in the south east Atlantic and South-west Indian Ocean. In: Spiny lobsters-Fisheries andCulture, B.F. Phillips and J. Kittaka (eds.), Chapter 5,pp. 105-120.
Prasad, R.R., Tampi, P.R.S. 1968. On the distribution ofpalinurid and scyllarid lobsters in the Indian Ocean.Journal of Marine Biological Association of India 10:78-87.
Ramadan, M.M. 1938. The Astacura and Palinura. ScientificReport, John Murray Expedition 5: 123-145.
Tirmizi, N.M., Kazmi, Q.B. 1989. Guide to the Malacostracaof the Northern Arabian sea. Project No. S.KU 167,Pakistan Science Foundation, pp. 1-78.
Tirmizi, N.M., Kazmi, Q.B. 1983. Carcinological studies in
115Lobsters from Northern Arabian Sea
116 Razia Sultana et al.
Pakistan, with remarks on species to the Red Sea andthe Mediterranean. In: Marine Sciences in the Red SeaBulletin of Institute of Oceanography and Fisheries,vol. 9, pp. 347-380, (Published in cooperation withAIBS).
Tirmizi, N.M., Bashir, Q. 1975. Observations on crustaceanfisheries of Pakistan. Meimograph, Chamber of Commerce
and Industry, Karachi, Pakistan, pp. 1-6.Tirmizi, N.M., Ahsanullah, M. 1965. Preliminary report on the
lobsters of West Pakistan coast. Pakistan Journal ofScientific and Industrial Research 9: 387-391.
Williams, A.B. 1986. Lobsters of the World. An illustratedguide. Additional material by I. Dore, Osprey Books andScandinavian Fishing year book: 186 p.