95
| Date post: | 30-May-2018 |
| Category: |
Documents |
| Upload: | texas-school-survey-of-drug-and-alcohol-use |
| View: | 213 times |
| Download: | 0 times |

8/14/2019 PALO PINTO COUNTY - Gordon ISD - 2000 Texas School Survey of Drug and Alcohol Use
http://slidepdf.com/reader/full/palo-pinto-county-gordon-isd-2000-texas-school-survey-of-drug-and-alcohol 1/95
8/14/2019 PALO PINTO COUNTY - Gordon ISD - 2000 Texas School Survey of Drug and Alcohol Use
http://slidepdf.com/reader/full/palo-pinto-county-gordon-isd-2000-texas-school-survey-of-drug-and-alcohol 2/95
GordonSpring 2000
______________________________________________________________________________________________
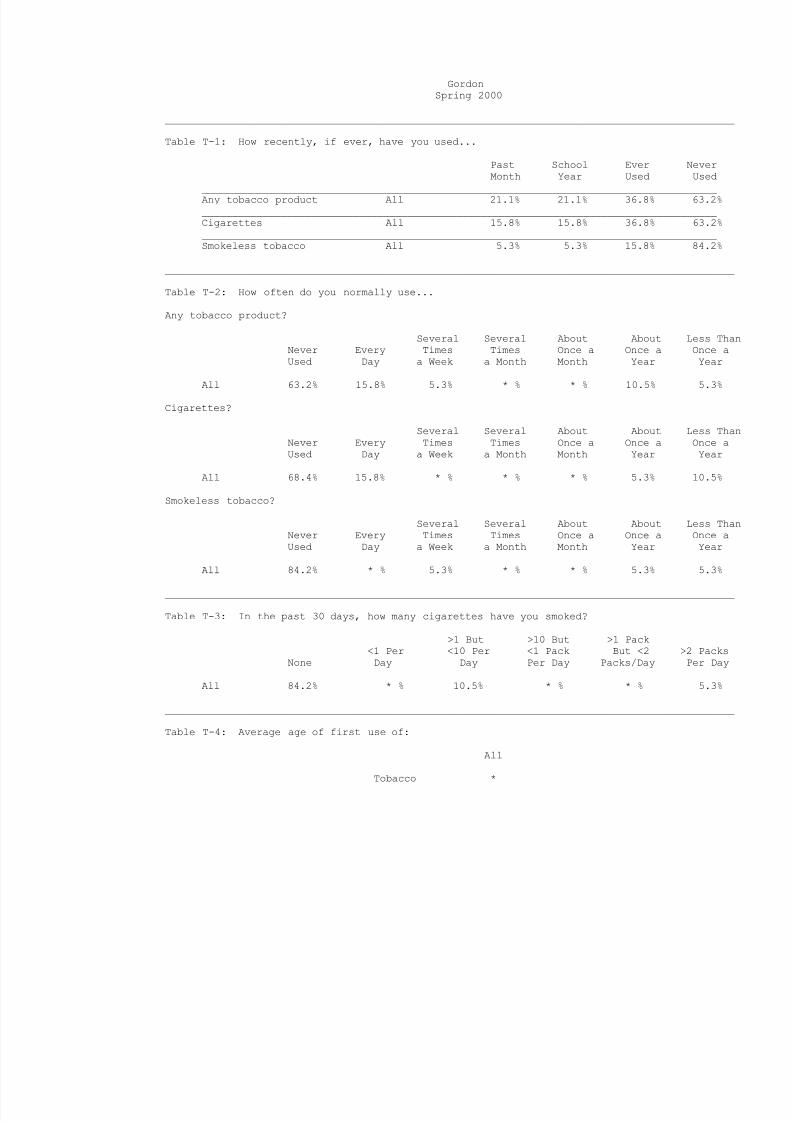
Table T-1: How recently, if ever, have you used...
Past School Ever NeverMonth Year Used Used
_____________________________________________________________________________________Any tobacco product All 21.1% 21.1% 36.8% 63.2%_____________________________________________________________________________________Cigarettes All 15.8% 15.8% 36.8% 63.2%_____________________________________________________________________________________Smokeless tobacco All 5.3% 5.3% 15.8% 84.2%
______________________________________________________________________________________________
Table T-2: How often do you normally use...
Any tobacco product?
Several Several About About Less ThanNever Every Times Times Once a Once a Once aUsed Day a Week a Month Month Year Year
All 63.2% 15.8% 5.3% * % * % 10.5% 5.3%
Cigarettes?
Several Several About About Less ThanNever Every Times Times Once a Once a Once aUsed Day a Week a Month Month Year Year
All 68.4% 15.8% * % * % * % 5.3% 10.5%
Smokeless tobacco?
Several Several About About Less ThanNever Every Times Times Once a Once a Once aUsed Day a Week a Month Month Year Year
All 84.2% * % 5.3% * % * % 5.3% 5.3%
______________________________________________________________________________________________
Table T-3: In the past 30 days, how many cigarettes have you smoked?
>1 But >10 But >1 Pack<1 Per <10 Per <1 Pack But <2 >2 Packs
None Day Day Per Day Packs/Day Per Day
All 84.2% * % 10.5% * % * % 5.3%
______________________________________________________________________________________________
Table T-4: Average age of first use of:
All
Tobacco *
8/14/2019 PALO PINTO COUNTY - Gordon ISD - 2000 Texas School Survey of Drug and Alcohol Use
http://slidepdf.com/reader/full/palo-pinto-county-gordon-isd-2000-texas-school-survey-of-drug-and-alcohol 3/95
GordonSpring 2000
______________________________________________________________________________________________
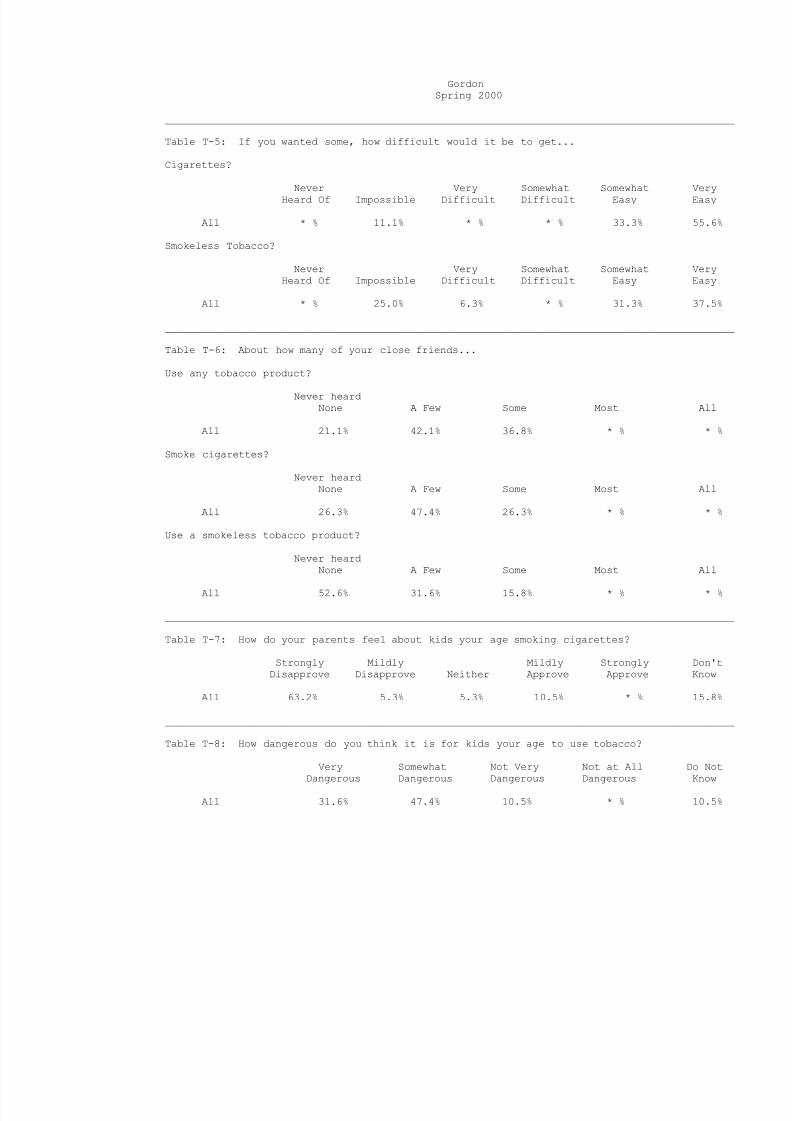
Table T-5: If you wanted some, how difficult would it be to get...
Cigarettes?
Never Very Somewhat Somewhat VeryHeard Of Impossible Difficult Difficult Easy Easy
All * % 11.1% * % * % 33.3% 55.6%
Smokeless Tobacco?
Never Very Somewhat Somewhat VeryHeard Of Impossible Difficult Difficult Easy Easy
All * % 25.0% 6.3% * % 31.3% 37.5%
______________________________________________________________________________________________
Table T-6: About how many of your close friends...
Use any tobacco product?
Never heardNone A Few Some Most All
All 21.1% 42.1% 36.8% * % * %
Smoke cigarettes?
Never heardNone A Few Some Most All
All 26.3% 47.4% 26.3% * % * %
Use a smokeless tobacco product?
Never heardNone A Few Some Most All
All 52.6% 31.6% 15.8% * % * %
______________________________________________________________________________________________
Table T-7: How do your parents feel about kids your age smoking cigarettes?
Strongly Mildly Mildly Strongly Don'tDisapprove Disapprove Neither Approve Approve Know
All 63.2% 5.3% 5.3% 10.5% * % 15.8%
______________________________________________________________________________________________
Table T-8: How dangerous do you think it is for kids your age to use tobacco?
Very Somewhat Not Very Not at All Do Not
Dangerous Dangerous Dangerous Dangerous Know
All 31.6% 47.4% 10.5% * % 10.5%
8/14/2019 PALO PINTO COUNTY - Gordon ISD - 2000 Texas School Survey of Drug and Alcohol Use
http://slidepdf.com/reader/full/palo-pinto-county-gordon-isd-2000-texas-school-survey-of-drug-and-alcohol 4/95
GordonSpring 2000
______________________________________________________________________________________________
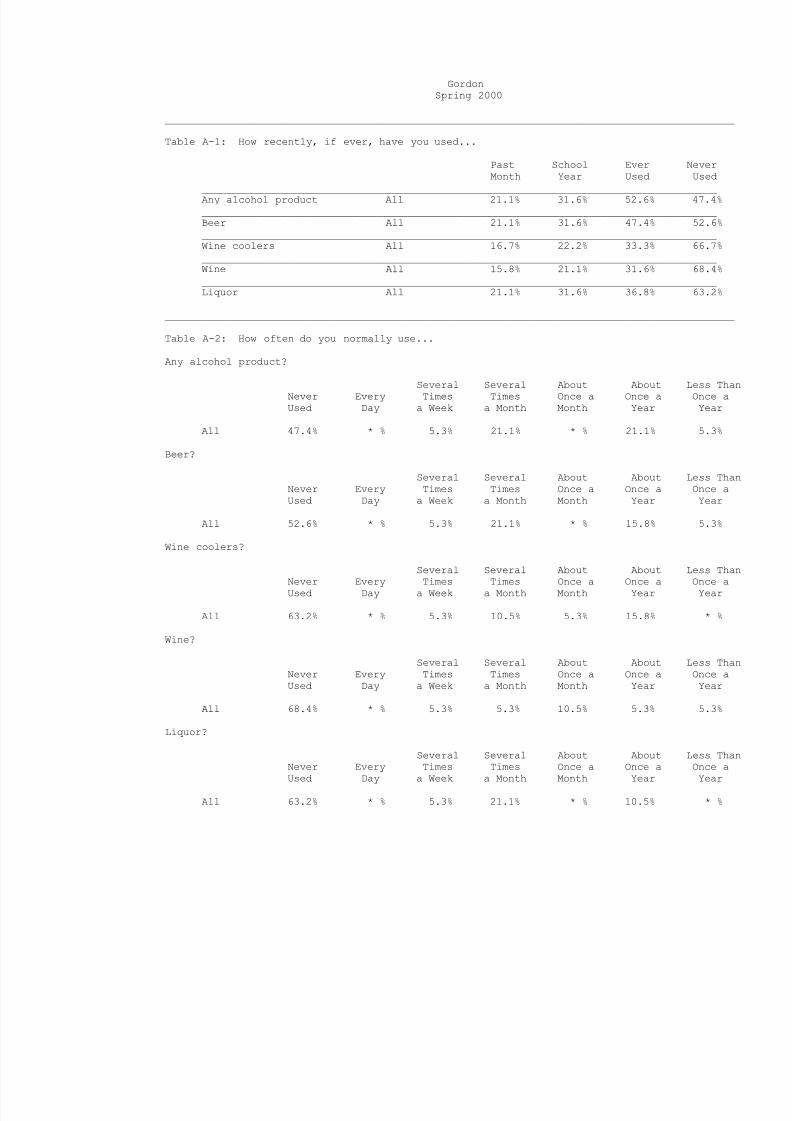
Table A-1: How recently, if ever, have you used...
Past School Ever NeverMonth Year Used Used
_____________________________________________________________________________________Any alcohol product All 21.1% 31.6% 52.6% 47.4%_____________________________________________________________________________________Beer All 21.1% 31.6% 47.4% 52.6%_____________________________________________________________________________________Wine coolers All 16.7% 22.2% 33.3% 66.7%_____________________________________________________________________________________Wine All 15.8% 21.1% 31.6% 68.4%_____________________________________________________________________________________Liquor All 21.1% 31.6% 36.8% 63.2%
______________________________________________________________________________________________
Table A-2: How often do you normally use...
Any alcohol product?
Several Several About About Less ThanNever Every Times Times Once a Once a Once aUsed Day a Week a Month Month Year Year
All 47.4% * % 5.3% 21.1% * % 21.1% 5.3%
Beer?
Several Several About About Less ThanNever Every Times Times Once a Once a Once aUsed Day a Week a Month Month Year Year
All 52.6% * % 5.3% 21.1% * % 15.8% 5.3%
Wine coolers?
Several Several About About Less Than
Never Every Times Times Once a Once a Once aUsed Day a Week a Month Month Year Year
All 63.2% * % 5.3% 10.5% 5.3% 15.8% * %
Wine?
Several Several About About Less ThanNever Every Times Times Once a Once a Once aUsed Day a Week a Month Month Year Year
All 68.4% * % 5.3% 5.3% 10.5% 5.3% 5.3%
Liquor?
Several Several About About Less ThanNever Every Times Times Once a Once a Once a
Used Day a Week a Month Month Year Year
All 63.2% * % 5.3% 21.1% * % 10.5% * %
8/14/2019 PALO PINTO COUNTY - Gordon ISD - 2000 Texas School Survey of Drug and Alcohol Use
http://slidepdf.com/reader/full/palo-pinto-county-gordon-isd-2000-texas-school-survey-of-drug-and-alcohol 5/95
GordonSpring 2000
______________________________________________________________________________________________
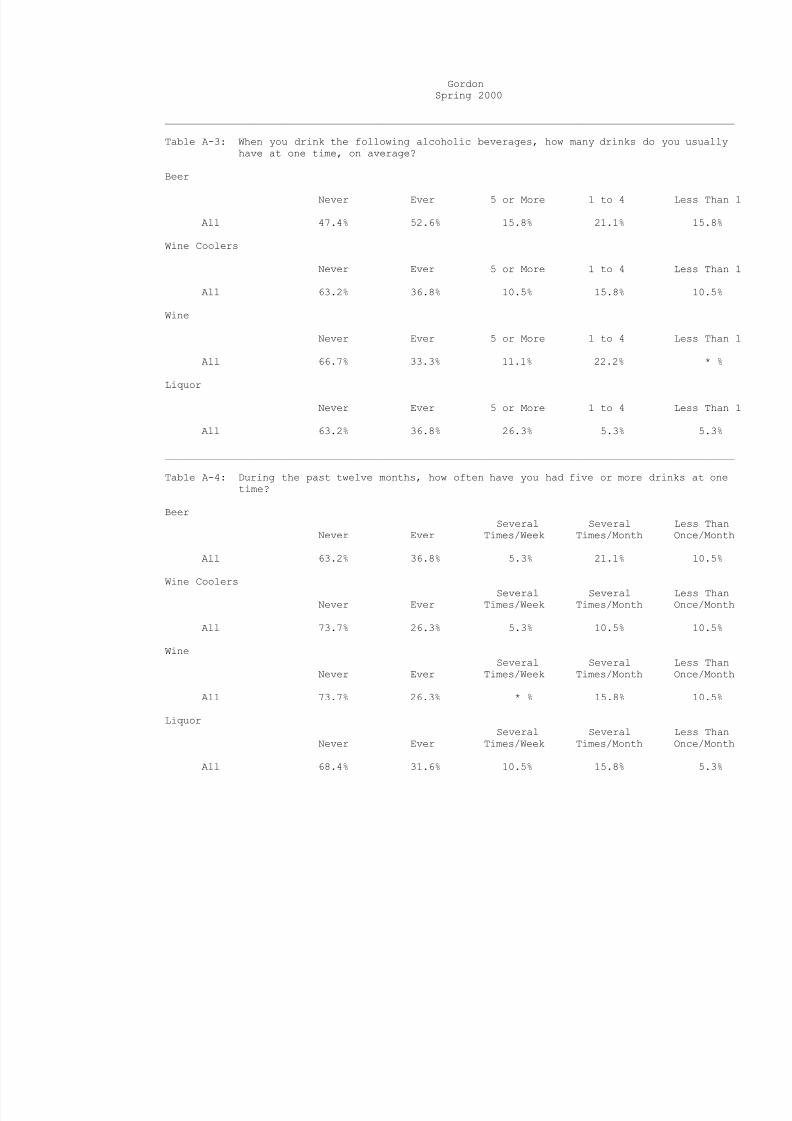
Table A-3: When you drink the following alcoholic beverages, how many drinks do you usuallyhave at one time, on average?
Beer
Never Ever 5 or More 1 to 4 Less Than 1
All 47.4% 52.6% 15.8% 21.1% 15.8%
Wine Coolers
Never Ever 5 or More 1 to 4 Less Than 1
All 63.2% 36.8% 10.5% 15.8% 10.5%
Wine
Never Ever 5 or More 1 to 4 Less Than 1
All 66.7% 33.3% 11.1% 22.2% * %
Liquor
Never Ever 5 or More 1 to 4 Less Than 1
All 63.2% 36.8% 26.3% 5.3% 5.3%
______________________________________________________________________________________________
Table A-4: During the past twelve months, how often have you had five or more drinks at onetime?
BeerSeveral Several Less Than
Never Ever Times/Week Times/Month Once/Month
All 63.2% 36.8% 5.3% 21.1% 10.5%
Wine Coolers Several Several Less ThanNever Ever Times/Week Times/Month Once/Month
All 73.7% 26.3% 5.3% 10.5% 10.5%
WineSeveral Several Less Than
Never Ever Times/Week Times/Month Once/Month
All 73.7% 26.3% * % 15.8% 10.5%
LiquorSeveral Several Less Than
Never Ever Times/Week Times/Month Once/Month
All 68.4% 31.6% 10.5% 15.8% 5.3%
8/14/2019 PALO PINTO COUNTY - Gordon ISD - 2000 Texas School Survey of Drug and Alcohol Use
http://slidepdf.com/reader/full/palo-pinto-county-gordon-isd-2000-texas-school-survey-of-drug-and-alcohol 6/95
GordonSpring 2000
______________________________________________________________________________________________
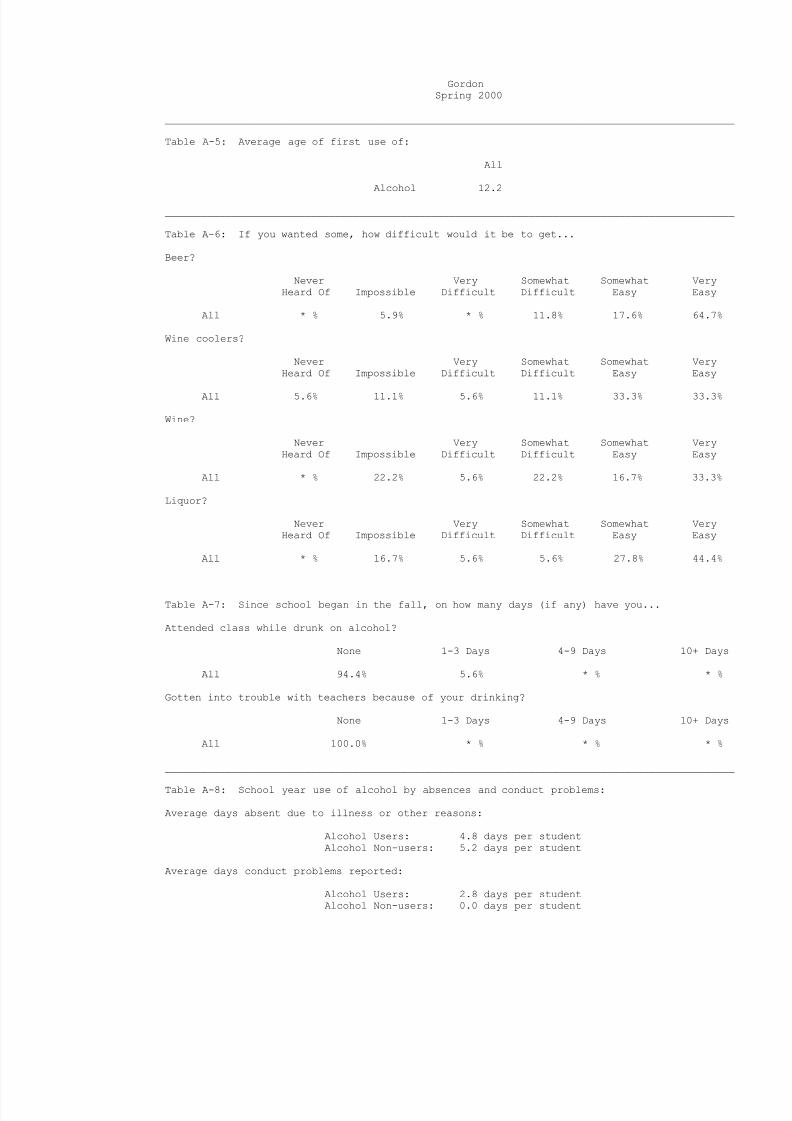
Table A-5: Average age of first use of:
All
Alcohol 12.2
______________________________________________________________________________________________
Table A-6: If you wanted some, how difficult would it be to get...
Beer?
Never Very Somewhat Somewhat VeryHeard Of Impossible Difficult Difficult Easy Easy
All * % 5.9% * % 11.8% 17.6% 64.7%
Wine coolers?
Never Very Somewhat Somewhat VeryHeard Of Impossible Difficult Difficult Easy Easy
All 5.6% 11.1% 5.6% 11.1% 33.3% 33.3%
Wine?
Never Very Somewhat Somewhat VeryHeard Of Impossible Difficult Difficult Easy Easy
All * % 22.2% 5.6% 22.2% 16.7% 33.3%
Liquor?
Never Very Somewhat Somewhat VeryHeard Of Impossible Difficult Difficult Easy Easy
All * % 16.7% 5.6% 5.6% 27.8% 44.4%
______________________________________________________________________________________________Table A-7: Since school began in the fall, on how many days (if any) have you...
Attended class while drunk on alcohol?
None 1-3 Days 4-9 Days 10+ Days
All 94.4% 5.6% * % * %
Gotten into trouble with teachers because of your drinking?
None 1-3 Days 4-9 Days 10+ Days
All 100.0% * % * % * %
______________________________________________________________________________________________
Table A-8: School year use of alcohol by absences and conduct problems:
Average days absent due to illness or other reasons:
Alcohol Users: 4.8 days per studentAlcohol Non-users: 5.2 days per student
Average days conduct problems reported:
Alcohol Users: 2.8 days per studentAlcohol Non-users: 0.0 days per student
8/14/2019 PALO PINTO COUNTY - Gordon ISD - 2000 Texas School Survey of Drug and Alcohol Use
http://slidepdf.com/reader/full/palo-pinto-county-gordon-isd-2000-texas-school-survey-of-drug-and-alcohol 7/95
8/14/2019 PALO PINTO COUNTY - Gordon ISD - 2000 Texas School Survey of Drug and Alcohol Use
http://slidepdf.com/reader/full/palo-pinto-county-gordon-isd-2000-texas-school-survey-of-drug-and-alcohol 8/95
GordonSpring 2000
______________________________________________________________________________________________
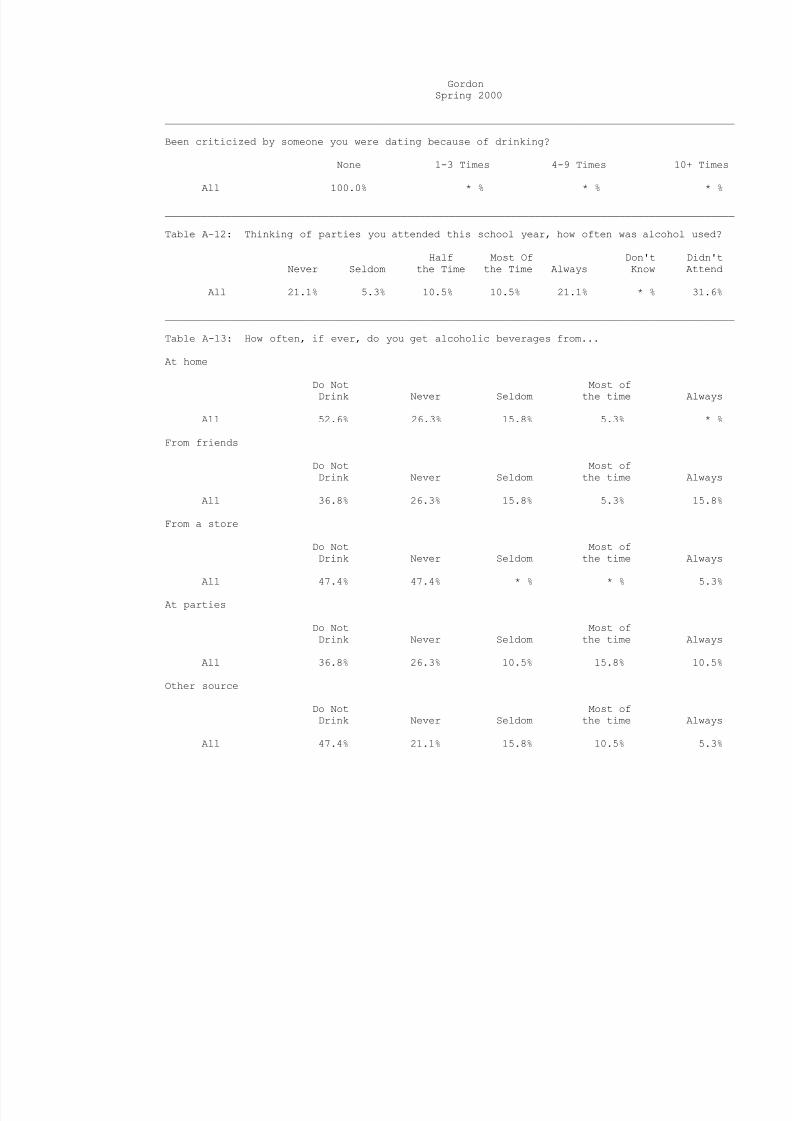
Been criticized by someone you were dating because of drinking?
None 1-3 Times 4-9 Times 10+ Times
All 100.0% * % * % * %
______________________________________________________________________________________________
Table A-12: Thinking of parties you attended this school year, how often was alcohol used?
Half Most Of Don't Didn'tNever Seldom the Time the Time Always Know Attend
All 21.1% 5.3% 10.5% 10.5% 21.1% * % 31.6%
______________________________________________________________________________________________
Table A-13: How often, if ever, do you get alcoholic beverages from...
At home
Do Not Most ofDrink Never Seldom the time Always
All 52.6% 26.3% 15.8% 5.3% * %
From friends
Do Not Most ofDrink Never Seldom the time Always
All 36.8% 26.3% 15.8% 5.3% 15.8%
From a store
Do Not Most ofDrink Never Seldom the time Always
All 47.4% 47.4% * % * % 5.3%At parties
Do Not Most ofDrink Never Seldom the time Always
All 36.8% 26.3% 10.5% 15.8% 10.5%
Other source
Do Not Most ofDrink Never Seldom the time Always
All 47.4% 21.1% 15.8% 10.5% 5.3%
8/14/2019 PALO PINTO COUNTY - Gordon ISD - 2000 Texas School Survey of Drug and Alcohol Use
http://slidepdf.com/reader/full/palo-pinto-county-gordon-isd-2000-texas-school-survey-of-drug-and-alcohol 9/95
GordonSpring 2000
______________________________________________________________________________________________
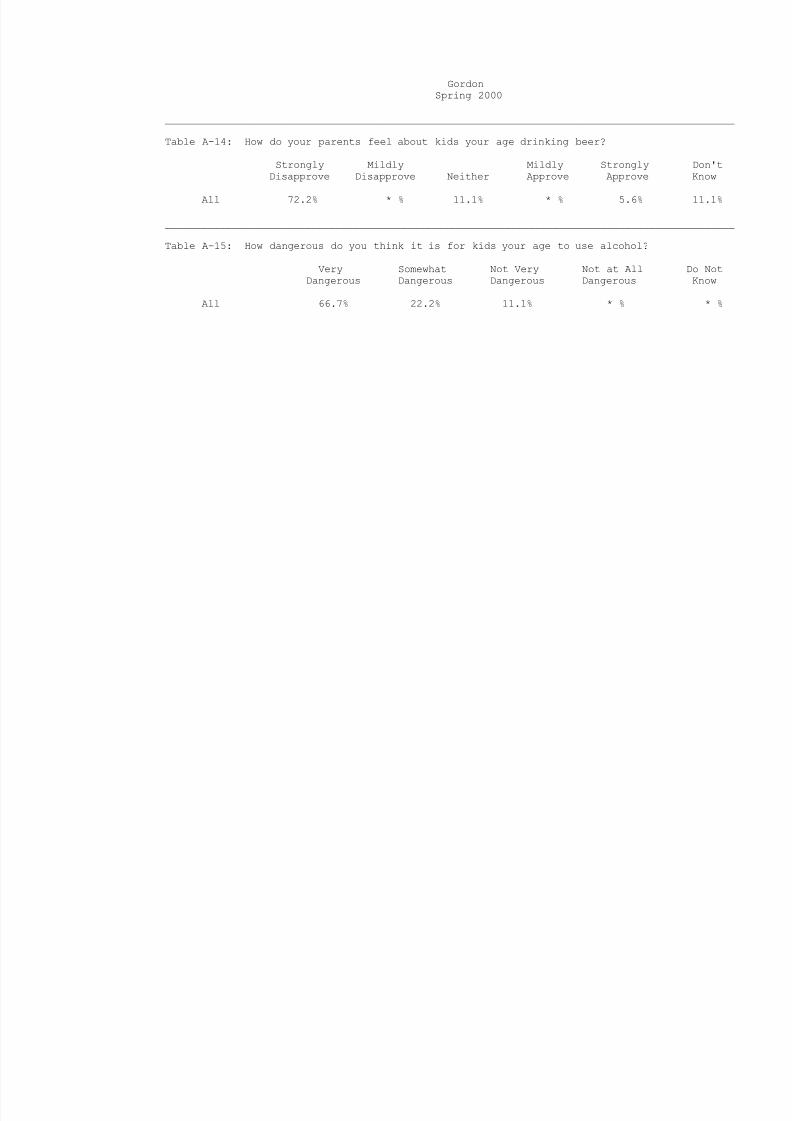
Table A-14: How do your parents feel about kids your age drinking beer?
Strongly Mildly Mildly Strongly Don'tDisapprove Disapprove Neither Approve Approve Know
All 72.2% * % 11.1% * % 5.6% 11.1%
______________________________________________________________________________________________
Table A-15: How dangerous do you think it is for kids your age to use alcohol?
Very Somewhat Not Very Not at All Do NotDangerous Dangerous Dangerous Dangerous Know
All 66.7% 22.2% 11.1% * % * %
8/14/2019 PALO PINTO COUNTY - Gordon ISD - 2000 Texas School Survey of Drug and Alcohol Use
http://slidepdf.com/reader/full/palo-pinto-county-gordon-isd-2000-texas-school-survey-of-drug-and-alcohol 10/95
GordonSpring 2000
______________________________________________________________________________________________
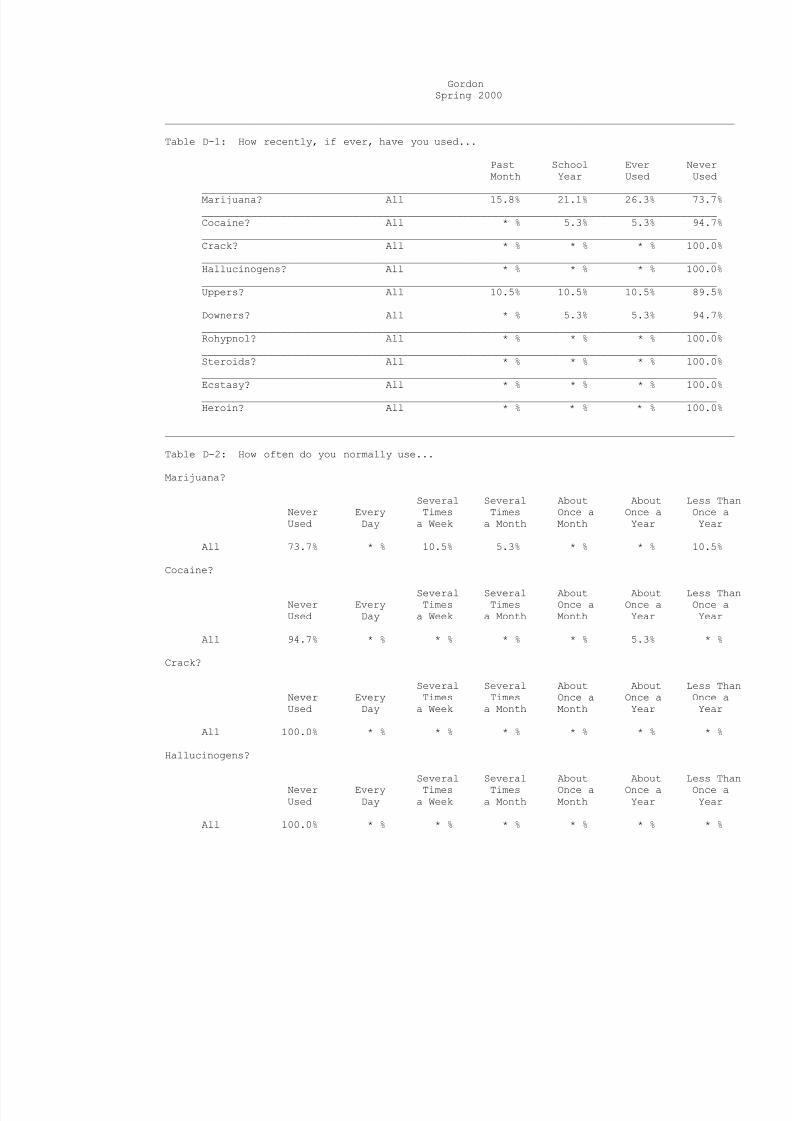
Table D-1: How recently, if ever, have you used...
Past School Ever NeverMonth Year Used Used
_____________________________________________________________________________________Marijuana? All 15.8% 21.1% 26.3% 73.7%_____________________________________________________________________________________Cocaine? All * % 5.3% 5.3% 94.7%_____________________________________________________________________________________Crack? All * % * % * % 100.0%_____________________________________________________________________________________Hallucinogens? All * % * % * % 100.0%_____________________________________________________________________________________Uppers? All 10.5% 10.5% 10.5% 89.5%_____________________________________________________________________________________Downers? All * % 5.3% 5.3% 94.7%_____________________________________________________________________________________Rohypnol? All * % * % * % 100.0%_____________________________________________________________________________________Steroids? All * % * % * % 100.0%_____________________________________________________________________________________Ecstasy? All * % * % * % 100.0%_____________________________________________________________________________________Heroin? All * % * % * % 100.0%
______________________________________________________________________________________________
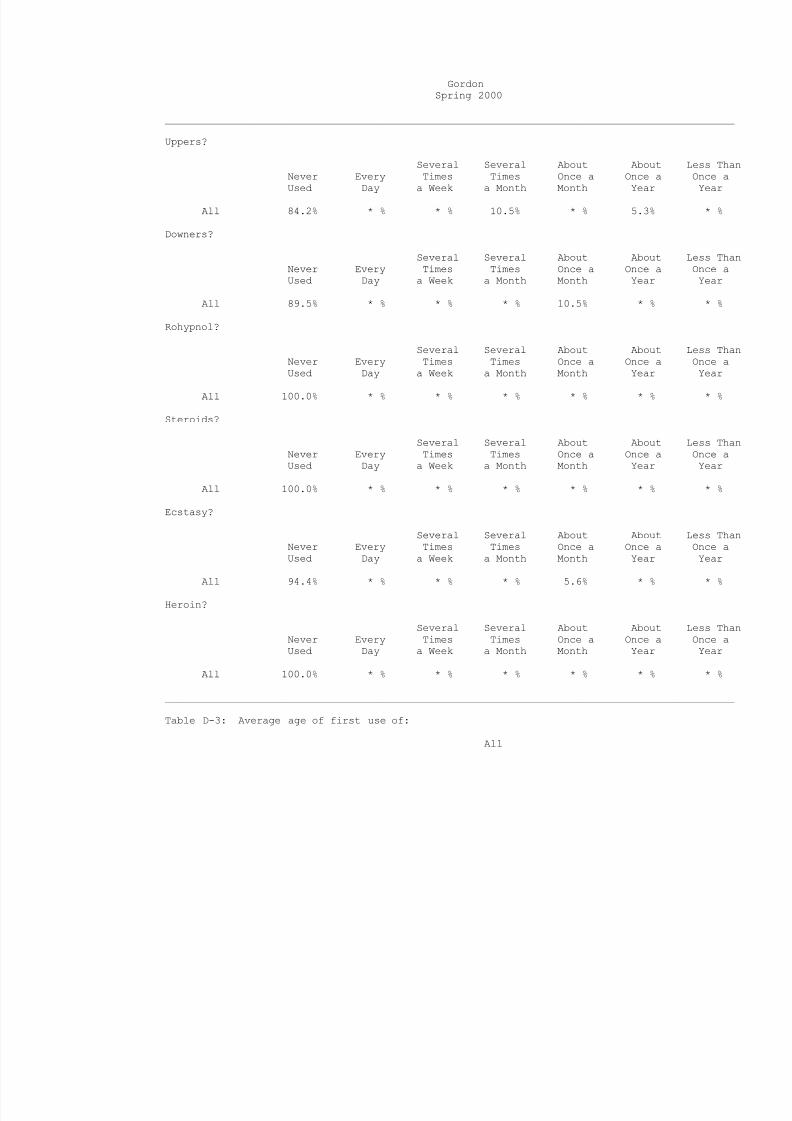
Table D-2: How often do you normally use...
Marijuana?
Several Several About About Less ThanNever Every Times Times Once a Once a Once aUsed Day a Week a Month Month Year Year
All 73.7% * % 10.5% 5.3% * % * % 10.5%
Cocaine?
Several Several About About Less ThanNever Every Times Times Once a Once a Once aUsed Day a Week a Month Month Year Year
All 94.7% * % * % * % * % 5.3% * %
Crack?
Several Several About About Less ThanNever Every Times Times Once a Once a Once aUsed Day a Week a Month Month Year Year
All 100.0% * % * % * % * % * % * %
Hallucinogens?
Several Several About About Less ThanNever Every Times Times Once a Once a Once aUsed Day a Week a Month Month Year Year
All 100.0% * % * % * % * % * % * %
8/14/2019 PALO PINTO COUNTY - Gordon ISD - 2000 Texas School Survey of Drug and Alcohol Use
http://slidepdf.com/reader/full/palo-pinto-county-gordon-isd-2000-texas-school-survey-of-drug-and-alcohol 11/95
GordonSpring 2000
______________________________________________________________________________________________
Uppers?
Several Several About About Less ThanNever Every Times Times Once a Once a Once aUsed Day a Week a Month Month Year Year
All 84.2% * % * % 10.5% * % 5.3% * %
Downers?
Several Several About About Less ThanNever Every Times Times Once a Once a Once aUsed Day a Week a Month Month Year Year
All 89.5% * % * % * % 10.5% * % * %
Rohypnol?
Several Several About About Less ThanNever Every Times Times Once a Once a Once aUsed Day a Week a Month Month Year Year
All 100.0% * % * % * % * % * % * %
Steroids?
Several Several About About Less ThanNever Every Times Times Once a Once a Once aUsed Day a Week a Month Month Year Year
All 100.0% * % * % * % * % * % * %
Ecstasy?
Several Several About About Less ThanNever Every Times Times Once a Once a Once aUsed Day a Week a Month Month Year Year
All 94.4% * % * % * % 5.6% * % * %Heroin?
Several Several About About Less ThanNever Every Times Times Once a Once a Once aUsed Day a Week a Month Month Year Year
All 100.0% * % * % * % * % * % * %
______________________________________________________________________________________________
Table D-3: Average age of first use of:
All
8/14/2019 PALO PINTO COUNTY - Gordon ISD - 2000 Texas School Survey of Drug and Alcohol Use
http://slidepdf.com/reader/full/palo-pinto-county-gordon-isd-2000-texas-school-survey-of-drug-and-alcohol 12/95
GordonSpring 2000
______________________________________________________________________________________________
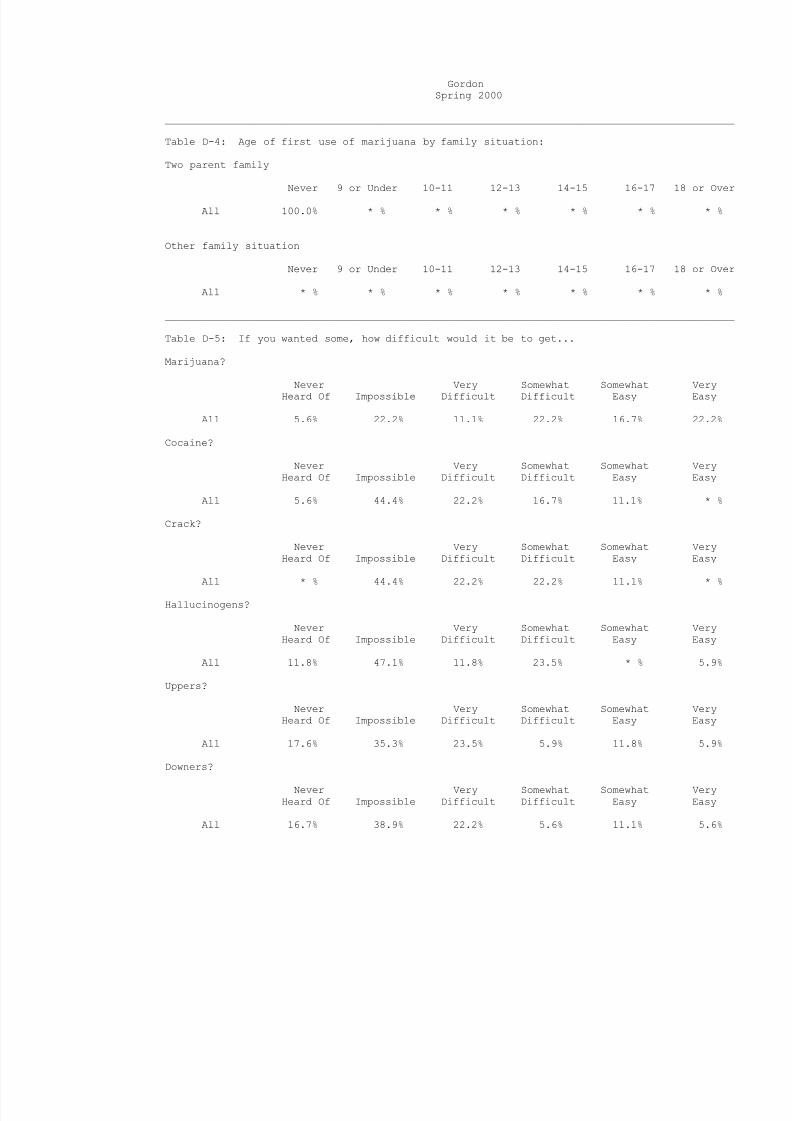
Table D-4: Age of first use of marijuana by family situation:
Two parent family
Never 9 or Under 10-11 12-13 14-15 16-17 18 or Over
All 100.0% * % * % * % * % * % * %
Other family situation
Never 9 or Under 10-11 12-13 14-15 16-17 18 or Over
All * % * % * % * % * % * % * %
______________________________________________________________________________________________
Table D-5: If you wanted some, how difficult would it be to get...
Marijuana?
Never Very Somewhat Somewhat VeryHeard Of Impossible Difficult Difficult Easy Easy
All 5.6% 22.2% 11.1% 22.2% 16.7% 22.2%
Cocaine?
Never Very Somewhat Somewhat VeryHeard Of Impossible Difficult Difficult Easy Easy
All 5.6% 44.4% 22.2% 16.7% 11.1% * %
Crack?
Never Very Somewhat Somewhat VeryHeard Of Impossible Difficult Difficult Easy Easy
All * % 44.4% 22.2% 22.2% 11.1% * %Hallucinogens?
Never Very Somewhat Somewhat VeryHeard Of Impossible Difficult Difficult Easy Easy
All 11.8% 47.1% 11.8% 23.5% * % 5.9%
Uppers?
Never Very Somewhat Somewhat VeryHeard Of Impossible Difficult Difficult Easy Easy
All 17.6% 35.3% 23.5% 5.9% 11.8% 5.9%
Downers?
Never Very Somewhat Somewhat VeryHeard Of Impossible Difficult Difficult Easy Easy
All 16.7% 38.9% 22.2% 5.6% 11.1% 5.6%
8/14/2019 PALO PINTO COUNTY - Gordon ISD - 2000 Texas School Survey of Drug and Alcohol Use
http://slidepdf.com/reader/full/palo-pinto-county-gordon-isd-2000-texas-school-survey-of-drug-and-alcohol 13/95
GordonSpring 2000
______________________________________________________________________________________________
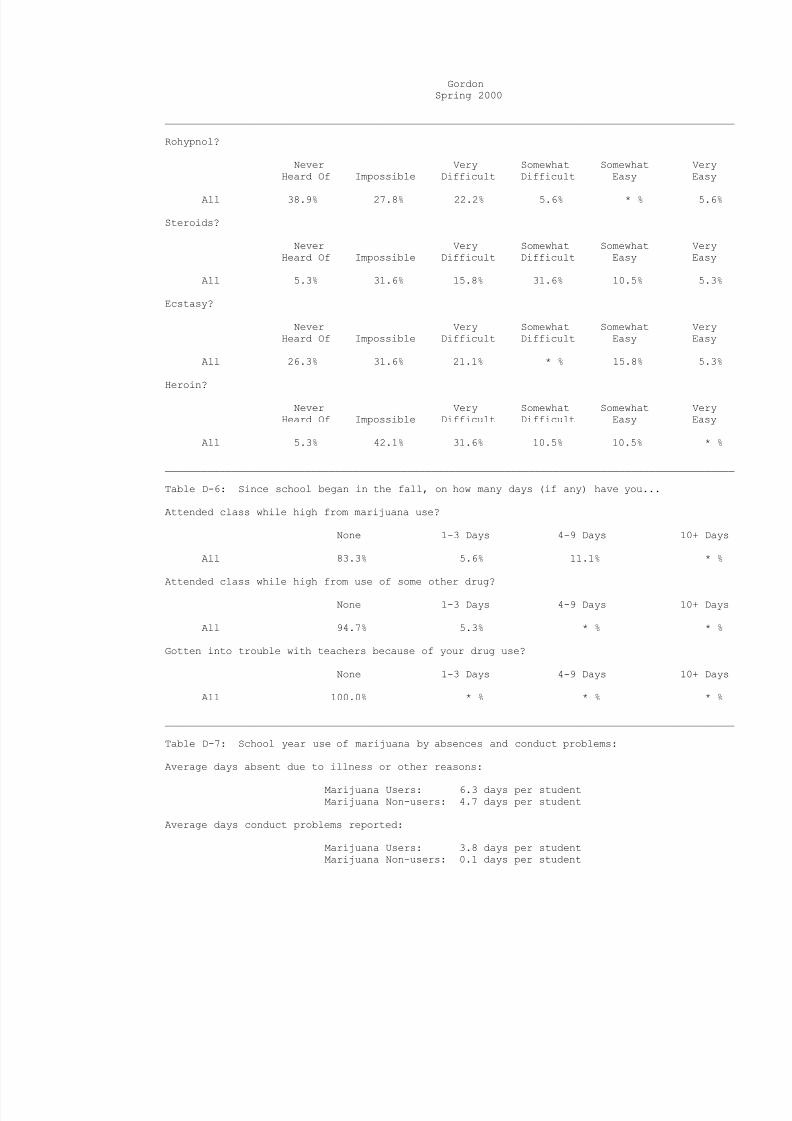
Rohypnol?
Never Very Somewhat Somewhat VeryHeard Of Impossible Difficult Difficult Easy Easy
All 38.9% 27.8% 22.2% 5.6% * % 5.6%
Steroids?
Never Very Somewhat Somewhat VeryHeard Of Impossible Difficult Difficult Easy Easy
All 5.3% 31.6% 15.8% 31.6% 10.5% 5.3%
Ecstasy?
Never Very Somewhat Somewhat VeryHeard Of Impossible Difficult Difficult Easy Easy
All 26.3% 31.6% 21.1% * % 15.8% 5.3%
Heroin?
Never Very Somewhat Somewhat VeryHeard Of Impossible Difficult Difficult Easy Easy
All 5.3% 42.1% 31.6% 10.5% 10.5% * %
______________________________________________________________________________________________
Table D-6: Since school began in the fall, on how many days (if any) have you...
Attended class while high from marijuana use?
None 1-3 Days 4-9 Days 10+ Days
All 83.3% 5.6% 11.1% * %
Attended class while high from use of some other drug?None 1-3 Days 4-9 Days 10+ Days
All 94.7% 5.3% * % * %
Gotten into trouble with teachers because of your drug use?
None 1-3 Days 4-9 Days 10+ Days
All 100.0% * % * % * %
______________________________________________________________________________________________
Table D-7: School year use of marijuana by absences and conduct problems:
Average days absent due to illness or other reasons:
Marijuana Users: 6.3 days per studentMarijuana Non-users: 4.7 days per student
Average days conduct problems reported:
Marijuana Users: 3.8 days per studentMarijuana Non-users: 0.1 days per student
8/14/2019 PALO PINTO COUNTY - Gordon ISD - 2000 Texas School Survey of Drug and Alcohol Use
http://slidepdf.com/reader/full/palo-pinto-county-gordon-isd-2000-texas-school-survey-of-drug-and-alcohol 14/95
GordonSpring 2000
______________________________________________________________________________________________
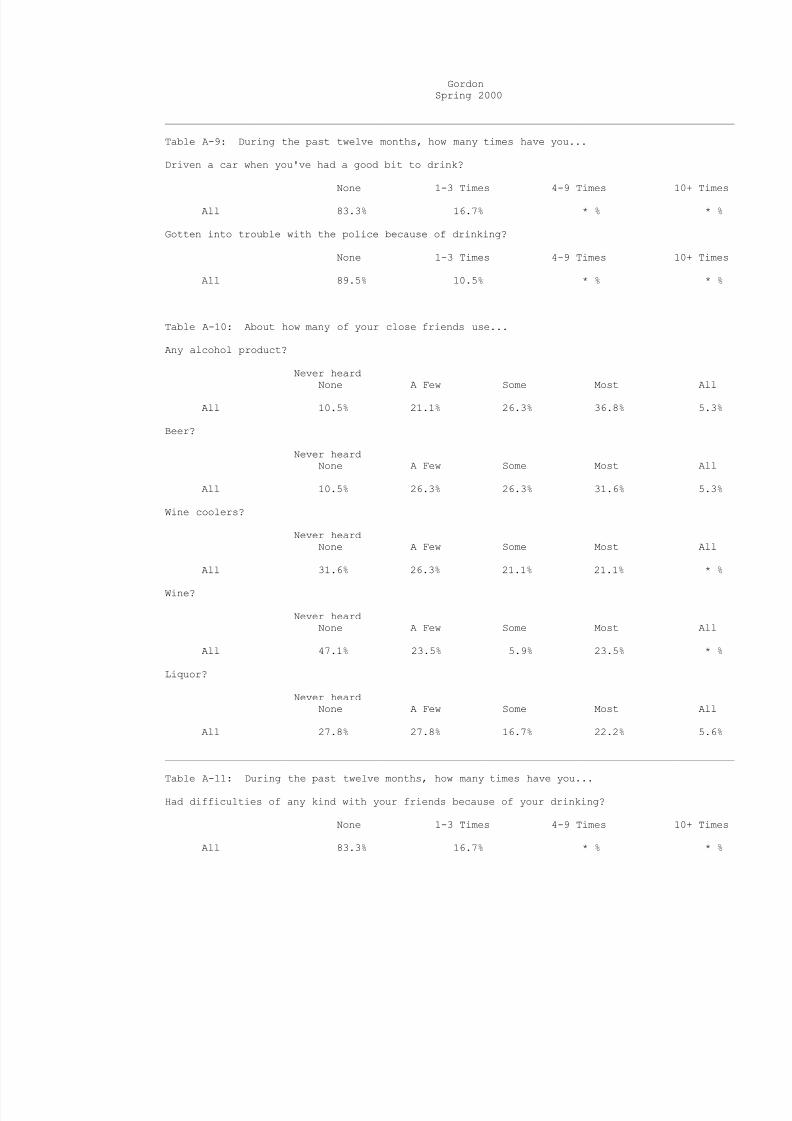
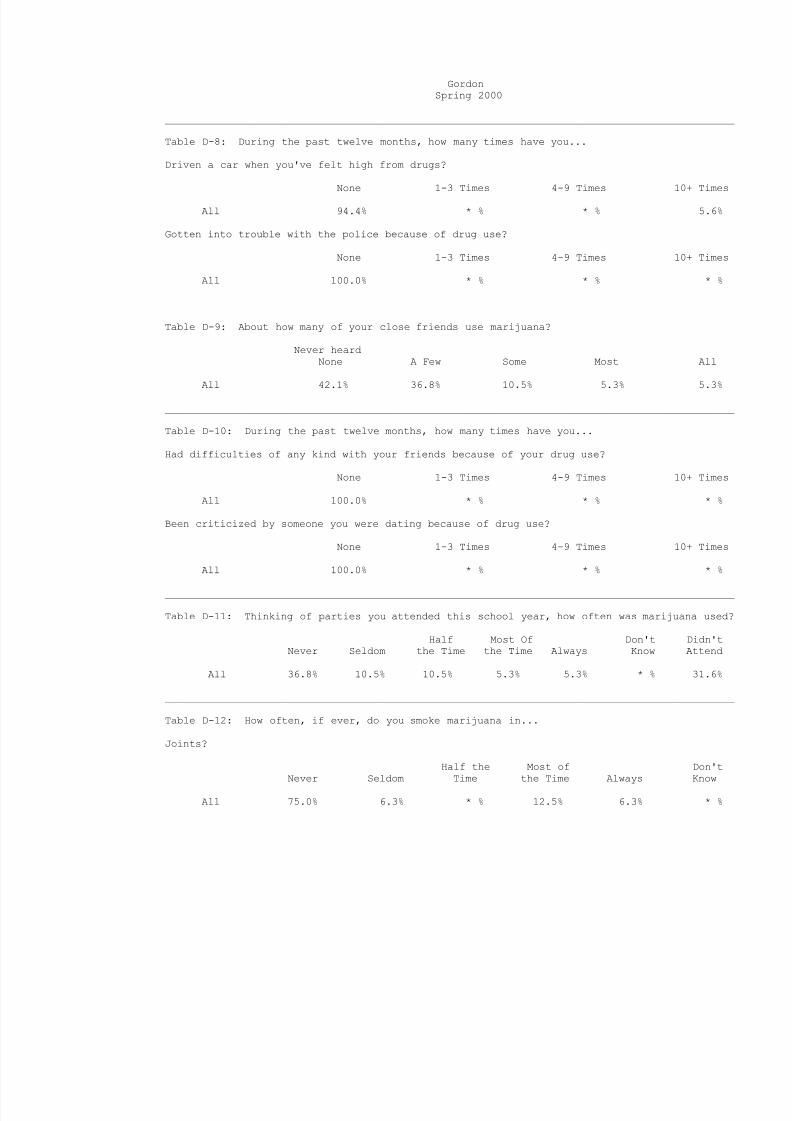
Table D-8: During the past twelve months, how many times have you...
Driven a car when you've felt high from drugs?
None 1-3 Times 4-9 Times 10+ Times
All 94.4% * % * % 5.6%
Gotten into trouble with the police because of drug use?
None 1-3 Times 4-9 Times 10+ Times
All 100.0% * % * % * %
______________________________________________________________________________________________
Table D-9: About how many of your close friends use marijuana?
Never heardNone A Few Some Most All
All 42.1% 36.8% 10.5% 5.3% 5.3%
______________________________________________________________________________________________
Table D-10: During the past twelve months, how many times have you...
Had difficulties of any kind with your friends because of your drug use?
None 1-3 Times 4-9 Times 10+ Times
All 100.0% * % * % * %
Been criticized by someone you were dating because of drug use?
None 1-3 Times 4-9 Times 10+ Times
All 100.0% * % * % * %
______________________________________________________________________________________________
Table D-11: Thinking of parties you attended this school year, how often was marijuana used?
Half Most Of Don't Didn'tNever Seldom the Time the Time Always Know Attend
All 36.8% 10.5% 10.5% 5.3% 5.3% * % 31.6%
______________________________________________________________________________________________
Table D-12: How often, if ever, do you smoke marijuana in...
Joints?
Half the Most of Don't
Never Seldom Time the Time Always Know
All 75.0% 6.3% * % 12.5% 6.3% * %
8/14/2019 PALO PINTO COUNTY - Gordon ISD - 2000 Texas School Survey of Drug and Alcohol Use
http://slidepdf.com/reader/full/palo-pinto-county-gordon-isd-2000-texas-school-survey-of-drug-and-alcohol 15/95
GordonSpring 2000
______________________________________________________________________________________________
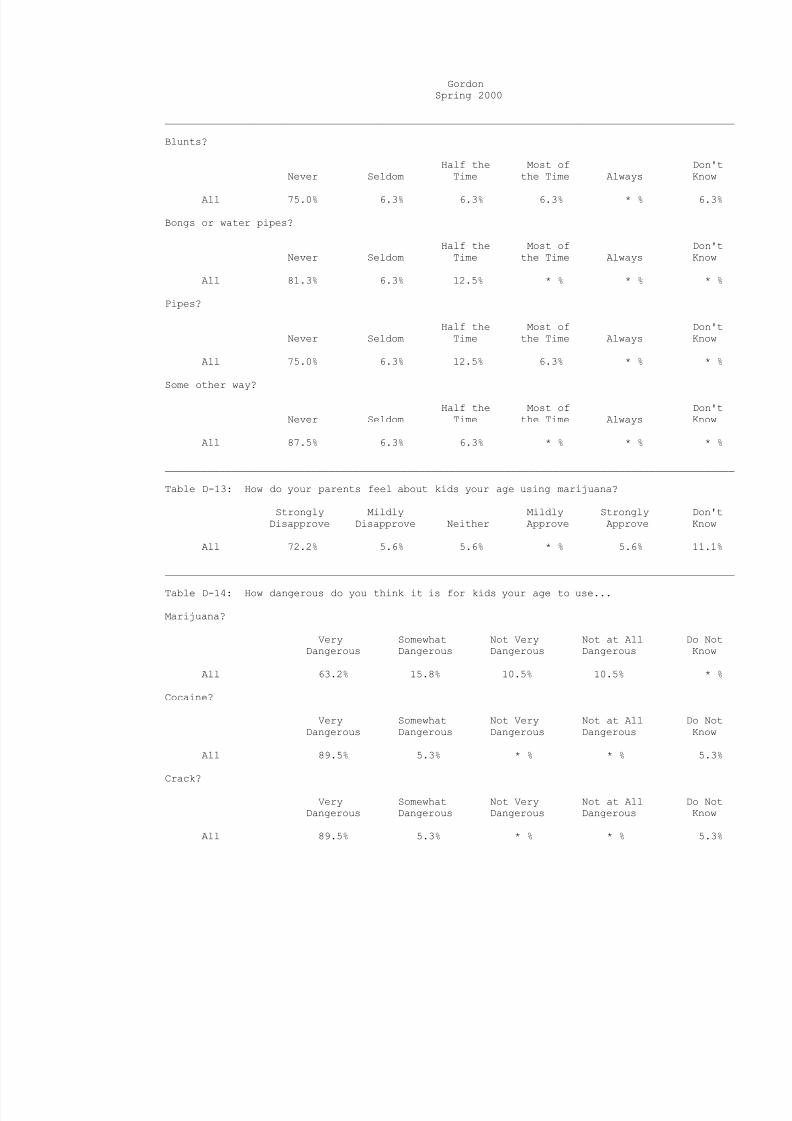
Blunts?
Half the Most of Don'tNever Seldom Time the Time Always Know
All 75.0% 6.3% 6.3% 6.3% * % 6.3%
Bongs or water pipes?
Half the Most of Don'tNever Seldom Time the Time Always Know
All 81.3% 6.3% 12.5% * % * % * %
Pipes?
Half the Most of Don'tNever Seldom Time the Time Always Know
All 75.0% 6.3% 12.5% 6.3% * % * %
Some other way?
Half the Most of Don'tNever Seldom Time the Time Always Know
All 87.5% 6.3% 6.3% * % * % * %
______________________________________________________________________________________________
Table D-13: How do your parents feel about kids your age using marijuana?
Strongly Mildly Mildly Strongly Don'tDisapprove Disapprove Neither Approve Approve Know
All 72.2% 5.6% 5.6% * % 5.6% 11.1%
______________________________________________________________________________________________
Table D-14: How dangerous do you think it is for kids your age to use...
Marijuana?
Very Somewhat Not Very Not at All Do NotDangerous Dangerous Dangerous Dangerous Know
All 63.2% 15.8% 10.5% 10.5% * %
Cocaine?
Very Somewhat Not Very Not at All Do NotDangerous Dangerous Dangerous Dangerous Know
All 89.5% 5.3% * % * % 5.3%
Crack?
Very Somewhat Not Very Not at All Do NotDangerous Dangerous Dangerous Dangerous Know
All 89.5% 5.3% * % * % 5.3%
8/14/2019 PALO PINTO COUNTY - Gordon ISD - 2000 Texas School Survey of Drug and Alcohol Use
http://slidepdf.com/reader/full/palo-pinto-county-gordon-isd-2000-texas-school-survey-of-drug-and-alcohol 16/95
GordonSpring 2000
______________________________________________________________________________________________
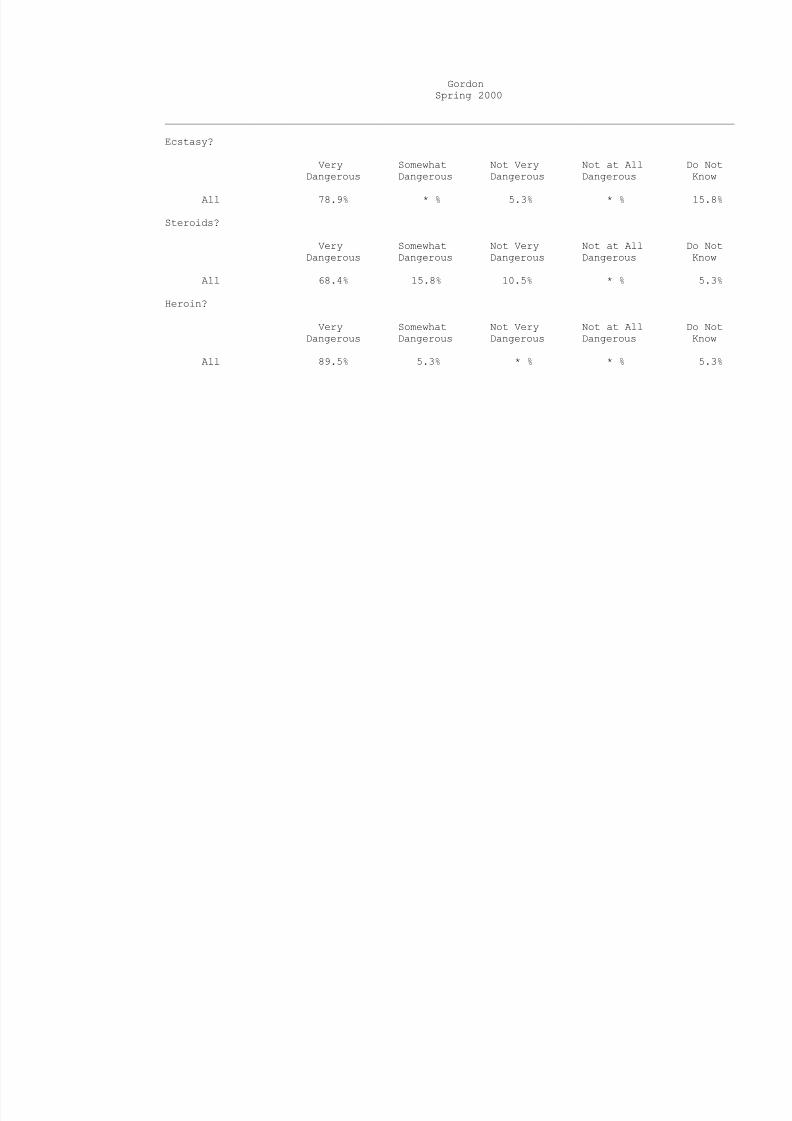
Ecstasy?
Very Somewhat Not Very Not at All Do NotDangerous Dangerous Dangerous Dangerous Know
All 78.9% * % 5.3% * % 15.8%
Steroids?
Very Somewhat Not Very Not at All Do NotDangerous Dangerous Dangerous Dangerous Know
All 68.4% 15.8% 10.5% * % 5.3%
Heroin?
Very Somewhat Not Very Not at All Do NotDangerous Dangerous Dangerous Dangerous Know
All 89.5% 5.3% * % * % 5.3%

8/14/2019 PALO PINTO COUNTY - Gordon ISD - 2000 Texas School Survey of Drug and Alcohol Use
http://slidepdf.com/reader/full/palo-pinto-county-gordon-isd-2000-texas-school-survey-of-drug-and-alcohol 17/95
8/14/2019 PALO PINTO COUNTY - Gordon ISD - 2000 Texas School Survey of Drug and Alcohol Use
http://slidepdf.com/reader/full/palo-pinto-county-gordon-isd-2000-texas-school-survey-of-drug-and-alcohol 18/95
GordonSpring 2000
______________________________________________________________________________________________
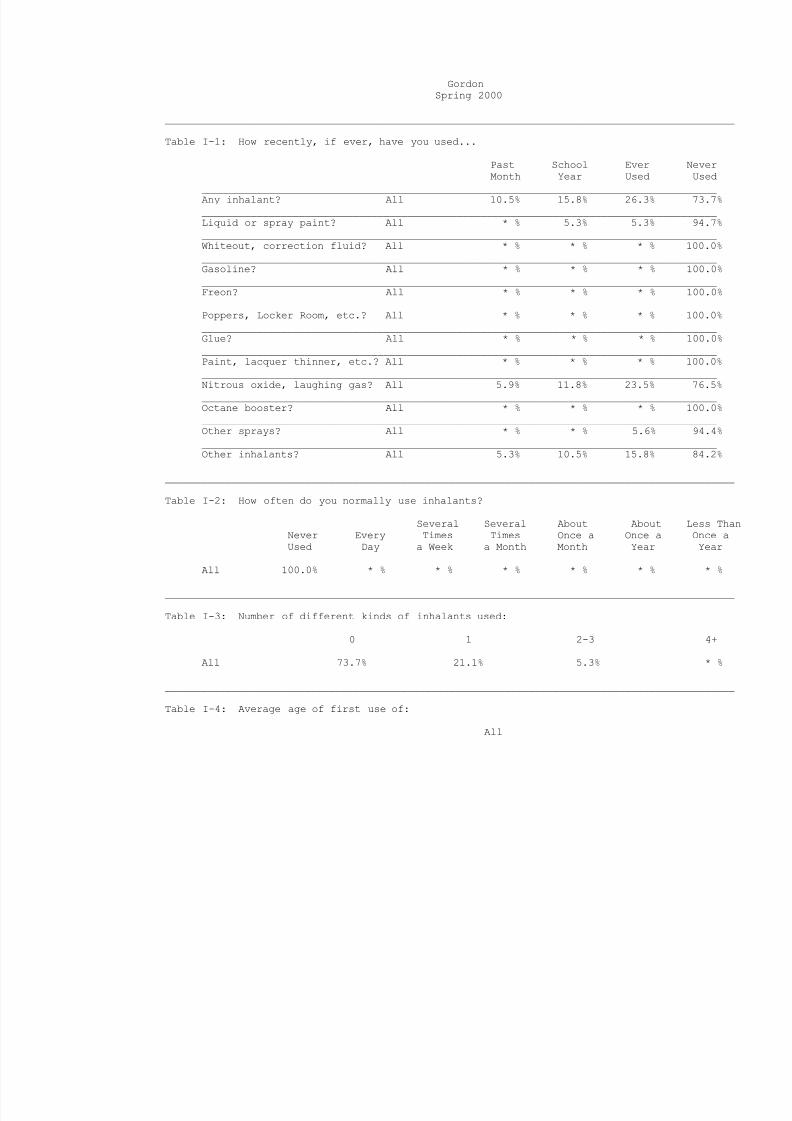
Table I-1: How recently, if ever, have you used...
Past School Ever NeverMonth Year Used Used
_____________________________________________________________________________________Any inhalant? All 10.5% 15.8% 26.3% 73.7%_____________________________________________________________________________________Liquid or spray paint? All * % 5.3% 5.3% 94.7%_____________________________________________________________________________________Whiteout, correction fluid? All * % * % * % 100.0%_____________________________________________________________________________________Gasoline? All * % * % * % 100.0%_____________________________________________________________________________________Freon? All * % * % * % 100.0%_____________________________________________________________________________________Poppers, Locker Room, etc.? All * % * % * % 100.0%_____________________________________________________________________________________Glue? All * % * % * % 100.0%_____________________________________________________________________________________Paint, lacquer thinner, etc.? All * % * % * % 100.0%_____________________________________________________________________________________Nitrous oxide, laughing gas? All 5.9% 11.8% 23.5% 76.5%_____________________________________________________________________________________Octane booster? All * % * % * % 100.0%_____________________________________________________________________________________Other sprays? All * % * % 5.6% 94.4%_____________________________________________________________________________________Other inhalants? All 5.3% 10.5% 15.8% 84.2%
______________________________________________________________________________________________
Table I-2: How often do you normally use inhalants?
Several Several About About Less ThanNever Every Times Times Once a Once a Once aUsed Day a Week a Month Month Year Year
All 100.0% * % * % * % * % * % * %
______________________________________________________________________________________________
Table I-3: Number of different kinds of inhalants used:
0 1 2-3 4+
All 73.7% 21.1% 5.3% * %
______________________________________________________________________________________________
Table I-4: Average age of first use of:
All
8/14/2019 PALO PINTO COUNTY - Gordon ISD - 2000 Texas School Survey of Drug and Alcohol Use
http://slidepdf.com/reader/full/palo-pinto-county-gordon-isd-2000-texas-school-survey-of-drug-and-alcohol 19/95
GordonSpring 2000
______________________________________________________________________________________________
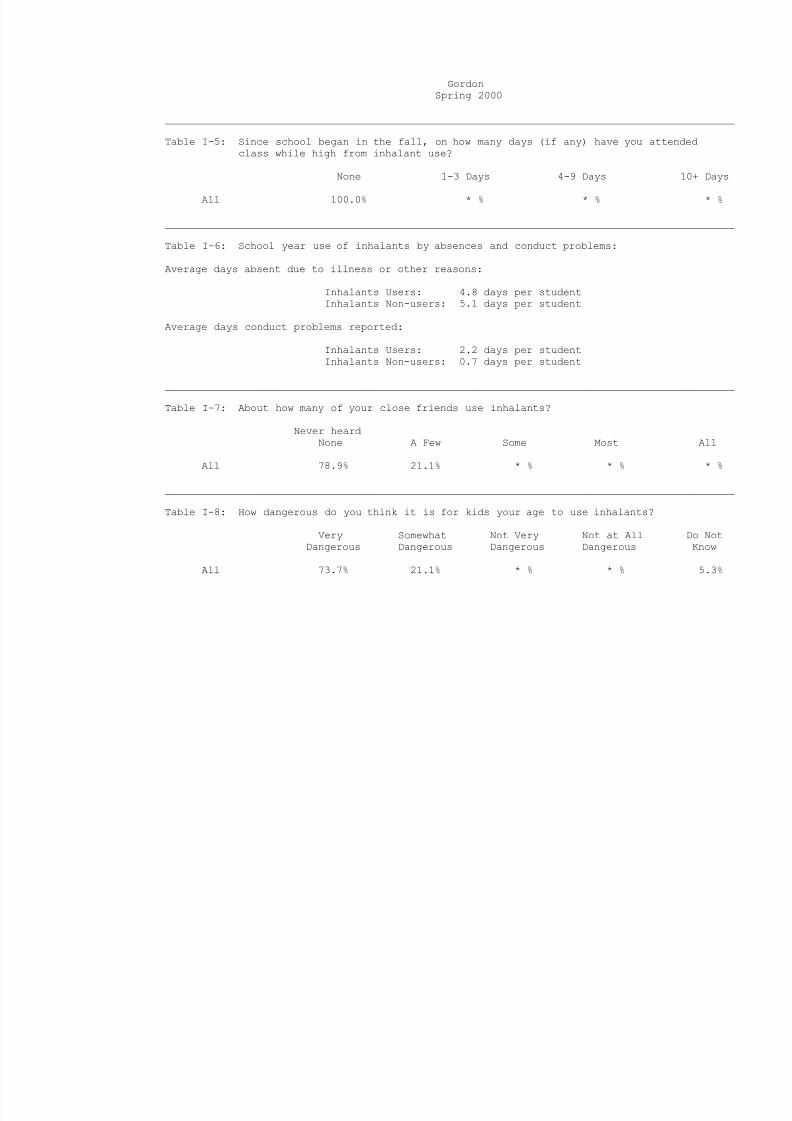
Table I-5: Since school began in the fall, on how many days (if any) have you attendedclass while high from inhalant use?
None 1-3 Days 4-9 Days 10+ Days
All 100.0% * % * % * %
______________________________________________________________________________________________
Table I-6: School year use of inhalants by absences and conduct problems:
Average days absent due to illness or other reasons:
Inhalants Users: 4.8 days per studentInhalants Non-users: 5.1 days per student
Average days conduct problems reported:
Inhalants Users: 2.2 days per studentInhalants Non-users: 0.7 days per student
______________________________________________________________________________________________
Table I-7: About how many of your close friends use inhalants?
Never heardNone A Few Some Most All
All 78.9% 21.1% * % * % * %
______________________________________________________________________________________________
Table I-8: How dangerous do you think it is for kids your age to use inhalants?
Very Somewhat Not Very Not at All Do NotDangerous Dangerous Dangerous Dangerous Know
All 73.7% 21.1% * % * % 5.3%
8/14/2019 PALO PINTO COUNTY - Gordon ISD - 2000 Texas School Survey of Drug and Alcohol Use
http://slidepdf.com/reader/full/palo-pinto-county-gordon-isd-2000-texas-school-survey-of-drug-and-alcohol 20/95
GordonSpring 2000
______________________________________________________________________________________________
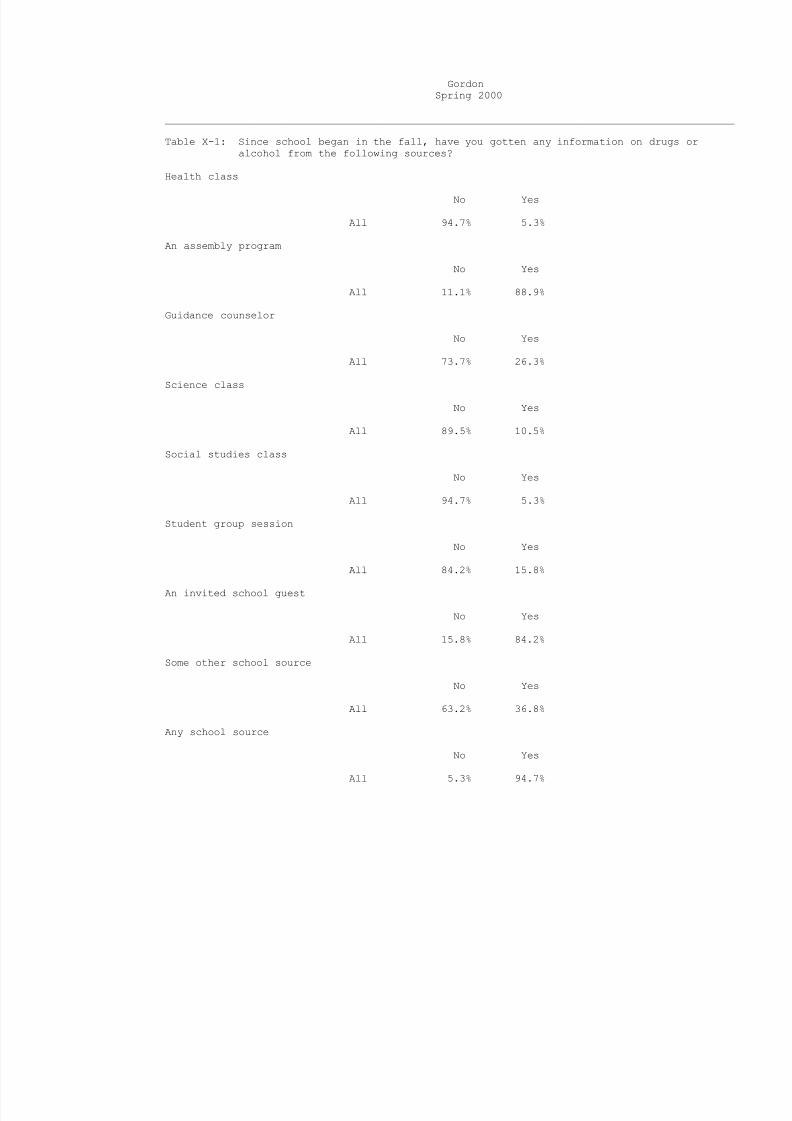
Table X-1: Since school began in the fall, have you gotten any information on drugs oralcohol from the following sources?
Health class
No Yes
All 94.7% 5.3%
An assembly program
No Yes
All 11.1% 88.9%
Guidance counselor
No Yes
All 73.7% 26.3%
Science class
No Yes
All 89.5% 10.5%
Social studies class
No Yes
All 94.7% 5.3%
Student group session
No Yes
All 84.2% 15.8%
An invited school guest
No Yes
All 15.8% 84.2%
Some other school source
No Yes
All 63.2% 36.8%
Any school source
No Yes
All 5.3% 94.7%
8/14/2019 PALO PINTO COUNTY - Gordon ISD - 2000 Texas School Survey of Drug and Alcohol Use
http://slidepdf.com/reader/full/palo-pinto-county-gordon-isd-2000-texas-school-survey-of-drug-and-alcohol 21/95
GordonSpring 2000
______________________________________________________________________________________________
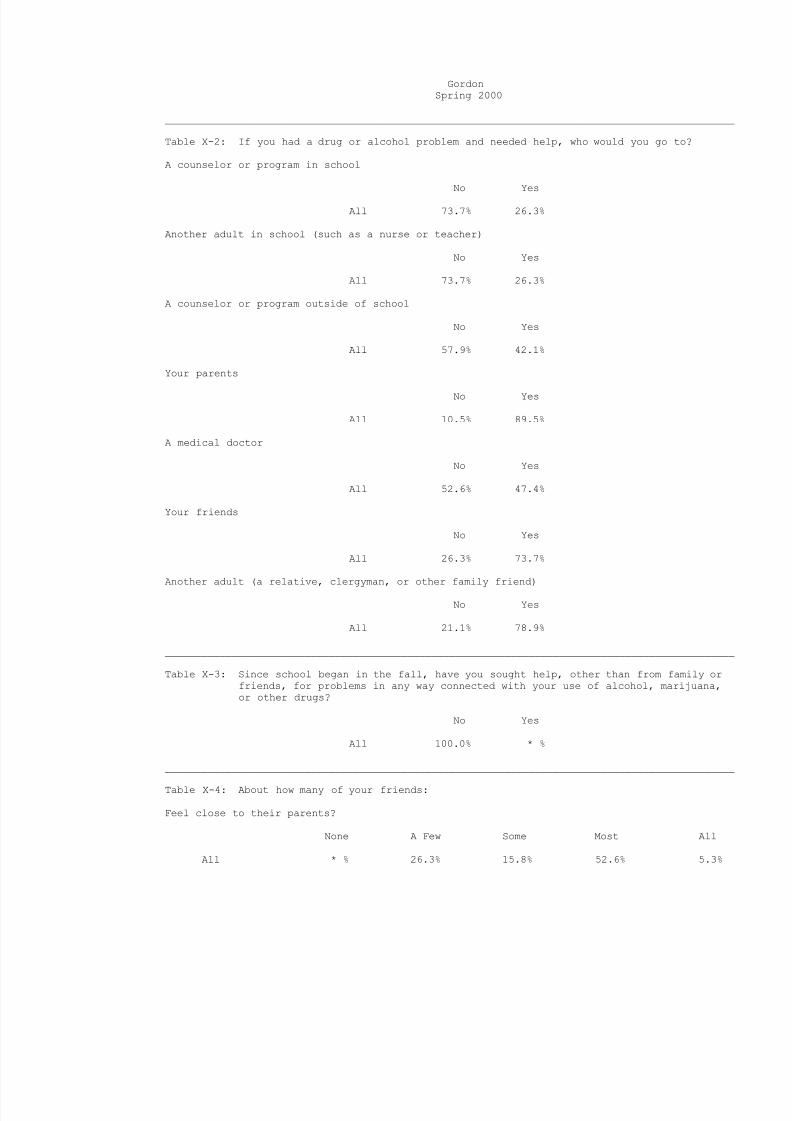
Table X-2: If you had a drug or alcohol problem and needed help, who would you go to?
A counselor or program in school
No Yes
All 73.7% 26.3%
Another adult in school (such as a nurse or teacher)
No Yes
All 73.7% 26.3%
A counselor or program outside of school
No Yes
All 57.9% 42.1%
Your parents
No Yes
All 10.5% 89.5%
A medical doctor
No Yes
All 52.6% 47.4%
Your friends
No Yes
All 26.3% 73.7%
Another adult (a relative, clergyman, or other family friend)No Yes
All 21.1% 78.9%
______________________________________________________________________________________________
Table X-3: Since school began in the fall, have you sought help, other than from family orfriends, for problems in any way connected with your use of alcohol, marijuana,or other drugs?
No Yes
All 100.0% * %
______________________________________________________________________________________________
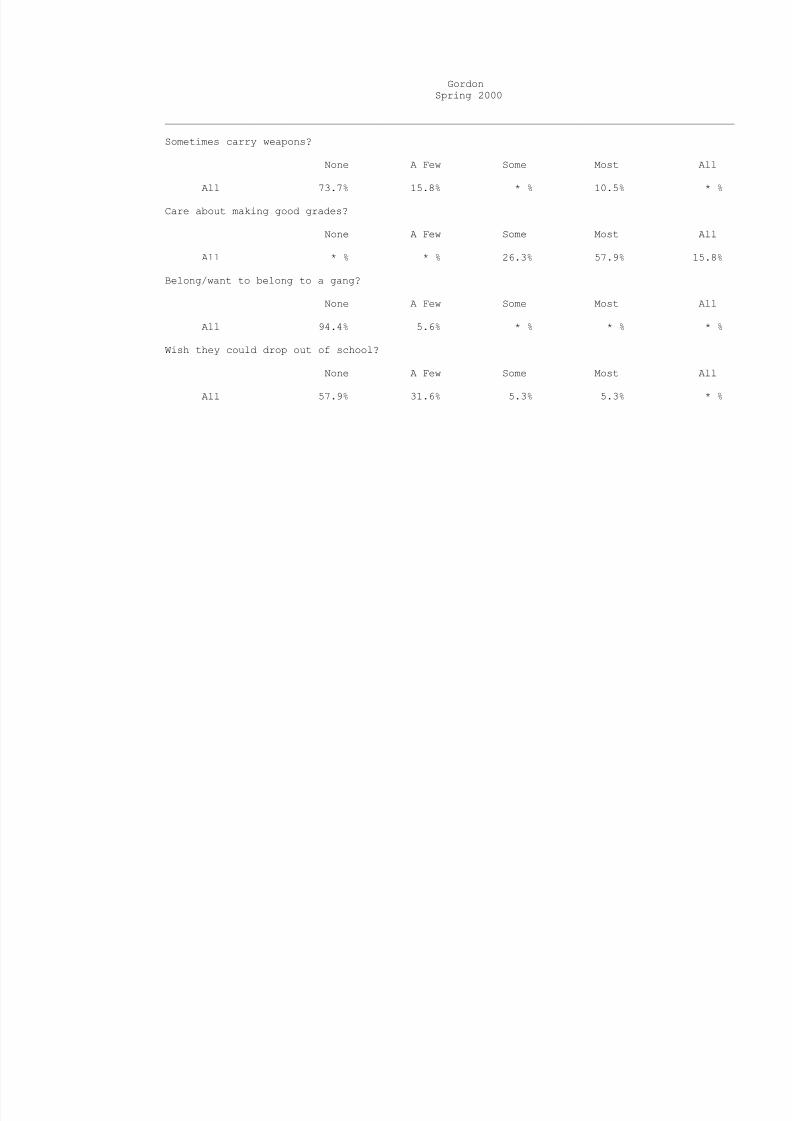
Table X-4: About how many of your friends:
Feel close to their parents?
None A Few Some Most All
All * % 26.3% 15.8% 52.6% 5.3%
8/14/2019 PALO PINTO COUNTY - Gordon ISD - 2000 Texas School Survey of Drug and Alcohol Use
http://slidepdf.com/reader/full/palo-pinto-county-gordon-isd-2000-texas-school-survey-of-drug-and-alcohol 22/95

8/14/2019 PALO PINTO COUNTY - Gordon ISD - 2000 Texas School Survey of Drug and Alcohol Use
http://slidepdf.com/reader/full/palo-pinto-county-gordon-isd-2000-texas-school-survey-of-drug-and-alcohol 23/95
8/14/2019 PALO PINTO COUNTY - Gordon ISD - 2000 Texas School Survey of Drug and Alcohol Use
http://slidepdf.com/reader/full/palo-pinto-county-gordon-isd-2000-texas-school-survey-of-drug-and-alcohol 24/95
GordonSpring 2000
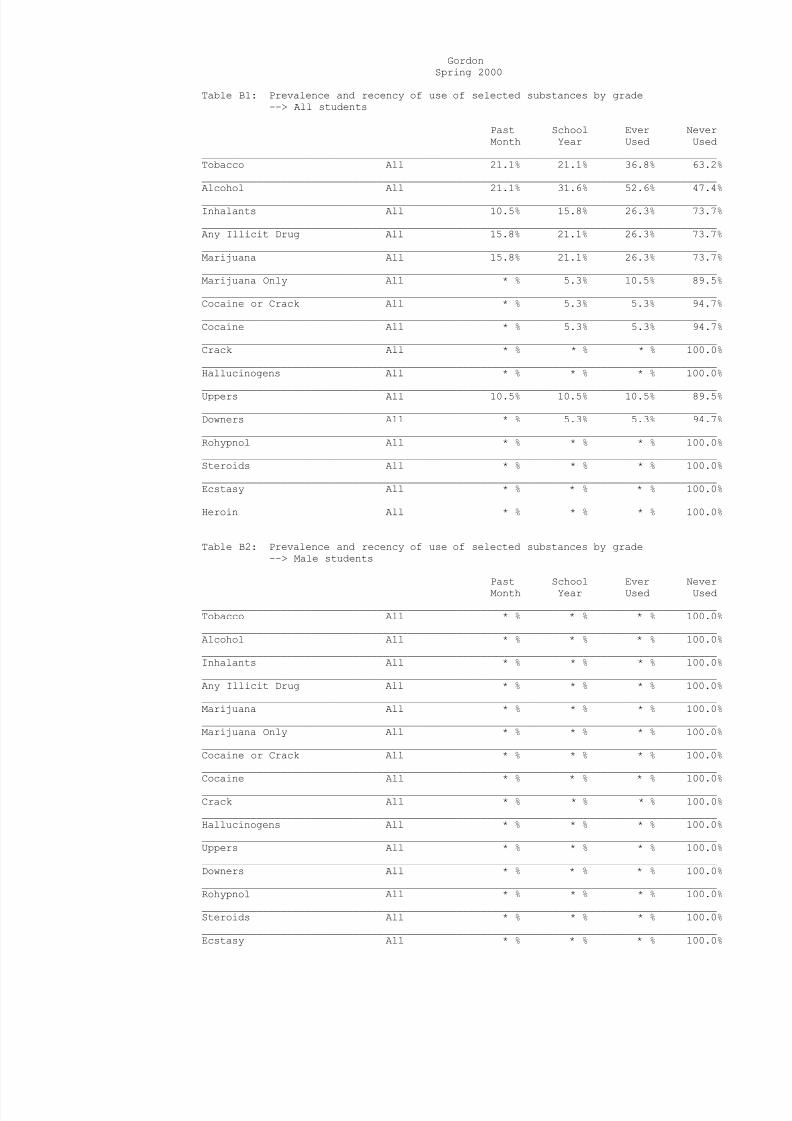
Table B1: Prevalence and recency of use of selected substances by grade--> All students
Past School Ever NeverMonth Year Used Used
_____________________________________________________________________________________Tobacco All 21.1% 21.1% 36.8% 63.2%_____________________________________________________________________________________Alcohol All 21.1% 31.6% 52.6% 47.4%_____________________________________________________________________________________Inhalants All 10.5% 15.8% 26.3% 73.7%_____________________________________________________________________________________Any Illicit Drug All 15.8% 21.1% 26.3% 73.7%_____________________________________________________________________________________Marijuana All 15.8% 21.1% 26.3% 73.7%_____________________________________________________________________________________Marijuana Only All * % 5.3% 10.5% 89.5%_____________________________________________________________________________________Cocaine or Crack All * % 5.3% 5.3% 94.7%_____________________________________________________________________________________Cocaine All * % 5.3% 5.3% 94.7%_____________________________________________________________________________________Crack All * % * % * % 100.0%_____________________________________________________________________________________Hallucinogens All * % * % * % 100.0%_____________________________________________________________________________________Uppers All 10.5% 10.5% 10.5% 89.5%_____________________________________________________________________________________Downers All * % 5.3% 5.3% 94.7%_____________________________________________________________________________________Rohypnol All * % * % * % 100.0%_____________________________________________________________________________________Steroids All * % * % * % 100.0%_____________________________________________________________________________________Ecstasy All * % * % * % 100.0%_____________________________________________________________________________________Heroin All * % * % * % 100.0%
Table B2: Prevalence and recency of use of selected substances by grade--> Male students
Past School Ever NeverMonth Year Used Used_____________________________________________________________________________________Tobacco All * % * % * % 100.0%_____________________________________________________________________________________Alcohol All * % * % * % 100.0%_____________________________________________________________________________________Inhalants All * % * % * % 100.0%_____________________________________________________________________________________Any Illicit Drug All * % * % * % 100.0%_____________________________________________________________________________________Marijuana All * % * % * % 100.0%_____________________________________________________________________________________Marijuana Only All * % * % * % 100.0%_____________________________________________________________________________________Cocaine or Crack All * % * % * % 100.0%_____________________________________________________________________________________
Cocaine All * % * % * % 100.0%_____________________________________________________________________________________Crack All * % * % * % 100.0%_____________________________________________________________________________________Hallucinogens All * % * % * % 100.0%_____________________________________________________________________________________Uppers All * % * % * % 100.0%_____________________________________________________________________________________Downers All * % * % * % 100.0%_____________________________________________________________________________________Rohypnol All * % * % * % 100.0%_____________________________________________________________________________________Steroids All * % * % * % 100.0%_____________________________________________________________________________________Ecstasy All * % * % * % 100.0%

8/14/2019 PALO PINTO COUNTY - Gordon ISD - 2000 Texas School Survey of Drug and Alcohol Use
http://slidepdf.com/reader/full/palo-pinto-county-gordon-isd-2000-texas-school-survey-of-drug-and-alcohol 25/95
_____________________________________________________________________________________Heroin All * % * % * % 100.0%
8/14/2019 PALO PINTO COUNTY - Gordon ISD - 2000 Texas School Survey of Drug and Alcohol Use
http://slidepdf.com/reader/full/palo-pinto-county-gordon-isd-2000-texas-school-survey-of-drug-and-alcohol 26/95
GordonSpring 2000
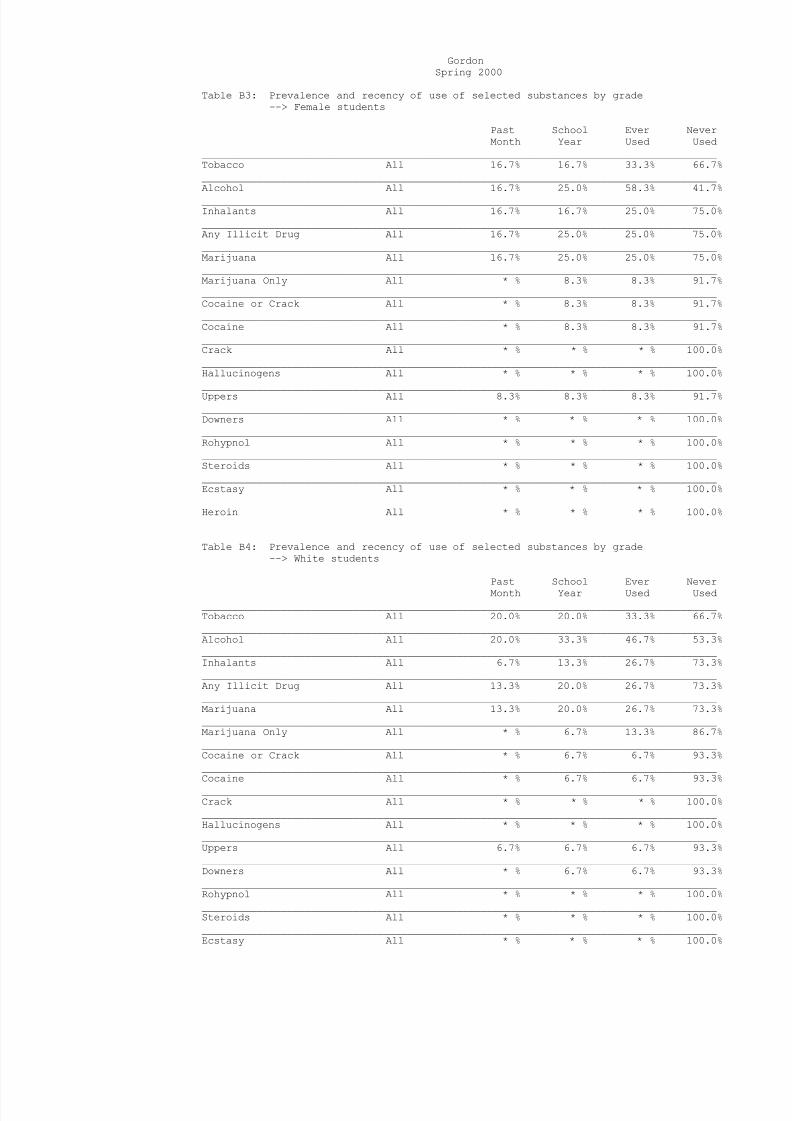
Table B3: Prevalence and recency of use of selected substances by grade--> Female students
Past School Ever NeverMonth Year Used Used
_____________________________________________________________________________________Tobacco All 16.7% 16.7% 33.3% 66.7%_____________________________________________________________________________________Alcohol All 16.7% 25.0% 58.3% 41.7%_____________________________________________________________________________________Inhalants All 16.7% 16.7% 25.0% 75.0%_____________________________________________________________________________________Any Illicit Drug All 16.7% 25.0% 25.0% 75.0%_____________________________________________________________________________________Marijuana All 16.7% 25.0% 25.0% 75.0%_____________________________________________________________________________________Marijuana Only All * % 8.3% 8.3% 91.7%_____________________________________________________________________________________Cocaine or Crack All * % 8.3% 8.3% 91.7%_____________________________________________________________________________________Cocaine All * % 8.3% 8.3% 91.7%_____________________________________________________________________________________Crack All * % * % * % 100.0%_____________________________________________________________________________________Hallucinogens All * % * % * % 100.0%_____________________________________________________________________________________Uppers All 8.3% 8.3% 8.3% 91.7%_____________________________________________________________________________________Downers All * % * % * % 100.0%_____________________________________________________________________________________Rohypnol All * % * % * % 100.0%_____________________________________________________________________________________Steroids All * % * % * % 100.0%_____________________________________________________________________________________Ecstasy All * % * % * % 100.0%_____________________________________________________________________________________Heroin All * % * % * % 100.0%
Table B4: Prevalence and recency of use of selected substances by grade--> White students
Past School Ever NeverMonth Year Used Used_____________________________________________________________________________________Tobacco All 20.0% 20.0% 33.3% 66.7%_____________________________________________________________________________________Alcohol All 20.0% 33.3% 46.7% 53.3%_____________________________________________________________________________________Inhalants All 6.7% 13.3% 26.7% 73.3%_____________________________________________________________________________________Any Illicit Drug All 13.3% 20.0% 26.7% 73.3%_____________________________________________________________________________________Marijuana All 13.3% 20.0% 26.7% 73.3%_____________________________________________________________________________________Marijuana Only All * % 6.7% 13.3% 86.7%_____________________________________________________________________________________Cocaine or Crack All * % 6.7% 6.7% 93.3%_____________________________________________________________________________________
Cocaine All * % 6.7% 6.7% 93.3%_____________________________________________________________________________________Crack All * % * % * % 100.0%_____________________________________________________________________________________Hallucinogens All * % * % * % 100.0%_____________________________________________________________________________________Uppers All 6.7% 6.7% 6.7% 93.3%_____________________________________________________________________________________Downers All * % 6.7% 6.7% 93.3%_____________________________________________________________________________________Rohypnol All * % * % * % 100.0%_____________________________________________________________________________________Steroids All * % * % * % 100.0%_____________________________________________________________________________________Ecstasy All * % * % * % 100.0%

8/14/2019 PALO PINTO COUNTY - Gordon ISD - 2000 Texas School Survey of Drug and Alcohol Use
http://slidepdf.com/reader/full/palo-pinto-county-gordon-isd-2000-texas-school-survey-of-drug-and-alcohol 27/95
_____________________________________________________________________________________Heroin All * % * % * % 100.0%
8/14/2019 PALO PINTO COUNTY - Gordon ISD - 2000 Texas School Survey of Drug and Alcohol Use
http://slidepdf.com/reader/full/palo-pinto-county-gordon-isd-2000-texas-school-survey-of-drug-and-alcohol 28/95
GordonSpring 2000
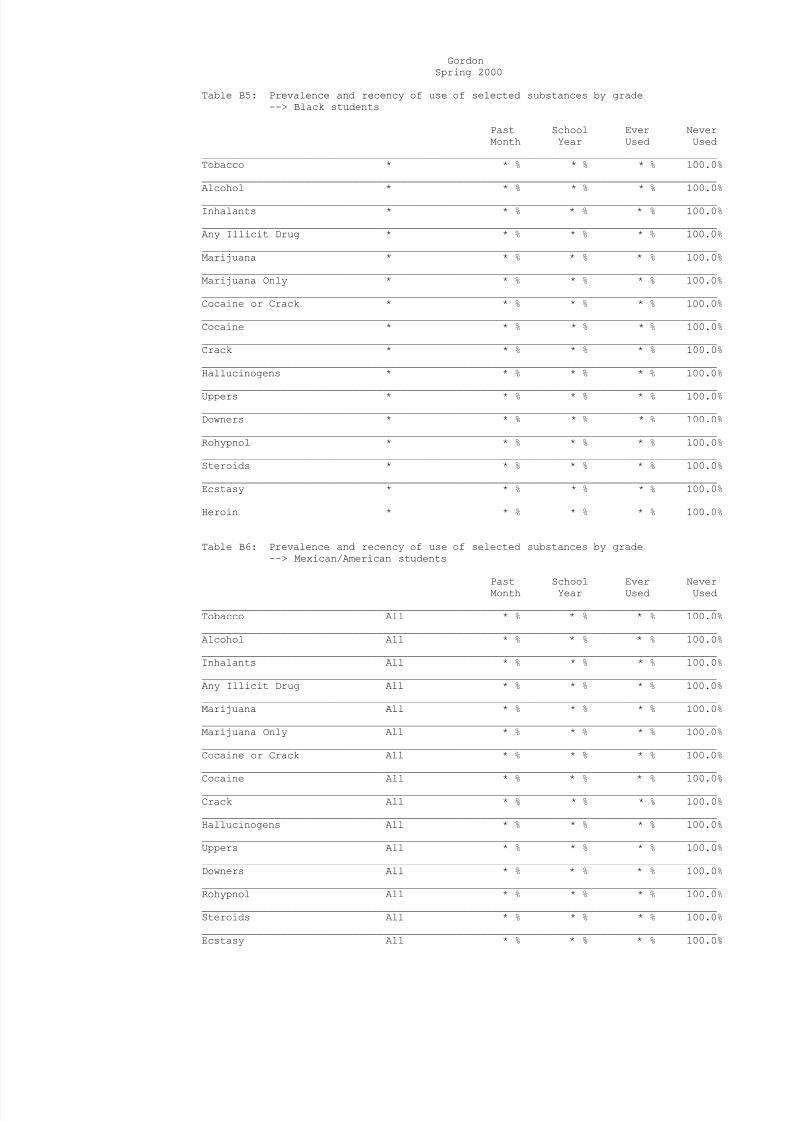
Table B5: Prevalence and recency of use of selected substances by grade--> Black students
Past School Ever NeverMonth Year Used Used
_____________________________________________________________________________________Tobacco * * % * % * % 100.0%_____________________________________________________________________________________Alcohol * * % * % * % 100.0%_____________________________________________________________________________________Inhalants * * % * % * % 100.0%_____________________________________________________________________________________Any Illicit Drug * * % * % * % 100.0%_____________________________________________________________________________________Marijuana * * % * % * % 100.0%_____________________________________________________________________________________Marijuana Only * * % * % * % 100.0%_____________________________________________________________________________________Cocaine or Crack * * % * % * % 100.0%_____________________________________________________________________________________Cocaine * * % * % * % 100.0%_____________________________________________________________________________________Crack * * % * % * % 100.0%_____________________________________________________________________________________Hallucinogens * * % * % * % 100.0%_____________________________________________________________________________________Uppers * * % * % * % 100.0%_____________________________________________________________________________________Downers * * % * % * % 100.0%_____________________________________________________________________________________Rohypnol * * % * % * % 100.0%_____________________________________________________________________________________Steroids * * % * % * % 100.0%_____________________________________________________________________________________Ecstasy * * % * % * % 100.0%_____________________________________________________________________________________Heroin * * % * % * % 100.0%
Table B6: Prevalence and recency of use of selected substances by grade--> Mexican/American students
Past School Ever NeverMonth Year Used Used_____________________________________________________________________________________Tobacco All * % * % * % 100.0%_____________________________________________________________________________________Alcohol All * % * % * % 100.0%_____________________________________________________________________________________Inhalants All * % * % * % 100.0%_____________________________________________________________________________________Any Illicit Drug All * % * % * % 100.0%_____________________________________________________________________________________Marijuana All * % * % * % 100.0%_____________________________________________________________________________________Marijuana Only All * % * % * % 100.0%_____________________________________________________________________________________Cocaine or Crack All * % * % * % 100.0%_____________________________________________________________________________________
Cocaine All * % * % * % 100.0%_____________________________________________________________________________________Crack All * % * % * % 100.0%_____________________________________________________________________________________Hallucinogens All * % * % * % 100.0%_____________________________________________________________________________________Uppers All * % * % * % 100.0%_____________________________________________________________________________________Downers All * % * % * % 100.0%_____________________________________________________________________________________Rohypnol All * % * % * % 100.0%_____________________________________________________________________________________Steroids All * % * % * % 100.0%_____________________________________________________________________________________Ecstasy All * % * % * % 100.0%

8/14/2019 PALO PINTO COUNTY - Gordon ISD - 2000 Texas School Survey of Drug and Alcohol Use
http://slidepdf.com/reader/full/palo-pinto-county-gordon-isd-2000-texas-school-survey-of-drug-and-alcohol 29/95
_____________________________________________________________________________________Heroin All * % * % * % 100.0%
8/14/2019 PALO PINTO COUNTY - Gordon ISD - 2000 Texas School Survey of Drug and Alcohol Use
http://slidepdf.com/reader/full/palo-pinto-county-gordon-isd-2000-texas-school-survey-of-drug-and-alcohol 30/95
GordonSpring 2000
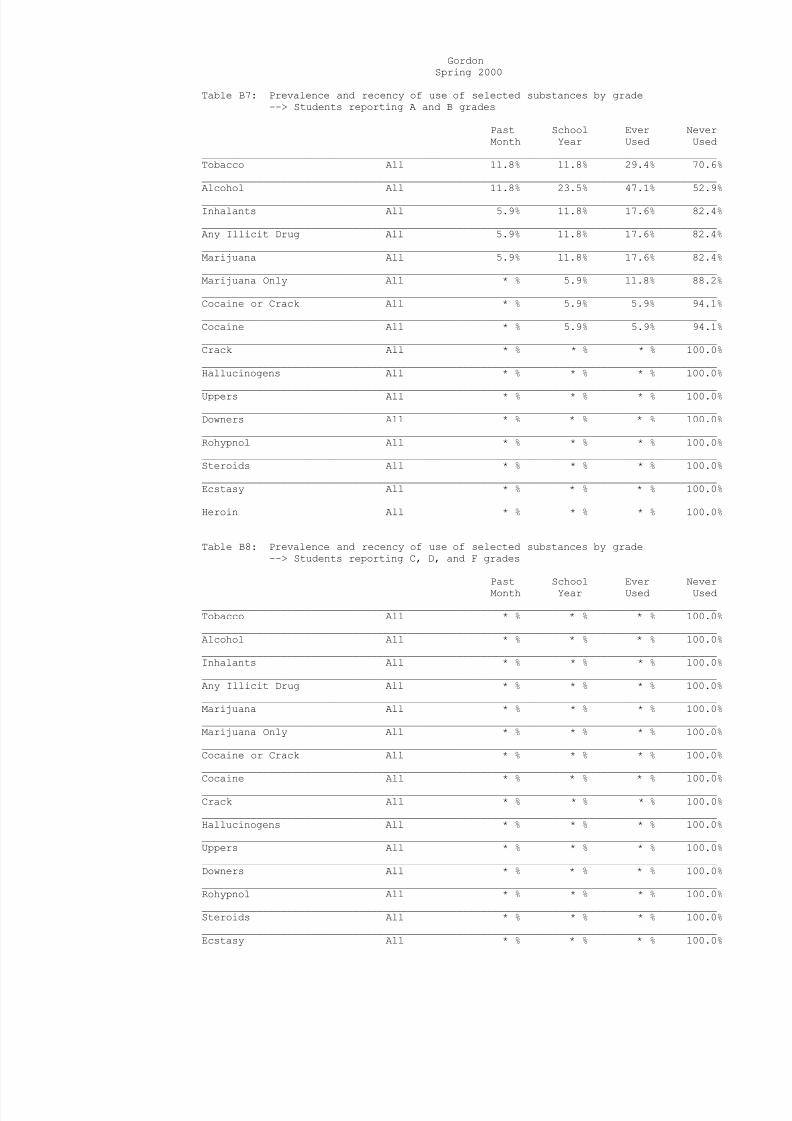
Table B7: Prevalence and recency of use of selected substances by grade--> Students reporting A and B grades
Past School Ever NeverMonth Year Used Used
_____________________________________________________________________________________Tobacco All 11.8% 11.8% 29.4% 70.6%_____________________________________________________________________________________Alcohol All 11.8% 23.5% 47.1% 52.9%_____________________________________________________________________________________Inhalants All 5.9% 11.8% 17.6% 82.4%_____________________________________________________________________________________Any Illicit Drug All 5.9% 11.8% 17.6% 82.4%_____________________________________________________________________________________Marijuana All 5.9% 11.8% 17.6% 82.4%_____________________________________________________________________________________Marijuana Only All * % 5.9% 11.8% 88.2%_____________________________________________________________________________________Cocaine or Crack All * % 5.9% 5.9% 94.1%_____________________________________________________________________________________Cocaine All * % 5.9% 5.9% 94.1%_____________________________________________________________________________________Crack All * % * % * % 100.0%_____________________________________________________________________________________Hallucinogens All * % * % * % 100.0%_____________________________________________________________________________________Uppers All * % * % * % 100.0%_____________________________________________________________________________________Downers All * % * % * % 100.0%_____________________________________________________________________________________Rohypnol All * % * % * % 100.0%_____________________________________________________________________________________Steroids All * % * % * % 100.0%_____________________________________________________________________________________Ecstasy All * % * % * % 100.0%_____________________________________________________________________________________Heroin All * % * % * % 100.0%
Table B8: Prevalence and recency of use of selected substances by grade--> Students reporting C, D, and F grades
Past School Ever NeverMonth Year Used Used_____________________________________________________________________________________Tobacco All * % * % * % 100.0%_____________________________________________________________________________________Alcohol All * % * % * % 100.0%_____________________________________________________________________________________Inhalants All * % * % * % 100.0%_____________________________________________________________________________________Any Illicit Drug All * % * % * % 100.0%_____________________________________________________________________________________Marijuana All * % * % * % 100.0%_____________________________________________________________________________________Marijuana Only All * % * % * % 100.0%_____________________________________________________________________________________Cocaine or Crack All * % * % * % 100.0%_____________________________________________________________________________________
Cocaine All * % * % * % 100.0%_____________________________________________________________________________________Crack All * % * % * % 100.0%_____________________________________________________________________________________Hallucinogens All * % * % * % 100.0%_____________________________________________________________________________________Uppers All * % * % * % 100.0%_____________________________________________________________________________________Downers All * % * % * % 100.0%_____________________________________________________________________________________Rohypnol All * % * % * % 100.0%_____________________________________________________________________________________Steroids All * % * % * % 100.0%_____________________________________________________________________________________Ecstasy All * % * % * % 100.0%
8/14/2019 PALO PINTO COUNTY - Gordon ISD - 2000 Texas School Survey of Drug and Alcohol Use
http://slidepdf.com/reader/full/palo-pinto-county-gordon-isd-2000-texas-school-survey-of-drug-and-alcohol 31/95
8/14/2019 PALO PINTO COUNTY - Gordon ISD - 2000 Texas School Survey of Drug and Alcohol Use
http://slidepdf.com/reader/full/palo-pinto-county-gordon-isd-2000-texas-school-survey-of-drug-and-alcohol 32/95

8/14/2019 PALO PINTO COUNTY - Gordon ISD - 2000 Texas School Survey of Drug and Alcohol Use
http://slidepdf.com/reader/full/palo-pinto-county-gordon-isd-2000-texas-school-survey-of-drug-and-alcohol 33/95
_____________________________________________________________________________________Heroin All * % * % * % 100.0%
8/14/2019 PALO PINTO COUNTY - Gordon ISD - 2000 Texas School Survey of Drug and Alcohol Use
http://slidepdf.com/reader/full/palo-pinto-county-gordon-isd-2000-texas-school-survey-of-drug-and-alcohol 34/95
GordonSpring 2000
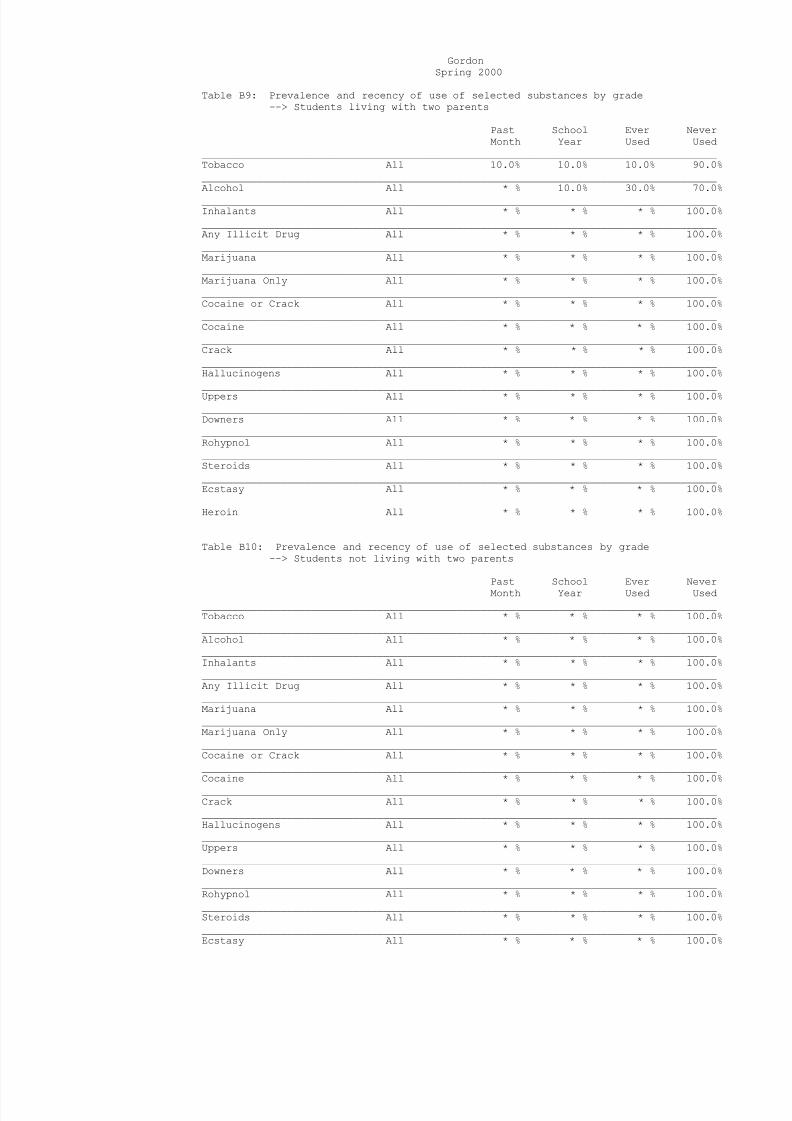
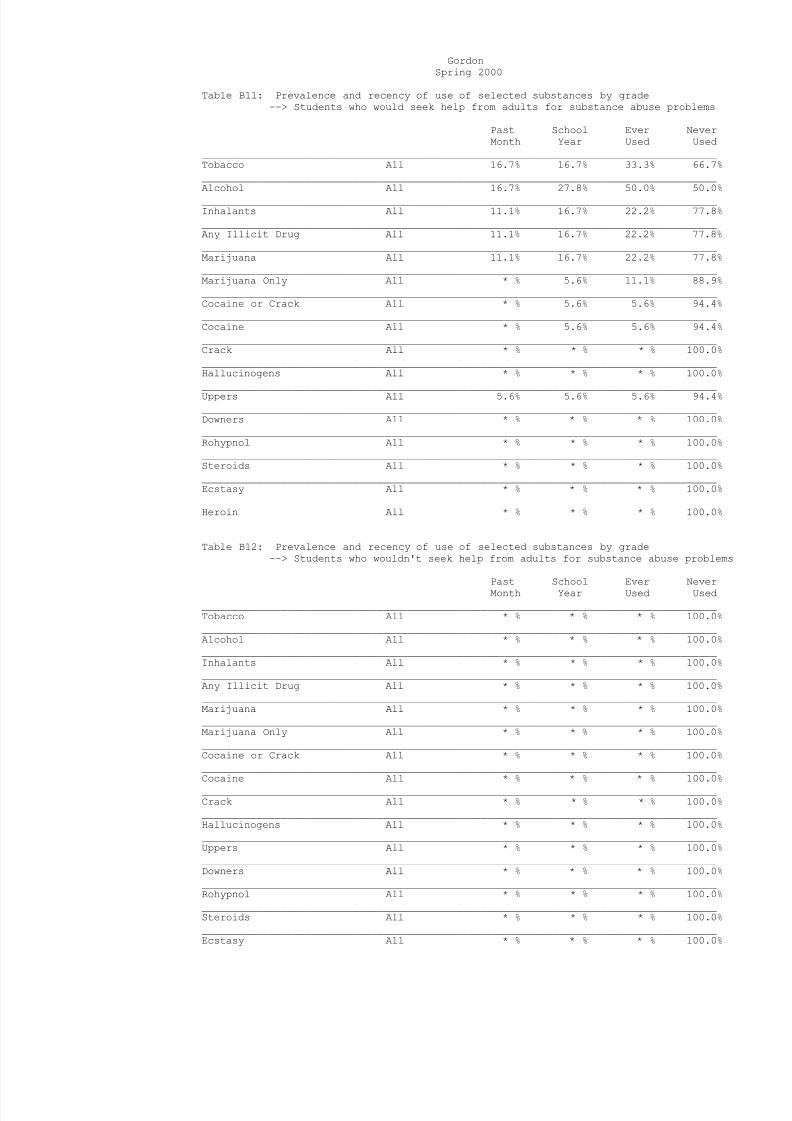
Table B11: Prevalence and recency of use of selected substances by grade--> Students who would seek help from adults for substance abuse problems
Past School Ever NeverMonth Year Used Used
_____________________________________________________________________________________Tobacco All 16.7% 16.7% 33.3% 66.7%_____________________________________________________________________________________Alcohol All 16.7% 27.8% 50.0% 50.0%_____________________________________________________________________________________Inhalants All 11.1% 16.7% 22.2% 77.8%_____________________________________________________________________________________Any Illicit Drug All 11.1% 16.7% 22.2% 77.8%_____________________________________________________________________________________Marijuana All 11.1% 16.7% 22.2% 77.8%_____________________________________________________________________________________Marijuana Only All * % 5.6% 11.1% 88.9%_____________________________________________________________________________________Cocaine or Crack All * % 5.6% 5.6% 94.4%_____________________________________________________________________________________Cocaine All * % 5.6% 5.6% 94.4%_____________________________________________________________________________________Crack All * % * % * % 100.0%_____________________________________________________________________________________Hallucinogens All * % * % * % 100.0%_____________________________________________________________________________________Uppers All 5.6% 5.6% 5.6% 94.4%_____________________________________________________________________________________Downers All * % * % * % 100.0%_____________________________________________________________________________________Rohypnol All * % * % * % 100.0%_____________________________________________________________________________________Steroids All * % * % * % 100.0%_____________________________________________________________________________________Ecstasy All * % * % * % 100.0%_____________________________________________________________________________________Heroin All * % * % * % 100.0%
Table B12: Prevalence and recency of use of selected substances by grade--> Students who wouldn't seek help from adults for substance abuse problems
Past School Ever NeverMonth Year Used Used_____________________________________________________________________________________Tobacco All * % * % * % 100.0%_____________________________________________________________________________________Alcohol All * % * % * % 100.0%_____________________________________________________________________________________Inhalants All * % * % * % 100.0%_____________________________________________________________________________________Any Illicit Drug All * % * % * % 100.0%_____________________________________________________________________________________Marijuana All * % * % * % 100.0%_____________________________________________________________________________________Marijuana Only All * % * % * % 100.0%_____________________________________________________________________________________Cocaine or Crack All * % * % * % 100.0%_____________________________________________________________________________________
Cocaine All * % * % * % 100.0%_____________________________________________________________________________________Crack All * % * % * % 100.0%_____________________________________________________________________________________Hallucinogens All * % * % * % 100.0%_____________________________________________________________________________________Uppers All * % * % * % 100.0%_____________________________________________________________________________________Downers All * % * % * % 100.0%_____________________________________________________________________________________Rohypnol All * % * % * % 100.0%_____________________________________________________________________________________Steroids All * % * % * % 100.0%_____________________________________________________________________________________Ecstasy All * % * % * % 100.0%

8/14/2019 PALO PINTO COUNTY - Gordon ISD - 2000 Texas School Survey of Drug and Alcohol Use
http://slidepdf.com/reader/full/palo-pinto-county-gordon-isd-2000-texas-school-survey-of-drug-and-alcohol 35/95
_____________________________________________________________________________________Heroin All * % * % * % 100.0%
8/14/2019 PALO PINTO COUNTY - Gordon ISD - 2000 Texas School Survey of Drug and Alcohol Use
http://slidepdf.com/reader/full/palo-pinto-county-gordon-isd-2000-texas-school-survey-of-drug-and-alcohol 36/95
GordonSpring 2000
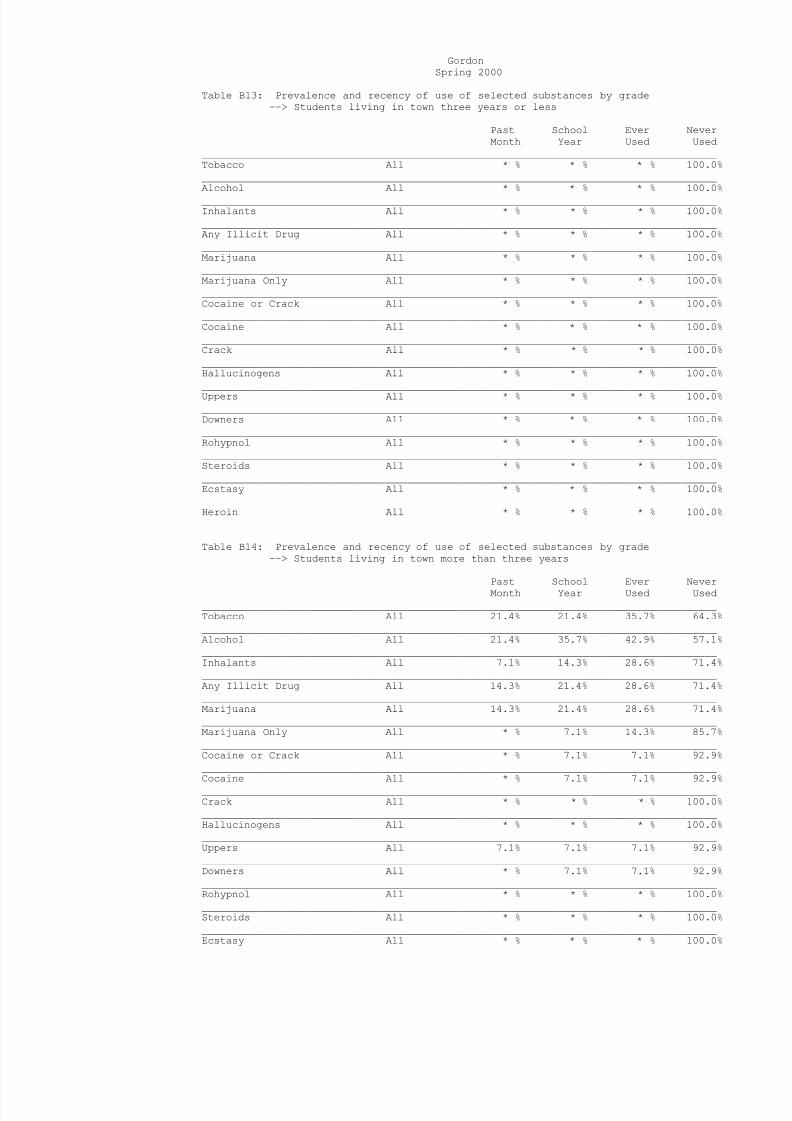
Table B13: Prevalence and recency of use of selected substances by grade--> Students living in town three years or less
Past School Ever NeverMonth Year Used Used
_____________________________________________________________________________________Tobacco All * % * % * % 100.0%_____________________________________________________________________________________Alcohol All * % * % * % 100.0%_____________________________________________________________________________________Inhalants All * % * % * % 100.0%_____________________________________________________________________________________Any Illicit Drug All * % * % * % 100.0%_____________________________________________________________________________________Marijuana All * % * % * % 100.0%_____________________________________________________________________________________Marijuana Only All * % * % * % 100.0%_____________________________________________________________________________________Cocaine or Crack All * % * % * % 100.0%_____________________________________________________________________________________Cocaine All * % * % * % 100.0%_____________________________________________________________________________________Crack All * % * % * % 100.0%_____________________________________________________________________________________Hallucinogens All * % * % * % 100.0%_____________________________________________________________________________________Uppers All * % * % * % 100.0%_____________________________________________________________________________________Downers All * % * % * % 100.0%_____________________________________________________________________________________Rohypnol All * % * % * % 100.0%_____________________________________________________________________________________Steroids All * % * % * % 100.0%_____________________________________________________________________________________Ecstasy All * % * % * % 100.0%_____________________________________________________________________________________Heroin All * % * % * % 100.0%
Table B14: Prevalence and recency of use of selected substances by grade--> Students living in town more than three years
Past School Ever NeverMonth Year Used Used_____________________________________________________________________________________Tobacco All 21.4% 21.4% 35.7% 64.3%_____________________________________________________________________________________Alcohol All 21.4% 35.7% 42.9% 57.1%_____________________________________________________________________________________Inhalants All 7.1% 14.3% 28.6% 71.4%_____________________________________________________________________________________Any Illicit Drug All 14.3% 21.4% 28.6% 71.4%_____________________________________________________________________________________Marijuana All 14.3% 21.4% 28.6% 71.4%_____________________________________________________________________________________Marijuana Only All * % 7.1% 14.3% 85.7%_____________________________________________________________________________________Cocaine or Crack All * % 7.1% 7.1% 92.9%_____________________________________________________________________________________
Cocaine All * % 7.1% 7.1% 92.9%_____________________________________________________________________________________Crack All * % * % * % 100.0%_____________________________________________________________________________________Hallucinogens All * % * % * % 100.0%_____________________________________________________________________________________Uppers All 7.1% 7.1% 7.1% 92.9%_____________________________________________________________________________________Downers All * % 7.1% 7.1% 92.9%_____________________________________________________________________________________Rohypnol All * % * % * % 100.0%_____________________________________________________________________________________Steroids All * % * % * % 100.0%_____________________________________________________________________________________Ecstasy All * % * % * % 100.0%

8/14/2019 PALO PINTO COUNTY - Gordon ISD - 2000 Texas School Survey of Drug and Alcohol Use
http://slidepdf.com/reader/full/palo-pinto-county-gordon-isd-2000-texas-school-survey-of-drug-and-alcohol 37/95
_____________________________________________________________________________________Heroin All * % * % * % 100.0%
8/14/2019 PALO PINTO COUNTY - Gordon ISD - 2000 Texas School Survey of Drug and Alcohol Use
http://slidepdf.com/reader/full/palo-pinto-county-gordon-isd-2000-texas-school-survey-of-drug-and-alcohol 38/95
GordonSpring 2000
The FREQ Procedure
GENDER
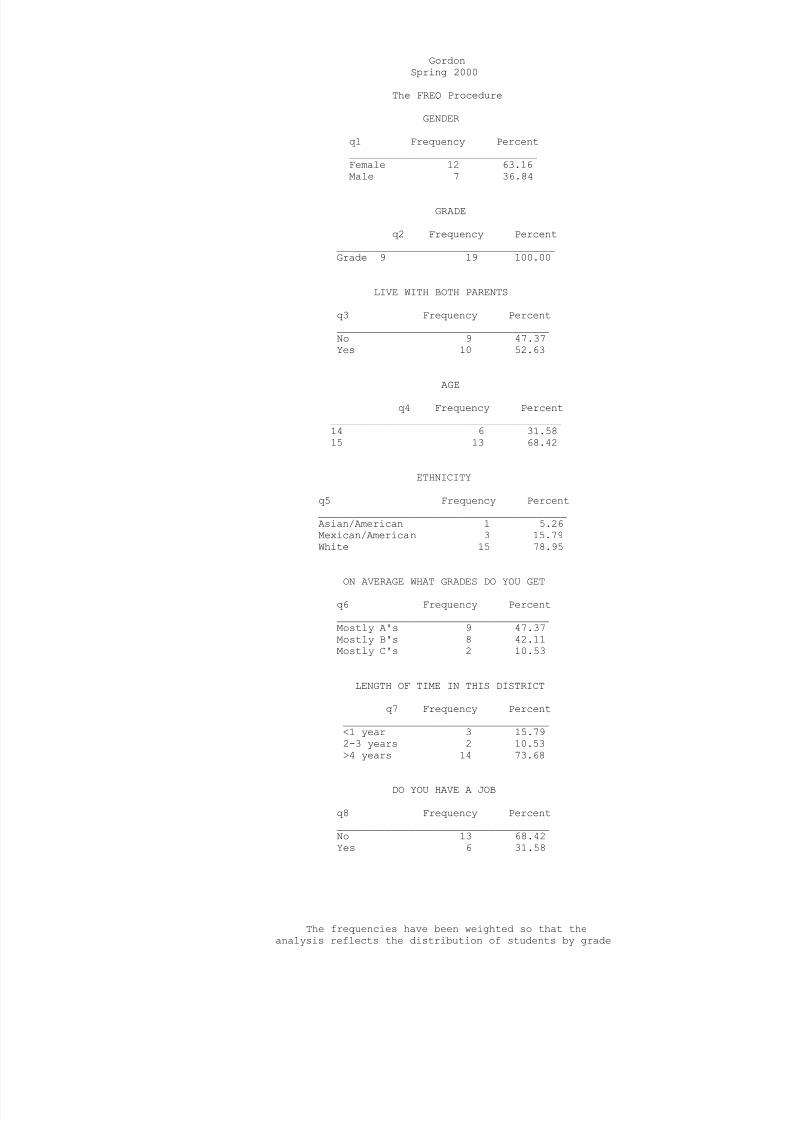
q1 Frequency Percent_______________________________Female 12 63.16Male 7 36.84
GRADE
q2 Frequency Percent____________________________________Grade 9 19 100.00
LIVE WITH BOTH PARENTS
q3 Frequency Percent___________________________________No 9 47.37Yes 10 52.63
AGE
q4 Frequency Percent______________________________________14 6 31.5815 13 68.42
ETHNICITY
q5 Frequency Percent_________________________________________Asian/American 1 5.26Mexican/American 3 15.79White 15 78.95
ON AVERAGE WHAT GRADES DO YOU GET q6 Frequency Percent___________________________________Mostly A's 9 47.37Mostly B's 8 42.11Mostly C's 2 10.53
LENGTH OF TIME IN THIS DISTRICT
q7 Frequency Percent__________________________________<1 year 3 15.792-3 years 2 10.53>4 years 14 73.68
DO YOU HAVE A JOB
q8 Frequency Percent___________________________________No 13 68.42Yes 6 31.58
The frequencies have been weighted so that theanalysis reflects the distribution of students by grade

8/14/2019 PALO PINTO COUNTY - Gordon ISD - 2000 Texas School Survey of Drug and Alcohol Use
http://slidepdf.com/reader/full/palo-pinto-county-gordon-isd-2000-texas-school-survey-of-drug-and-alcohol 39/95
8/14/2019 PALO PINTO COUNTY - Gordon ISD - 2000 Texas School Survey of Drug and Alcohol Use
http://slidepdf.com/reader/full/palo-pinto-county-gordon-isd-2000-texas-school-survey-of-drug-and-alcohol 40/95

8/14/2019 PALO PINTO COUNTY - Gordon ISD - 2000 Texas School Survey of Drug and Alcohol Use
http://slidepdf.com/reader/full/palo-pinto-county-gordon-isd-2000-texas-school-survey-of-drug-and-alcohol 41/95
level in the district
8/14/2019 PALO PINTO COUNTY - Gordon ISD - 2000 Texas School Survey of Drug and Alcohol Use
http://slidepdf.com/reader/full/palo-pinto-county-gordon-isd-2000-texas-school-survey-of-drug-and-alcohol 42/95
GordonSpring 2000
The FREQ Procedure
PARTICIPATE IN STUDENT GOVERNMENT
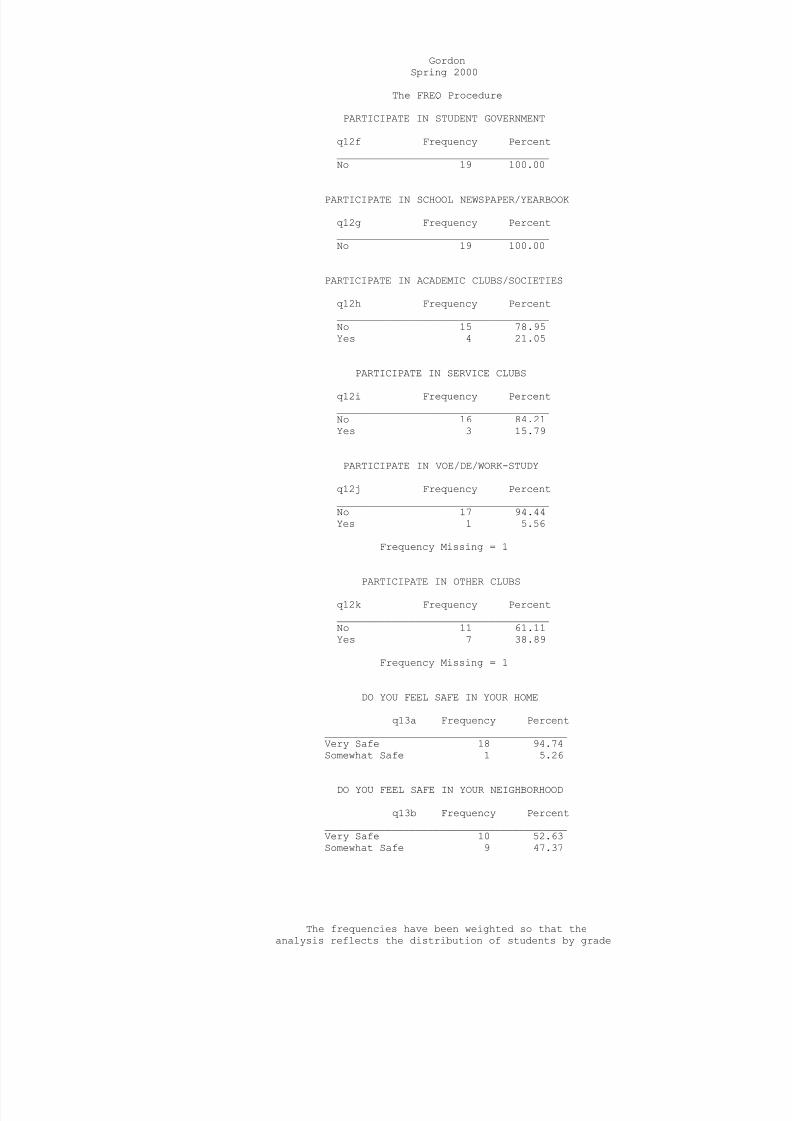
q12f Frequency Percent___________________________________No 19 100.00
PARTICIPATE IN SCHOOL NEWSPAPER/YEARBOOK
q12g Frequency Percent___________________________________No 19 100.00
PARTICIPATE IN ACADEMIC CLUBS/SOCIETIES
q12h Frequency Percent___________________________________No 15 78.95Yes 4 21.05
PARTICIPATE IN SERVICE CLUBS
q12i Frequency Percent___________________________________No 16 84.21Yes 3 15.79
PARTICIPATE IN VOE/DE/WORK-STUDY
q12j Frequency Percent___________________________________No 17 94.44Yes 1 5.56
Frequency Missing = 1
PARTICIPATE IN OTHER CLUBS q12k Frequency Percent___________________________________No 11 61.11Yes 7 38.89
Frequency Missing = 1
DO YOU FEEL SAFE IN YOUR HOME
q13a Frequency Percent________________________________________Very Safe 18 94.74Somewhat Safe 1 5.26
DO YOU FEEL SAFE IN YOUR NEIGHBORHOOD
q13b Frequency Percent________________________________________Very Safe 10 52.63Somewhat Safe 9 47.37
The frequencies have been weighted so that theanalysis reflects the distribution of students by grade

8/14/2019 PALO PINTO COUNTY - Gordon ISD - 2000 Texas School Survey of Drug and Alcohol Use
http://slidepdf.com/reader/full/palo-pinto-county-gordon-isd-2000-texas-school-survey-of-drug-and-alcohol 43/95
level in the district
8/14/2019 PALO PINTO COUNTY - Gordon ISD - 2000 Texas School Survey of Drug and Alcohol Use
http://slidepdf.com/reader/full/palo-pinto-county-gordon-isd-2000-texas-school-survey-of-drug-and-alcohol 44/95
GordonSpring 2000
The FREQ Procedure
DO YOU FEEL SAFE AT SCHOOL
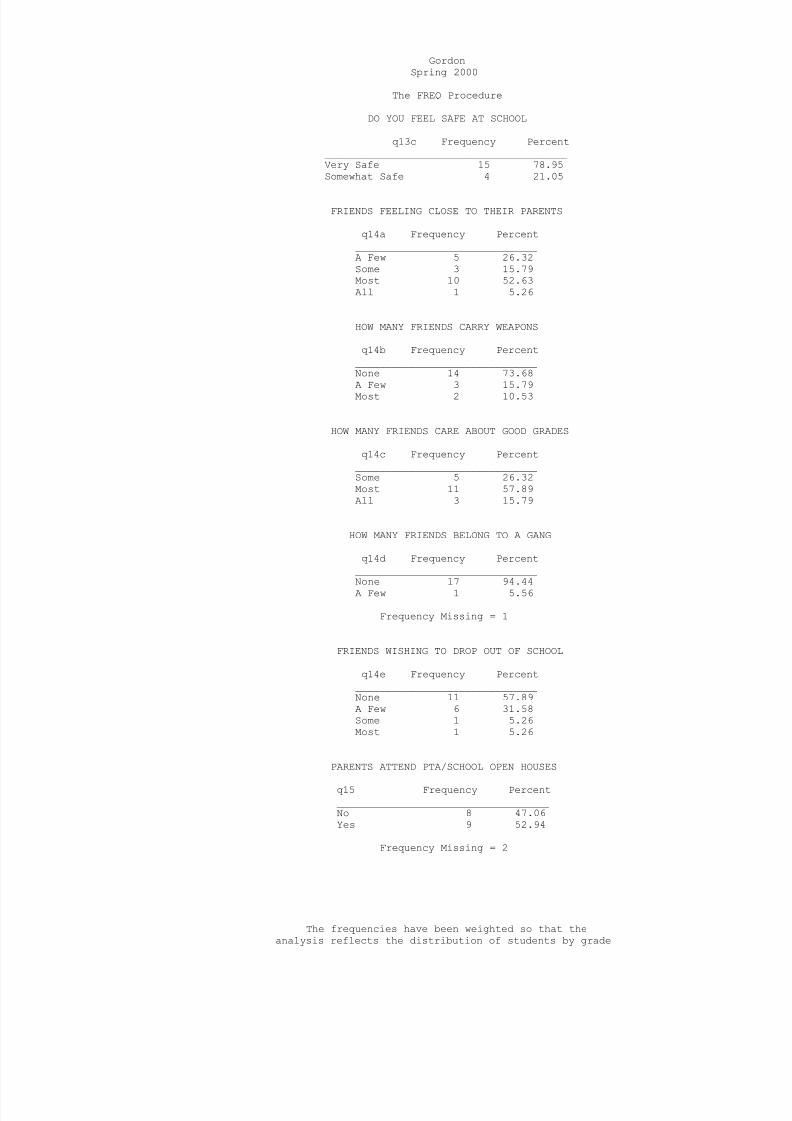
q13c Frequency Percent________________________________________Very Safe 15 78.95Somewhat Safe 4 21.05
FRIENDS FEELING CLOSE TO THEIR PARENTS
q14a Frequency Percent______________________________A Few 5 26.32Some 3 15.79Most 10 52.63All 1 5.26
HOW MANY FRIENDS CARRY WEAPONS
q14b Frequency Percent______________________________None 14 73.68A Few 3 15.79Most 2 10.53
HOW MANY FRIENDS CARE ABOUT GOOD GRADES
q14c Frequency Percent______________________________Some 5 26.32Most 11 57.89All 3 15.79
HOW MANY FRIENDS BELONG TO A GANG
q14d Frequency Percent______________________________
None 17 94.44A Few 1 5.56
Frequency Missing = 1
FRIENDS WISHING TO DROP OUT OF SCHOOL
q14e Frequency Percent______________________________None 11 57.89A Few 6 31.58Some 1 5.26Most 1 5.26
PARENTS ATTEND PTA/SCHOOL OPEN HOUSES
q15 Frequency Percent___________________________________No 8 47.06Yes 9 52.94
Frequency Missing = 2
The frequencies have been weighted so that theanalysis reflects the distribution of students by grade

8/14/2019 PALO PINTO COUNTY - Gordon ISD - 2000 Texas School Survey of Drug and Alcohol Use
http://slidepdf.com/reader/full/palo-pinto-county-gordon-isd-2000-texas-school-survey-of-drug-and-alcohol 45/95
level in the district
8/14/2019 PALO PINTO COUNTY - Gordon ISD - 2000 Texas School Survey of Drug and Alcohol Use
http://slidepdf.com/reader/full/palo-pinto-county-gordon-isd-2000-texas-school-survey-of-drug-and-alcohol 46/95
GordonSpring 2000
The FREQ Procedure
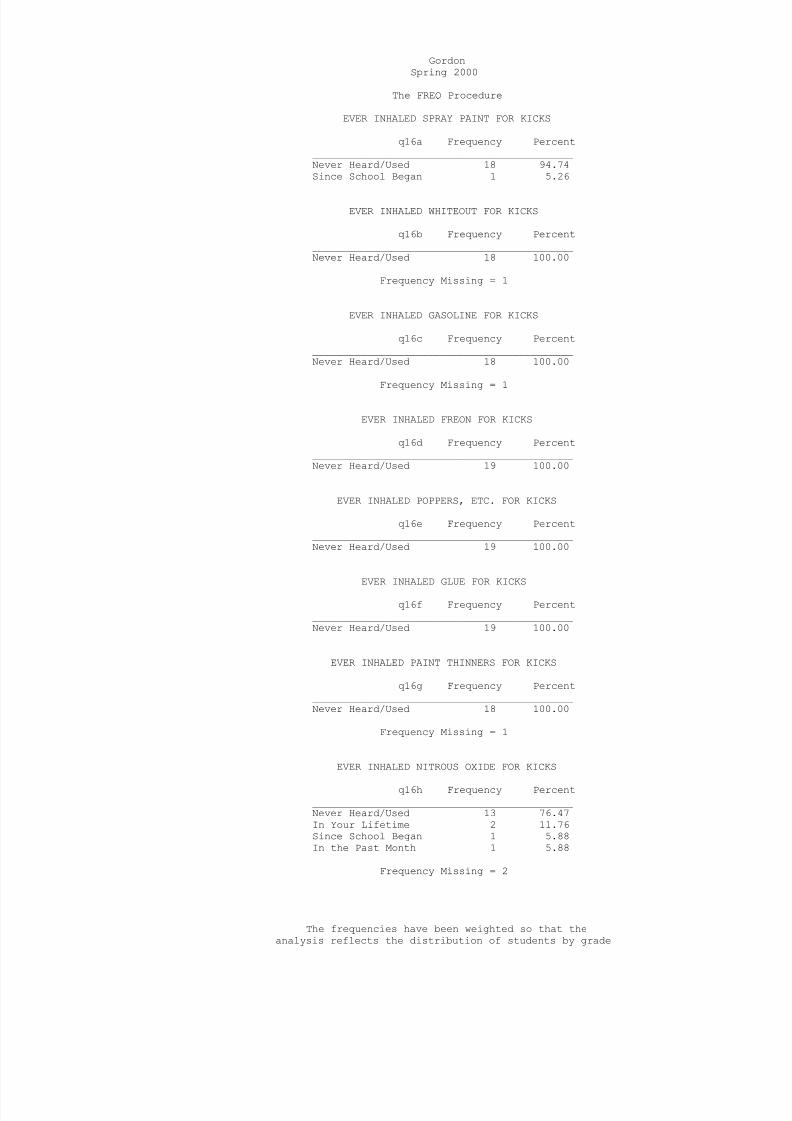
EVER INHALED SPRAY PAINT FOR KICKS
q16a Frequency Percent___________________________________________Never Heard/Used 18 94.74Since School Began 1 5.26
EVER INHALED WHITEOUT FOR KICKS
q16b Frequency Percent___________________________________________Never Heard/Used 18 100.00
Frequency Missing = 1
EVER INHALED GASOLINE FOR KICKS
q16c Frequency Percent___________________________________________Never Heard/Used 18 100.00
Frequency Missing = 1
EVER INHALED FREON FOR KICKS
q16d Frequency Percent___________________________________________Never Heard/Used 19 100.00
EVER INHALED POPPERS, ETC. FOR KICKS
q16e Frequency Percent___________________________________________Never Heard/Used 19 100.00
EVER INHALED GLUE FOR KICKS q16f Frequency Percent
___________________________________________Never Heard/Used 19 100.00
EVER INHALED PAINT THINNERS FOR KICKS
q16g Frequency Percent___________________________________________Never Heard/Used 18 100.00
Frequency Missing = 1
EVER INHALED NITROUS OXIDE FOR KICKS
q16h Frequency Percent___________________________________________Never Heard/Used 13 76.47In Your Lifetime 2 11.76Since School Began 1 5.88In the Past Month 1 5.88
Frequency Missing = 2
The frequencies have been weighted so that theanalysis reflects the distribution of students by grade

8/14/2019 PALO PINTO COUNTY - Gordon ISD - 2000 Texas School Survey of Drug and Alcohol Use
http://slidepdf.com/reader/full/palo-pinto-county-gordon-isd-2000-texas-school-survey-of-drug-and-alcohol 47/95
level in the district
8/14/2019 PALO PINTO COUNTY - Gordon ISD - 2000 Texas School Survey of Drug and Alcohol Use
http://slidepdf.com/reader/full/palo-pinto-county-gordon-isd-2000-texas-school-survey-of-drug-and-alcohol 48/95
GordonSpring 2000
The FREQ Procedure
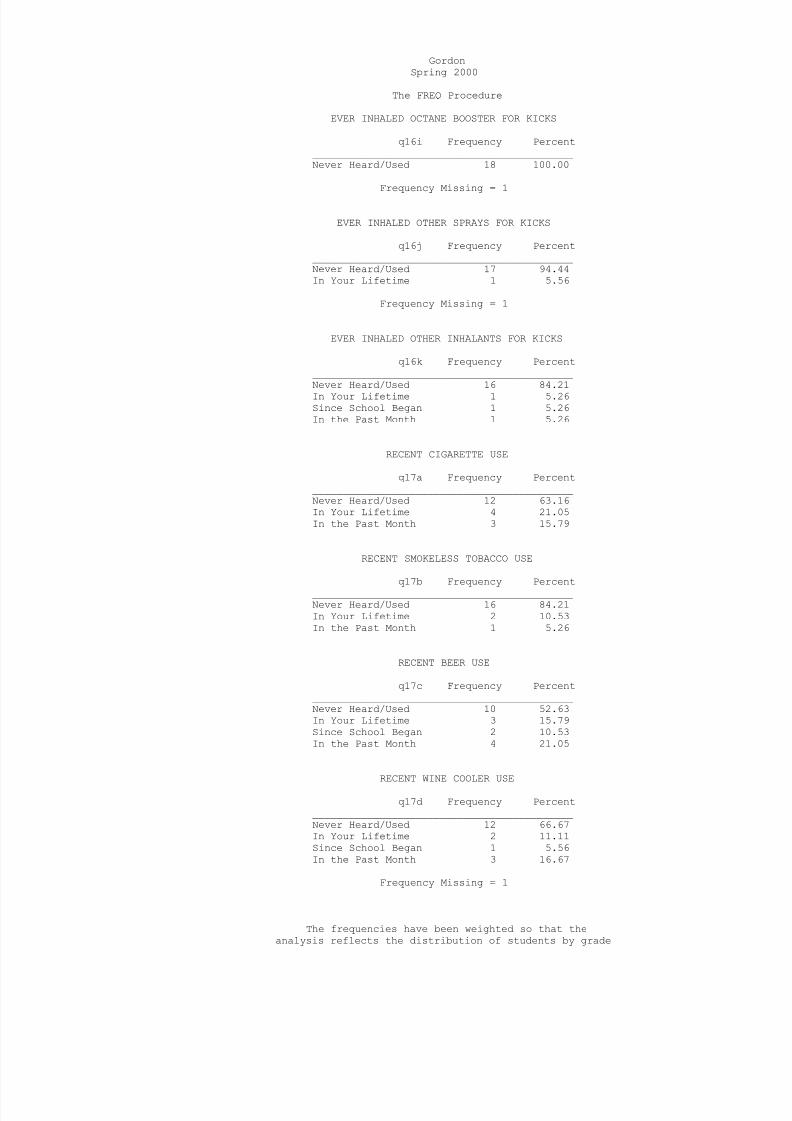
EVER INHALED OCTANE BOOSTER FOR KICKS
q16i Frequency Percent___________________________________________Never Heard/Used 18 100.00
Frequency Missing = 1
EVER INHALED OTHER SPRAYS FOR KICKS
q16j Frequency Percent___________________________________________Never Heard/Used 17 94.44In Your Lifetime 1 5.56
Frequency Missing = 1
EVER INHALED OTHER INHALANTS FOR KICKS
q16k Frequency Percent___________________________________________Never Heard/Used 16 84.21In Your Lifetime 1 5.26Since School Began 1 5.26In the Past Month 1 5.26
RECENT CIGARETTE USE
q17a Frequency Percent___________________________________________Never Heard/Used 12 63.16In Your Lifetime 4 21.05In the Past Month 3 15.79
RECENT SMOKELESS TOBACCO USE
q17b Frequency Percent___________________________________________Never Heard/Used 16 84.21In Your Lifetime 2 10.53In the Past Month 1 5.26
RECENT BEER USE
q17c Frequency Percent___________________________________________Never Heard/Used 10 52.63In Your Lifetime 3 15.79Since School Began 2 10.53In the Past Month 4 21.05
RECENT WINE COOLER USE q17d Frequency Percent
___________________________________________Never Heard/Used 12 66.67In Your Lifetime 2 11.11Since School Began 1 5.56In the Past Month 3 16.67
Frequency Missing = 1
The frequencies have been weighted so that theanalysis reflects the distribution of students by grade

8/14/2019 PALO PINTO COUNTY - Gordon ISD - 2000 Texas School Survey of Drug and Alcohol Use
http://slidepdf.com/reader/full/palo-pinto-county-gordon-isd-2000-texas-school-survey-of-drug-and-alcohol 49/95
level in the district
8/14/2019 PALO PINTO COUNTY - Gordon ISD - 2000 Texas School Survey of Drug and Alcohol Use
http://slidepdf.com/reader/full/palo-pinto-county-gordon-isd-2000-texas-school-survey-of-drug-and-alcohol 50/95
GordonSpring 2000
The FREQ Procedure
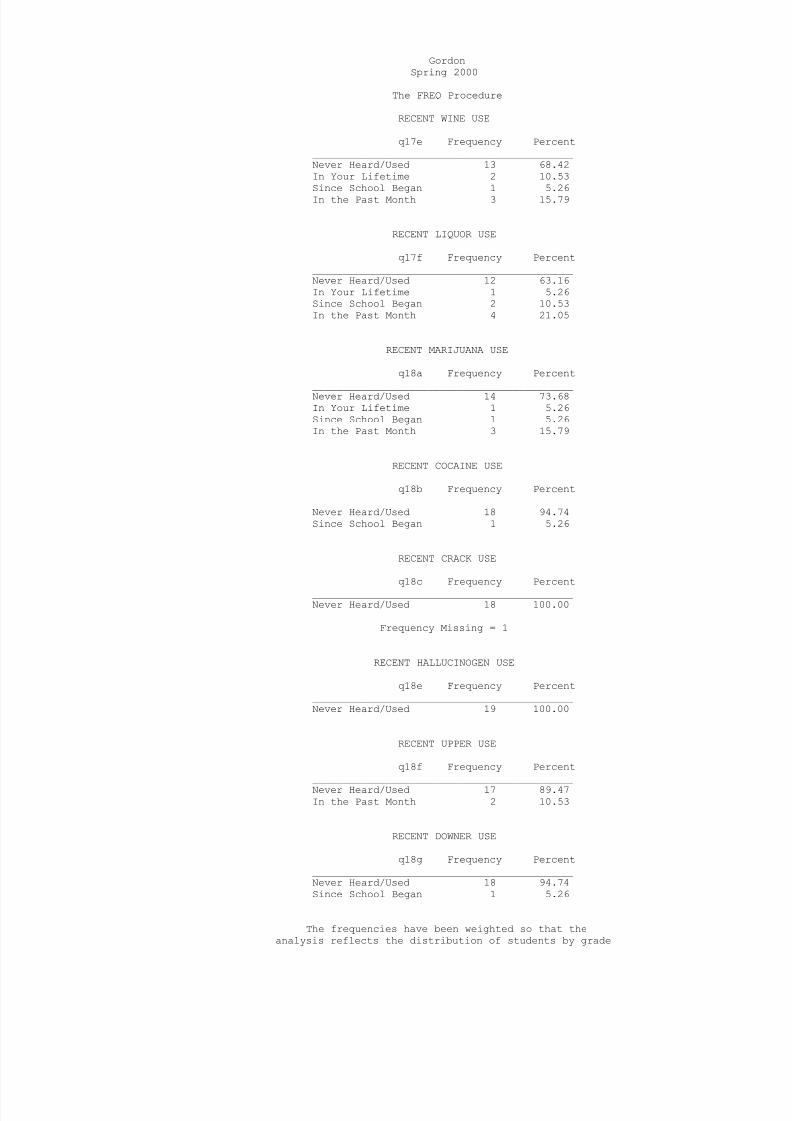
RECENT WINE USE
q17e Frequency Percent___________________________________________Never Heard/Used 13 68.42In Your Lifetime 2 10.53Since School Began 1 5.26In the Past Month 3 15.79
RECENT LIQUOR USE
q17f Frequency Percent___________________________________________Never Heard/Used 12 63.16In Your Lifetime 1 5.26Since School Began 2 10.53In the Past Month 4 21.05
RECENT MARIJUANA USE
q18a Frequency Percent___________________________________________Never Heard/Used 14 73.68In Your Lifetime 1 5.26Since School Began 1 5.26In the Past Month 3 15.79
RECENT COCAINE USE
q18b Frequency Percent___________________________________________Never Heard/Used 18 94.74Since School Began 1 5.26
RECENT CRACK USE
q18c Frequency Percent___________________________________________Never Heard/Used 18 100.00
Frequency Missing = 1
RECENT HALLUCINOGEN USE
q18e Frequency Percent___________________________________________Never Heard/Used 19 100.00
RECENT UPPER USE
q18f Frequency Percent
___________________________________________Never Heard/Used 17 89.47In the Past Month 2 10.53
RECENT DOWNER USE
q18g Frequency Percent___________________________________________Never Heard/Used 18 94.74Since School Began 1 5.26
The frequencies have been weighted so that theanalysis reflects the distribution of students by grade

8/14/2019 PALO PINTO COUNTY - Gordon ISD - 2000 Texas School Survey of Drug and Alcohol Use
http://slidepdf.com/reader/full/palo-pinto-county-gordon-isd-2000-texas-school-survey-of-drug-and-alcohol 51/95
level in the district
8/14/2019 PALO PINTO COUNTY - Gordon ISD - 2000 Texas School Survey of Drug and Alcohol Use
http://slidepdf.com/reader/full/palo-pinto-county-gordon-isd-2000-texas-school-survey-of-drug-and-alcohol 52/95
GordonSpring 2000
The FREQ Procedure
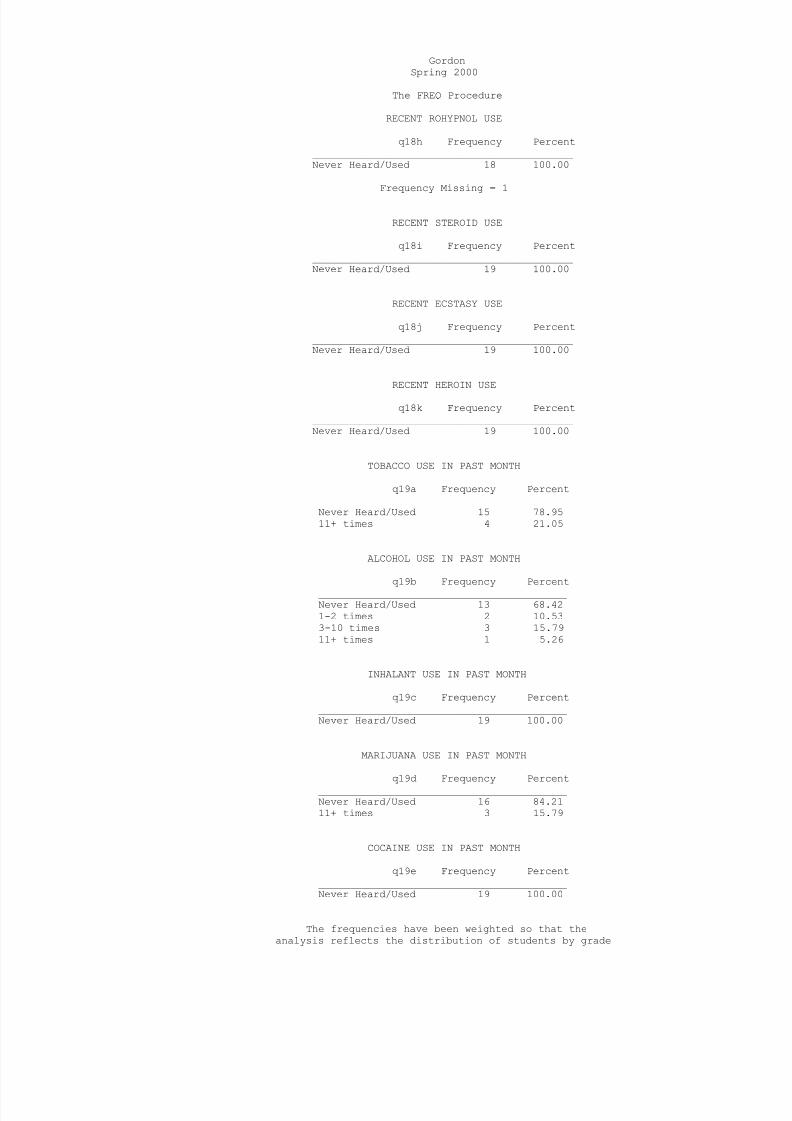
RECENT ROHYPNOL USE
q18h Frequency Percent___________________________________________Never Heard/Used 18 100.00
Frequency Missing = 1
RECENT STEROID USE
q18i Frequency Percent___________________________________________Never Heard/Used 19 100.00
RECENT ECSTASY USE
q18j Frequency Percent___________________________________________Never Heard/Used 19 100.00
RECENT HEROIN USE
q18k Frequency Percent___________________________________________Never Heard/Used 19 100.00
TOBACCO USE IN PAST MONTH
q19a Frequency Percent_________________________________________Never Heard/Used 15 78.9511+ times 4 21.05
ALCOHOL USE IN PAST MONTH
q19b Frequency Percent_________________________________________Never Heard/Used 13 68.421-2 times 2 10.533-10 times 3 15.7911+ times 1 5.26
INHALANT USE IN PAST MONTH
q19c Frequency Percent_________________________________________Never Heard/Used 19 100.00
MARIJUANA USE IN PAST MONTH
q19d Frequency Percent_________________________________________Never Heard/Used 16 84.2111+ times 3 15.79
COCAINE USE IN PAST MONTH
q19e Frequency Percent_________________________________________Never Heard/Used 19 100.00
The frequencies have been weighted so that theanalysis reflects the distribution of students by grade

8/14/2019 PALO PINTO COUNTY - Gordon ISD - 2000 Texas School Survey of Drug and Alcohol Use
http://slidepdf.com/reader/full/palo-pinto-county-gordon-isd-2000-texas-school-survey-of-drug-and-alcohol 53/95
level in the district
8/14/2019 PALO PINTO COUNTY - Gordon ISD - 2000 Texas School Survey of Drug and Alcohol Use
http://slidepdf.com/reader/full/palo-pinto-county-gordon-isd-2000-texas-school-survey-of-drug-and-alcohol 54/95
GordonSpring 2000
The FREQ Procedure
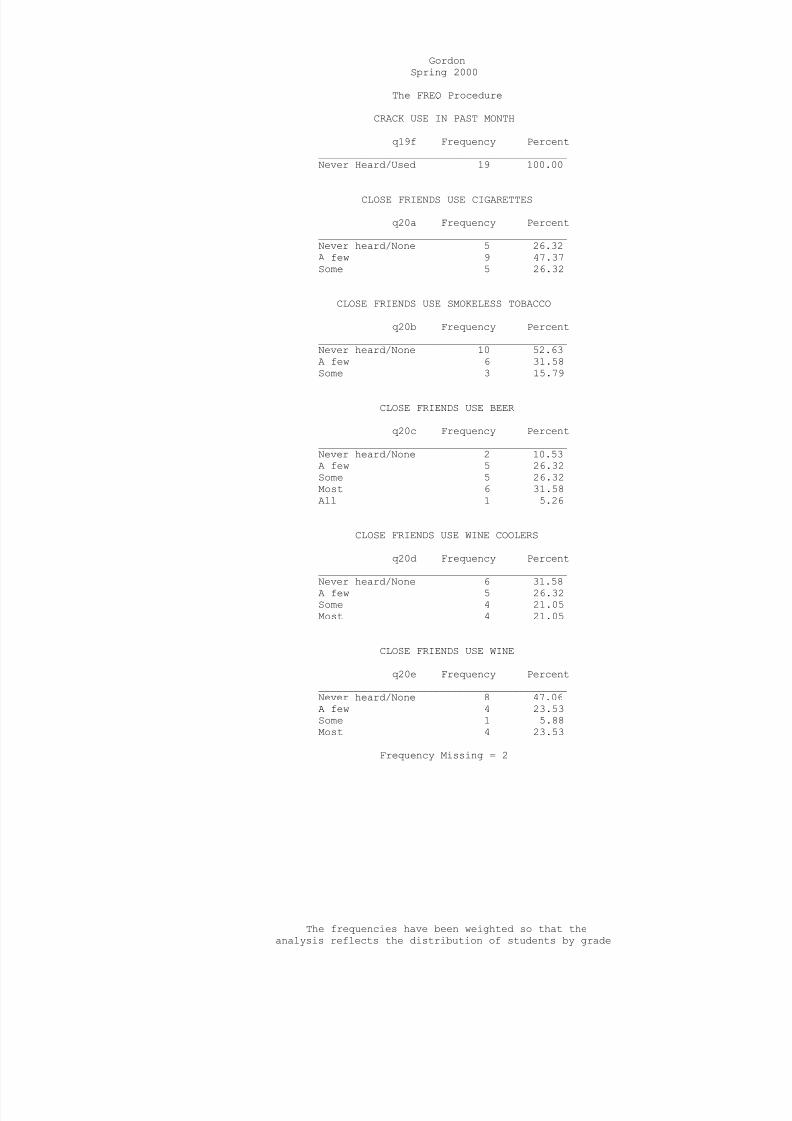
CRACK USE IN PAST MONTH
q19f Frequency Percent_________________________________________Never Heard/Used 19 100.00
CLOSE FRIENDS USE CIGARETTES
q20a Frequency Percent_________________________________________Never heard/None 5 26.32A few 9 47.37Some 5 26.32
CLOSE FRIENDS USE SMOKELESS TOBACCO
q20b Frequency Percent_________________________________________Never heard/None 10 52.63A few 6 31.58Some 3 15.79
CLOSE FRIENDS USE BEER
q20c Frequency Percent_________________________________________Never heard/None 2 10.53A few 5 26.32Some 5 26.32Most 6 31.58All 1 5.26
CLOSE FRIENDS USE WINE COOLERS
q20d Frequency Percent_________________________________________
Never heard/None 6 31.58A few 5 26.32Some 4 21.05Most 4 21.05
CLOSE FRIENDS USE WINE
q20e Frequency Percent_________________________________________Never heard/None 8 47.06A few 4 23.53Some 1 5.88Most 4 23.53
Frequency Missing = 2
The frequencies have been weighted so that theanalysis reflects the distribution of students by grade

8/14/2019 PALO PINTO COUNTY - Gordon ISD - 2000 Texas School Survey of Drug and Alcohol Use
http://slidepdf.com/reader/full/palo-pinto-county-gordon-isd-2000-texas-school-survey-of-drug-and-alcohol 55/95
level in the district
8/14/2019 PALO PINTO COUNTY - Gordon ISD - 2000 Texas School Survey of Drug and Alcohol Use
http://slidepdf.com/reader/full/palo-pinto-county-gordon-isd-2000-texas-school-survey-of-drug-and-alcohol 56/95
GordonSpring 2000
The FREQ Procedure
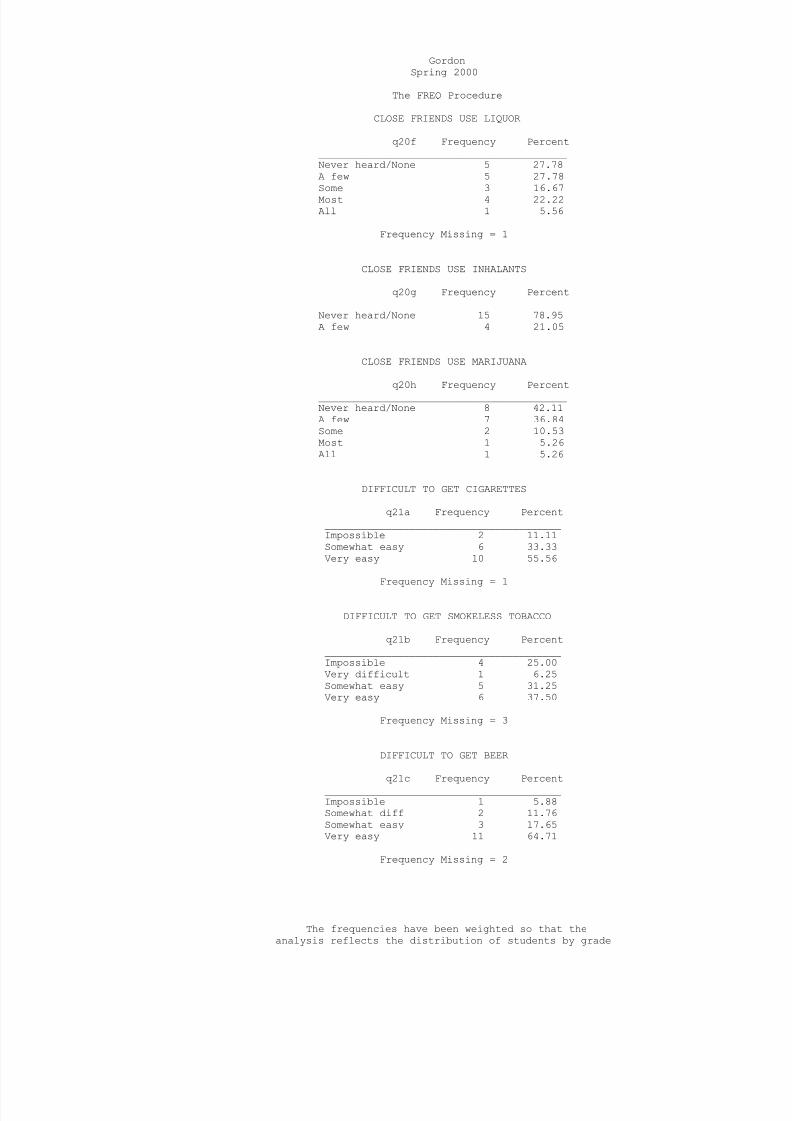
CLOSE FRIENDS USE LIQUOR
q20f Frequency Percent_________________________________________Never heard/None 5 27.78A few 5 27.78Some 3 16.67Most 4 22.22All 1 5.56
Frequency Missing = 1
CLOSE FRIENDS USE INHALANTS
q20g Frequency Percent_________________________________________Never heard/None 15 78.95A few 4 21.05
CLOSE FRIENDS USE MARIJUANA
q20h Frequency Percent_________________________________________Never heard/None 8 42.11A few 7 36.84Some 2 10.53Most 1 5.26All 1 5.26
DIFFICULT TO GET CIGARETTES
q21a Frequency Percent_______________________________________Impossible 2 11.11Somewhat easy 6 33.33Very easy 10 55.56
Frequency Missing = 1
DIFFICULT TO GET SMOKELESS TOBACCO
q21b Frequency Percent_______________________________________Impossible 4 25.00Very difficult 1 6.25Somewhat easy 5 31.25Very easy 6 37.50
Frequency Missing = 3
DIFFICULT TO GET BEER
q21c Frequency Percent_______________________________________Impossible 1 5.88Somewhat diff 2 11.76Somewhat easy 3 17.65Very easy 11 64.71
Frequency Missing = 2
The frequencies have been weighted so that theanalysis reflects the distribution of students by grade

8/14/2019 PALO PINTO COUNTY - Gordon ISD - 2000 Texas School Survey of Drug and Alcohol Use
http://slidepdf.com/reader/full/palo-pinto-county-gordon-isd-2000-texas-school-survey-of-drug-and-alcohol 57/95
level in the district
8/14/2019 PALO PINTO COUNTY - Gordon ISD - 2000 Texas School Survey of Drug and Alcohol Use
http://slidepdf.com/reader/full/palo-pinto-county-gordon-isd-2000-texas-school-survey-of-drug-and-alcohol 58/95
GordonSpring 2000
The FREQ Procedure
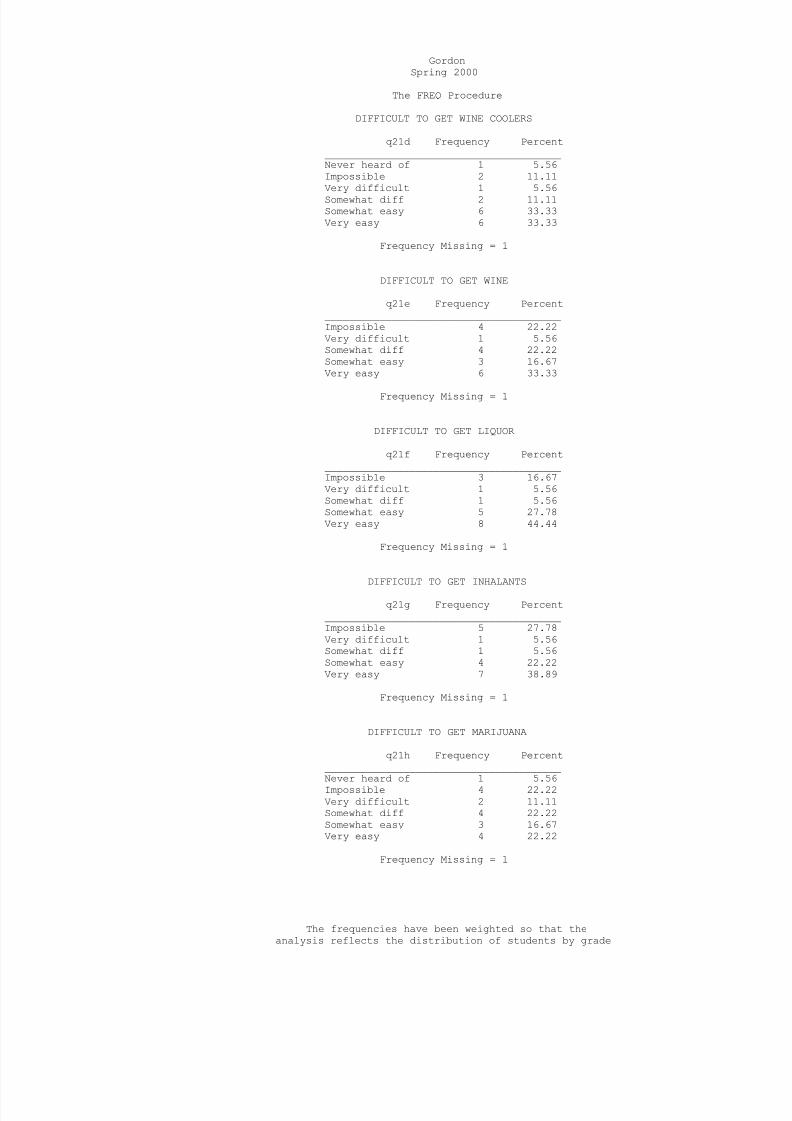
DIFFICULT TO GET WINE COOLERS
q21d Frequency Percent_______________________________________Never heard of 1 5.56Impossible 2 11.11Very difficult 1 5.56Somewhat diff 2 11.11Somewhat easy 6 33.33Very easy 6 33.33
Frequency Missing = 1
DIFFICULT TO GET WINE
q21e Frequency Percent_______________________________________Impossible 4 22.22Very difficult 1 5.56Somewhat diff 4 22.22Somewhat easy 3 16.67Very easy 6 33.33
Frequency Missing = 1
DIFFICULT TO GET LIQUOR
q21f Frequency Percent_______________________________________Impossible 3 16.67Very difficult 1 5.56Somewhat diff 1 5.56Somewhat easy 5 27.78Very easy 8 44.44
Frequency Missing = 1
DIFFICULT TO GET INHALANTS q21g Frequency Percent
_______________________________________Impossible 5 27.78Very difficult 1 5.56Somewhat diff 1 5.56Somewhat easy 4 22.22Very easy 7 38.89
Frequency Missing = 1
DIFFICULT TO GET MARIJUANA
q21h Frequency Percent_______________________________________
Never heard of 1 5.56Impossible 4 22.22Very difficult 2 11.11Somewhat diff 4 22.22Somewhat easy 3 16.67Very easy 4 22.22
Frequency Missing = 1
The frequencies have been weighted so that theanalysis reflects the distribution of students by grade

8/14/2019 PALO PINTO COUNTY - Gordon ISD - 2000 Texas School Survey of Drug and Alcohol Use
http://slidepdf.com/reader/full/palo-pinto-county-gordon-isd-2000-texas-school-survey-of-drug-and-alcohol 59/95
level in the district
8/14/2019 PALO PINTO COUNTY - Gordon ISD - 2000 Texas School Survey of Drug and Alcohol Use
http://slidepdf.com/reader/full/palo-pinto-county-gordon-isd-2000-texas-school-survey-of-drug-and-alcohol 60/95
GordonSpring 2000
The FREQ Procedure
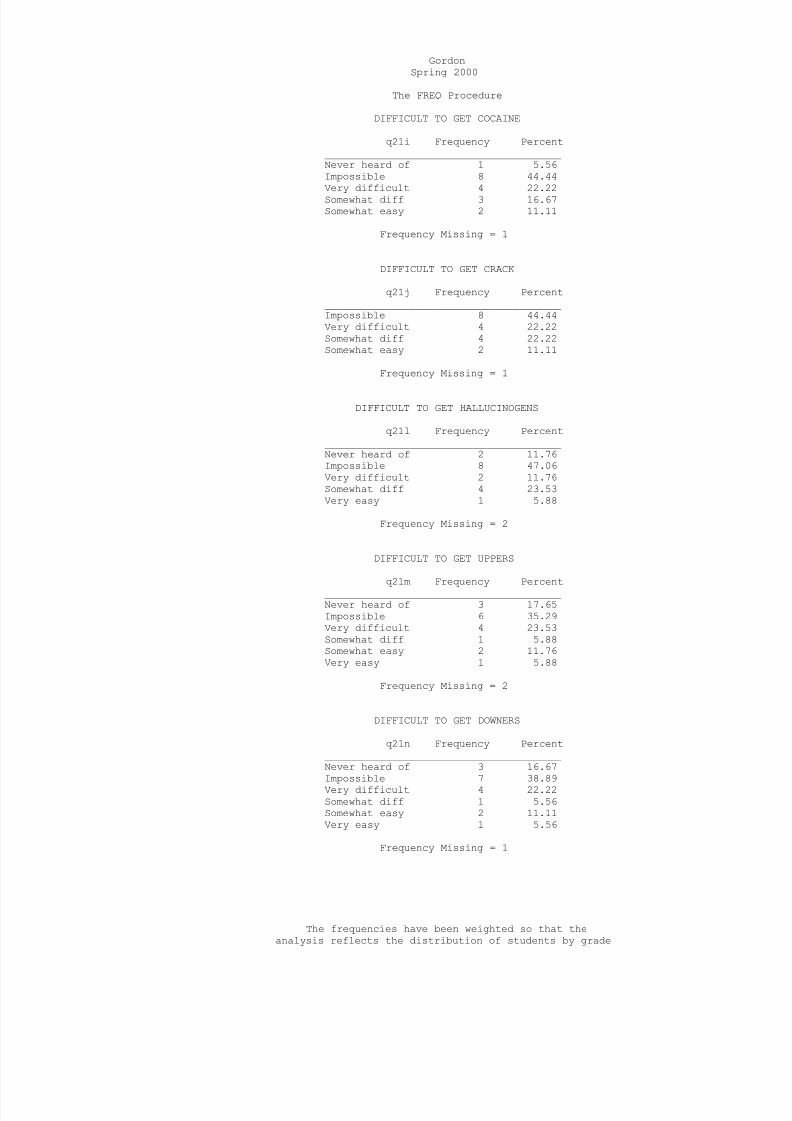
DIFFICULT TO GET COCAINE
q21i Frequency Percent_______________________________________Never heard of 1 5.56Impossible 8 44.44Very difficult 4 22.22Somewhat diff 3 16.67Somewhat easy 2 11.11
Frequency Missing = 1
DIFFICULT TO GET CRACK
q21j Frequency Percent_______________________________________Impossible 8 44.44Very difficult 4 22.22Somewhat diff 4 22.22Somewhat easy 2 11.11
Frequency Missing = 1
DIFFICULT TO GET HALLUCINOGENS
q21l Frequency Percent_______________________________________Never heard of 2 11.76Impossible 8 47.06Very difficult 2 11.76Somewhat diff 4 23.53Very easy 1 5.88
Frequency Missing = 2
DIFFICULT TO GET UPPERS
q21m Frequency Percent_______________________________________Never heard of 3 17.65Impossible 6 35.29Very difficult 4 23.53Somewhat diff 1 5.88Somewhat easy 2 11.76Very easy 1 5.88
Frequency Missing = 2
DIFFICULT TO GET DOWNERS
q21n Frequency Percent_______________________________________Never heard of 3 16.67
Impossible 7 38.89Very difficult 4 22.22Somewhat diff 1 5.56Somewhat easy 2 11.11Very easy 1 5.56
Frequency Missing = 1
The frequencies have been weighted so that theanalysis reflects the distribution of students by grade

8/14/2019 PALO PINTO COUNTY - Gordon ISD - 2000 Texas School Survey of Drug and Alcohol Use
http://slidepdf.com/reader/full/palo-pinto-county-gordon-isd-2000-texas-school-survey-of-drug-and-alcohol 61/95
level in the district
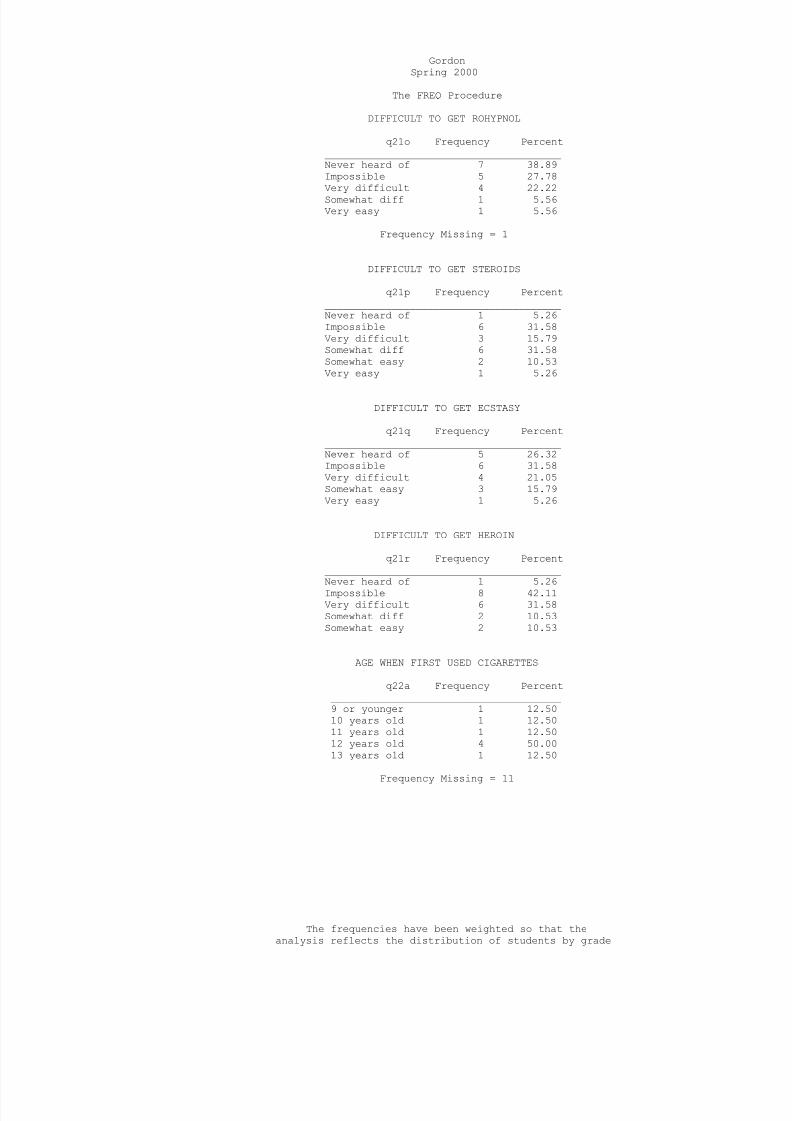
8/14/2019 PALO PINTO COUNTY - Gordon ISD - 2000 Texas School Survey of Drug and Alcohol Use
http://slidepdf.com/reader/full/palo-pinto-county-gordon-isd-2000-texas-school-survey-of-drug-and-alcohol 62/95
GordonSpring 2000
The FREQ Procedure
DIFFICULT TO GET ROHYPNOL
q21o Frequency Percent_______________________________________Never heard of 7 38.89Impossible 5 27.78Very difficult 4 22.22Somewhat diff 1 5.56Very easy 1 5.56
Frequency Missing = 1
DIFFICULT TO GET STEROIDS
q21p Frequency Percent_______________________________________Never heard of 1 5.26Impossible 6 31.58Very difficult 3 15.79Somewhat diff 6 31.58Somewhat easy 2 10.53Very easy 1 5.26
DIFFICULT TO GET ECSTASY
q21q Frequency Percent_______________________________________Never heard of 5 26.32Impossible 6 31.58Very difficult 4 21.05Somewhat easy 3 15.79Very easy 1 5.26
DIFFICULT TO GET HEROIN
q21r Frequency Percent_______________________________________
Never heard of 1 5.26Impossible 8 42.11Very difficult 6 31.58Somewhat diff 2 10.53Somewhat easy 2 10.53
AGE WHEN FIRST USED CIGARETTES
q22a Frequency Percent______________________________________9 or younger 1 12.5010 years old 1 12.5011 years old 1 12.5012 years old 4 50.0013 years old 1 12.50
Frequency Missing = 11
The frequencies have been weighted so that theanalysis reflects the distribution of students by grade

8/14/2019 PALO PINTO COUNTY - Gordon ISD - 2000 Texas School Survey of Drug and Alcohol Use
http://slidepdf.com/reader/full/palo-pinto-county-gordon-isd-2000-texas-school-survey-of-drug-and-alcohol 63/95
level in the district
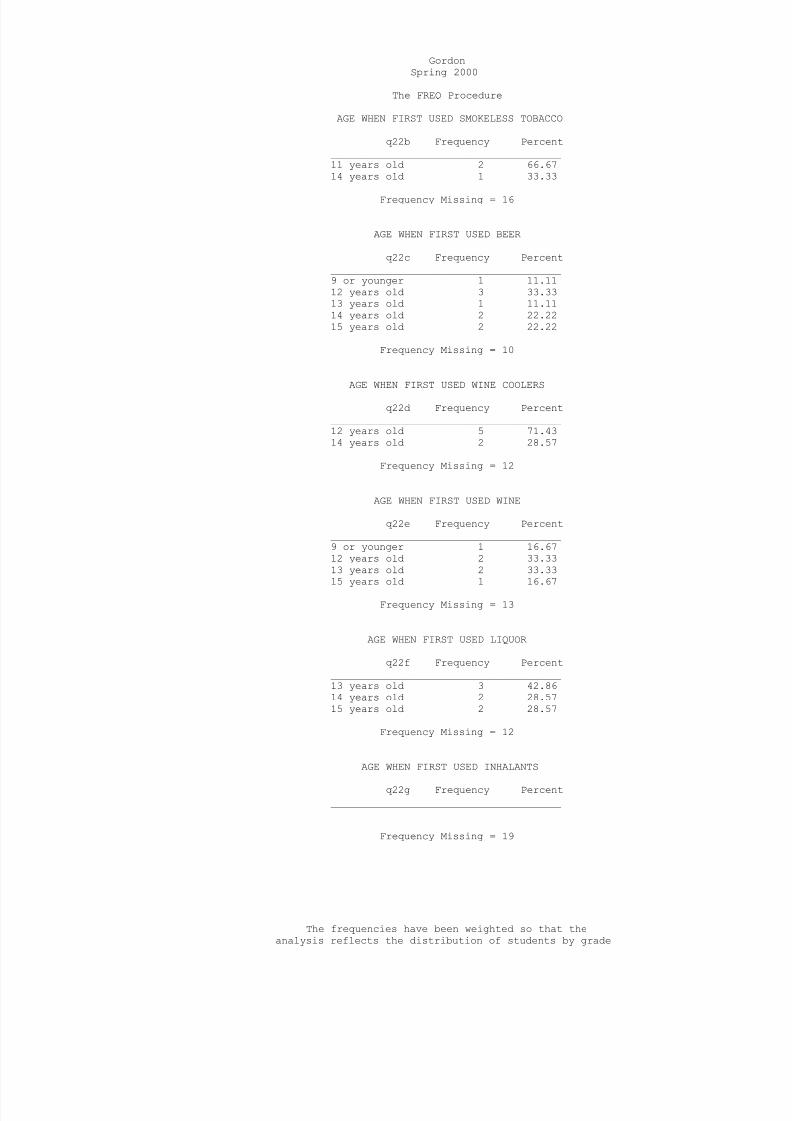
8/14/2019 PALO PINTO COUNTY - Gordon ISD - 2000 Texas School Survey of Drug and Alcohol Use
http://slidepdf.com/reader/full/palo-pinto-county-gordon-isd-2000-texas-school-survey-of-drug-and-alcohol 64/95
GordonSpring 2000
The FREQ Procedure
AGE WHEN FIRST USED SMOKELESS TOBACCO
q22b Frequency Percent______________________________________11 years old 2 66.6714 years old 1 33.33
Frequency Missing = 16
AGE WHEN FIRST USED BEER
q22c Frequency Percent______________________________________9 or younger 1 11.1112 years old 3 33.3313 years old 1 11.1114 years old 2 22.2215 years old 2 22.22
Frequency Missing = 10
AGE WHEN FIRST USED WINE COOLERS
q22d Frequency Percent______________________________________12 years old 5 71.4314 years old 2 28.57
Frequency Missing = 12
AGE WHEN FIRST USED WINE
q22e Frequency Percent______________________________________9 or younger 1 16.6712 years old 2 33.3313 years old 2 33.33
15 years old 1 16.67Frequency Missing = 13
AGE WHEN FIRST USED LIQUOR
q22f Frequency Percent______________________________________13 years old 3 42.8614 years old 2 28.5715 years old 2 28.57
Frequency Missing = 12
AGE WHEN FIRST USED INHALANTS
q22g Frequency Percent______________________________________
Frequency Missing = 19
The frequencies have been weighted so that theanalysis reflects the distribution of students by grade

8/14/2019 PALO PINTO COUNTY - Gordon ISD - 2000 Texas School Survey of Drug and Alcohol Use
http://slidepdf.com/reader/full/palo-pinto-county-gordon-isd-2000-texas-school-survey-of-drug-and-alcohol 65/95
level in the district
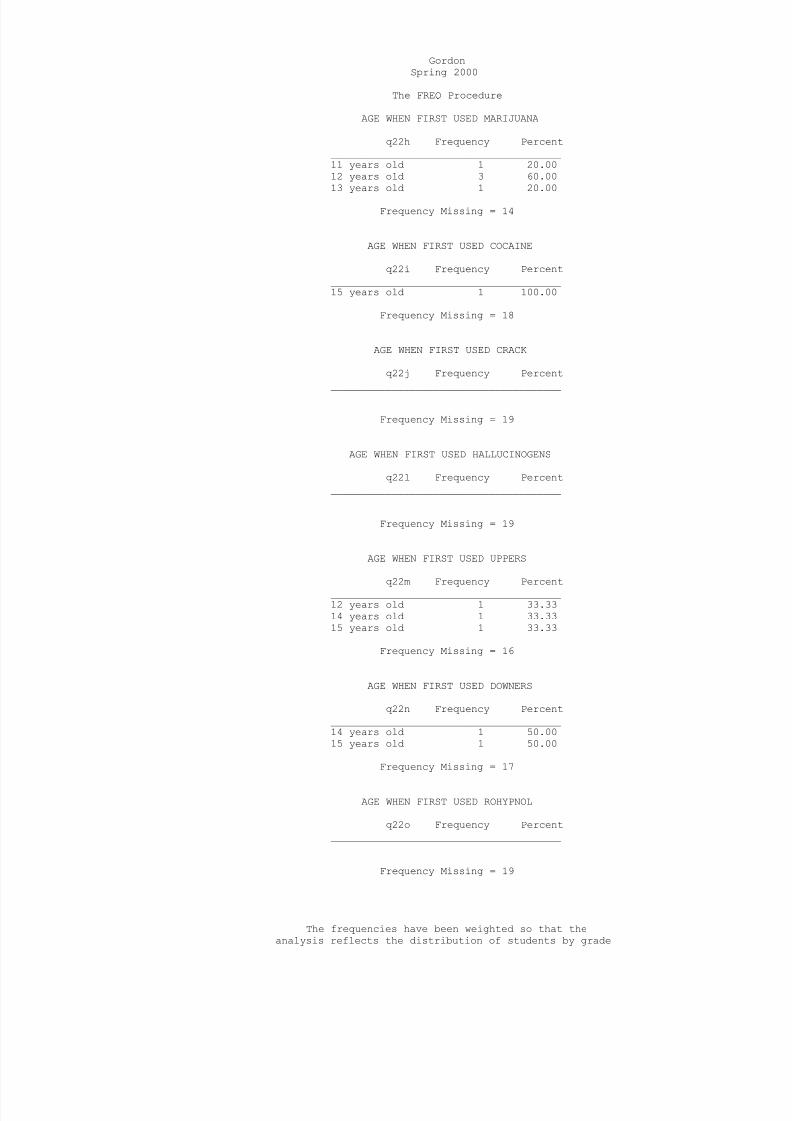
8/14/2019 PALO PINTO COUNTY - Gordon ISD - 2000 Texas School Survey of Drug and Alcohol Use
http://slidepdf.com/reader/full/palo-pinto-county-gordon-isd-2000-texas-school-survey-of-drug-and-alcohol 66/95
GordonSpring 2000
The FREQ Procedure
AGE WHEN FIRST USED MARIJUANA
q22h Frequency Percent______________________________________11 years old 1 20.0012 years old 3 60.0013 years old 1 20.00
Frequency Missing = 14
AGE WHEN FIRST USED COCAINE
q22i Frequency Percent______________________________________15 years old 1 100.00
Frequency Missing = 18
AGE WHEN FIRST USED CRACK
q22j Frequency Percent______________________________________
Frequency Missing = 19
AGE WHEN FIRST USED HALLUCINOGENS
q22l Frequency Percent______________________________________
Frequency Missing = 19
AGE WHEN FIRST USED UPPERS
q22m Frequency Percent______________________________________12 years old 1 33.3314 years old 1 33.3315 years old 1 33.33
Frequency Missing = 16
AGE WHEN FIRST USED DOWNERS
q22n Frequency Percent______________________________________14 years old 1 50.0015 years old 1 50.00
Frequency Missing = 17
AGE WHEN FIRST USED ROHYPNOL
q22o Frequency Percent______________________________________
Frequency Missing = 19
The frequencies have been weighted so that theanalysis reflects the distribution of students by grade

8/14/2019 PALO PINTO COUNTY - Gordon ISD - 2000 Texas School Survey of Drug and Alcohol Use
http://slidepdf.com/reader/full/palo-pinto-county-gordon-isd-2000-texas-school-survey-of-drug-and-alcohol 67/95
level in the district
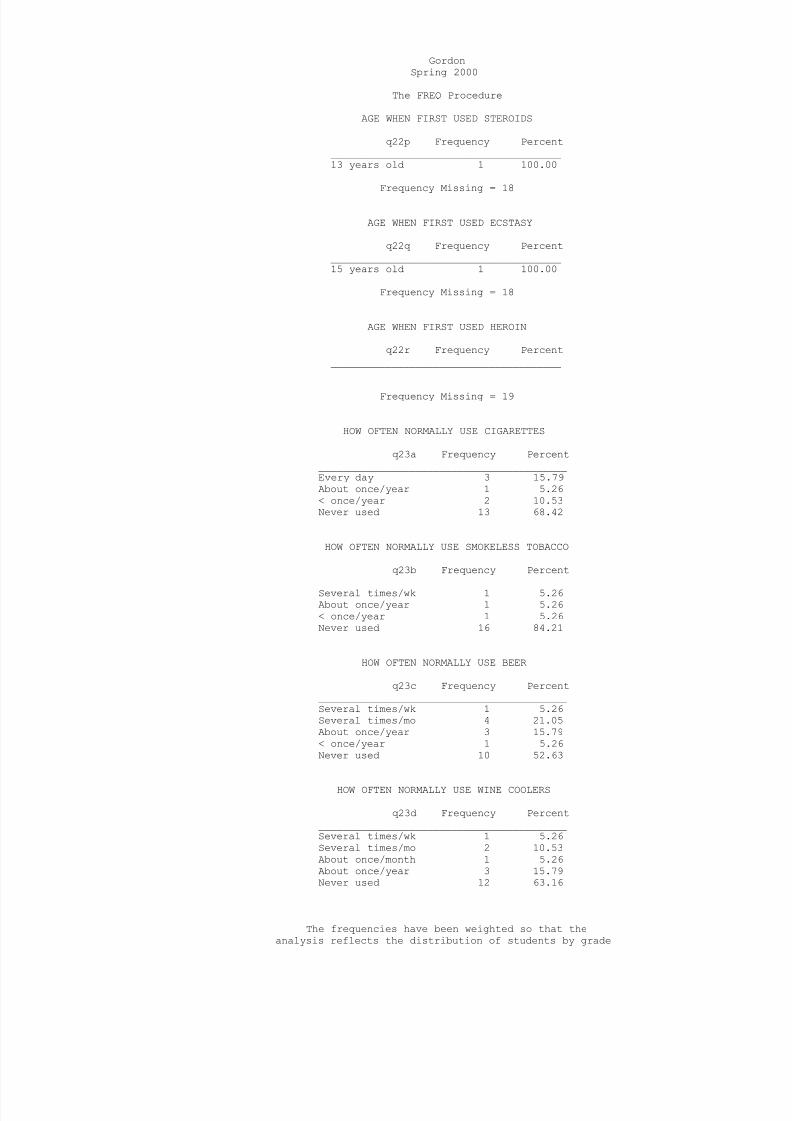
8/14/2019 PALO PINTO COUNTY - Gordon ISD - 2000 Texas School Survey of Drug and Alcohol Use
http://slidepdf.com/reader/full/palo-pinto-county-gordon-isd-2000-texas-school-survey-of-drug-and-alcohol 68/95
GordonSpring 2000
The FREQ Procedure
AGE WHEN FIRST USED STEROIDS
q22p Frequency Percent______________________________________13 years old 1 100.00
Frequency Missing = 18
AGE WHEN FIRST USED ECSTASY
q22q Frequency Percent______________________________________15 years old 1 100.00
Frequency Missing = 18
AGE WHEN FIRST USED HEROIN
q22r Frequency Percent______________________________________
Frequency Missing = 19
HOW OFTEN NORMALLY USE CIGARETTES
q23a Frequency Percent_________________________________________Every day 3 15.79About once/year 1 5.26< once/year 2 10.53Never used 13 68.42
HOW OFTEN NORMALLY USE SMOKELESS TOBACCO
q23b Frequency Percent
_________________________________________Several times/wk 1 5.26About once/year 1 5.26< once/year 1 5.26Never used 16 84.21
HOW OFTEN NORMALLY USE BEER
q23c Frequency Percent_________________________________________Several times/wk 1 5.26Several times/mo 4 21.05About once/year 3 15.79< once/year 1 5.26Never used 10 52.63
HOW OFTEN NORMALLY USE WINE COOLERS
q23d Frequency Percent_________________________________________Several times/wk 1 5.26Several times/mo 2 10.53About once/month 1 5.26About once/year 3 15.79Never used 12 63.16
The frequencies have been weighted so that theanalysis reflects the distribution of students by grade

8/14/2019 PALO PINTO COUNTY - Gordon ISD - 2000 Texas School Survey of Drug and Alcohol Use
http://slidepdf.com/reader/full/palo-pinto-county-gordon-isd-2000-texas-school-survey-of-drug-and-alcohol 69/95
level in the district
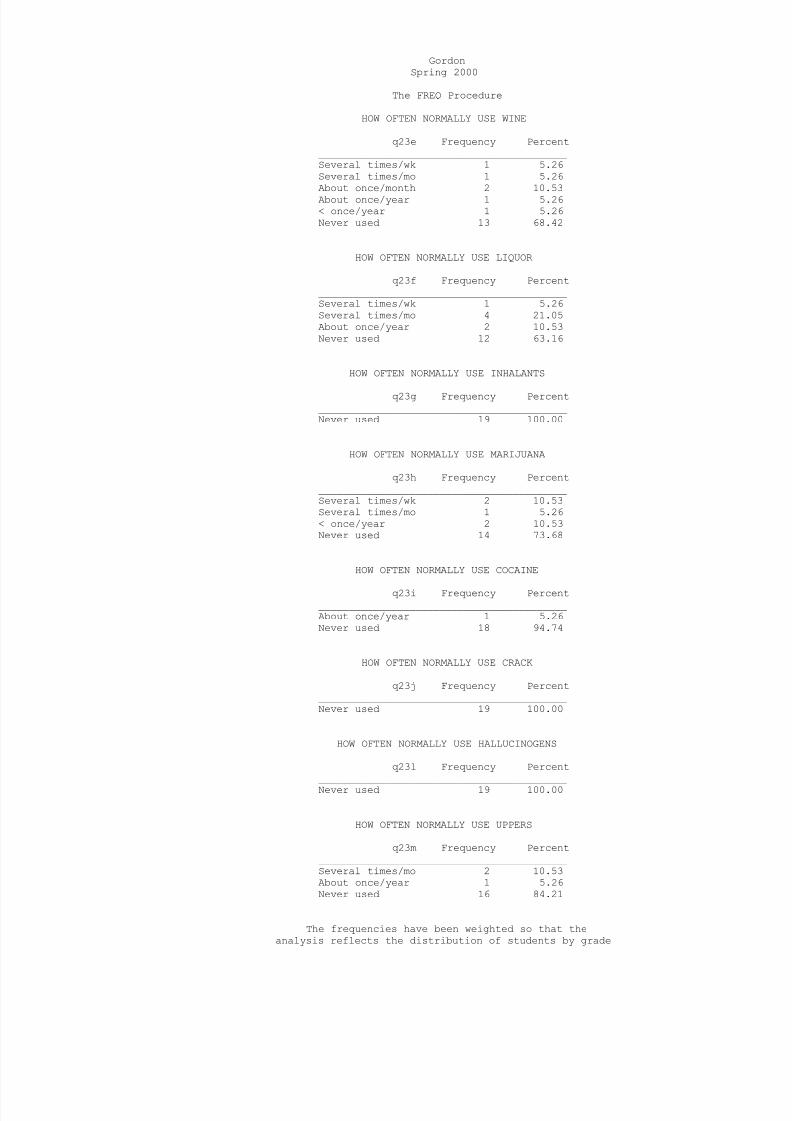
8/14/2019 PALO PINTO COUNTY - Gordon ISD - 2000 Texas School Survey of Drug and Alcohol Use
http://slidepdf.com/reader/full/palo-pinto-county-gordon-isd-2000-texas-school-survey-of-drug-and-alcohol 70/95
GordonSpring 2000
The FREQ Procedure
HOW OFTEN NORMALLY USE WINE
q23e Frequency Percent_________________________________________Several times/wk 1 5.26Several times/mo 1 5.26About once/month 2 10.53About once/year 1 5.26< once/year 1 5.26Never used 13 68.42
HOW OFTEN NORMALLY USE LIQUOR
q23f Frequency Percent_________________________________________Several times/wk 1 5.26Several times/mo 4 21.05About once/year 2 10.53Never used 12 63.16
HOW OFTEN NORMALLY USE INHALANTS
q23g Frequency Percent_________________________________________Never used 19 100.00
HOW OFTEN NORMALLY USE MARIJUANA
q23h Frequency Percent_________________________________________Several times/wk 2 10.53Several times/mo 1 5.26< once/year 2 10.53Never used 14 73.68
HOW OFTEN NORMALLY USE COCAINE
q23i Frequency Percent_________________________________________About once/year 1 5.26Never used 18 94.74
HOW OFTEN NORMALLY USE CRACK
q23j Frequency Percent_________________________________________Never used 19 100.00
HOW OFTEN NORMALLY USE HALLUCINOGENS
q23l Frequency Percent
_________________________________________Never used 19 100.00
HOW OFTEN NORMALLY USE UPPERS
q23m Frequency Percent_________________________________________Several times/mo 2 10.53About once/year 1 5.26Never used 16 84.21
The frequencies have been weighted so that theanalysis reflects the distribution of students by grade

8/14/2019 PALO PINTO COUNTY - Gordon ISD - 2000 Texas School Survey of Drug and Alcohol Use
http://slidepdf.com/reader/full/palo-pinto-county-gordon-isd-2000-texas-school-survey-of-drug-and-alcohol 71/95
level in the district
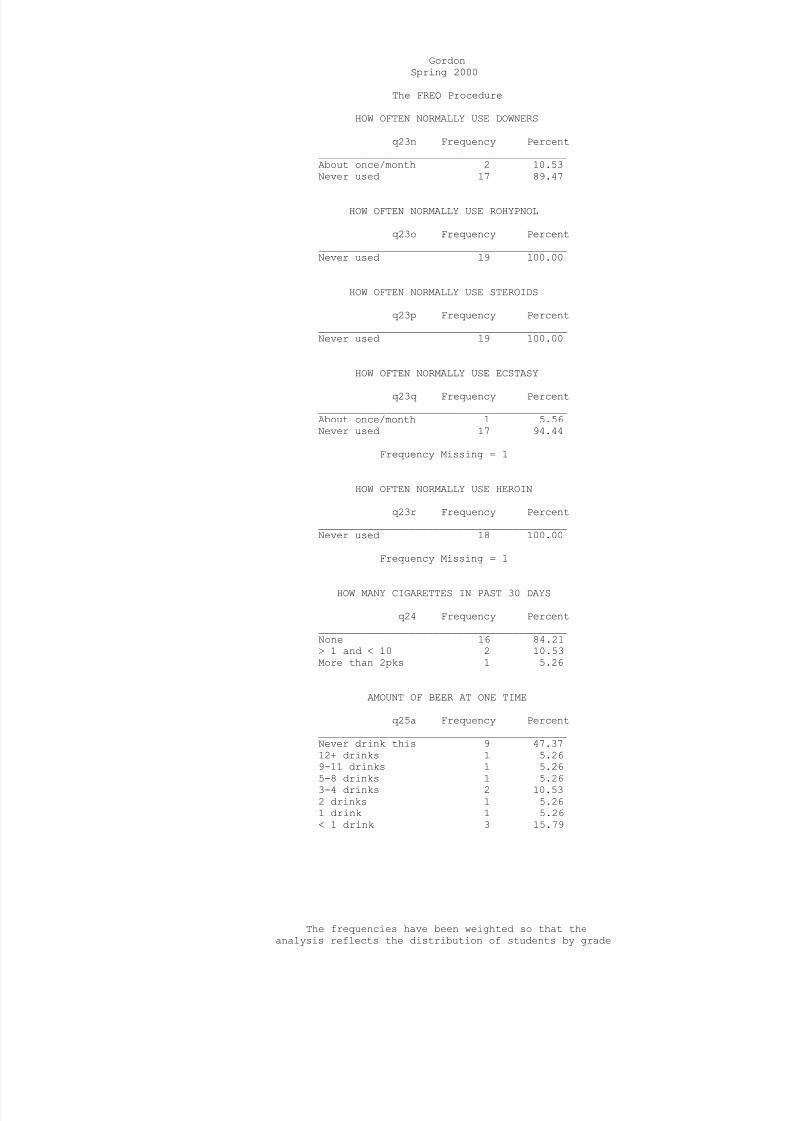
8/14/2019 PALO PINTO COUNTY - Gordon ISD - 2000 Texas School Survey of Drug and Alcohol Use
http://slidepdf.com/reader/full/palo-pinto-county-gordon-isd-2000-texas-school-survey-of-drug-and-alcohol 72/95
GordonSpring 2000
The FREQ Procedure
HOW OFTEN NORMALLY USE DOWNERS
q23n Frequency Percent_________________________________________About once/month 2 10.53Never used 17 89.47
HOW OFTEN NORMALLY USE ROHYPNOL
q23o Frequency Percent_________________________________________Never used 19 100.00
HOW OFTEN NORMALLY USE STEROIDS
q23p Frequency Percent_________________________________________Never used 19 100.00
HOW OFTEN NORMALLY USE ECSTASY
q23q Frequency Percent_________________________________________About once/month 1 5.56Never used 17 94.44
Frequency Missing = 1
HOW OFTEN NORMALLY USE HEROIN
q23r Frequency Percent_________________________________________Never used 18 100.00
Frequency Missing = 1
HOW MANY CIGARETTES IN PAST 30 DAYS
q24 Frequency Percent_________________________________________None 16 84.21> 1 and < 10 2 10.53More than 2pks 1 5.26
AMOUNT OF BEER AT ONE TIME
q25a Frequency Percent_________________________________________Never drink this 9 47.3712+ drinks 1 5.269-11 drinks 1 5.26
5-8 drinks 1 5.263-4 drinks 2 10.532 drinks 1 5.261 drink 1 5.26< 1 drink 3 15.79
The frequencies have been weighted so that theanalysis reflects the distribution of students by grade

8/14/2019 PALO PINTO COUNTY - Gordon ISD - 2000 Texas School Survey of Drug and Alcohol Use
http://slidepdf.com/reader/full/palo-pinto-county-gordon-isd-2000-texas-school-survey-of-drug-and-alcohol 73/95
level in the district
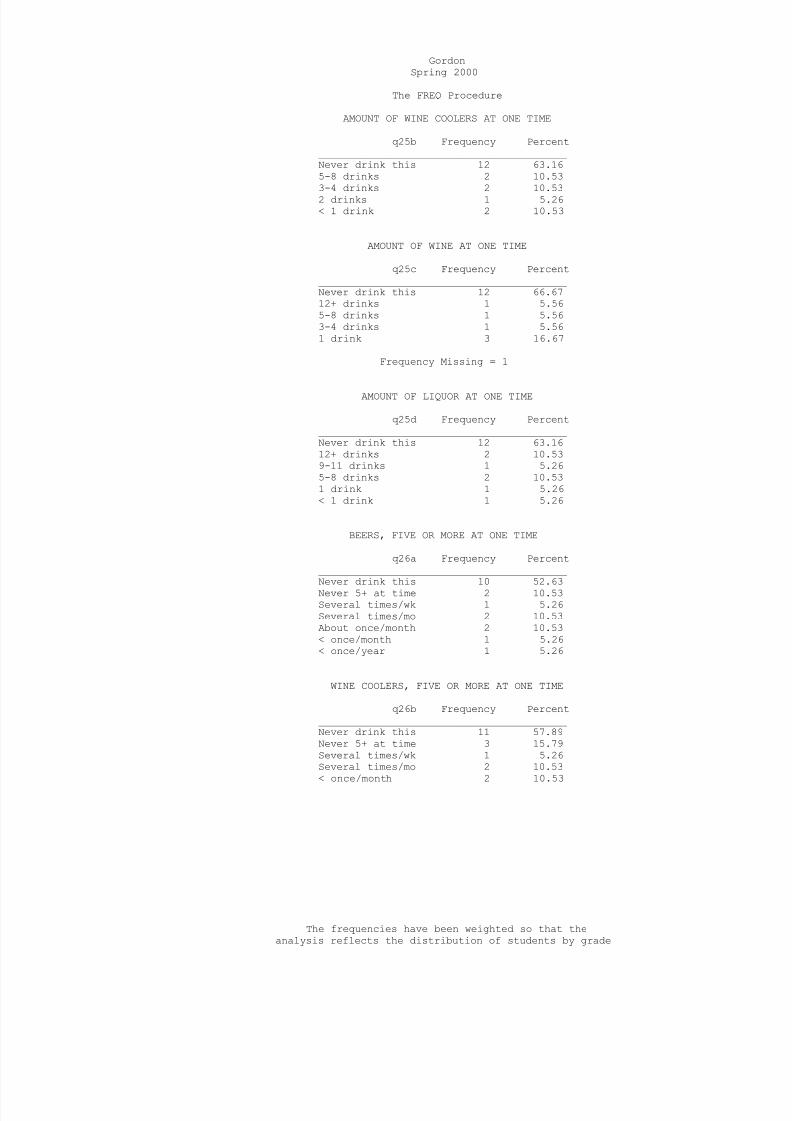
8/14/2019 PALO PINTO COUNTY - Gordon ISD - 2000 Texas School Survey of Drug and Alcohol Use
http://slidepdf.com/reader/full/palo-pinto-county-gordon-isd-2000-texas-school-survey-of-drug-and-alcohol 74/95
GordonSpring 2000
The FREQ Procedure
AMOUNT OF WINE COOLERS AT ONE TIME
q25b Frequency Percent_________________________________________Never drink this 12 63.165-8 drinks 2 10.533-4 drinks 2 10.532 drinks 1 5.26< 1 drink 2 10.53
AMOUNT OF WINE AT ONE TIME
q25c Frequency Percent_________________________________________Never drink this 12 66.6712+ drinks 1 5.565-8 drinks 1 5.563-4 drinks 1 5.561 drink 3 16.67
Frequency Missing = 1
AMOUNT OF LIQUOR AT ONE TIME
q25d Frequency Percent_________________________________________Never drink this 12 63.1612+ drinks 2 10.539-11 drinks 1 5.265-8 drinks 2 10.531 drink 1 5.26< 1 drink 1 5.26
BEERS, FIVE OR MORE AT ONE TIME
q26a Frequency Percent_________________________________________
Never drink this 10 52.63Never 5+ at time 2 10.53Several times/wk 1 5.26Several times/mo 2 10.53About once/month 2 10.53< once/month 1 5.26< once/year 1 5.26
WINE COOLERS, FIVE OR MORE AT ONE TIME
q26b Frequency Percent_________________________________________Never drink this 11 57.89Never 5+ at time 3 15.79Several times/wk 1 5.26Several times/mo 2 10.53
< once/month 2 10.53
The frequencies have been weighted so that theanalysis reflects the distribution of students by grade

8/14/2019 PALO PINTO COUNTY - Gordon ISD - 2000 Texas School Survey of Drug and Alcohol Use
http://slidepdf.com/reader/full/palo-pinto-county-gordon-isd-2000-texas-school-survey-of-drug-and-alcohol 75/95
level in the district
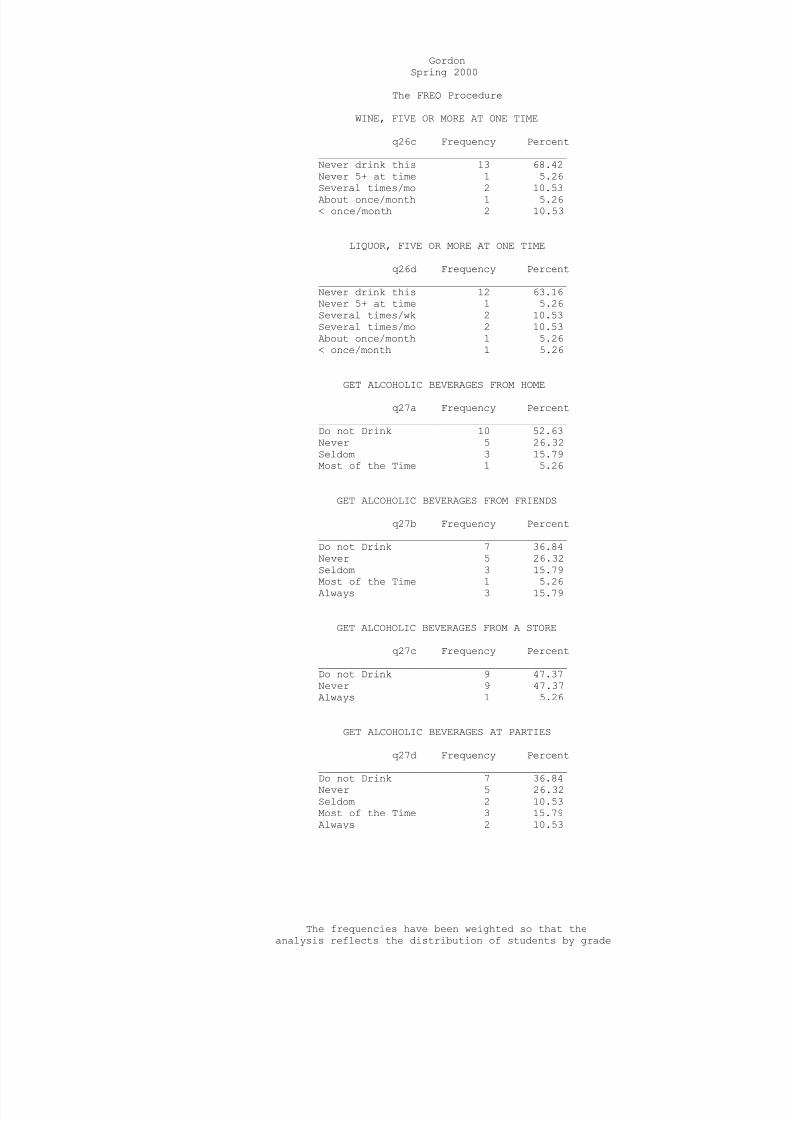
8/14/2019 PALO PINTO COUNTY - Gordon ISD - 2000 Texas School Survey of Drug and Alcohol Use
http://slidepdf.com/reader/full/palo-pinto-county-gordon-isd-2000-texas-school-survey-of-drug-and-alcohol 76/95
GordonSpring 2000
The FREQ Procedure
WINE, FIVE OR MORE AT ONE TIME
q26c Frequency Percent_________________________________________Never drink this 13 68.42Never 5+ at time 1 5.26Several times/mo 2 10.53About once/month 1 5.26< once/month 2 10.53
LIQUOR, FIVE OR MORE AT ONE TIME
q26d Frequency Percent_________________________________________Never drink this 12 63.16Never 5+ at time 1 5.26Several times/wk 2 10.53Several times/mo 2 10.53About once/month 1 5.26< once/month 1 5.26
GET ALCOHOLIC BEVERAGES FROM HOME
q27a Frequency Percent_________________________________________Do not Drink 10 52.63Never 5 26.32Seldom 3 15.79Most of the Time 1 5.26
GET ALCOHOLIC BEVERAGES FROM FRIENDS
q27b Frequency Percent_________________________________________Do not Drink 7 36.84Never 5 26.32Seldom 3 15.79
Most of the Time 1 5.26Always 3 15.79
GET ALCOHOLIC BEVERAGES FROM A STORE
q27c Frequency Percent_________________________________________Do not Drink 9 47.37Never 9 47.37Always 1 5.26
GET ALCOHOLIC BEVERAGES AT PARTIES
q27d Frequency Percent_________________________________________
Do not Drink 7 36.84Never 5 26.32Seldom 2 10.53Most of the Time 3 15.79Always 2 10.53
The frequencies have been weighted so that theanalysis reflects the distribution of students by grade

8/14/2019 PALO PINTO COUNTY - Gordon ISD - 2000 Texas School Survey of Drug and Alcohol Use
http://slidepdf.com/reader/full/palo-pinto-county-gordon-isd-2000-texas-school-survey-of-drug-and-alcohol 77/95
level in the district
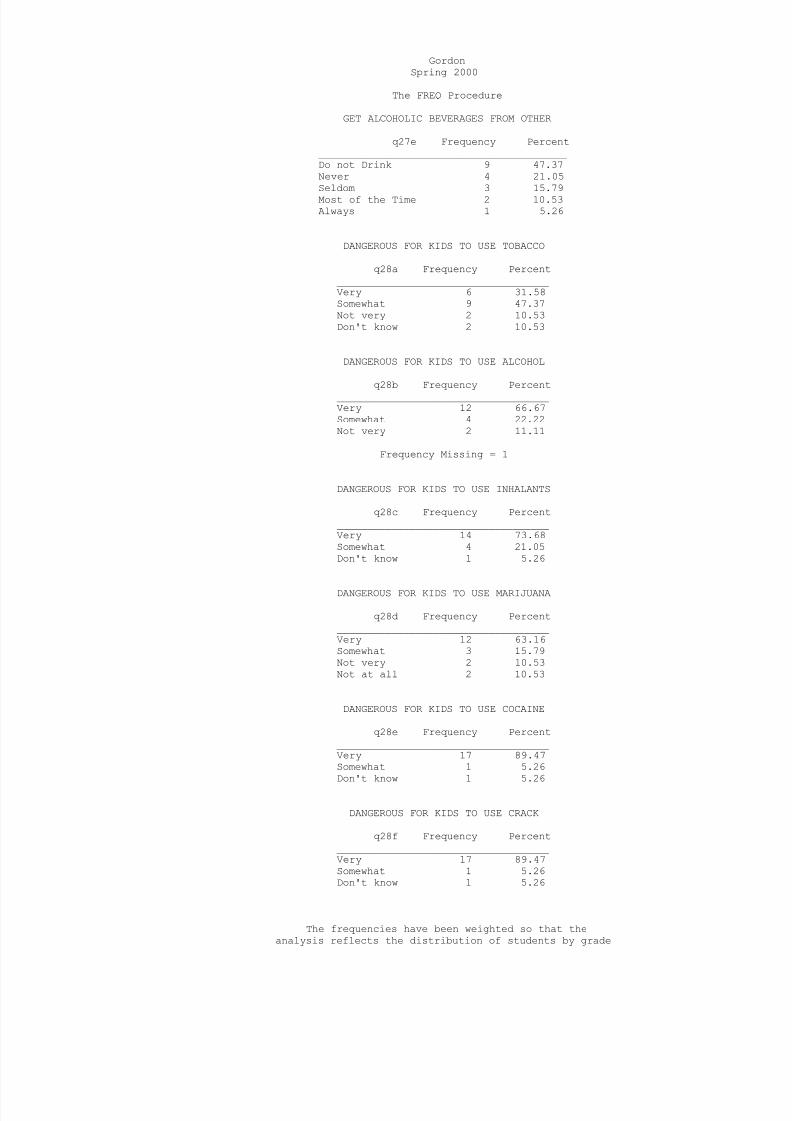
8/14/2019 PALO PINTO COUNTY - Gordon ISD - 2000 Texas School Survey of Drug and Alcohol Use
http://slidepdf.com/reader/full/palo-pinto-county-gordon-isd-2000-texas-school-survey-of-drug-and-alcohol 78/95
GordonSpring 2000
The FREQ Procedure
GET ALCOHOLIC BEVERAGES FROM OTHER
q27e Frequency Percent_________________________________________Do not Drink 9 47.37Never 4 21.05Seldom 3 15.79Most of the Time 2 10.53Always 1 5.26
DANGEROUS FOR KIDS TO USE TOBACCO
q28a Frequency Percent___________________________________Very 6 31.58Somewhat 9 47.37Not very 2 10.53Don't know 2 10.53
DANGEROUS FOR KIDS TO USE ALCOHOL
q28b Frequency Percent___________________________________Very 12 66.67Somewhat 4 22.22Not very 2 11.11
Frequency Missing = 1
DANGEROUS FOR KIDS TO USE INHALANTS
q28c Frequency Percent___________________________________Very 14 73.68Somewhat 4 21.05Don't know 1 5.26
DANGEROUS FOR KIDS TO USE MARIJUANA
q28d Frequency Percent___________________________________Very 12 63.16Somewhat 3 15.79Not very 2 10.53Not at all 2 10.53
DANGEROUS FOR KIDS TO USE COCAINE
q28e Frequency Percent___________________________________Very 17 89.47Somewhat 1 5.26
Don't know 1 5.26
DANGEROUS FOR KIDS TO USE CRACK
q28f Frequency Percent___________________________________Very 17 89.47Somewhat 1 5.26Don't know 1 5.26
The frequencies have been weighted so that theanalysis reflects the distribution of students by grade

8/14/2019 PALO PINTO COUNTY - Gordon ISD - 2000 Texas School Survey of Drug and Alcohol Use
http://slidepdf.com/reader/full/palo-pinto-county-gordon-isd-2000-texas-school-survey-of-drug-and-alcohol 79/95
level in the district
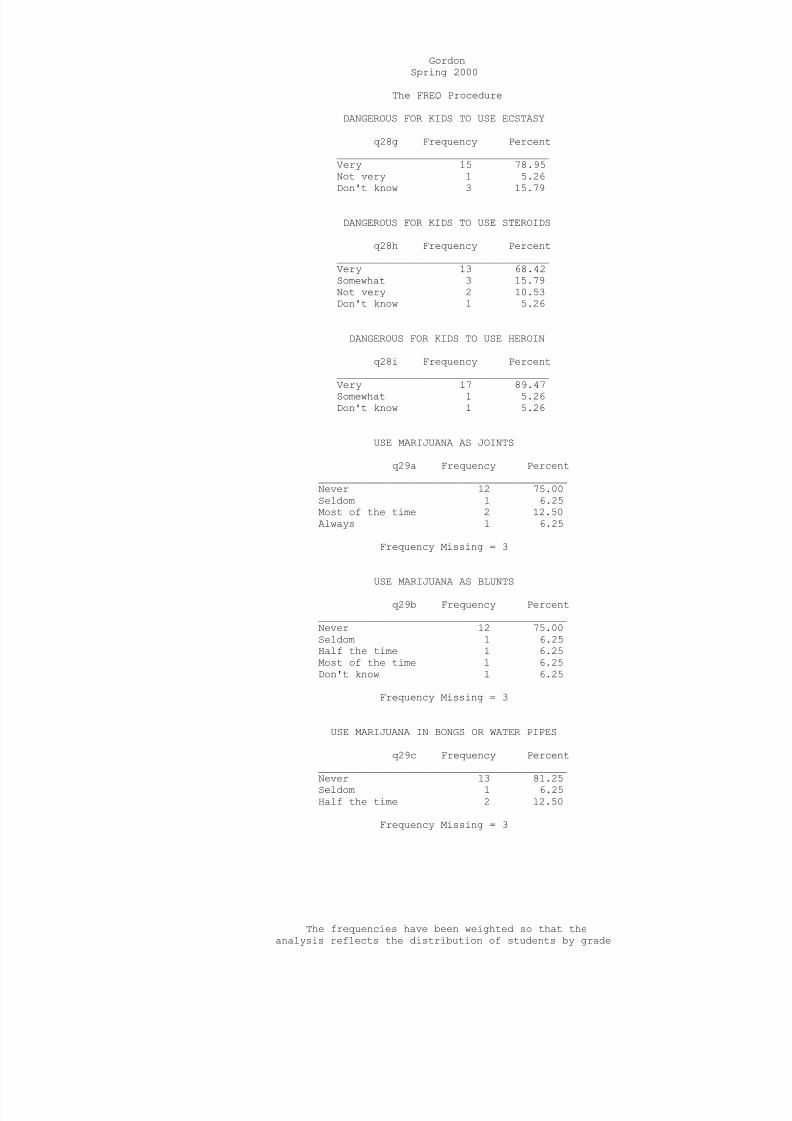
8/14/2019 PALO PINTO COUNTY - Gordon ISD - 2000 Texas School Survey of Drug and Alcohol Use
http://slidepdf.com/reader/full/palo-pinto-county-gordon-isd-2000-texas-school-survey-of-drug-and-alcohol 80/95
GordonSpring 2000
The FREQ Procedure
DANGEROUS FOR KIDS TO USE ECSTASY
q28g Frequency Percent___________________________________Very 15 78.95Not very 1 5.26Don't know 3 15.79
DANGEROUS FOR KIDS TO USE STEROIDS
q28h Frequency Percent___________________________________Very 13 68.42Somewhat 3 15.79Not very 2 10.53Don't know 1 5.26
DANGEROUS FOR KIDS TO USE HEROIN
q28i Frequency Percent___________________________________Very 17 89.47Somewhat 1 5.26Don't know 1 5.26
USE MARIJUANA AS JOINTS
q29a Frequency Percent_________________________________________Never 12 75.00Seldom 1 6.25Most of the time 2 12.50Always 1 6.25
Frequency Missing = 3
USE MARIJUANA AS BLUNTS q29b Frequency Percent
_________________________________________Never 12 75.00Seldom 1 6.25Half the time 1 6.25Most of the time 1 6.25Don't know 1 6.25
Frequency Missing = 3
USE MARIJUANA IN BONGS OR WATER PIPES
q29c Frequency Percent_________________________________________
Never 13 81.25Seldom 1 6.25Half the time 2 12.50
Frequency Missing = 3
The frequencies have been weighted so that theanalysis reflects the distribution of students by grade

8/14/2019 PALO PINTO COUNTY - Gordon ISD - 2000 Texas School Survey of Drug and Alcohol Use
http://slidepdf.com/reader/full/palo-pinto-county-gordon-isd-2000-texas-school-survey-of-drug-and-alcohol 81/95
level in the district
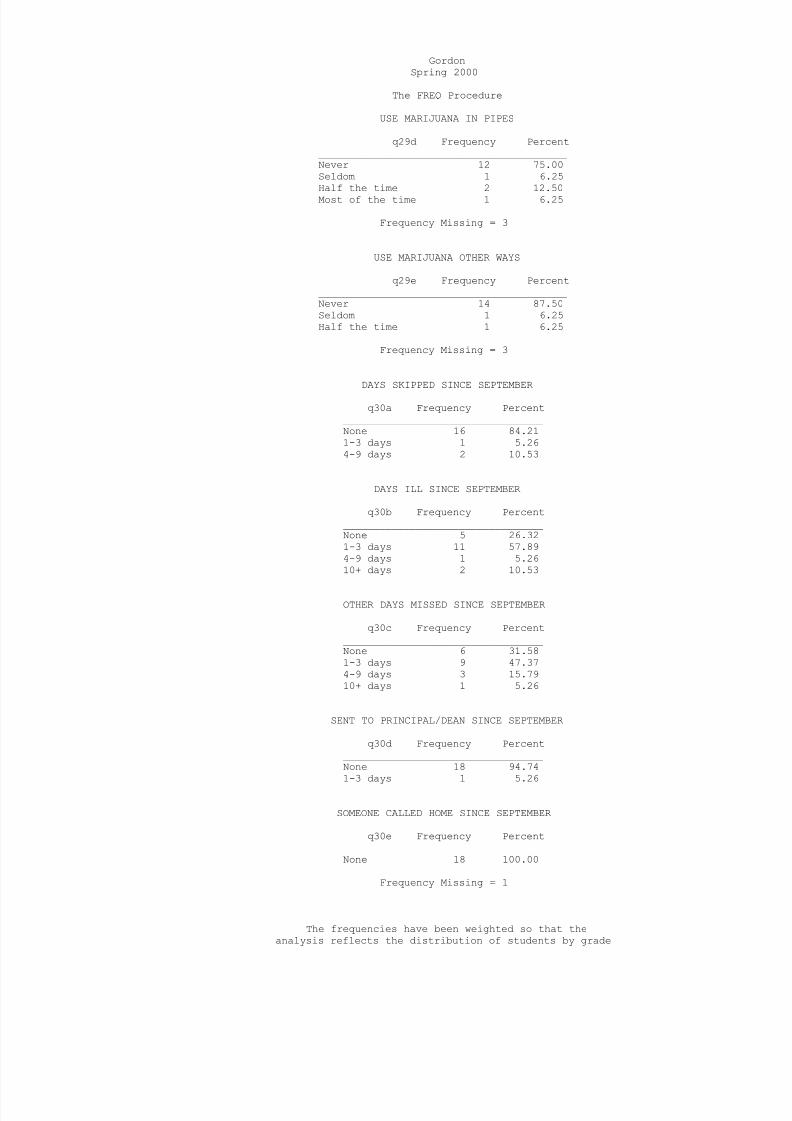
8/14/2019 PALO PINTO COUNTY - Gordon ISD - 2000 Texas School Survey of Drug and Alcohol Use
http://slidepdf.com/reader/full/palo-pinto-county-gordon-isd-2000-texas-school-survey-of-drug-and-alcohol 82/95
GordonSpring 2000
The FREQ Procedure
USE MARIJUANA IN PIPES
q29d Frequency Percent_________________________________________Never 12 75.00Seldom 1 6.25Half the time 2 12.50Most of the time 1 6.25
Frequency Missing = 3
USE MARIJUANA OTHER WAYS
q29e Frequency Percent_________________________________________Never 14 87.50Seldom 1 6.25Half the time 1 6.25
Frequency Missing = 3
DAYS SKIPPED SINCE SEPTEMBER
q30a Frequency Percent_________________________________None 16 84.211-3 days 1 5.264-9 days 2 10.53
DAYS ILL SINCE SEPTEMBER
q30b Frequency Percent_________________________________None 5 26.321-3 days 11 57.894-9 days 1 5.2610+ days 2 10.53
OTHER DAYS MISSED SINCE SEPTEMBER
q30c Frequency Percent_________________________________None 6 31.581-3 days 9 47.374-9 days 3 15.7910+ days 1 5.26
SENT TO PRINCIPAL/DEAN SINCE SEPTEMBER
q30d Frequency Percent_________________________________None 18 94.74
1-3 days 1 5.26
SOMEONE CALLED HOME SINCE SEPTEMBER
q30e Frequency Percent_________________________________None 18 100.00
Frequency Missing = 1
The frequencies have been weighted so that theanalysis reflects the distribution of students by grade

8/14/2019 PALO PINTO COUNTY - Gordon ISD - 2000 Texas School Survey of Drug and Alcohol Use
http://slidepdf.com/reader/full/palo-pinto-county-gordon-isd-2000-texas-school-survey-of-drug-and-alcohol 83/95
level in the district
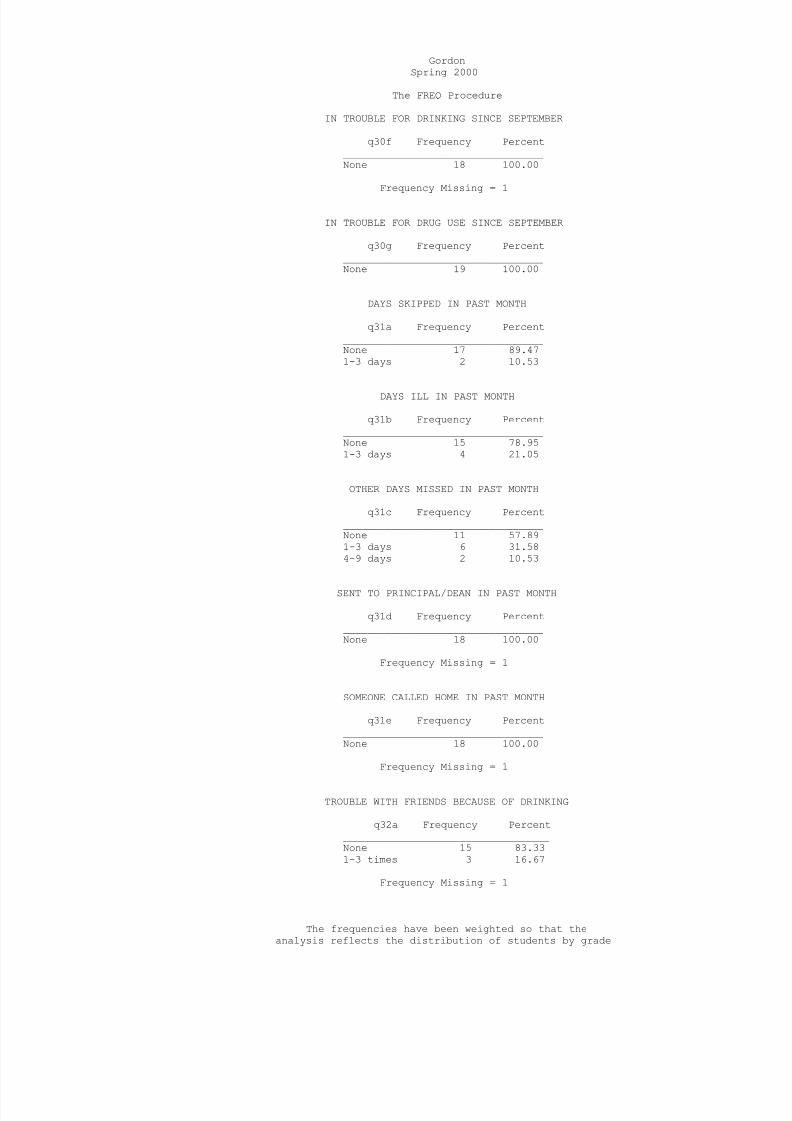
8/14/2019 PALO PINTO COUNTY - Gordon ISD - 2000 Texas School Survey of Drug and Alcohol Use
http://slidepdf.com/reader/full/palo-pinto-county-gordon-isd-2000-texas-school-survey-of-drug-and-alcohol 84/95

8/14/2019 PALO PINTO COUNTY - Gordon ISD - 2000 Texas School Survey of Drug and Alcohol Use
http://slidepdf.com/reader/full/palo-pinto-county-gordon-isd-2000-texas-school-survey-of-drug-and-alcohol 85/95
level in the district
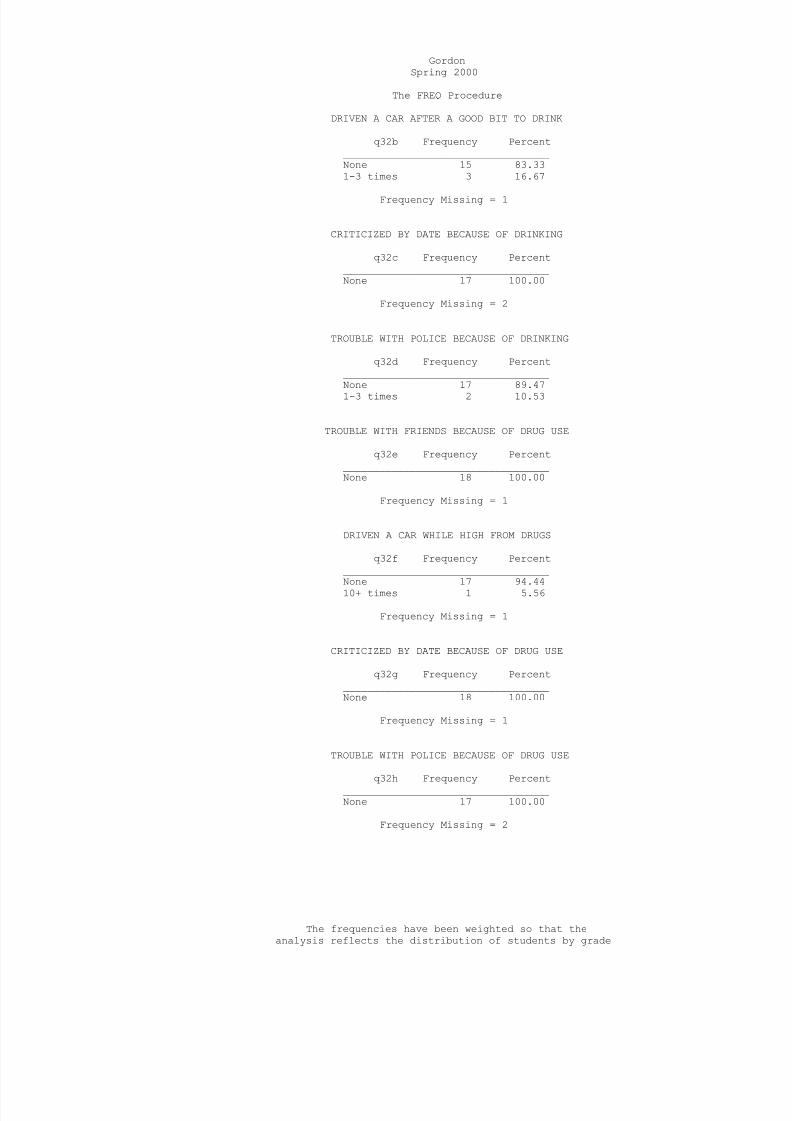
8/14/2019 PALO PINTO COUNTY - Gordon ISD - 2000 Texas School Survey of Drug and Alcohol Use
http://slidepdf.com/reader/full/palo-pinto-county-gordon-isd-2000-texas-school-survey-of-drug-and-alcohol 86/95
GordonSpring 2000
The FREQ Procedure
DRIVEN A CAR AFTER A GOOD BIT TO DRINK
q32b Frequency Percent__________________________________None 15 83.331-3 times 3 16.67
Frequency Missing = 1
CRITICIZED BY DATE BECAUSE OF DRINKING
q32c Frequency Percent__________________________________None 17 100.00
Frequency Missing = 2
TROUBLE WITH POLICE BECAUSE OF DRINKING
q32d Frequency Percent__________________________________None 17 89.471-3 times 2 10.53
TROUBLE WITH FRIENDS BECAUSE OF DRUG USE
q32e Frequency Percent__________________________________None 18 100.00
Frequency Missing = 1
DRIVEN A CAR WHILE HIGH FROM DRUGS
q32f Frequency Percent__________________________________
None 17 94.4410+ times 1 5.56
Frequency Missing = 1
CRITICIZED BY DATE BECAUSE OF DRUG USE
q32g Frequency Percent__________________________________None 18 100.00
Frequency Missing = 1
TROUBLE WITH POLICE BECAUSE OF DRUG USE
q32h Frequency Percent__________________________________None 17 100.00
Frequency Missing = 2
The frequencies have been weighted so that theanalysis reflects the distribution of students by grade

8/14/2019 PALO PINTO COUNTY - Gordon ISD - 2000 Texas School Survey of Drug and Alcohol Use
http://slidepdf.com/reader/full/palo-pinto-county-gordon-isd-2000-texas-school-survey-of-drug-and-alcohol 87/95
level in the district
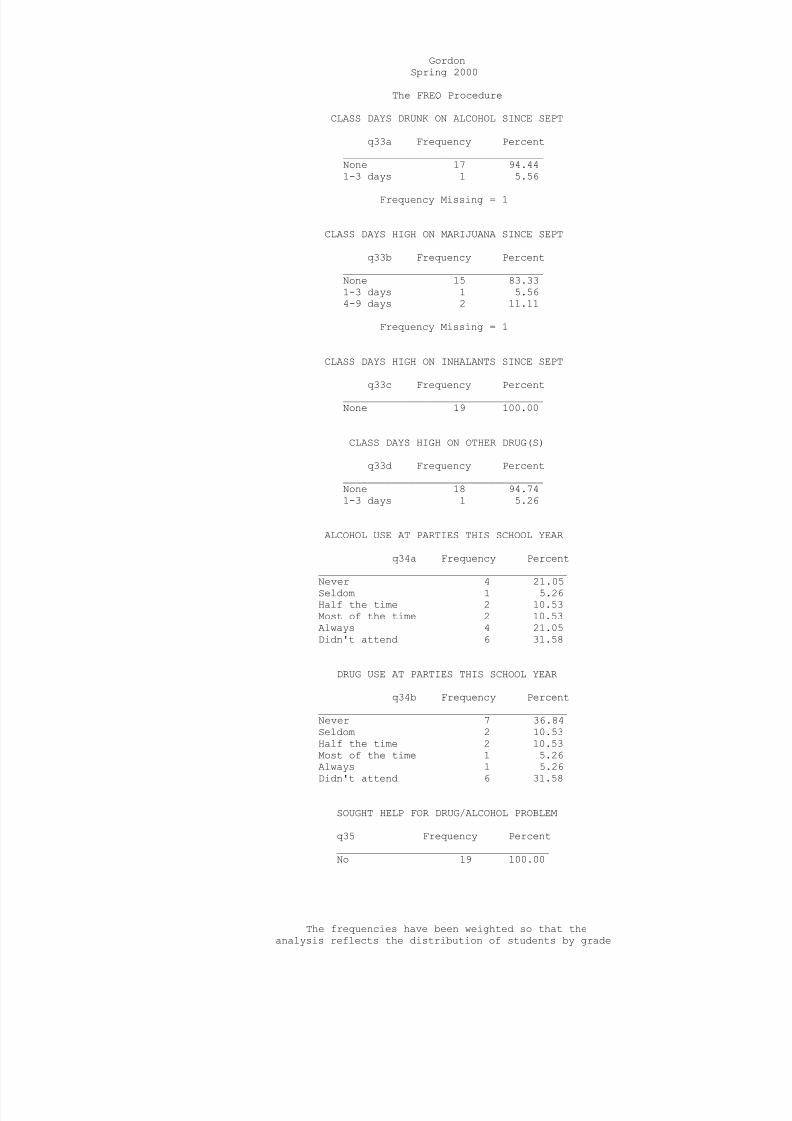
8/14/2019 PALO PINTO COUNTY - Gordon ISD - 2000 Texas School Survey of Drug and Alcohol Use
http://slidepdf.com/reader/full/palo-pinto-county-gordon-isd-2000-texas-school-survey-of-drug-and-alcohol 88/95
GordonSpring 2000
The FREQ Procedure
CLASS DAYS DRUNK ON ALCOHOL SINCE SEPT
q33a Frequency Percent_________________________________None 17 94.441-3 days 1 5.56
Frequency Missing = 1
CLASS DAYS HIGH ON MARIJUANA SINCE SEPT
q33b Frequency Percent_________________________________None 15 83.331-3 days 1 5.564-9 days 2 11.11
Frequency Missing = 1
CLASS DAYS HIGH ON INHALANTS SINCE SEPT
q33c Frequency Percent_________________________________None 19 100.00
CLASS DAYS HIGH ON OTHER DRUG(S)
q33d Frequency Percent_________________________________None 18 94.741-3 days 1 5.26
ALCOHOL USE AT PARTIES THIS SCHOOL YEAR
q34a Frequency Percent_________________________________________
Never 4 21.05Seldom 1 5.26Half the time 2 10.53Most of the time 2 10.53Always 4 21.05Didn't attend 6 31.58
DRUG USE AT PARTIES THIS SCHOOL YEAR
q34b Frequency Percent_________________________________________Never 7 36.84Seldom 2 10.53Half the time 2 10.53Most of the time 1 5.26Always 1 5.26
Didn't attend 6 31.58
SOUGHT HELP FOR DRUG/ALCOHOL PROBLEM
q35 Frequency Percent___________________________________No 19 100.00
The frequencies have been weighted so that theanalysis reflects the distribution of students by grade

8/14/2019 PALO PINTO COUNTY - Gordon ISD - 2000 Texas School Survey of Drug and Alcohol Use
http://slidepdf.com/reader/full/palo-pinto-county-gordon-isd-2000-texas-school-survey-of-drug-and-alcohol 89/95
level in the district
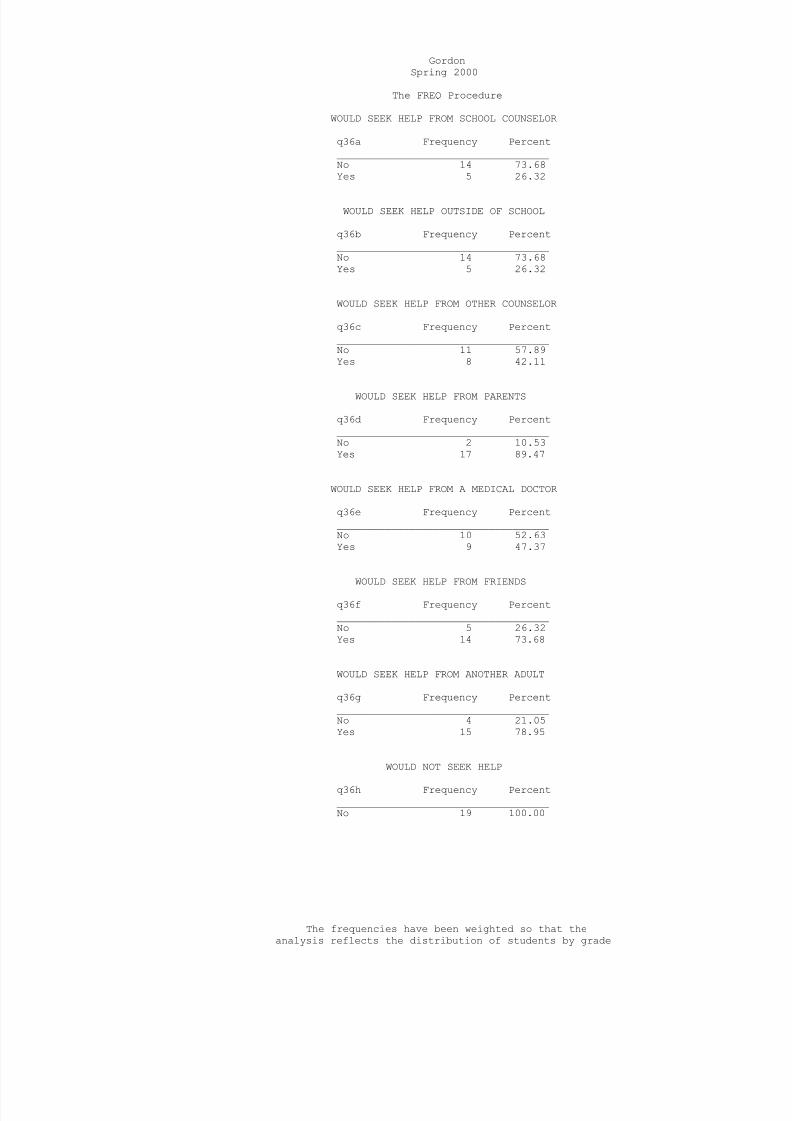
8/14/2019 PALO PINTO COUNTY - Gordon ISD - 2000 Texas School Survey of Drug and Alcohol Use
http://slidepdf.com/reader/full/palo-pinto-county-gordon-isd-2000-texas-school-survey-of-drug-and-alcohol 90/95
GordonSpring 2000
The FREQ Procedure
WOULD SEEK HELP FROM SCHOOL COUNSELOR
q36a Frequency Percent___________________________________No 14 73.68Yes 5 26.32
WOULD SEEK HELP OUTSIDE OF SCHOOL
q36b Frequency Percent___________________________________No 14 73.68Yes 5 26.32
WOULD SEEK HELP FROM OTHER COUNSELOR
q36c Frequency Percent___________________________________No 11 57.89Yes 8 42.11
WOULD SEEK HELP FROM PARENTS
q36d Frequency Percent___________________________________No 2 10.53Yes 17 89.47
WOULD SEEK HELP FROM A MEDICAL DOCTOR
q36e Frequency Percent___________________________________No 10 52.63Yes 9 47.37
WOULD SEEK HELP FROM FRIENDS q36f Frequency Percent___________________________________No 5 26.32Yes 14 73.68
WOULD SEEK HELP FROM ANOTHER ADULT
q36g Frequency Percent___________________________________No 4 21.05Yes 15 78.95
WOULD NOT SEEK HELP
q36h Frequency Percent___________________________________No 19 100.00
The frequencies have been weighted so that theanalysis reflects the distribution of students by grade

8/14/2019 PALO PINTO COUNTY - Gordon ISD - 2000 Texas School Survey of Drug and Alcohol Use
http://slidepdf.com/reader/full/palo-pinto-county-gordon-isd-2000-texas-school-survey-of-drug-and-alcohol 91/95
level in the district
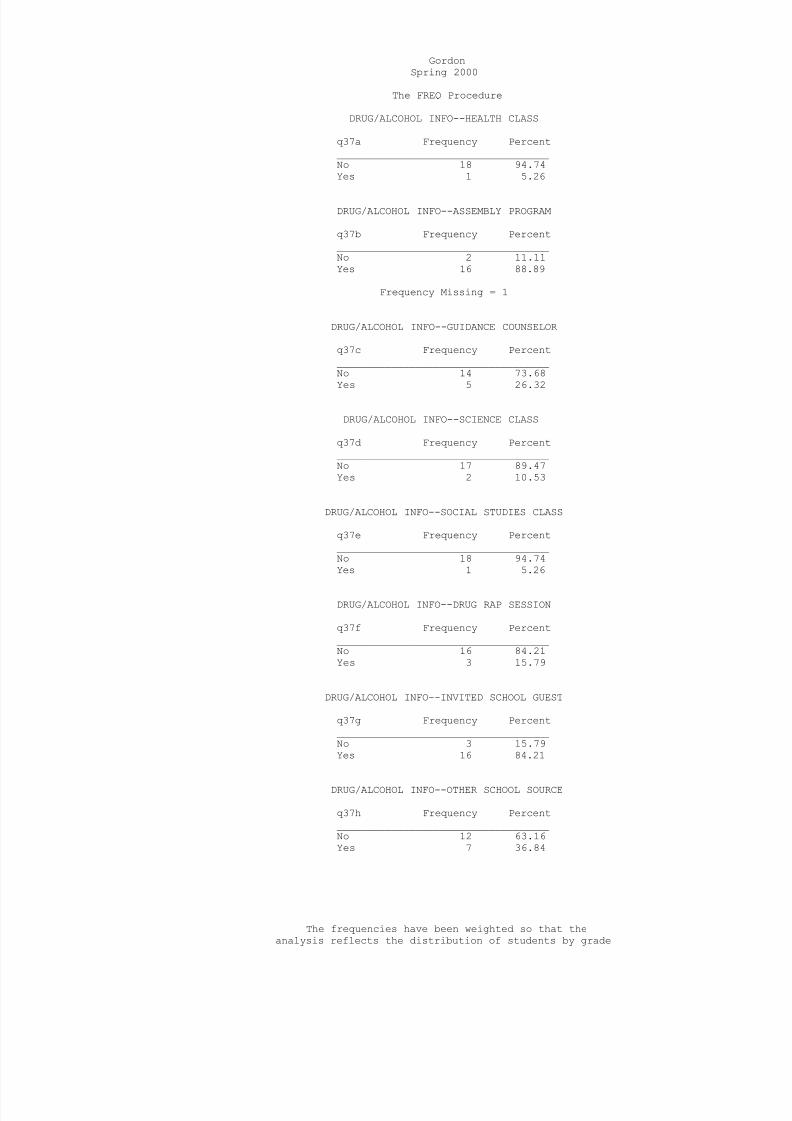
8/14/2019 PALO PINTO COUNTY - Gordon ISD - 2000 Texas School Survey of Drug and Alcohol Use
http://slidepdf.com/reader/full/palo-pinto-county-gordon-isd-2000-texas-school-survey-of-drug-and-alcohol 92/95

8/14/2019 PALO PINTO COUNTY - Gordon ISD - 2000 Texas School Survey of Drug and Alcohol Use
http://slidepdf.com/reader/full/palo-pinto-county-gordon-isd-2000-texas-school-survey-of-drug-and-alcohol 93/95
level in the district
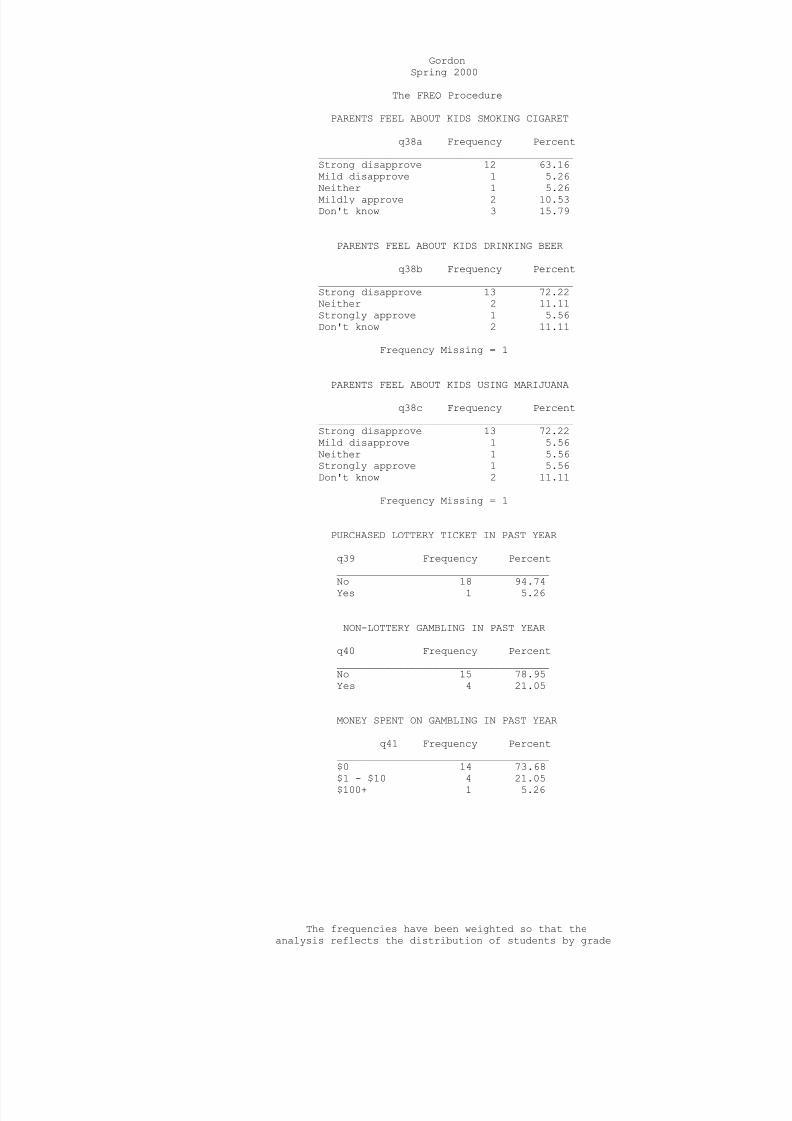
8/14/2019 PALO PINTO COUNTY - Gordon ISD - 2000 Texas School Survey of Drug and Alcohol Use
http://slidepdf.com/reader/full/palo-pinto-county-gordon-isd-2000-texas-school-survey-of-drug-and-alcohol 94/95
GordonSpring 2000
The FREQ Procedure
PARENTS FEEL ABOUT KIDS SMOKING CIGARET
q38a Frequency Percent__________________________________________Strong disapprove 12 63.16Mild disapprove 1 5.26Neither 1 5.26Mildly approve 2 10.53Don't know 3 15.79
PARENTS FEEL ABOUT KIDS DRINKING BEER
q38b Frequency Percent__________________________________________Strong disapprove 13 72.22Neither 2 11.11Strongly approve 1 5.56Don't know 2 11.11
Frequency Missing = 1
PARENTS FEEL ABOUT KIDS USING MARIJUANA
q38c Frequency Percent__________________________________________Strong disapprove 13 72.22Mild disapprove 1 5.56Neither 1 5.56Strongly approve 1 5.56Don't know 2 11.11
Frequency Missing = 1
PURCHASED LOTTERY TICKET IN PAST YEAR
q39 Frequency Percent___________________________________
No 18 94.74Yes 1 5.26
NON-LOTTERY GAMBLING IN PAST YEAR
q40 Frequency Percent___________________________________No 15 78.95Yes 4 21.05
MONEY SPENT ON GAMBLING IN PAST YEAR
q41 Frequency Percent___________________________________$0 14 73.68
$1 - $10 4 21.05$100+ 1 5.26
The frequencies have been weighted so that theanalysis reflects the distribution of students by grade

8/14/2019 PALO PINTO COUNTY - Gordon ISD - 2000 Texas School Survey of Drug and Alcohol Use
http://slidepdf.com/reader/full/palo-pinto-county-gordon-isd-2000-texas-school-survey-of-drug-and-alcohol 95/95
level in the district


