1 Paper Micro Hydro Power: A source of Sustainable Energy in Rural Communities: Economic and Environmental Perspectives. By MUHAMMAD UMAR And ANWAR HUSSAIN Submitted to 30 th , AGM and Conference, PSDE PAKISTAN INSTITUTE OF DEVELOPMENT ECONOMICS, ISLAMABAD, PAKISTAN
Transcript
1
Paper
Micro Hydro Power: A source of Sustainable Energy in Rural
Communities: Economic and Environmental Perspectives.
By
MUHAMMAD UMAR
And
ANWAR HUSSAIN
Submitted to
30th
, AGM and Conference, PSDE
PAKISTAN INSTITUTE OF DEVELOPMENT ECONOMICS,
ISLAMABAD, PAKISTAN
2
Abstract
Provision of energy is an important need of the human life. The environmental degradation
caused by fossil- fuel based energy generation has led the governments and policy makers to
switch to renewable and clean energy technologies. The present study aims to estimate the
cost and benefit of Micro hydro power (MHP) projects in rural areas and also to show that
Micro hydro power is environmentally sustainable and cost effective technology for energy
generation. Primary data as well as secondary data is used. Two sets of data are used, one
taken from WAPDA connected households and the other from MHP connected households in
District Dir (upper) Khyber Pakhtunkhwa. The methodology used in the study is Descriptive
Statistics, Financial and Economic analysis to estimate the results. Environmental analysis is
used to estimate the emission reductions caused by Micro hydro power technology. Informal
survey techniques are also used to highlight the main issues associated with community
based MHP technology. The result of the study shows that the expenditure made by MHP
connected households on alternative energy sources is less as compared to the expenditure
made by WAPDA connected households. Financial and Economic analysis show that MHP
is a feasible and viable technology that gives higher rate of return to the investors. As an
environmental contribution, the available MHP units in the area can reduce the Green House
Gas (GHG) emissions by 6970.104 tons of CO2eq per annum by replacing the use of fossil
fuels. By registering the project with CDM, it can earn $1, 60312 per annum. Base on these
results, the policy makers should devise a clear cut policy for rural areas based on the
indigenous technology to initiate such projects. This will not only end the energy crisis but
3 Emission factor of 1.83 kgCO2 eq /kWh is based on a survey conducted in Gilgit, Chitral, and Baltistan. This is
taken from the diesel generators sets that are being used in the area. For further detail see CDM, Project Design Document (PDD) Form Version 03, Community based Renewable Energy Development in Northern Areas and Chitral, Pakistan (Pandey, nd).
10
4. Results and Discussion
4.1 Descriptive Analysis
This part of the analysis shows the results and empirical findings that were obtained through
SPSS. First we give the socio-economic information of the sample and then goes to further
analysis.
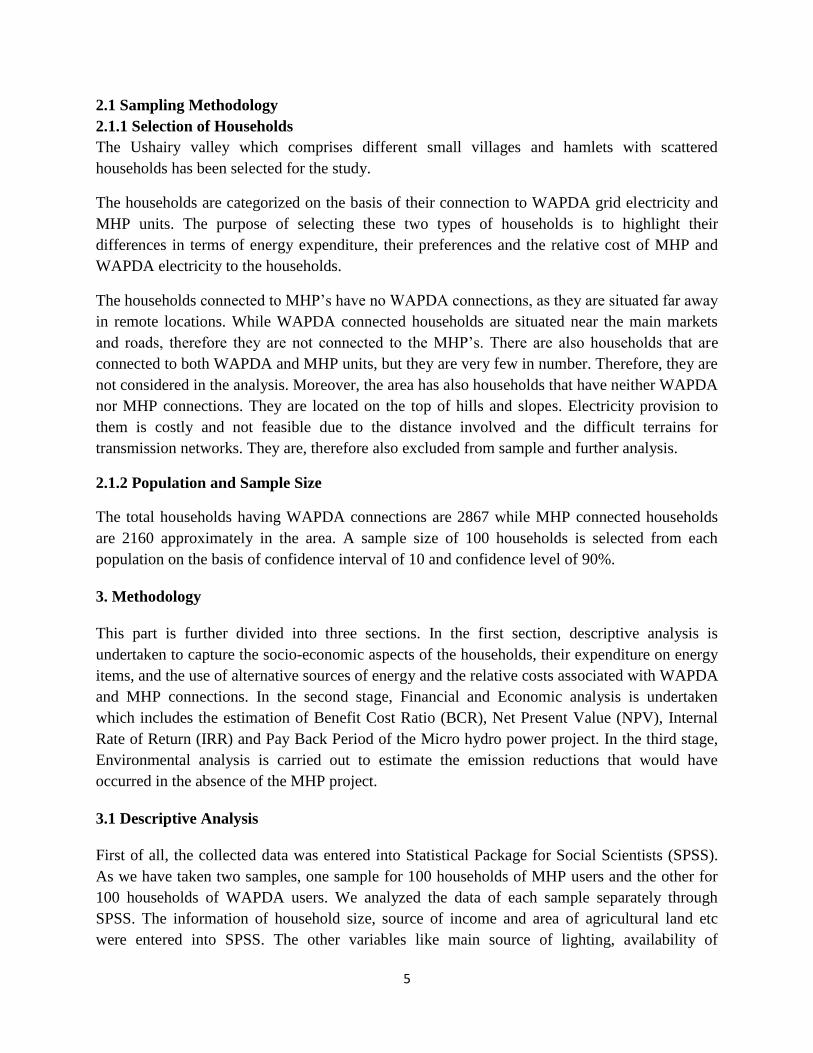
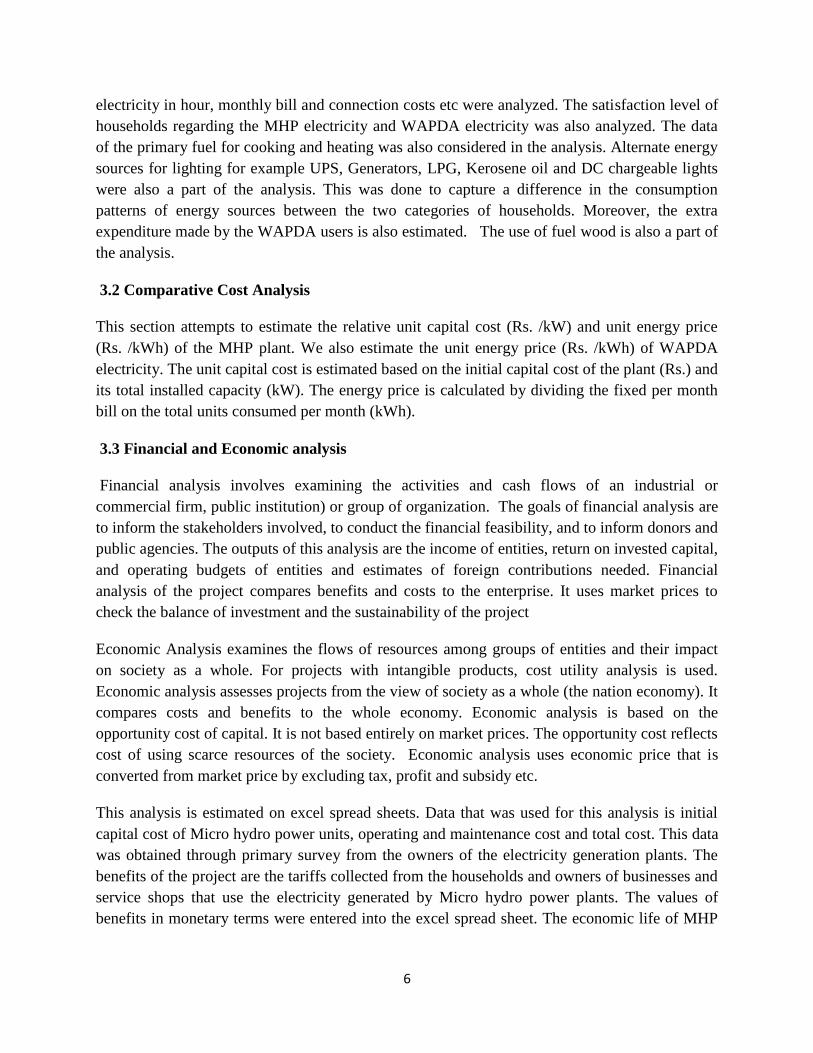
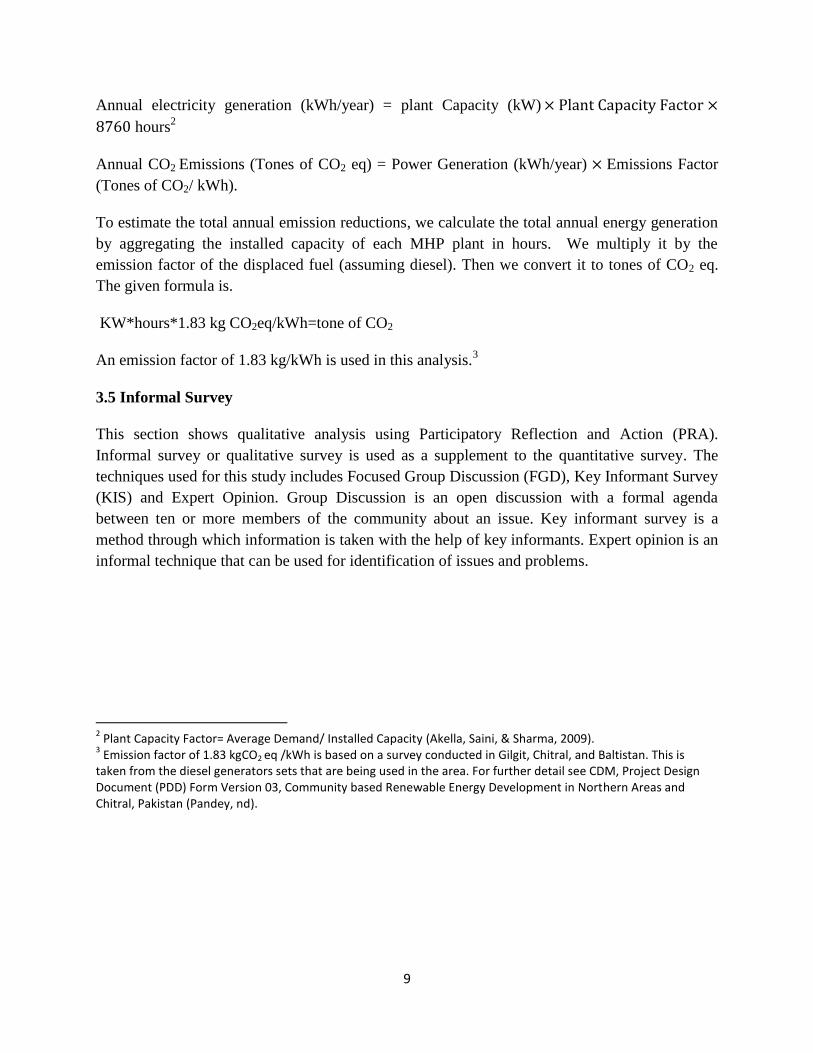
Table 4.1 Main source of income
Labor agriculture Govt service Business Remittances
MHP(household) In % 39 31 17 10 3
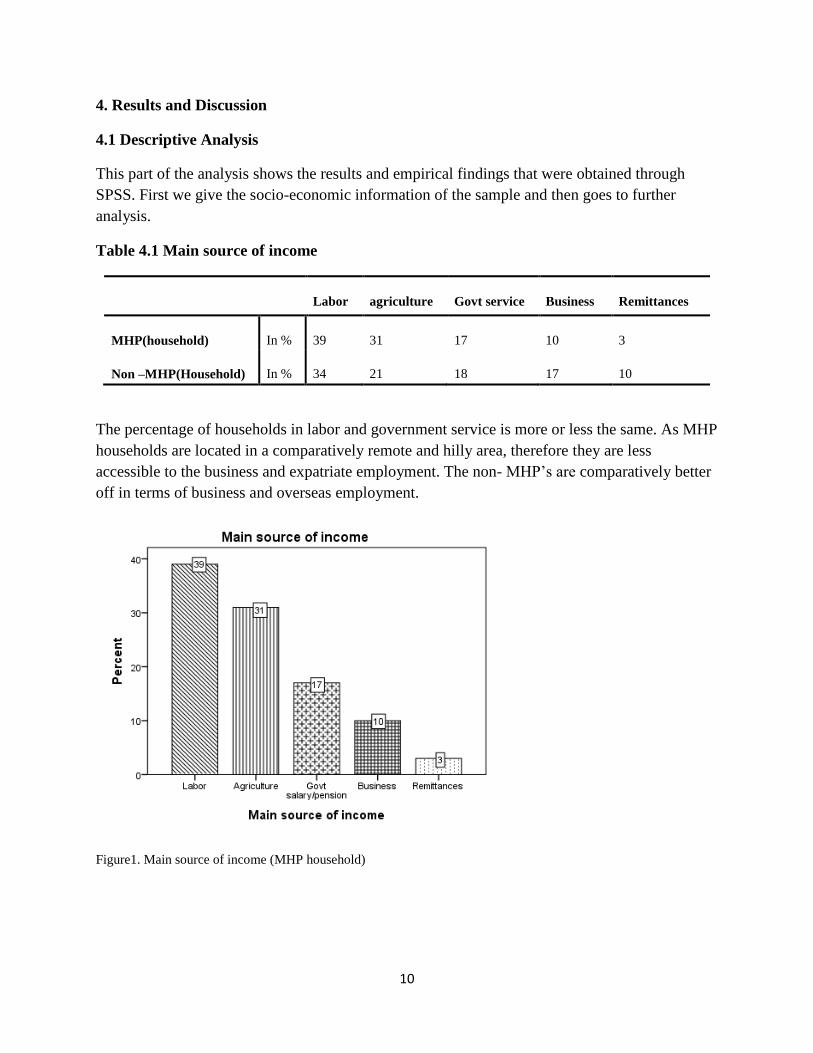
Non –MHP(Household) In % 34 21 18 17 10
The percentage of households in labor and government service is more or less the same. As MHP
households are located in a comparatively remote and hilly area, therefore they are less
accessible to the business and expatriate employment. The non- MHP’s are comparatively better
off in terms of business and overseas employment.
Figure1. Main source of income (MHP household)
11
Figure2. Main source of income (Non-MHP household)
Table 4.2 Area of Agriculture land (in Acres)
MHP Households Non–MHP Households
Area in acres % Area in acres %
0.1-2 60 Landless 25
2.1-4 21 0.1-1 43
4.1-6 11 1.1-2 21
6.1-12 8 2.1-5 11
Both MHP and non- MHP households are different with respect to ownership of agriculture land.
MHP households have more agriculture land than the non-MHP households. The former rely
more on agriculture than the latter one. This is also supported by the share of income sources.
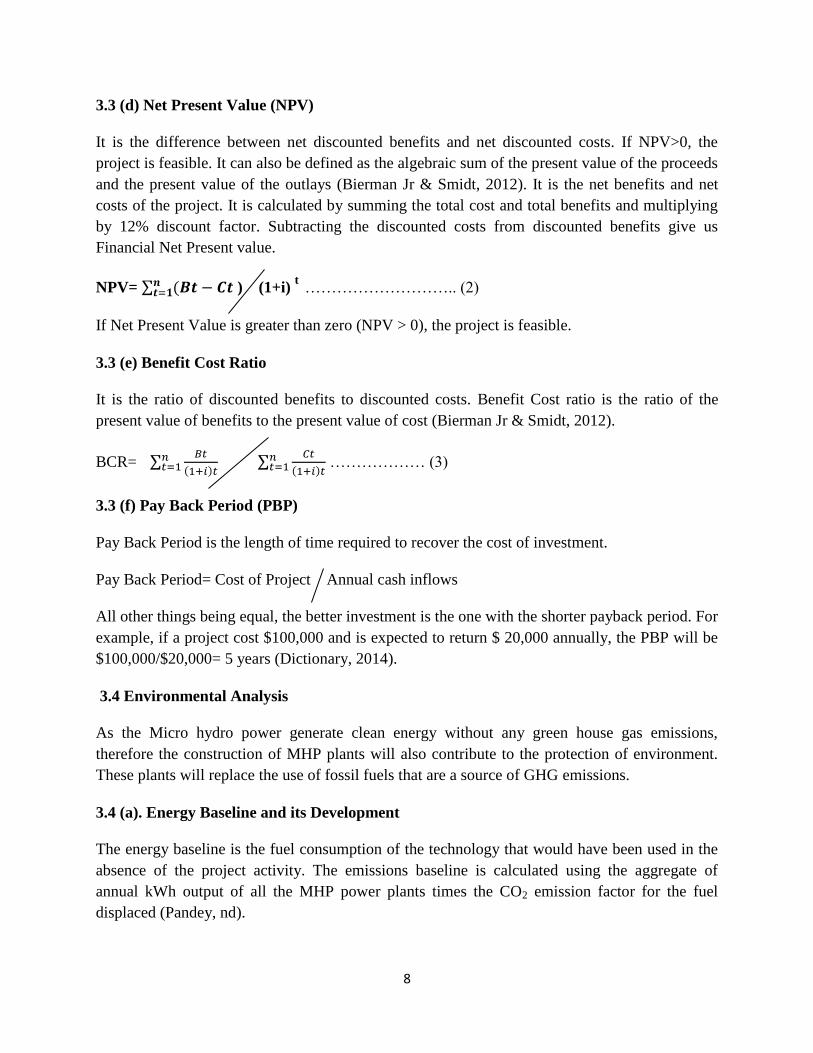
4.1.1 Main source of lighting
Comparison is made between the two categories of households on the basis of energy source
that is used by users and non users of MHP. The result of the study shows that the duration of
light in the households of MHP users is greater than the duration of light in case of WAPDA
electricity. Therefore non users’ uses other alternatives like kerosene oil, LPG and DC
chargeable lamps to meet their needs.
12
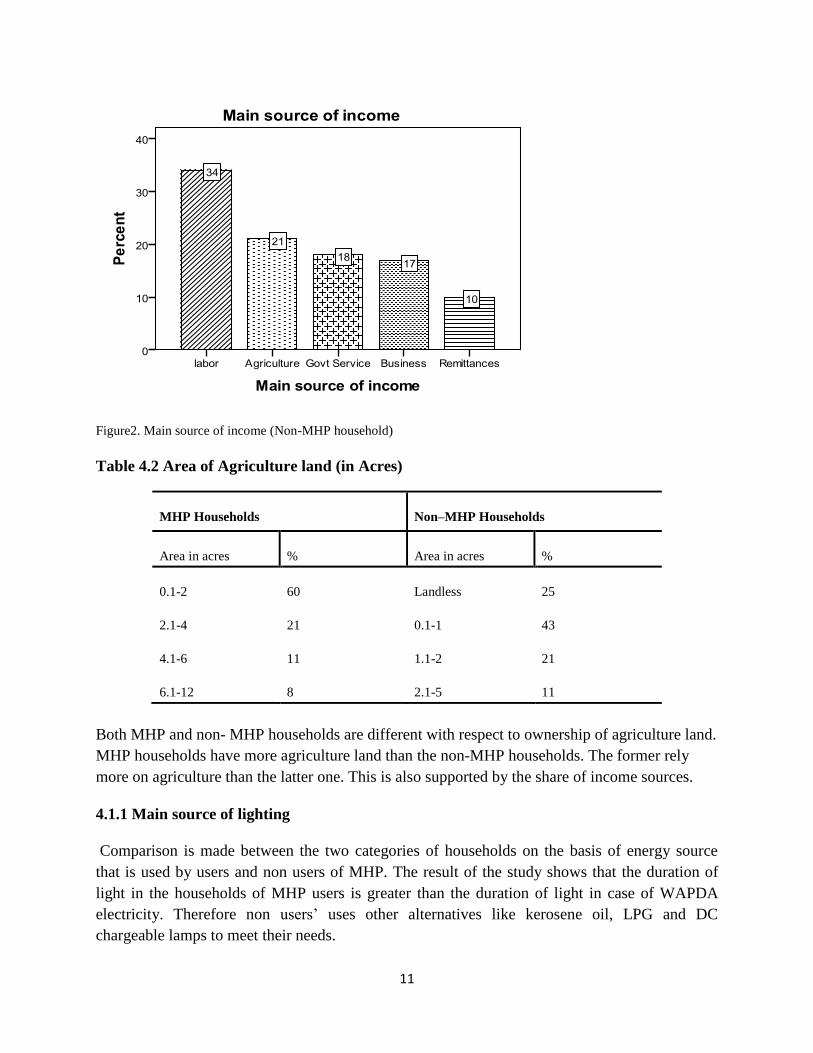
Table 4.3 Main source of lighting
WAPDA Kerosene Oil Solar Cells Generators DC Lamps MHP
Non-MHP (WAPDA) Users
in %
7
19
2
10
62
0
MHP Users in %
4
2
0
0
9
85
Source: Field survey
Table 4.4 Duration of Light
Source: Field Survey
The above table shows the electricity or duration of light available to both categories of
households. The duration of light available to households using WAPDA electricity is 2-3 hours,
while the duration of light available to the households using electricity from MHP is 8-12 hours.
It means that about 20 hours load shedding is carried out in those areas by WAPDA. Results of
the survey show that the households using WAPDA electricity actually pays more than their
available power. However the MHP users pay less in exchange for the available electricity from
the local power plants.
4.1.2 Monthly electricity bill and connection charges.
After analyzing the data, it was found that the households who are connected to WAPDA
electricity pay more monthly bill than the MHP connected households. The average connection
charges are also higher for WAPDA than the MHP households. Even though, the availability of
light is more in case of MHP households. This shows that the consumers of MHP electricity are
better up than the consumers of WAPDA electricity.
Duration of light Household response in %
Non-MHP(WAPDA)
2-3 hours
95
MHP
8-12 hours
90
13-17 hours
10
13
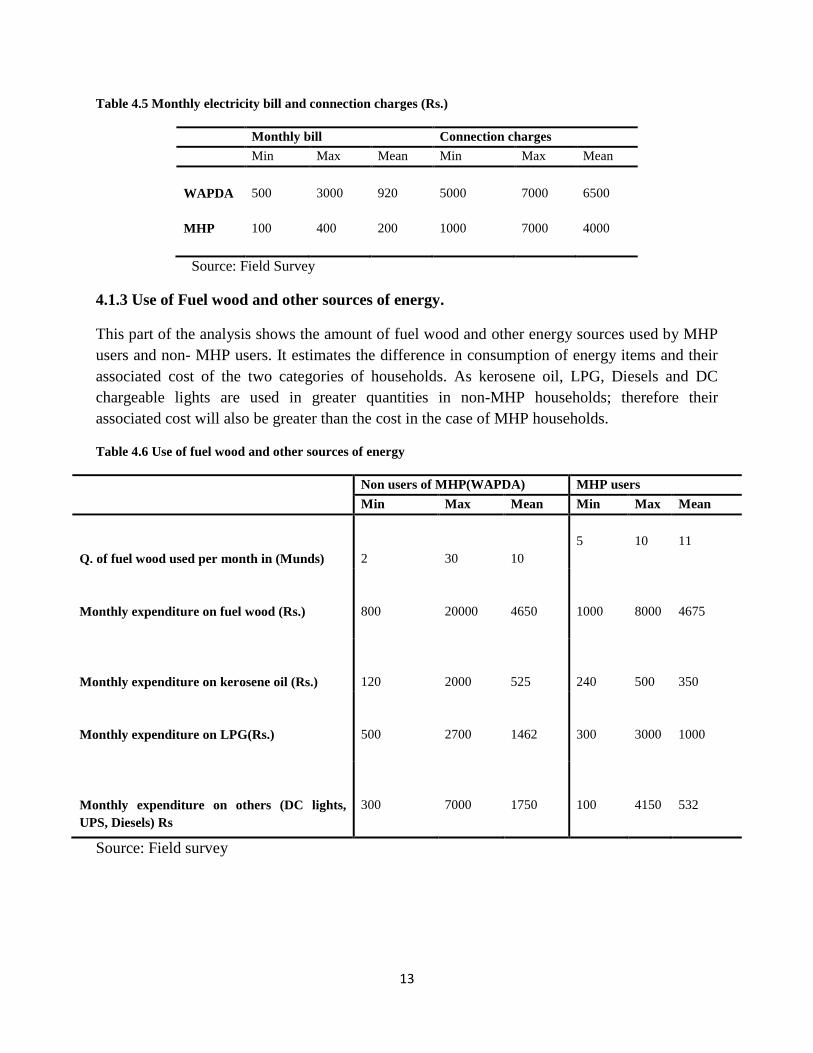
Table 4.5 Monthly electricity bill and connection charges (Rs.)
Monthly bill Connection charges
Min Max Mean Min Max Mean
WAPDA
500
3000
920
5000
7000
6500
MHP
100
400
200
1000
7000
4000
Source: Field Survey
4.1.3 Use of Fuel wood and other sources of energy.
This part of the analysis shows the amount of fuel wood and other energy sources used by MHP
users and non- MHP users. It estimates the difference in consumption of energy items and their
associated cost of the two categories of households. As kerosene oil, LPG, Diesels and DC
chargeable lights are used in greater quantities in non-MHP households; therefore their
associated cost will also be greater than the cost in the case of MHP households.
Table 4.6 Use of fuel wood and other sources of energy
Non users of MHP(WAPDA) MHP users
Min Max Mean Min Max Mean
Q. of fuel wood used per month in (Munds)
2
30
10
5
10
11
Monthly expenditure on fuel wood (Rs.)
800
20000
4650
1000
8000
4675
Monthly expenditure on kerosene oil (Rs.)
120
2000
525
240
500
350
Monthly expenditure on LPG(Rs.)
500
2700
1462
300
3000
1000
Monthly expenditure on others (DC lights,
UPS, Diesels) Rs
300
7000
1750
100
4150
532
Source: Field survey
14
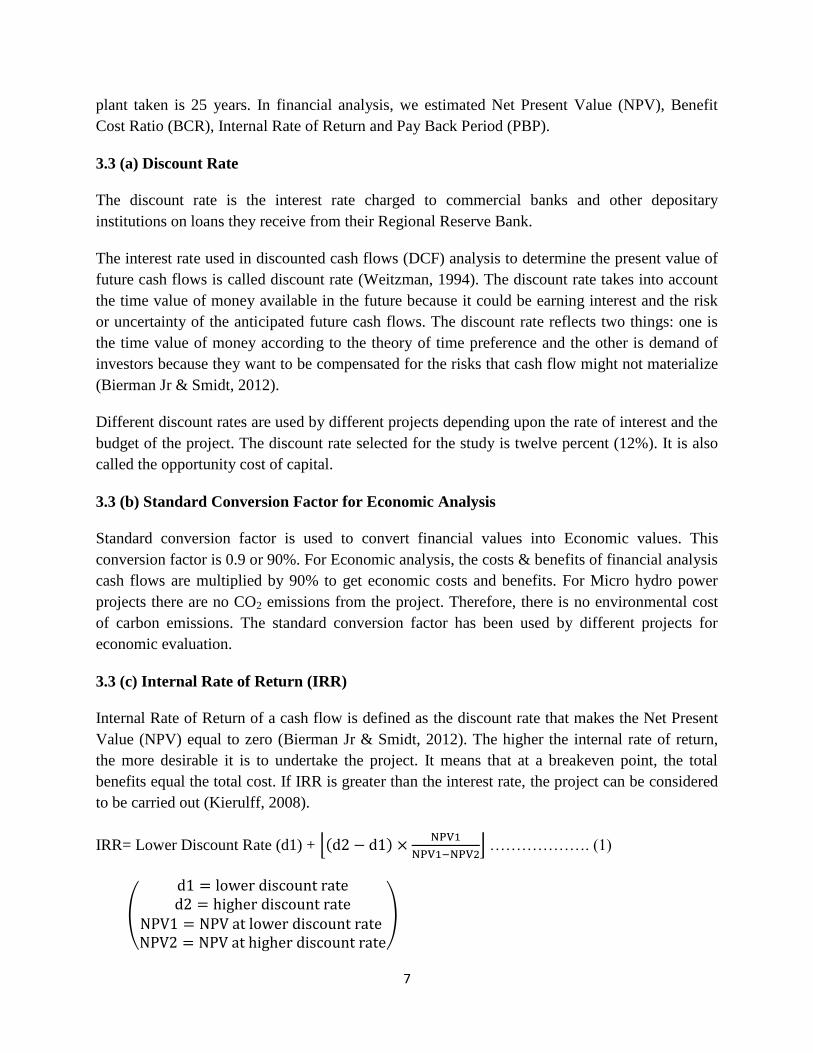
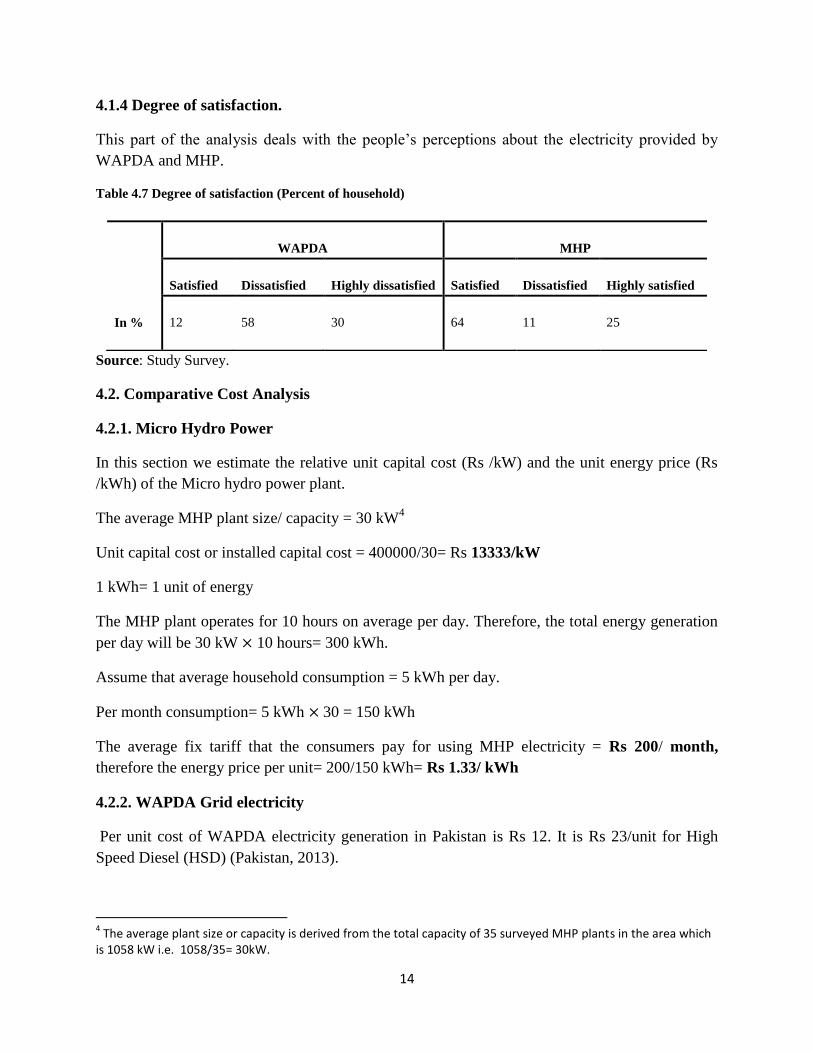
4.1.4 Degree of satisfaction.
This part of the analysis deals with the people’s perceptions about the electricity provided by
WAPDA and MHP.
Table 4.7 Degree of satisfaction (Percent of household)
Source: Study Survey.
4.2. Comparative Cost Analysis
4.2.1. Micro Hydro Power
In this section we estimate the relative unit capital cost (Rs /kW) and the unit energy price (Rs
/kWh) of the Micro hydro power plant.
The average MHP plant size/ capacity = 30 kW4
Unit capital cost or installed capital cost = 400000/30= Rs 13333/kW
1 kWh= 1 unit of energy
The MHP plant operates for 10 hours on average per day. Therefore, the total energy generation
per day will be 30 kW 10 hours= 300 kWh.
Assume that average household consumption = 5 kWh per day.
Per month consumption= 5 kWh 30 = 150 kWh
The average fix tariff that the consumers pay for using MHP electricity = Rs 200/ month,
therefore the energy price per unit= 200/150 kWh= Rs 1.33/ kWh
4.2.2. WAPDA Grid electricity
Per unit cost of WAPDA electricity generation in Pakistan is Rs 12. It is Rs 23/unit for High
Speed Diesel (HSD) (Pakistan, 2013).
4 The average plant size or capacity is derived from the total capacity of 35 surveyed MHP plants in the area which
is 1058 kW i.e. 1058/35= 30kW.
WAPDA
MHP
Satisfied
Dissatisfied
Highly dissatisfied
Satisfied
Dissatisfied
Highly satisfied
In %
12
58
30
64
11
25
15
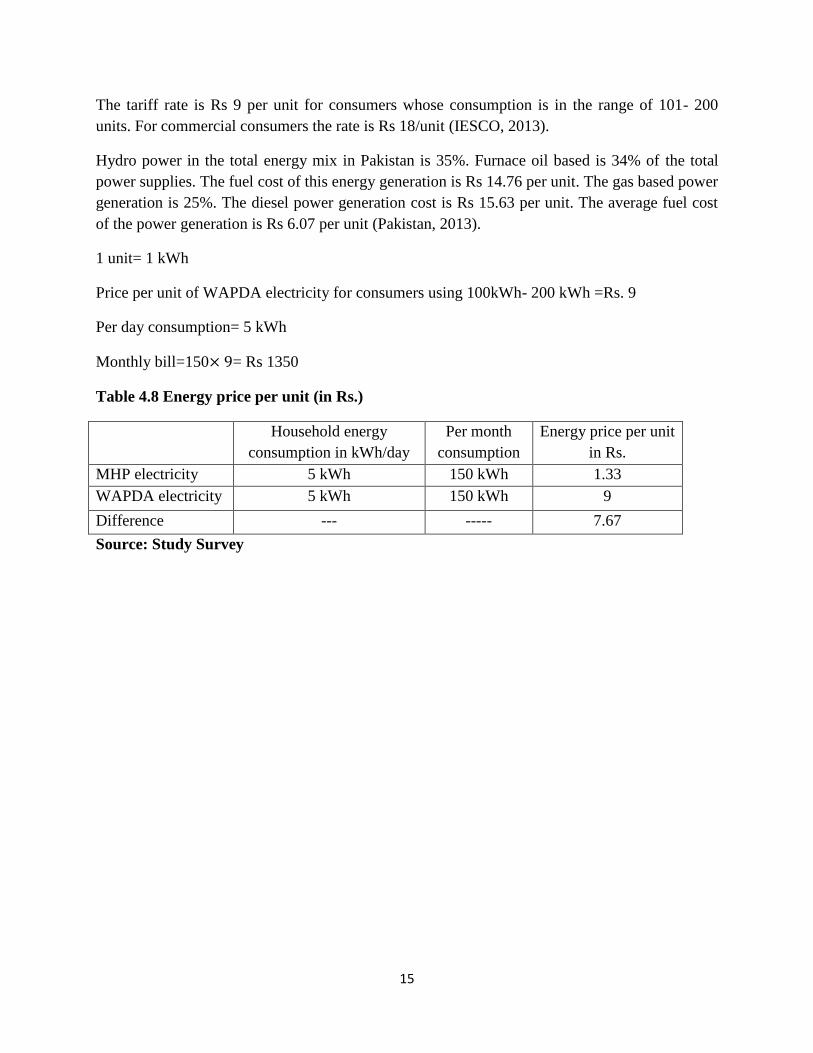
The tariff rate is Rs 9 per unit for consumers whose consumption is in the range of 101- 200
units. For commercial consumers the rate is Rs 18/unit (IESCO, 2013).
Hydro power in the total energy mix in Pakistan is 35%. Furnace oil based is 34% of the total
power supplies. The fuel cost of this energy generation is Rs 14.76 per unit. The gas based power
generation is 25%. The diesel power generation cost is Rs 15.63 per unit. The average fuel cost
of the power generation is Rs 6.07 per unit (Pakistan, 2013).
1 unit= 1 kWh
Price per unit of WAPDA electricity for consumers using 100kWh- 200 kWh =Rs. 9
Per day consumption= 5 kWh
Monthly bill=150 = Rs 1350
Table 4.8 Energy price per unit (in Rs.)
Household energy
consumption in kWh/day
Per month
consumption
Energy price per unit
in Rs.
MHP electricity 5 kWh 150 kWh 1.33
WAPDA electricity 5 kWh 150 kWh 9
Difference --- ----- 7.67
Source: Study Survey
16
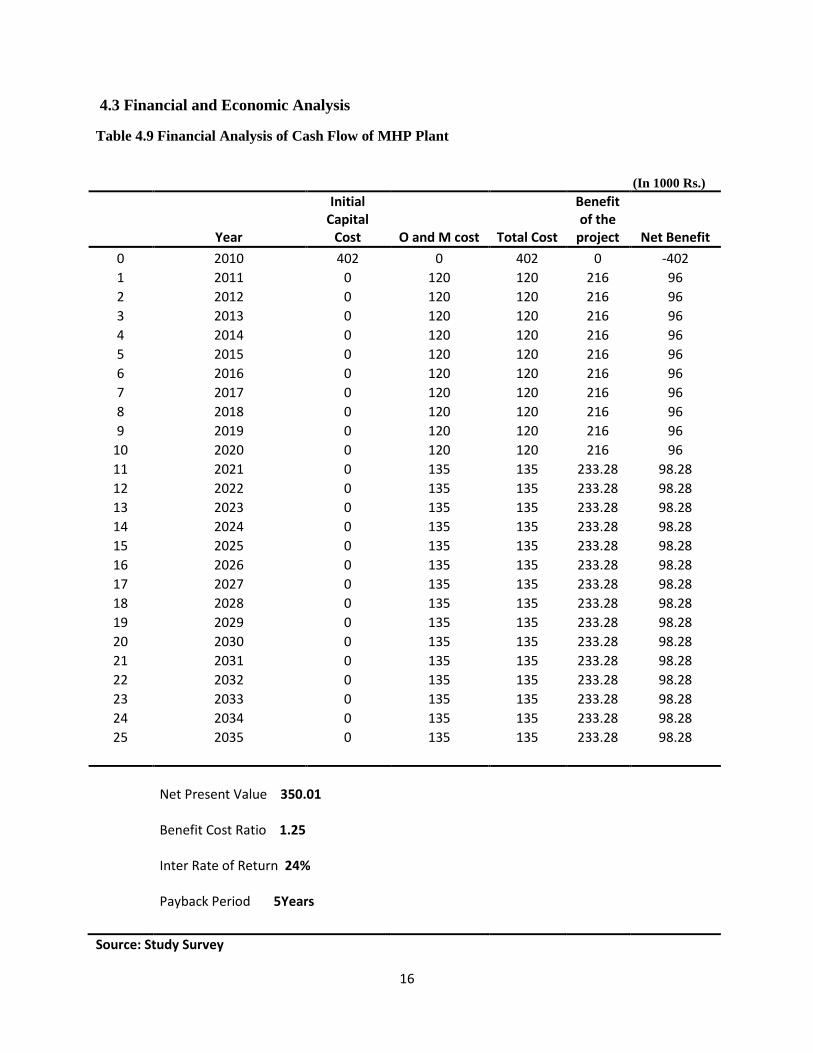
4.3 Financial and Economic Analysis
Table 4.9 Financial Analysis of Cash Flow of MHP Plant
(In 1000 Rs.)
Year
Initial Capital
Cost O and M cost Total Cost
Benefit of the
project Net Benefit
0 2010 402 0 402 0 -402
1 2011 0 120 120 216 96
2 2012 0 120 120 216 96
3 2013 0 120 120 216 96
4 2014 0 120 120 216 96
5 2015 0 120 120 216 96
6 2016 0 120 120 216 96
7 2017 0 120 120 216 96
8 2018 0 120 120 216 96
9 2019 0 120 120 216 96
10 2020 0 120 120 216 96
11 2021 0 135 135 233.28 98.28
12 2022 0 135 135 233.28 98.28
13 2023 0 135 135 233.28 98.28
14 2024 0 135 135 233.28 98.28
15 2025 0 135 135 233.28 98.28
16 2026 0 135 135 233.28 98.28
17 2027 0 135 135 233.28 98.28
18 2028 0 135 135 233.28 98.28
19 2029 0 135 135 233.28 98.28
20 2030 0 135 135 233.28 98.28
21 2031 0 135 135 233.28 98.28
22 2032 0 135 135 233.28 98.28
23 2033 0 135 135 233.28 98.28
24 2034 0 135 135 233.28 98.28
25 2035 0 135 135 233.28 98.28
Net Present Value 350.01
Benefit Cost Ratio 1.25
Inter Rate of Return 24%
Payback Period 5Years
Source: Study Survey
17
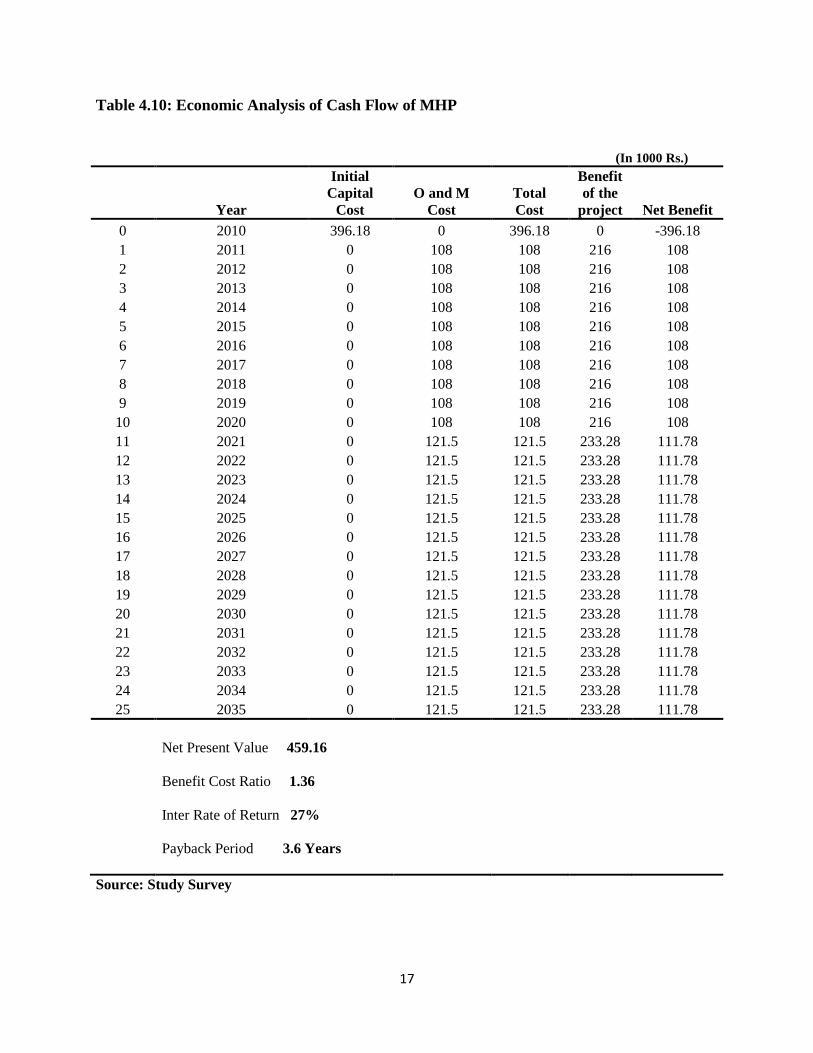
Table 4.10: Economic Analysis of Cash Flow of MHP
(In 1000 Rs.)
Year
Initial
Capital
Cost
O and M
Cost
Total
Cost
Benefit
of the
project Net Benefit
0 2010 396.18 0 396.18 0 -396.18
1 2011 0 108 108 216 108
2 2012 0 108 108 216 108
3 2013 0 108 108 216 108
4 2014 0 108 108 216 108
5 2015 0 108 108 216 108
6 2016 0 108 108 216 108
7 2017 0 108 108 216 108
8 2018 0 108 108 216 108
9 2019 0 108 108 216 108
10 2020 0 108 108 216 108
11 2021 0 121.5 121.5 233.28 111.78
12 2022 0 121.5 121.5 233.28 111.78
13 2023 0 121.5 121.5 233.28 111.78
14 2024 0 121.5 121.5 233.28 111.78
15 2025 0 121.5 121.5 233.28 111.78
16 2026 0 121.5 121.5 233.28 111.78
17 2027 0 121.5 121.5 233.28 111.78
18 2028 0 121.5 121.5 233.28 111.78
19 2029 0 121.5 121.5 233.28 111.78
20 2030 0 121.5 121.5 233.28 111.78
21 2031 0 121.5 121.5 233.28 111.78
22 2032 0 121.5 121.5 233.28 111.78
23 2033 0 121.5 121.5 233.28 111.78
24 2034 0 121.5 121.5 233.28 111.78
25 2035 0 121.5 121.5 233.28 111.78
Net Present Value 459.16
Benefit Cost Ratio 1.36
Inter Rate of Return 27%
Payback Period 3.6 Years
Source: Study Survey
18
The study shows the results of Financial and Economic Analysis in detail in Table 4.9 and 4.10.
Initial capital cost of MHP is Rs 402000. The life of the MHP projects ranges from 20 years to
35 years. But we have taken the life of the project as 25 years on average. Completion time for
the project is one year. Initial costs, operating and maintenance cost, expected benefits and net
benefits are calculated on excel spread sheet. The final results of Financial and Economic
analysis are summarized in Table 4.11.
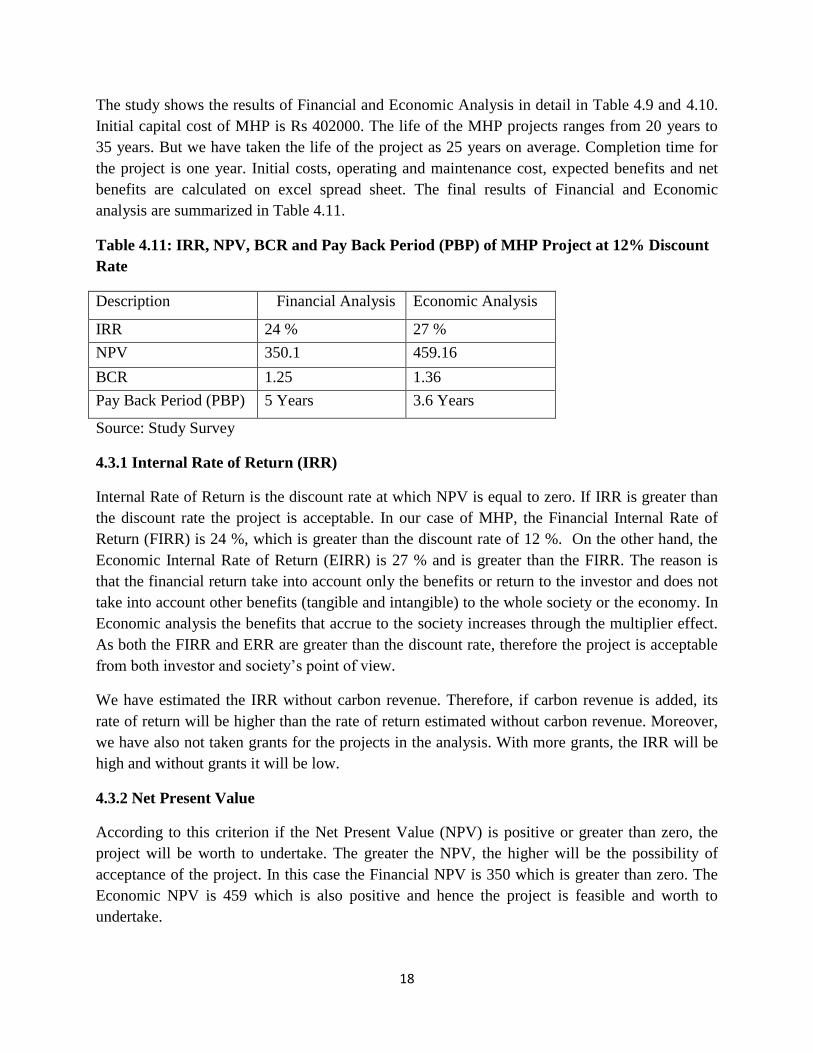
Table 4.11: IRR, NPV, BCR and Pay Back Period (PBP) of MHP Project at 12% Discount
Rate
Description Financial Analysis Economic Analysis
IRR 24 % 27 %
NPV 350.1 459.16
BCR 1.25 1.36
Pay Back Period (PBP) 5 Years 3.6 Years
Source: Study Survey
4.3.1 Internal Rate of Return (IRR)
Internal Rate of Return is the discount rate at which NPV is equal to zero. If IRR is greater than
the discount rate the project is acceptable. In our case of MHP, the Financial Internal Rate of
Return (FIRR) is 24 %, which is greater than the discount rate of 12 %. On the other hand, the
Economic Internal Rate of Return (EIRR) is 27 % and is greater than the FIRR. The reason is
that the financial return take into account only the benefits or return to the investor and does not
take into account other benefits (tangible and intangible) to the whole society or the economy. In
Economic analysis the benefits that accrue to the society increases through the multiplier effect.
As both the FIRR and ERR are greater than the discount rate, therefore the project is acceptable
from both investor and society’s point of view.
We have estimated the IRR without carbon revenue. Therefore, if carbon revenue is added, its
rate of return will be higher than the rate of return estimated without carbon revenue. Moreover,
we have also not taken grants for the projects in the analysis. With more grants, the IRR will be
high and without grants it will be low.
4.3.2 Net Present Value
According to this criterion if the Net Present Value (NPV) is positive or greater than zero, the
project will be worth to undertake. The greater the NPV, the higher will be the possibility of
acceptance of the project. In this case the Financial NPV is 350 which is greater than zero. The
Economic NPV is 459 which is also positive and hence the project is feasible and worth to
undertake.
19
4.3.3 Benefit Cost Ratio (BCR)
If BCR of the project is greater than one, we accept the project. If it is less than one, we reject the
project. In the given table the BCR in financial analysis is 1.25 and in the Economic analysis, it
is 1.26 which are both greater than one. Therefore, we can conclude that according to this
criterion, the Micro hydro power project is viable and worthy to be undertaken.
4.3.4 Pay Back Period
Pay Back Period is the length of time required to recover the cost of an investment. In Financial
Analysis, the Pay Back Period (PBP) is five years. While in Economic Analysis, the Pay Back
Period is 3.6 years. The PBP of Financial analysis is more than the PBP in Economic analysis.
The reason is that there are more returns from MHP projects due to its impact on the education,
health and other economic and social activities through the multiplier effect.
20
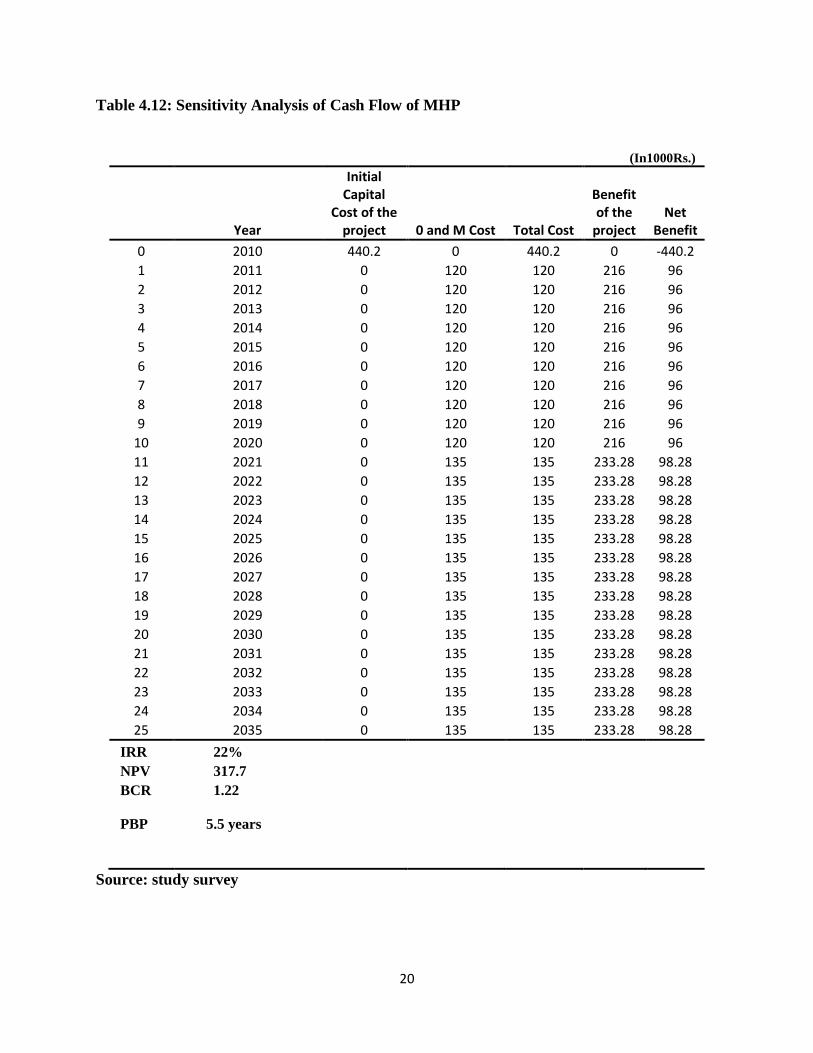
Table 4.12: Sensitivity Analysis of Cash Flow of MHP
(In1000Rs.)
Year
Initial Capital
Cost of the project 0 and M Cost Total Cost
Benefit of the
project Net
Benefit
0 2010 440.2 0 440.2 0 -440.2
1 2011 0 120 120 216 96
2 2012 0 120 120 216 96
3 2013 0 120 120 216 96
4 2014 0 120 120 216 96
5 2015 0 120 120 216 96
6 2016 0 120 120 216 96
7 2017 0 120 120 216 96
8 2018 0 120 120 216 96
9 2019 0 120 120 216 96
10 2020 0 120 120 216 96
11 2021 0 135 135 233.28 98.28
12 2022 0 135 135 233.28 98.28
13 2023 0 135 135 233.28 98.28
14 2024 0 135 135 233.28 98.28
15 2025 0 135 135 233.28 98.28
16 2026 0 135 135 233.28 98.28
17 2027 0 135 135 233.28 98.28
18 2028 0 135 135 233.28 98.28
19 2029 0 135 135 233.28 98.28
20 2030 0 135 135 233.28 98.28
21 2031 0 135 135 233.28 98.28
22 2032 0 135 135 233.28 98.28
23 2033 0 135 135 233.28 98.28
24 2034 0 135 135 233.28 98.28
25 2035 0 135 135 233.28 98.28
IRR 22%
NPV 317.7
BCR 1.22
PBP
5.5 years
Source: study survey
21
4.4 Sensitivity Analysis
Sensitivity analysis shows that how the project is sensitive to changes in the variables such as
initial capital cost, discount rate and delaying the benefits of the project for certain years. In the
present analysis, we change only the initial capital cost of the MHP project and keep all other
variables as constant. The capital cost is increased by 10%, 20% and 30%. It is estimated using
the same procedure and tools that are used in financial and economic analysis. The same 12 %
discount rate is used for the analysis. The results are given in the tables given below.
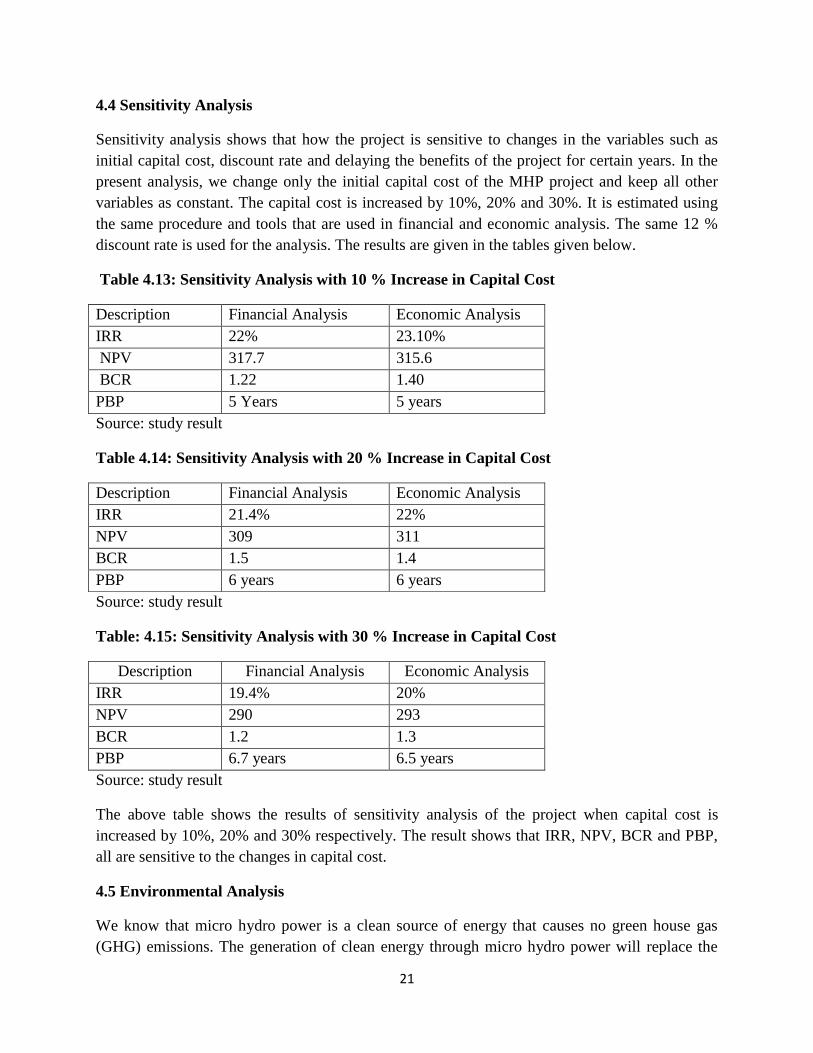
Table 4.13: Sensitivity Analysis with 10 % Increase in Capital Cost
Description Financial Analysis Economic Analysis
IRR 22% 23.10%
NPV 317.7 315.6
BCR 1.22 1.40
PBP 5 Years 5 years
Source: study result
Table 4.14: Sensitivity Analysis with 20 % Increase in Capital Cost
Source: study result
Table: 4.15: Sensitivity Analysis with 30 % Increase in Capital Cost
Description Financial Analysis Economic Analysis
IRR 19.4% 20%
NPV 290 293
BCR 1.2 1.3
PBP 6.7 years 6.5 years
Source: study result
The above table shows the results of sensitivity analysis of the project when capital cost is
increased by 10%, 20% and 30% respectively. The result shows that IRR, NPV, BCR and PBP,
all are sensitive to the changes in capital cost.
4.5 Environmental Analysis
We know that micro hydro power is a clean source of energy that causes no green house gas
(GHG) emissions. The generation of clean energy through micro hydro power will replace the
Description Financial Analysis Economic Analysis
IRR 21.4% 22%
NPV 309 311
BCR 1.5 1.4
PBP 6 years 6 years
22
use of diesel generators and kerosene oil in the project area and thus lead to a reduction in CO2
emissions.
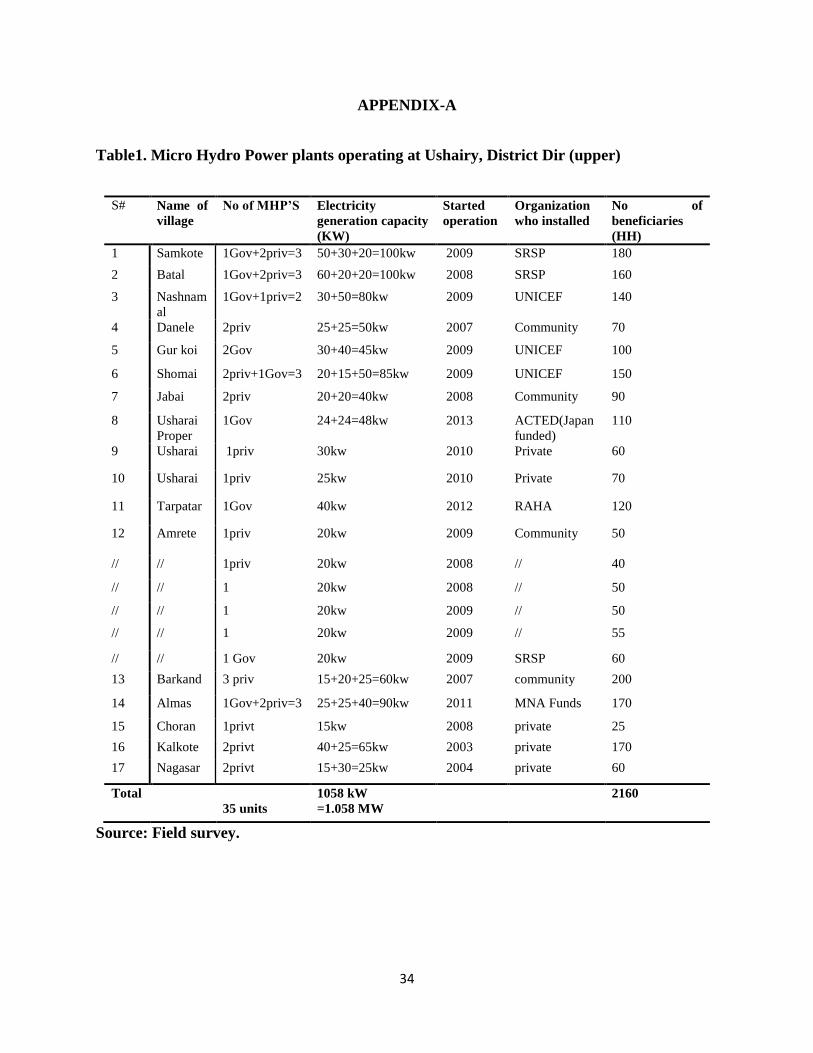
Our case study area is District Dir (upper), where these micro hydro power plants are operating
and generating electricity. Some of the plants are installed by government and some by the
community itself. The total number of MHP plants that were surveyed is 35. These MHP plants
have different installed capacities ranging from 10kw up to 100kw. Most of the private plants are
installed by simple methods without any proper specification. This results into low capacity and
thus low electricity generation. However, the government one is at least installed with proper
design and specification of electro mechanical equipments.
4.5.1 Description of the Small Scale Project Activity
Assuming the total MHP plants as a single Community- based Renewable Energy Project. The
project is a registered Small- scale CDM project activity. The project will provide the needed
power to the community. It will also substitute the use of diesels and kerosene oil, thereby
reducing the green house gas emissions. Majority of the households have no access to any source
of electricity in the area under consideration. However, there is a growing trend in the use of
diesel fuel for electricity generation by households and public institutions in the area.
The area has also the most precious and rare forest resources which are being used by the local
people in an unsustainable way for cooking and heating. If high powered mini and micro hydro
power projects are established, it will even reduce the consumption of fuel wood to a greater
extent. This will not only reduce the use of fuel wood but will also protect the local forests. The
area under study serves as an important catchment area for river Indus. The flow of water from
snow melt gives the area an immense potential to produce hydro electricity through micro and
mini off-grid power projects.
4.5.2 Emission Reductions
This part describes that how the anthropogenic GHG emissions by sources are reduced below
those that would have occurred in the absence of the project activity. As there is low access to
national electricity grid due to remoteness and the difficult topography, there is more probability
of using diesel generators by the local population. This practice will lead to more use of costly
fuels. This will not only lead to more expenditure on fossil fuels but also cause Green House Gas
(GHG) emissions. Moreover, due to increase in population and demand for energy, there are
high chances that there will be more diesel generators to be installed in the area. Therefore, the
existing MHP plants and expected new power plants will reduce the green house gas emissions
that would otherwise be produced from the use of diesel based generators.
The total installed capacity of the 35 MHP plants is 1058 KW which is equal to 1.058 MW.
From the household survey, we found that each MHP plant operates from 8- 12 hours. Therefore,
23
we take 10 hours as average operating time per day. This will give us electricity generation in
kWh per day.
Total cumulative installed capacity of MHP plants=1058 kW
Operating for 10 hours per day=1058kw*10 hours=10580 kWh/day
Per month: 10580kwh*30=317400 kWh
Per annum: 317400kwh*12=3808800kWh
Thus the total electricity generation from the plants will be 3808800 kWh per annum.
Multiplying by the emission factor of 1.38kg CO2eq/ kWh, we get total baseline emissions.
3808800kWh*1.38 kg CO2 eq/kWh=6970104 kg CO2/1000= 6970.104 tones CO2eq / annum.
4.5.3 Benefits of Micro hydro power technologies through CDM
Pakistan signed the United Nations Framework Conventions on Climate Change (UNFCCC) in
1992. Thus it qualifies to take benefits from market based flexible mechanism under the
convention for addressing the issue of climate change. One of the mechanism is called Clean
Development Mechanism (CDM) (Nizami & Bukhari, 2010).
Pakistan is a “Non- Annex 1”country. It ratified the UNFCCC in 1994 on voluntary basis. Kyoto
protocol of the UNFCCC is dealing with climate change mitigation. It is a milestone towards
global carbon mitigation efforts (Ahmad & Salman, 2012).
The protocol led to the establishment of carbon markets through Clean Development Mechanism
(CDM). Pakistan ratified the Kyoto Protocol in January 2005, and thus became eligible to benefit
from CDM. While the CDM is a great opportunity for Pakistan, the country has not yet optimally
utilized this mechanism to get financial benefits through selling Certified Emission Reductions
(CERs). This may be due to the lack of knowledge and capacity building of the concerned
ministry and investors in Pakistan. Therefore to get full benefits we have to initiate renewable
energy projects as micro hydro power. This will on the one hand provide the needed energy to
the rural population and on the other hand earn revenue through CDM by reducing green house
gas emissions. Taking the current price of one tone of CO2eq as $23 (Christensen, Duncan, &
Phillips, 2012), the given project if registered with CDM will earn $160312 per annum.
4.6 Result of the survey of MHP plants.
All the 35 Micro hydro power plants were taken as a sample for the study. This survey included
the cost of civil works and electro mechanical works of the power plant. This was covered in the
Financial and Economic analysis of the MHP project. The remaining part of the survey relate to
the main issues about the installation and maintenance of MHP plants.
24
4.6.1 Main Issues.
1. Unskilled Operators
Most of the operators have no prior experience of operating and maintaining the power plant.
Among 35 operators only five have a little experience in operating electro mechanical
equipments.
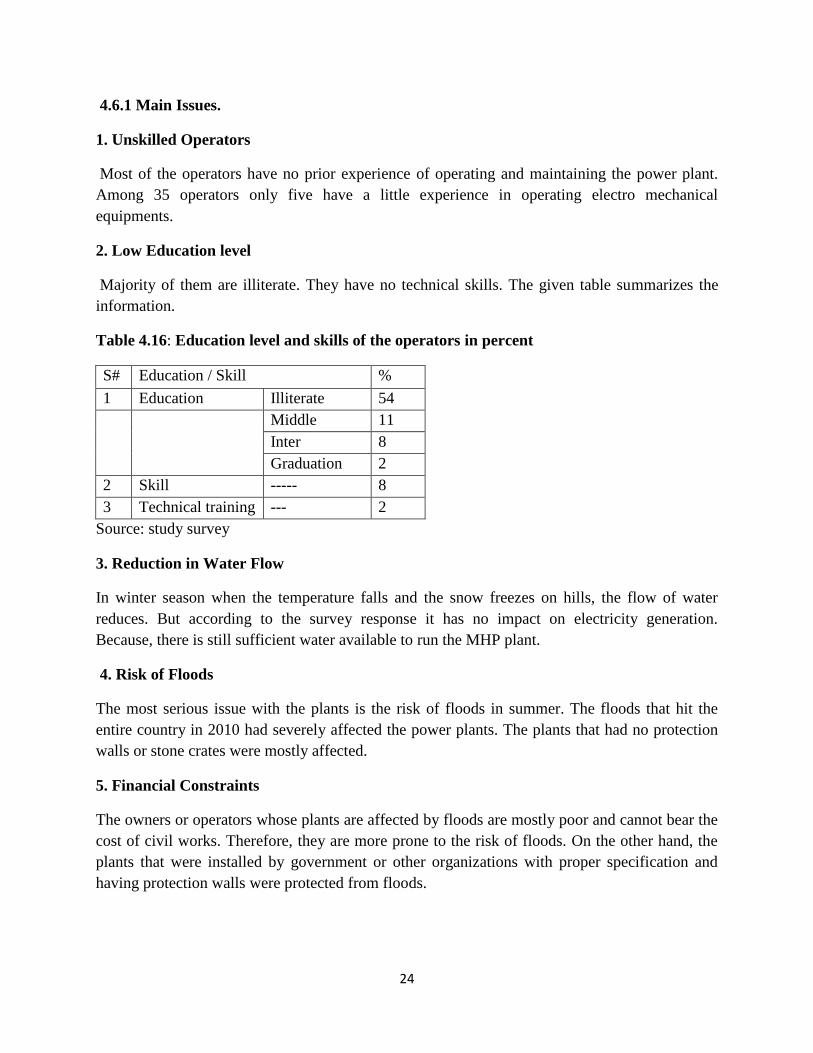
2. Low Education level
Majority of them are illiterate. They have no technical skills. The given table summarizes the
information.
Table 4.16: Education level and skills of the operators in percent
S# Education / Skill %
1 Education Illiterate 54
Middle 11
Inter 8
Graduation 2
2 Skill ----- 8
3 Technical training --- 2
Source: study survey
3. Reduction in Water Flow
In winter season when the temperature falls and the snow freezes on hills, the flow of water
reduces. But according to the survey response it has no impact on electricity generation.
Because, there is still sufficient water available to run the MHP plant.
4. Risk of Floods
The most serious issue with the plants is the risk of floods in summer. The floods that hit the
entire country in 2010 had severely affected the power plants. The plants that had no protection
walls or stone crates were mostly affected.
5. Financial Constraints
The owners or operators whose plants are affected by floods are mostly poor and cannot bear the
cost of civil works. Therefore, they are more prone to the risk of floods. On the other hand, the
plants that were installed by government or other organizations with proper specification and
having protection walls were protected from floods.
25
6. Institutional Arrangement
There is no institutional mechanism that addresses the issue of repairing or rehabilitation after
these disasters. The community members through their own efforts deal with these issues.
7. Risk of electric shocks
As the poles that supply electricity from the power plants are wooden, there is a greater risk of
felling those poles through cyclones and bad weather. This also poses a risk to the lives of the
people especially children. It has been reported that three to four children had been electrocuted
in the past according to the information shared by the community members.
8. Land Disputes and Site Selection
As most of the plants are often installed on the common property land along the river, therefore
there is no issue of land. Still, there are some cases in which the land adjacent to the plant
belongs to a community member and he is not willing to give its land for plant construction.
Consequently, this often leads to the cancelation of the project on the proposed site. Moreover,
the disagreement among communities over site selection for the project also jeopardizes the
efforts for provision of electricity to the communities.
9. Low Capacity of Power Plant
Another important issue is the low capacity of power plants to provide electricity to the
additional households although; there exist a potential demand for the Micro hydro power
electricity.
10. Scattered Houses
The houses that are connected to the power plants are scattered. This causes a high transmission
cost for the households, as the connection cost increases with the increase in distance from the
power plant.
4.7 Results of Informal survey
In this part of the analysis we informally obtain information from the people and key figures of
the area to confirm the results we obtained in the formal survey.
26
4.7.1 Review of Findings from Focused Group Discussions
Participants were asked to discuss the following statements.
The community based MHP units are more efficient than the Government one.
Community members/ Government organization should be the decision makers.
There should be strict rules and regulations for the operation and distribution of
electricity generated by Micro hydro power plant.
There is an apparent discrimination in the collection of bills by charging the same plate
rate.
Key Findings
All the participants agreed on the point that the project based MHP units or the
government one is more efficient than the private one. The private owners consider their
personal likes and dislikes and give connection to the households of their choice. The
project one has no such preferences and provides electricity without any discrimination.
Therefore, the project one is more preferable.
The community members after a long discussion concluded that the community members
should be the decision makers regarding bills collection, operation and maintenance of
the power plants.
It was demanded that the village committee should be empowered to tackle the issues of
maintenance, repairing, and overuse of power and collection of bills. For this purpose,
coordination between village committee and local district administration is necessary.
Regarding the issue of the same flat rate collected from the households irrespective of the
electricity units they consume, they said that they will look into it and decide to adjust the
rate in future. First, the project had promised to install meters to every household but later
on they could not provide it due to unknown reasons.
Regarding other issues associated with the project, a committee member said “the needed
spare parts related to electro mechanical components are not provided to us. It is necessary
because in case of any fault, it should be available with the operator and can repair the fault.
We have no capacity to arrange it for ourselves, we are poor” (committee chairman,
Usharai).
27
4.7.2 Key Informant Survey
4.7.2. A. Business man, village Usharai
A local business man was selected as the first key informant. He has a lot of information about
the people perceptions and other issues associated with the Micro hydro power projects.
Narrating the story of the project construction, he told that there was a dispute on the selection of
project site among the members of two villages. Later on, due to the availability of land, the
project was decided to be constructed in our village. In the dispute, about seven electric Poles
were forcibly taken by the other village members, who claimed that their village should also be
connected to the plant. He was asked to share his experience and the problems faced by the
community, he informed that:
“Due to the shortages of electric poles, we have installed some wooden poles to supply
electricity from the power plant to the houses. During rain and snow fall in winter, these poles
become wet and fell which causes disconnection of electricity supply to the houses. We have
extended the electric wires in trees which is dangerous. The government should provide us
these.”
4.7.2 B. Member Village Committee
A member of village committee was selected a key informant. He was also a member of project
committee during project construction. He was satisfied with the MHP project. But he made his
own community members to be responsible for the issues. He said that community members are
not cooperating with the committee. His views are given in his own words.
“We advise and even warn the consumers not to use water heaters and 100 watt bulbs but still
they are using it. The government has provided us this facility free of cost, now it is up to the
people to maintain it or not.”
He further said:
“The common people don’t care about the facilities provided by the government. We need to
change the people’s perceptions”.
These were the views expressed by the member of village committee who concluded that the
ownership of MHP plants must be determined to make it successful and sustainable.
4.7.2 C. Ex- Councilor UC Tarpatar
An Ex- councilor of UC Tarpatar, was also selected for interview as a key informant. He was
selected from the category of households that had no MHP connections. This was done so that
we can also examine and explore the reason that why they were not provided with MHP
electricity. He said that:
28
“We are in dire need of Micro hydro power project so that we can also get cheap and reliable
electricity. WAPDA electricity is just nominal and is available only for two or three hours. Bills
are more as compared to the availability of electricity. The meter reader just pays a visit to the
area and takes estimated readings without properly checking the meters. We are not connected
to MHP plant located in the village. Our houses are situated far away from the power plant and
cannot afford the cost of wire.”
4.7.2. D. School Teacher, village Almas
A local school teacher was also selected for the survey. As he has been involved in many surveys
that were conducted for government departments, therefore he had much information about the
households and the benefits and problems associated with the MHP power plants. About the
benefits of the MHP projects he said.
“Previously, we used kerosene oil, candles and generators for lighting and operating home
appliances. But now, we are using the electricity generated from Micro hydro power plant which
is cheap and last through the whole night. Earlier, about 5% of the people were using petroleum
generators but now its use is reduced. With nominal charges of Rs 250, we use light throughout
night while the WAPDA electricity last for only two or three hours. For these two or three hours
of electricity, we pay Rs 600 to Rs 700 per month.”
In response to the question that whether the people cooperate with the management and take care
of the projects, he said.
“Our people have low awareness level. When they use any thing that belongs to government,
they use it carelessly without feeling that it is their own. For the successful operation of the
plant, public awareness and honesty is must. The local political leaders etc are not sincere and
honest, they only think about their pockets. They deceive the government and even their own
people.”
The above results from informal survey shows, Micro hydro power technology brings a positive
change in the lives of common people. The greatest benefit the people get from it is home
lighting. Before these projects, people were using kerosene oil and generators in their homes.
Now they are using electricity of MHP plants. Despite these benefits, there are also some issues
that have an adverse impact on the sustainability of these plants. These are, for example lack of
interest from the community members to cooperate with the village committees and the use of
high load appliances that causes MHP plants to trap. If these issues are addressed before
launching any project, it will be successful and sustainable in the long run.
29
4.7.3 Expert opinion
4.7.3 A. Ex- Director, Alternate Technology Development Board (ATDB) was consulted to give
his opinion about the Micro hydro power projects. The findings were as follows.
When the people in rural areas install the MHP units by themselves, it means that they
are successful.
It is a simple technology without transformer. It is used for flour milling and rice
husking.
It requires no specific training.
Line losses in telephone wire are more than the copper wire for the transmission of
electricity to the houses.
4.7.3 B. Field Engineer (Civil) SRSP, Dist Dir (U)
Technical Feasibility
A number of technical parameters are considered before deciding on the proposed site. The head,
the flow of water and hydraulic pressure is estimated. The water that flows freely without a
platform has low density. The speed of water increases with the increase in length of penstock,
keeping the slope and friction constant. The total installed capacity of the site and household
spread is also taken into account. If the household spread is more, then a step-up transformer is
installed to increase the voltage in transmission lines.
5. Conclusion and Policy Recommendations
5.1 Conclusion
The present study has four main parts. The first part is based on descriptive analysis which
shows the socio economic information like the main source of income, area of agriculture land
and the main source of lighting etc. The results indicate that the main source of lighting for MHP
households is the electricity generated from the MHP plant. While for WAPDA users the main
source of lighting is kerosene oil, generators and mostly DC chargeable lamps. Moreover, the
MHP connected households are better up in terms of the monthly electricity bill and the
expenditure made on other sources of energy. Thus the MHP households get a saving due to low
expenditure on the use of energy items. This consumer surplus may be used for the consumption
of other household items resulting into their welfare improvement.
The second part estimate the comparative cost of MHP electricity and WAPDA electricity to the
consumers. The result shows that per unit cost of MHP electricity is less than the WAPDA
electricity. The unit capital cost of MHP is Rs. 13333/kW. While per unit energy price is Rs.
1.33. On the other hand per unit cost of WAPDA electricity is Rs. 12 while for consumers it is
Rs. 9 (for consumers using 100- 200 kWh). Based on this analysis, MHP electricity is far
cheaper than WAPDA electricity.
30
The third part deals with the Financial and Economic analysis of Micro hydro power project.
This part shows that whether the Micro hydro power is a profitable and viable investment and to
show whether the project is viable with respect to the whole economy and society. For this
purpose Cost Benefit Analysis is carried out. The analysis shows that it is both financially and
economically viable. The project can give more benefits to the society through multiplier effect
by increasing the income, improving health and education of the communities.
The fourth part deals with environmental analysis. As the micro hydro power is environment
friendly technology, causing no GHG emissions, therefore it is environmentally sustainable. The
analysis estimated the total emissions that will be reduced by the project. This reduction is
6970104 tones of CO2 eq / annum. This reduction in CO2 will earn Certified Emission
Reductions (CERs) through CDM which is also a benefit from the project. Setting the price of
one tone of CO2 as $23, the total value of the CERs will be $160312 per annum.5
The study also uses informal survey techniques. The analysis shows that there are also some
issues associated with the MHP plants and community members. These are dispute on the land
proposed for the project, the misuse of hydro power (the public good nature of the power plant),
and low capacity to meet the additional demand, scattered houses and the lack of awareness
among the community members. Moreover, the MHP projects are not given on merit basis but
political interference and personal influence determine the site for MHP projects. However for
successful and sustainable use of the plants, the cooperation of community members is vital. If
these problems are solved, the Micro hydro power will be a success story in the future to come.
5.2 Recommendations/ Policy implications
The results derived from the present study have important policy implications
The per unit price of MHP electricity is less than the price charged by WAPDA.
Therefore, the provision of electricity through MHP is a viable option for the
government.
The MHP projects are financially and economically feasible and give higher rate
of returns. Therefore there is an incentive for private investors to invest in this
sector.
There is lack of skilled operators and staff for successful operation of MHP
plants. To tackle the issue, the government should establish technical training
institutes to impart basic skills to the operators of the plants.
The government should design a proper institutional arrangement to tackle the
issues of floods, repairing and other social issues associated with Micro hydro
power.
5 The price of $23 for one tone of CO2 eq is taken from the report “Carbon Pricing Mechanism”, Association of
Victorian Regional Waste Management Group, Australian Government (Christensen et al., 2012).
31
As majority of the community based and private hydro power plants are installed
without its required specifications, therefore the government should provide
technical trainings to the operators for maintenance and repairing.
Local workshops should be established in order to provide repairing services at
local level.
To improve the efficiency and sustainability of the Micro hydro power plants,
awareness workshops should be arranged for the community members, so that they
can use the energy in a sustainable manner by avoiding misuse and losses.
32
REFERENCES
Ahmad, A., & Salman, A. (2012). Clean Development Mechanism (CDM) Business in Pakistan:
Perceptions and Realities. Pakistan Institute of Development Economics, Islamabad, Pakistan.
Akella, A., Saini, R., & Sharma, M. (2009). Social, economical and environmental impacts of renewable
energy systems. Renewable Energy, 34(2), 390-396.
Arthur, W., & Stephen, P. (2006). Comparison of hydropower options for developing countries with
regard to the environmental, social and economic aspect. Paper presented at the Proceedings
of the International Conference on Renewable Energy for Developing Countries-2006, UK.
Attif. (2013). Loadshedding Timings. WAPDA Grid Station Chukyatan Dir Upper.
Bailey, T., & Robert Bass. (2009). HYDROELECTRIC FEASIBILITY STUDY
AN ASSESSMENT OF THE FEASIBILITY OF GENERATING ELECTRIC POWER USING URBAN STORMWATER
IN OREGON CITY. Oregon city, US: Oregon Institute of Technology.
Barbieri, E. S., Spina, P. R., & Venturini, M. (2012). Analysis of innovative micro-CHP systems to meet
household energy demands. Applied Energy, 97, 723-733.
Bierman Jr, H., & Smidt, S. (2012). The capital budgeting decision: economic analysis of investment
projects: Routledge.
Chambers, R. (1994). The origins and practice of participatory rural appraisal. World development,
22(7), 953-969.
Christensen, S. A., Duncan, W. D., & Phillips, A. (2012). Regulation of emissions under the carbon
pricing mechanism: a case study of Australia’s coal fired electricity sector. Asia Pacific Journal
of Environmental Law, 15, 17-50.
Condrea, P., & Bostan, I. (2008). Environmental issues from an economic perspective. Environmental
Engineering and Management Journal, 7(6), 843-849.
Del Rio, P., & Burguillo, M. (2008). Assessing the impact of renewable energy deployment on local
sustainability: Towards a theoretical framework. Renewable and Sustainable Energy Reviews,
12(5), 1325-1344.
Diaz. R.M, Aristazabel, B. A., & Gonzalez, H. A. (nd). Micro Hydro Power Plants in Andean Bolivian
communities: impacts on development and environment.
Dictionary, I. O. l. (2014). Pay Back Period retrieved from www.investopedia.com.
Dolf, G. (2012). Renewable Energy: Cost Analysis Series. IRENA Working Paper, 1(3/5).
Edvard. (2011). Economic analysis of an MHPP. Electrical Engineering Portal.
Farooq, M. K., & Kumar, S. (2013). An assessment of renewable energy potential for electricity
generation in Pakistan. Renewable and Sustainable Energy Reviews, 20, 240-254.
Greenstone, M. (2014). Energy, Growth and Development. Oxford University, UK: International
Growth Centre.
Hussain A, Z. (2012). Fullfilling Environment Related International Committments Through
Implementation of Multilateral Environmental Agreements in Pakistan. A Scientific Journal of
COMSATS, 18.
IESCO. (2013). SCHEDULE OF ELECTRICITY TARIFFS FOR ISLAMABAD ELECTRIC SUPPLY COMPANY