Semi-Automated Analysis Software for a Novel Biochemistry Assay Joseph M Vesco, Frederick C Harris, Jr., Sergiu M. Dascalu Department of Computer Science and Engineering University of Nevada, Reno Reno, NV 89558, USA Del Jackson, Josh E Baker Department of Biochemistry Biomedical Engineering Program University of Nevada, Reno Reno, NV 89557 Abstract—Some of the work done in the Baker lab at the University of Nevada, Reno has been directed towards the analysis of muscle tissue in a single molecule arrangement. The process is a novel high- throughput single molecule binding assay, or SiMBA for short. This assay is performed by binding the myosin molecules of the muscle tissue to a coverslip and looking at how the fluorescently labeled actin filaments bind to these myosin as imaged with a fluorescence microscope. The conditions are varied and the effects on actin-myosin binding kinetics are observed. In order to analyze the binding times and unbound times a researcher must observe the interactions and manually collect the data. This particular method of data collection is tedious and time consuming thereby making this portion of the experiment the “rate limiting” factor for producing results in a timely manner. As this can take many hours to analyze a one minute long movie an automated or semi-automated solution would be beneficial to this assay. This paper presents the design and implementation of a semi-automated solution for identifying and tracking a variable number of objects that exhibit a multitude of behaviors, and extracting the specific behaviors of motion and stagnation as well as the duration of these behaviors. Keywords-actin; myosin; muscle; software; image analysis I. INTRODUCTION The Baker Lab at the University of Nevada, Reno, has developed a novel high- throughput single molecule binding assay (SiMBA) to measure the affinity of the muscle proteins actin and myosin under varying conditions. Since myosin behaves differently in an ensemble, this assay gives researchers a powerful tool for studying the kinetics at a single molecule level which may give insight into cooperative aspects of muscle dynamics. The data analysis for this assay involves manually observing and counting binding events and unbinding duration. Although the experiment is high-throughput, in that many different conditions can be quickly tested, the analysis is the rate-limiting step, as it involves many hours for a researcher to analyze a single movie. Development of an automated, or even semi- automated, analysis software program would dramatically improve the usefulness of this new experiment. The problem was that the only available method to analyze the movies produced was
Transcript
Semi-Automated Analysis Software for a Novel Biochemistry Assay
Joseph M Vesco, Frederick C Harris, Jr., Sergiu M. Dascalu
Department of Computer Science and EngineeringUniversity of Nevada, Reno
Reno, NV 89558, USA
Del Jackson, Josh E BakerDepartment of Biochemistry
Biomedical Engineering ProgramUniversity of Nevada, Reno
Reno, NV 89557
Abstract—Some of the work done in the Baker lab at the University of Nevada, Reno has been directed towards the analysis of muscle tissue in a single molecule arrangement. The process is a novel high-throughput single molecule binding assay, or SiMBA for short. This assay is performed by binding the myosin molecules of the muscle tissue to a coverslip and looking at how the fluorescently labeled actin filaments bind to these myosin as imaged with a fluorescence microscope. The conditions are varied and the effects on actin-myosin binding kinetics are observed. In order to analyze the binding times and unbound times a researcher must observe the interactions and manually collect the data. This particular method of data collection is tedious and time consuming thereby making this portion of the experiment the “rate limiting” factor for producing results in a timely manner. As this can take many hours to analyze a one minute long movie an automated or semi-automated solution would be beneficial to this assay. This paper presents the design and implementation of a semi-automated solution for identifying and tracking a variable number of objects that exhibit a multitude of behaviors, and extracting the specific behaviors of motion and stagnation as well as the duration of these behaviors.
The Baker Lab at the University of Nevada, Reno, has developed a novel high-throughput single molecule binding assay (SiMBA) to measure the affinity of the muscle proteins actin and myosin under varying conditions. Since myosin behaves differently in an ensemble, this assay gives researchers a powerful tool for studying the kinetics at a single molecule level which may give insight into cooperative aspects of muscle dynamics. The data analysis for this assay involves manually observing and counting binding events and unbinding duration. Although the experiment is high-throughput, in that many different conditions can be quickly tested, the analysis is the rate-limiting step, as it involves many hours for a researcher to analyze a single movie. Development of an automated, or even semi-automated,
analysis software program would dramatically improve the usefulness of this new experiment.
The problem was that the only available method to analyze the movies produced was to sit and watch each individual particle and plot the times they moved or did not move and record this as a new event every time this state changes. Fig. 1 shows a single frame from an assay. From this image we can see how this is a tedious analysis process and can be a large time constraint of the overall experiment.
Figure 1. Sample frame from an assay
The frame shon in Fig. 1 and the next frame in the assay show two different occurrences that increase the challenge of particle tracking. In Fig. 1 the lower circle (red) highlights two particles, and when we look at previous frames we can see that one is moving. In the next frame they are in the same position. To properly track this moving object, one must determine if the moving object is the same object as before when these two objects are later separated. If this is the same object then the duration of the objects state is extended, though if the previously stationary object now in motion a new
event would begin and the previous event would have ended. The object marked with the upper circle (green) that is visible in the movie frame shown in Fig. 1 is then no longer visible in the next frame. Although this particular object does come back in a future frame, we must ask ourselves how long an object can be missing before being considered to be a different object and again thereby creating a new event.
There have been non specific programs that the lab has pursued to no avail. As these programs were designed to tackle a multitude of problems, they for one lacked the simplicity needed to avoid a steep learning curve and did not give desirable output. In order to solve this issue of collecting data manually, the software needs to read the raw data, filter the images, process this data to determine all of the objects and events, and then create the needed statistics in a timely and accurate manner. Designing and developing software to assist this process could unlock a valuable assay for muscle protein research labs across the world. As data analysis is the only limiting step in the experiment, with a successful implementation of analysis software, this experiment would qualify as a true high-throughput technique.
The rest of this paper is structured as follows: Section II covers the scientific background, in Section III we present our proposal and software design, and in Section IV we present our results, which are followed by our conclusions and future work in Section V.
II. BACKGROUND
A. Problem Description: Biochemical AssayAn image representing the general muscle model in Fig. 2
shows one moment of how the components myosin and actin interact (arm and chain) [6]. These bind, have a power stroke which contracts the muscle, and then release so another binding can occur. It is these states of being bound and unbound that are sought in regards to the SiMBA assay in order to further understand the behaviors and interactions of myosin and actin all the way up to the overall behavior of a working muscle.
Visible actin fragments labeled with a fluorophore diffuse in solution with unlabeled (invisible) myosin proteins affixed to a slide surface. The singular myosin molecules are spaced approximately 1/25m2. This experiment is viewed through a microscope with a resolution of 54m x 54m (512 pixels x 512 pixels) and an exposure rate of 0.1 (10 frames per second) for 180 seconds. The raw data is collected from a Nikon microscope and Roper charge-coupled device (camera). Images, in the form of movies, are collected with Hamamatsus Simple PCI program [4].
The scrutiny a researcher must perform in the analysis stage of this experiment can last many hours. By developing an automated or semi-automated solution, this time of analysis can be greatly reduced. Certain issues are common that prevent this program from being a fully automated solution. For instance, at uncertain times during a movie, as an object moves from one location to the next, the size of an object from the cameras perspective may increase or decrease significantly. A range for the size is attributed to each object
for motion detection, but at times the size may exceed a reasonable range there by making the object ID associated with one particular object to be different than in previous frames. This may be due to at least two situations. One cause is that the camera's focus may shift causing a blurring if not a complete removal of all objects from the frames perspective. Second, the “flow cell slide" has a bit of space in the z-axis (perpendicular to the slide plane) between the main slide and a cover that actin can travel through. Although this space is limited, there is still enough room for the actin to move out of focus and cause an object focus shift.
If the first issue is present for more than 2 frames, all events are ended and new events start when the shift has ended. In the latter case, the same outcome as previously stated occur on an individual basis. This can lead to inaccuracies that can be avoided but are difficult to automate.
Figure 2. A general muscle model [6]
B. Desired Results The needed statistical results are time bound (ton) and time
unbound (toff). Since the myosin is not visible to the microscope, these binding events are observed by labeled actin particles. The labeling agent used is a fluorescent dye from Alexa [8].
In order to calculate these we need to perform some image processing. Typically in an image processing application there are certain fundamental functions that are needed. These may include but are not limited to erosion, blur, and threshold. Also the imported data is most likely in a movie format. It is sometimes necessary to convert these movies into individual frame images. These were done with OpenCV [3], but due to space limitations we will not go over these basic functions typically needed for image processing and motion detection.
III. SEMI-AUTOMATED ANALYSIS SOFTWARE FOR A NOVEL BIOCHEMISTRY ASSAY
A. Proposed Software ProcessWe are proposing a novel software package for motion
tracking and analysis of the movies produced by the SiMBA
experiment. The high level method this program uses can be summed up into six different stages of processing. The data is imported and converted to an image format that is readable by the program. These images are then processed and filtered. Next, the program processes each frame to locate and determine the size of all objects present. This information is then analyzed to determine the events throughout the movie. The fifth stage is the user interaction and control of the software to change any parameters to get the best possible output. The final step is not dealt with in this program but instead is an analysis by the program Origin [5] to determine the overall behavior of the objects in the movie by generating a histogram. A lower level view of this process will now be examined.
Import Data: The first goal is to convert the video data into images and import these images into our software package. This starts with moving the images from the Simple PCI format (CXD) to an AVI file format. Once the video is in an AVI format we can read it in with OpenCV.
Image Processing: The initial frame images are not ideal due to the aforementioned issues, namely irregular illumination and a low contrast between the background and the objects being analyzed. These frames are filtered in the following manner. The original image is an RGB image which means that the image has three layers of colors. This is not necessary and in fact makes it less efficient in later steps to have multiple color layers. By using a splitting function, the RGB image is converted to a grayscale image.
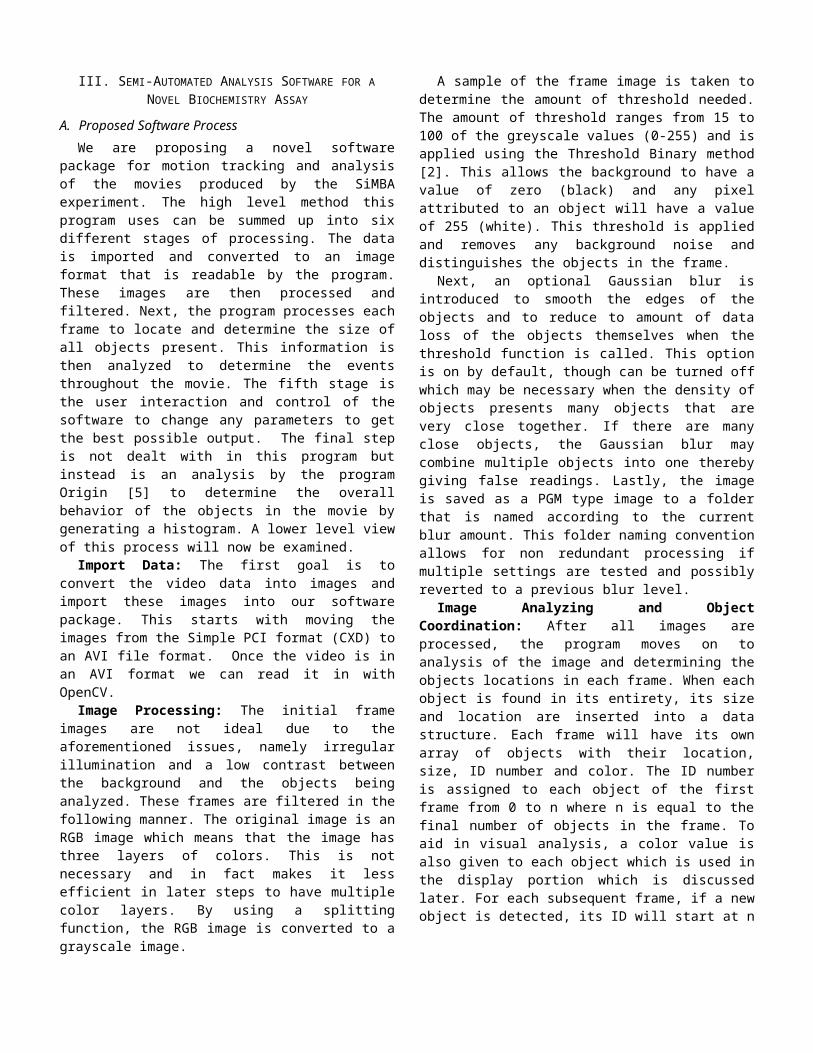
A sample of the frame image is taken to determine the amount of threshold needed. The amount of threshold ranges from 15 to 100 of the greyscale values (0-255) and is applied using the Threshold Binary method [2]. This allows the background to have a value of zero (black) and any pixel attributed to an object will have a value of 255 (white). This threshold is applied and removes any background noise and distinguishes the objects in the frame.
Next, an optional Gaussian blur is introduced to smooth the edges of the objects and to reduce to amount of data loss of the objects themselves when the threshold function is called. This option is on by default, though can be turned off which may be necessary when the density of objects presents many objects that are very close together. If there are many close objects, the Gaussian blur may combine multiple objects into one thereby giving false readings. Lastly, the image is saved as a PGM type image to a folder that is named according to the current blur amount. This folder naming convention allows for non redundant processing if multiple settings are tested and possibly reverted to a previous blur level.
Image Analyzing and Object Coordination: After all images are processed, the program moves on to analysis of the image and determining the objects locations in each frame. When each object is found in its entirety, its size and location are inserted into a data structure. Each frame will have its own array of objects with their location, size, ID number and color. The ID number is assigned to each object of the first frame from 0 to n where n is equal to the final number of objects in the frame. To aid in visual analysis, a color value is also given
to each object which is used in the display portion which is discussed later. For each subsequent frame, if a new object is detected, its ID will start at n to avoid multiple objects with the same ID.
Data Analyzing and Event Coordination: The purpose of this step of the process is to analyze the retrieved data and find for each object its time and duration of being bound and unbound and locate all binding sites. For each frame, every object is compared with the previous frame at the current objects location. If an object is present within a user defined radius, the ID and color of the current object is assigned to this new object. If the position of an object in the previous frame is within a smaller radius it is determined to be not moving. If it is outside of this radius is it determined to be in motion. Every object has in its data structure the number of frames it has been present and if it has been in motion or not based on this radius comparison.
User Interaction and Control: At this point the user can alter the various thresholds, turn blur on or off or just save the current state of the program and quit. The user interface was designed to gain the best possible analysis of each movie by allowing the user to adjust certain parameters to account for unforeseeable situations.
Final Output and Analysis: As stated previously, the desired information at this time is the time bound (ton) and time unbound (toff). Two files are output for each of these event types. In these files are recorded all occurrences and the duration of these occurrences. These numbers are then imported to the software Origin [5] to generate a histogram and for further analysis.
B. Software DesignFollowing standard software engineering guidelines, we
put together the main functional [10] and non-functional [9] requirements of SANoBA.
Functional Requirements: The most important functional requirements of SANoBA are:F1. The system will convert movie files to image files.F2. The system will process raw images.F3. The system will locate objects in the images.F4. The system will track objects over consecutive images.F5. The system will disregard objects outside of a set size
threshold.F6. The system will allow size threshold adjustments at run
time.F7. The system will allow motion threshold adjustments at run
time.F8. The system will allow adjustment for amount of time
object can be gone.F9. The system will allow blur adjustments at run time.31F10. The system will store unique sets of frames based on
threshold settings.F11. The system will allow the user to add objects.F12. The system will allow the user to remove objects.F13. The system will allow the user to rename objects.F14. The system will allow the user to navigate movie.F15. The system will allow the user to animate movie.
F16. The system will allow the user to control environment.F17. The system will output event data to a file.
Non-Functional Requirements: The most important non-functional requirements of SANoBA are:N1. The system will run any machine with Windows 7.N2. The system will be implemented using C++.N3. The system will use OpenCV.N4. The system will be easy to learn.N5. The system will allow keyboard input for functions.N6. The system will allow input by graphical interface.N7. The system will allow mouse input for selection and
navigation.N8. The system will process any length of movie allowed by
available drive space.The functionality of SANoBA has been defined using use
cases and scenarios. The functionality of SANoBA is captured in the use case diagram shown in Fig 3 at a high level of abstraction. This was done to help identify the mechanisms through which the user would interact with SANoBA. The use cases were also compared with the requirements using a Traceability Matrix (See Fig. 4).
Figure 3. Use cases for the data analyzing system
The class diagram for SANoBA is presented as according to the specifications in [1]. Fig. 5 lists all the classes in SANoBA as well as most of the major functions. Due to size constraints, certain trivial variables and functions have been omitted, as have OpenCV inherited functions.
C. User InterfaceThe idea behind the icon style of the UI is to make this software easy to use. The goal of this software is to have as little involvement on the user side as possible. With this in mind, the amount of customization is relatively limited as compared to competing applications. The entire application is run through the main user interface window with exception of a secondary window that will be discussed shortly. If this UI is resized, the window and mouse coordinates will operate normally. All of the available functions are shown as an image
that corresponds to its function. For example, the “Next frame” button is of an arrow and the function that shows or
Figure 4. Requirements traceability matrix
Figure 5. Class diagram for SANoBA
hides the names of each object is represented by an image of a name tag commonly seen at conventions. There are multiple methods to perform many of these available functions so as to not limit the user to any one method of control. These include the use of the keyboard and mouse navigation that does not involve the icons, both of which will be discussed later. The available functions and how they are used are discussed in detail in Section IV.
The Secondary UI is a window that will pop up when a particular object is to be renamed. This window allows the
user to navigate through the movie without losing their current position.
IV. RESULTS
A. Main User InterfaceThis section covers how someone may interact and utilize
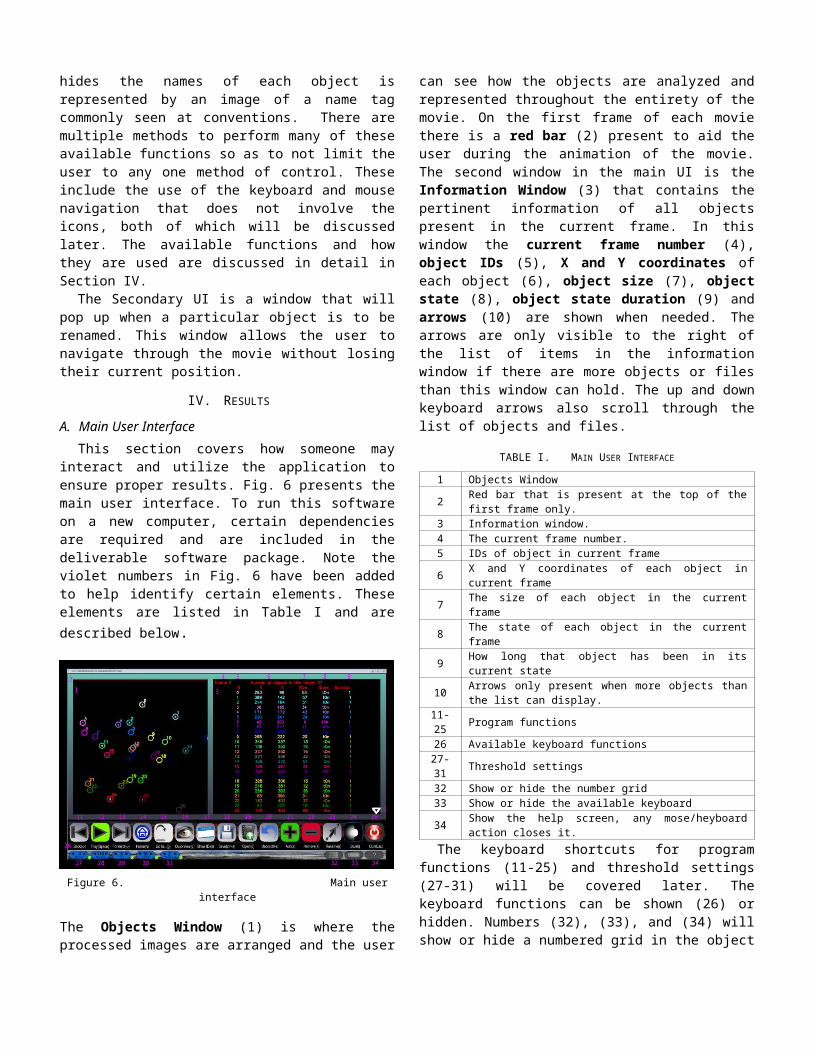
the application to ensure proper results. Fig. 6 presents the main user interface. To run this software on a new computer, certain dependencies are required and are included in the deliverable software package. Note the violet numbers in Fig. 6 have been added to help identify certain elements. These elements are listed in Table I and are described below.
Figure 6. Main user interface
The Objects Window (1) is where the processed images are arranged and the user can see how the objects are analyzed and represented throughout the entirety of the movie. On the first frame of each movie there is a red bar (2) present to aid the user during the animation of the movie. The second window in the main UI is the Information Window (3) that contains the pertinent information of all objects present in the current frame. In this window the current frame number (4), object IDs (5), X and Y coordinates of each object (6), object size (7), object state (8), object state duration (9) and arrows (10) are shown when needed. The arrows are only visible to the right of the list of items in the information window if there are more objects or files than this window can hold. The up and down keyboard arrows also scroll through the list of objects and files.
TABLE I. MAIN USER INTERFACE
1 Objects Window2 Red bar that is present at the top of the first frame only.3 Information window.4 The current frame number.5 IDs of object in current frame6 X and Y coordinates of each object in current frame7 The size of each object in the current frame8 The state of each object in the current frame9 How long that object has been in its current state10 Arrows only present when more objects than the list can display.
11-25 Program functions26 Available keyboard functions
27-31 Threshold settings
32 Show or hide the number grid33 Show or hide the available keyboard34 Show the help screen, any mose/heyboard action closes it.The keyboard shortcuts for program functions (11-25) and
threshold settings (27-31) will be covered later. The keyboard functions can be shown (26) or hidden. Numbers (32), (33), and (34) will show or hide a numbered grid in the object window (see Fig. 7). The grid helps the user to determine the distance an object may travel by adding a mesh with numbers and letters on the x and y axes. In the help screen, shown in Fig. 8, all of the functions and settings are shown with a brief description. Any mouse or keyboard action closes this screen while active.
Figure 7. Numbered Grid
Figure 8. Help Screen with all functions
Items (11-16) in Table II deal with navigating through the frame images of a processed movie. When the animation is not on, the user can go from the current frame to either the next or previous frame using (11) and (13), or jump to the beginning or a specific frame. The frames can be set to automatically progress by using (12) with the speed being controlled by (11) and (13) to decrease or increase the animation speed respectively. To quickly go to the first frame of the movie, press the “Home” icon (14). If the user needs to go to a specific frame, when “Go to...” (15) is active, the user can type
in the frame number and press enter to quickly go to that frame. “Go to...” is pretty straight-forward. The frame to jump to can be erased with the backspace and is only confirmed with the “enter” key. The QuickView button (16) is mainly to see the previous frame as the user views the movie frame by frame for easy reference. However it really allows the user to view the last seen frame. So if the current frame is 8 and the last frame viewed was 9, the QuickView function would show 9 not 7. This is only available for consecutive frames and does not hold if the user jumped frames.
TABLE II. PROGRAM FUNCTIONS
11 Go back one frame or slow down animation speed.12 Start or stop animation.13 Go forward one frame or speed up animation speed.14 Go to the first frame of movie.15 Go to a specific frame number.16 See the last frame viewed, not available if jumped frames.17 Show or hide ID numbers and or circles around objects.18 Save current state of program and return later if necessary.19 Open a new movie or a saved file.20 Undo.21 Add an object (will not work if object is smaller than threshold).
22 Remove object, if multiple objects selected user can choose which to remove.
23 Rename an object (activates secondary window).24 Turn blur/smoothing on or off.25 Quit program.
By default, the IDs of all objects are present as well as an encompassing circle. This can be changed so that the IDs are not present but the circles are or both can be removed entirely. The IDs can be hidden without any penalties on analysis. To see the objects clearly it is sometimes helpful to remove both of these. Objects can also be added, removed, or edited as needed. Fig. 9 shows an object being added (note the box selecting the object below object 18) and Fig. 10 shows removing two objects that are highlighted.
Figure 9. Adding an object
If the current state of the program needs to be saved, the save icon stores the current state of the program. All objects removed, added or renamed as well as the current frame and threshold settings will be as they are when a saved file is opened.
The blur level is set to 5 by default, as shown in Fig. 11. However, this setting may not be ideal for the current situation and the user may change this value to a higher or lower value.
Figure 10. Removing multiply selected objects.
When the confirm button next to the blur value is pressed all of the slides in the movie are reprocessed and displayed (See Fig. 12 for a blur value of 15). Also, the algorithm is redone for the new set of imported images giving different results. This is due to the fact that some objects may disappear if too much blur is used and some may even split into multiple objects if not enough is used. Each blur value has its own images stored for future reference so that they do not have to be reprocessed. The blur feature can also be turned off if necessary.
Figure 11. Default blur value of 5.
Figure 12. New blur value of 15.
There are a number of threshold settings as seen in Table III that are available for the user. The size thresholds (27) & (28) allow the user to remove any objects that are unwanted due to their size. Objects that are too small may be noise that was not removed in the initial process phase. Larger objects, at least in this experiment, are considered to be actin that has not been broken down enough and yield results that are not needed at this time. When the user adjusts the size threshold, the objects that are no longer labeled are still involved in the analysis until the confirm button is pressed and the vector is repopulated. These values can be set before opening a movie or after. The blur (29) can be adjusted to give better results based on the current movie situation. Though it must be noted that as the blur increases so does the size of all objects and the potential to lose smaller objects increases as well. Part of the algorithm to track a moving object is to determine if in a certain radius of motion (30) the object is still present. In other words, how far an object moves before considered to be moving. For faster moving objects, this radius needs to increase. The objects in this experiment are not fast relatively speaking. This radius can be adjusted for slower objects or even faster objects if deemed necessary. Also, due to the many factors such as camera focus shift, irregular illumination and image processing the objects may appear to be moving but are in fact immobile. The final threshold setting is to adjust how many frames an object is gone (31) before considered to be gone. This can help if there are multiple consecutive camera focus shifted frames or an object is gone for too long to be accurately labeled with a previous ID.
TABLE III. THRESHOLD PARAMETERS
27 Adjust the minimum object size.28 Adjust the maximum object size.29 Adjust the amount of blur.30 Adjust how far an object moves before considered to be moving.
31 Adjust how many frames an object is gone before considered to be gone.
Beyond the icons of the main UI the user can use the common IO devices to perform the available functions and navigation. For example, by clicking in the window above the icon area, one can navigate through the frames if so desired. All of the previously described functions are available to the
keyboard enthusiasts. The shortcuts are mostly single key strokes with notable exceptions (ctrl-s for save and ctrl-z for undo).
B. Secondary UIThe Secondary UI, shown in Fig. 13, behaves similarly to
the main UI though with a limited set of functions. In Table IV the functions are straight-forward in regards to the main UI functions except for (37). This icon shows the ID to be transferred to the selected object in the current frame of the main UI. This can be erased with the backspace and is only confirmed with the “enter” key. After the ID is keyed and enter is pressed, the secondary UI window will close returning the user to the main UI and the selected object is now renamed to the entered value as long as it is not a repeat of an ID in this current frame in the main UI.
Figure 13. Secondary UI Window.
TABLE IV. SECONDARY UI FUNCTIONS
36 Close secondary UI window.37 Entered value of new ID shown here.38 Show or hide the grid.39 Go back one frame.40 Go forward one frame.
V. CONCLUSIONS AND FUTURE WORK
A. ConclusionsA method of observing the behavior of muscle tissue in a
single molecule configuration has been developed at the Baker lab at the University of Nevada, Reno. The process is a novel high-throughput single molecule binding assay, or SiMBA for short. This assay is performed by placing the myosin molecule of the muscle tissue on a coverslip and looking at how the fluorescently labeled actin filaments bind to these myosin as imaged with a fluorescence microscope. The conditions are varied for each experiment and the response to these changes
of the actin-myosin binding kinetics are observed. In order to analyze the binding times and unbound times a researcher must observe the interactions and manually collect the data. The analysis of this experiment is very time consuming for the researcher. By automating the analysis, this method can be further improved to gain a better knowledge of muscle dynamics.
The work presented in this paper describes the design and implementation of a semi-automated solution for identifying and tracking a variable number of objects that exhibit a multitude of behaviors, and extracting the specific behaviors of motion and stagnation as well as the duration of these behaviors. The end result is to extract the time spent in motion and when bound as well as the duration of these behaviors. Still in its infancy, the software has many hurdles to overcome, yet the end results will be highly beneficial to this research.
This software converts and processes the raw data extracted from the SiMBA experiment. The user has the ability to manipulate the settings if necessary to achieve the best possible results. When the best results are found, the researcher may now take the output of this software and have analysis software determine the necessary histograms for behavior analysis. This last step is necessary for all the competing software as it is a specialized analysis that is beyond the scope of this part of the analysis.
B. Future WorkThere are many items that we have on our stack for future
work. These include modifying our program to use a version of OpenCV running on the GPU. The development of an open source version of OpenCV running on the graphics processor has been in the works recently. It is however not available at this time. In future updates taking advantage of parallelization on a GPU can only benefit the user and getting the results in an even more time sensitive manner. The main portion of the software that would utilize this parallelization would be the processing and analysis of the images as these are the time limiting factors of the current software. The projected time
reduction of a full movie would theoretically run at least 5-10 times faster [7]. Even though this is moving towards a better solution than previous methods, by efficiently using parallelization, the time of analysis could approach a speed that would allow for streaming video with a frame rate of 20-30 frames per second. Compared to manual analysis (12 hours) this is a huge advantage.
There are many other optimization features that are also desired. A full list of these can be found in Chapter 7 of [11].
REFERENCES
[1] J. Arlow and I. Neustadt. Unified Process: Practical Object-Oriented Analysis Design. Addison-Wesley, 2nd edition, 2005.
[2] S. Bouakaz. Image Processing and Analysis Reference. http://www710.univ-lyon1.fr/~bouakaz/OpenCV-0.9.5/docs/ref/ (Accessed November 8, 2012).
[3] G. Bradski and A. Kaehler. Learning OpenCV: Computer Vision with the OpenCV Library. O'Reilly Media, 1st edition, October 2008
[4] H. Corp. SimplePCI - Software for Image Acquisition and Analysis. http://hcimage.com/simplepci.htm (Accessed November 8, 2012).
[5] O. Corp. Origin - Data Analysis and Graphing Software. http://www.originlab.com/ (Accessed November 8, 2012).
[6] G. Johnson. Animated model for myosin-based motility. http://valelab.ucsf.edu/images/movies/ (Accessed November 2, 2011).
[7] Nvidia Corp. Nvidia adds gpu acceleration for opencv application development. http://pressroom.nvidia.com/ (Accessed November 8, 2012).
[8] N. Panchuk-Voloshina, R. Haugland, J. Bishop-Stewart, M. Bhalgat, P. Millard, F. Mao, W. Leung, and R. Haugland. Alexa dyes, a series of new fluorescent dyes that yield exceptionally bright, photostable conjugates. Journal of Histochemistry Cytochemistry, 47(9):1179{1188, 1999.
[9] R. S. Pressman. Software Engineering: A Practitioner's Approach. McGraw-Hill, 7th edition, 2010.
[10] I. Sommerville. Software Engineering. Addison-Wesley, 9th edition, 2010.
[11] J.M. Vesco. Semi-Automated Analysis Software for a Novel Biochemistry Assay. Master’s thesis, University of Nevada, Reno, Department of Computer Science and Engineering, December 2011. Advisor: Frederick C Harris, Jr.